DOI:
10.1039/D2RA08089C
(Paper)
RSC Adv., 2023,
13, 7569-7584
Construction and verification of vitrinite-rich and inertinite-rich Zhundong coal models at the aggregate level: new insights from the spatial arrangement and thermal behavior perspective
Received
19th December 2022
, Accepted 1st March 2023
First published on 8th March 2023
Abstract
To explore the thermal behavior of Zhundong coal from the perspective of maceral, it is essential to conduct molecular simulations based on constructing a realistic aggregate model of coal. Here, two Zhundong coal samples ZD-V (vitrinite-rich) and ZD-I (inertinite-rich) were collected, and coal models were constructed using elemental analysis, solid-state 13C-nuclear magnetic resonance (13C-NMR), X-ray photoelectron spectroscopy (XPS), and Fourier transform infrared spectrometry (FTIR). The chemical formulas of 2D vitrinite-rich coal and inertinite-rich coal constructed are C152H167NO36 and C155H119NO28, respectively. The chemical structure information matches well with that determined by those analysis results, including elemental analysis, structural composition, and 13C-NMR spectra. The final aggregate models show that the dimension of the unit cell is 2.785 × 2.785 × 2.785 nm for ZD-V and 2.743 × 2.743 × 2.743 nm for ZD-I, including six macromolecules respectively. The final aggregate structure models were verified by comparing experiments and simulation results. In addition to the verification with He density, the spatial arrangement of the aggregate model was verified by simulated XRD spectrum. And moreover, the thermal behavior was verified by ReaxFF MD, and the simulated trend of thermal weight loss and cumulative total molecules released were consistent with TG-MS. The final models show the visual difference between ZD-V and ZD-I, whether the 2D molecular structure or aggregation state. ZD-V is dominated by chain hydrocarbons, while ZD-I is dominated by cyclic hydrocarbons with linked aromatic rings. The aromatic substitution of oxygen atoms is different, ZD-V is mainly composed of ortho-disubstituted arenes, and ZD-I is mainly composed of meta-disubstituted arenes. In addition, ZD-V has a lower ultra-micropore size distribution and porosity than ZD-I. This study presents a comprehensive approach to construct and verify aggregate models from the spatial arrangement and thermal behavior perspective, and the constructed Zhundong coal models can provide a foundation for further exploration of the thermal reactivity (e.g. combustion, liquefaction, etc.) of coal from maceral aspects.
1. Introduction
Zhundong coalfield, located in Xinjiang province, is the largest integrated coal field in China. Zhundong coal has the advantages of low ash content, easy ignition, and strong combustion stability.1–5 Based on these high-quality characteristics of Zhundong coal, scholars have extensively studied the fields of pyrolysis, liquefaction, gasification, and combustion from different perspectives, aiming to explore the thermal reactivity of coal and its reaction mechanism.6–8 Meanwhile, maceral composition in the utilization of coal can play a vital role in these thermal reactivities, even affecting formulating coal–water slurry.9,10 With the continuous development of molecular simulation technology, it is urgent to construct a reasonable Zhundong coal structure model for further research.
It is generally believed that coal model building is fundamental and critical for further molecular simulation.11 In the past several decades, hundreds of coal structure models have been proposed, including the well-known models such as Given,12 Wender,13 Solomon,14 and Shinn.15 Besides, Takanohashi et al.16 constructed the Upper Freeport coal model by the extract from carbon disulfide/N-methyl-2-pyrrolidinone mixed solvent, and the energy minimum stable configuration was calculated using molecular simulation technology. By comparing the simulated and experimental 13C-NMR spectrum of different fractions, the Upper Freeport coal model was modified by Kawashima et al.17 for improving accuracy. Zhang et al.18 used elemental analysis, high-resolution transmission electron microscope (HRTEM), laser desorption time-of-flight mass spectrometry (LD-TOF MS), solid state 13C-nuclear magnetic resonance (13C-NMR), and X-ray photoelectron spectroscopy (XPS) techniques to obtain the molecular structural information of Chinese Xishan bituminous coal, and the first large scale Chinese bituminous coal model of diverse molecular weight and structure was constructed. Gao et al.19 proposed a strategy for constructing large and reasonable coal models manually with varied chemical structures, and constructed a multicomponent molecular model of Fugu subbituminous coal. Castro-marcano et al.20 generated a large-scale molecular model of Illinois No. 6 Argonne Premium coal based on an automated construction method (including the Fringe3D protocols and the Perl scripts developed in Materials Studio), aiming to capture the continuum structure. Recently, as a combined 3-parameters about lattice fringe curvature of coal based on HRTEM, it has been applied in constructing the 3D cubic model of Qingdao petroleum coke and Fenghuangshan anthracite coal.21,22 With the widespread application of computer-aided molecular design (CAMD) techniques in coal macromolecular structure studies, more and more coal structure models will be constructed in the future to adapt to the abundance of coal types. However, the accuracy and validation of coal structure model are still emerging.
The validation pathway of coal structure models has currently been extended from determining the chemical structure of coal to its spatial arrangement, such as bulk density, pore size distribution, pair distribution function (PDF),23 and radial distribution function (RDF).24,25 The spatial arrangement of coal molecules generally depends on the microcrystalline structure.26–28 However, in most cases, the verification of microcrystalline structure in coal is often ignored because the structural parameters obtained by HRTEM or XRD are hard to match well with the model. If the XRD spectrum can be calculated from the model and then linked well with the experimental spectrum, it will be more practical. On the other hand, with availability of powerful computers and parallel computing methods, the molecular dynamics combined with ReaxFF (ReaxFF MD) provides an opportunity to explore thermal reaction process, product distribution, reaction mechanism during coal pyrolysis, which can supplement experimental studies.29 ReaxFF is an empirical force field based on bond order and has the capability to simulate larger and more complex condensed systems without any pre-defined reaction pathways.30–32 At the same time, the thermal behavior of coal is closely related to the composition and spatial arrangement of the molecular structure, and it is a promising approach to validate the models by comparing the pyrolysis simulation via ReaxFF MD with real pyrolysis experiments.
For Zhundong coal, Hong and co-works33–37 have done a lot of work in thermal simulation research. Although many structure models of Zhundong coal have been constructed, the verification modeling rationality is still need for further study. Meanwhile, from the petrological point of view, coal is composed of three macerals: vitrinite, inertinite and liptinite. Vitrinite and inertinite are major components of coal, which are closely related to the thermal reaction behavior of coal. Therefore, it is necessary to construct structure models of Zhundong coal from the perspective of macerals, especially considering the high inertinite content of Zhundong coal with good liquefaction properties.2,38 However, most scholars ignored the maceral differences when constructing the macromolecular structure model of coal. So, in this study, two Zhundong coal structures with maceral enrichment (vitrinite and inertinite) were characterized using various testing methods. Secondly, according to the molecular structure information, the 2D and aggregate models of the two maceral-enriched coals were constructed respectively. Finally, the spatial arrangement and the thermal behavior of the final models were verified to ensure the accuracy of the models.
2. Materials and methods
2.1 Sampling
The two Zhundong coal samples, ZD-V and ZD-I (obtained from vitrain and durain, respectively), were collected in Wucaiwan, Xinjiang Province. The samples were ground in a mill, and 20, 80, 200 mesh of sample were obtained to prepare coal fine polished section after drying for petrographic analysis, as used for determination of maximum vitrinite reflectance, proximate analysis and ultimate analysis, as well as various chemical structure tests, respectively. The mean maximum vitrinite reflectance (Ro), proximate analyses, and ultimate analyses were conducted following Chinese national testing standards (GB/T 6948-2008, GB/T 212-2008 and GB/T 476-2001).
2.2 Characterizing chemical structures of coal samples
2.2.1 XRD experiment. The XRD experiment was performed with a Brucker D8 Advance X-ray diffractometer made in Germany using CuKα radiation. The start position (2θ) was 5°, and the end position (2θ) was 80°, with a scanning speed (ω) 4° per minute. The operating conditions of the X-ray tube are given as follows: U = 40 kV, I = 40 mA. Following the Bragg law and Scherrer formula, XRD structural parameters including inter-layer spacing (d002), the average lateral size (La), stacking height (Lc), and the number of aromatic layers (N) were calculated by the eqn (1)–(4).39–41| |
d002 = λ/(2![[thin space (1/6-em)]](https://www.rsc.org/images/entities/char_2009.gif) sin sin![[thin space (1/6-em)]](https://www.rsc.org/images/entities/char_2009.gif) θ002) θ002)
| (1) |
| |
Lc = 0.94λ/(β002![[thin space (1/6-em)]](https://www.rsc.org/images/entities/char_2009.gif) cos cos![[thin space (1/6-em)]](https://www.rsc.org/images/entities/char_2009.gif) θ002) θ002)
| (2) |
| |
La = 1.84λ/(β100![[thin space (1/6-em)]](https://www.rsc.org/images/entities/char_2009.gif) cos cos![[thin space (1/6-em)]](https://www.rsc.org/images/entities/char_2009.gif) θ100) θ100)
| (3) |
where θ(002) and θ(100) are the value of 002 and 100 peaks, respectively, λ is the wavelength for Cu radiation (1.5406 Å), and β(002) and β(100) are the angular widths at a half-height of 002 peak and 100 peak, respectively.
2.2.2 FTIR experiment. In this study, the Fourier Transform Infrared Spectroscopy instrument was performed by Nicolet IS10 made in America. During the sample preparation, we mixed potassium bromide (KBr) and coal samples together, and then put the mixed coal and KBr in the mold for pressurization. After that, the sample mixed was scanned 64 times in the wavenumber range of 4000–400 cm−1 with a spectral resolution of 4 cm−1. To obtain the position and number of peaks, Origin 2018 software was used to fit the peaks of the spectrum map, and all peak shapes, peak heights, and peak areas were obtained by fitting Gaussian peaks. The parameters Hal/H and fa are calculated by the following eqn (5)–(7):42| | |
Hal/H = Hal/(Hal + Har) = A3000–2800/(A3000–2800 + A900–700)
| (5) |
| | |
Cal/C = (Hal/H × H/C)/(Hal/Cal)
| (6) |
where Cal/C is the aliphatic carbon fraction, Hal/H is the fraction of total hydrogen present as aliphatic hydrogen, H/C is the ratio of hydrogen to carbon atoms calculated from elemental analysis, and Hal/Cal is valued as approximate 1.8 for coal.43,44The index I indicates the aromaticity and coal rank, and is calculated by eqn (8).45 It is usually used to reflect the relative abundance of aromatic and aliphatic functional groups.
| | |
I = A700–900/A2800–3000
| (8) |
where
A700–900 and
A2800–3000 are the integrated area of 700–900 and 2800–3000 cm
−1 respectively.
The degree of condensation (DOC)45,46 of aromatic rings can be determined as eqn (9).
The structural parameter of oxygen-containing functional groups, ‘C’, represents the changes in the ratio of C![[double bond, length as m-dash]](https://www.rsc.org/images/entities/char_e001.gif) O to C
O to C![[double bond, length as m-dash]](https://www.rsc.org/images/entities/char_e001.gif) C groups, is used to indicate the maturation of coal,47,48 which can be determined as eqn (10).
C groups, is used to indicate the maturation of coal,47,48 which can be determined as eqn (10).
| | |
‘C’ = A1650–1800/(A1650–1800 + A1600)
| (10) |
The length and the degree of branching of aliphatic side-chains are calculated using the ratio of A(CH2) to A(CH3).48 The higher value of A(CH2)/A(CH3) indicates longer aliphatic chains of aromatic rings, while the lower value corresponds to a relatively compact structures with less space between aromatic clusters.43,49 The A(CH2)/A(CH3) is estimated as:
| | |
A(CH2/CH3) = A2915–2940/A2950–2975
| (11) |
2.2.3 XPS experiment. The surface carbon functional bonds of the coal samples were determined by an X-ray photoelectron spectroscope (Thermo escalab 250XI, America), and the target source of the instrument was a monochromator Al (Kα) (hv = 1486.6 eV). The operating power, spot diameter, voltage, and current were 150 W, 650 μm, 14.8 kV, and 1.6 A, respectively. The wide scanning transmission was 100 eV, and the narrow scanning transmission was 20 eV. The charge calibration was conducted by using contaminated carbon C 1s = 284.8 eV. Then, the C 1s, O 1s, N 1s, and S 2p spectrum curves were fitted using XPSPEAK 4.1 software.
2.2.4 13C-NMR experiment. The solid-state 13C-nuclear magnetic resonance spectrum analysis was measured by JNM-ECZ600R (Electronics JEOL production, Japan), and the 13C core resonance frequency was 150.913 MHz. The tube diameter is 3.2 mm, and the magic-angle spinning (MAS) frequency is 12 kHz. The relaxation delay is 2 s, and the scanning times were 2000 times.
2.2.5 TG-MS experiment. The thermogravimetric experiments were performed using a combination of a thermo plus EV2/thermo mass photo from Japan. The coal pyrolysis gas was introduced into the mass spectrometer through a capillary tube; the ionization voltage of the mass spectrometer was 40 V. The sample was raised from room temperature to 1000 °C at a heating rate of 15 °C min−1. The experimental atmosphere was helium, with a flow rate of 300 mL min−1. Mass spectrometry was performed under high vacuum conditions, and gas products with a mass range (relative molecular mass) of 1–200 were detected.
2.2.6 Helium density test. The helium density test was conducted by the volumetric method. Based on employing the electronic balance, the mass of the coal samples were obtained. By testing the volume changes of void space before and after sample put in sample cell using helium gas, the volume of the coal samples were obtained. Then, the helium density of the coal samples were calculated.
2.3 Coal molecular structure model construction methods and verification
2.3.1 2D structure model construction. Firstly, the C skeleton information in coal can be obtained based on 13C-NMR, and the ratio of bridge carbon to peripheral carbon (XBP), a key parameter in 13C-NMR, is used to calculate the relative content of each type of aromatic carbon. It can be assumed that the number of bridge carbons (note that it can only be an even number, and is limited by the maximum number of carbon atoms), the number of peripheral carbons and the number of aromatic rings can be obtained by using the ratio of the number of bridge carbons to XBP. Therefore, the corresponding number of different carbon forms can be obtained by using 13C-NMR parameters. Meanwhile, combined with the atomic ratio of each heteroatom to C obtained by elemental analysis, the number of other heteroatoms such as O, N, and S can be roughly obtained. The occurrence forms and quantity of heteroatom were obtained from the fitting results of XPS analysis, and FTIR results could be used to further verify some functional groups semi-quantitatively. With the aid of ACD/GNMR software, the model was continuously adjusted until it matched the 13C-NMR spectrum. Then, the 2D structure was determined based on the information about the structural units obtained above. Finally, the 3D configuration was obtained through geometry optimization and molecular dynamics simulation using a Dreiding force field in the Forcite module of Materials Studio software.
2.3.2 Aggregate structure model construction. To avoid overlapping of aromatic rings, the initial low bulk density of 0.3 g cm−3 was set during the cell construction, and six optimized molecules were put into a periodic box by the Amorphous Cell module in Materials Studio software. Then, the optimization was carried out on the compressed box by the Forcite module, and the optimized box was then annealed in the same module. The simulation detail is that the smart algorithm method, Qeq charge equilibration method, Dreiding force filed, Ewald for the electrostatic and atom based for van der Waals with 12.5 Å cutoff distance were used in the geometric optimization, box-construction and annealing procedure, respectively.50,51 The optimized box with six optimized molecules were first annealed in NPT ensemble from 300 to 500 K with NHL thermostat. And then, the NVT annealing was performed on the annealed NPT structure with the lowest total potential energy, using NHL thermostat from 300 to 500 K in 300 ps.
2.3.3 Verification for 2D and aggregate structure model. The rationality of the model can be verified from two levels. The 2D model can be verified by element composition and molecular structure parameters. The aggregate model was verified from three aspects, including He density, the spatial arrangement and thermal behavior. The simulation details were as follows:As gases with different molecular sizes can probe different void spaces in the aggregate coal model, the simulation density is calculated using helium as the probe (radius = 0.13 nm). Atom Volume & Surface tools in Materials Studio software were used to calculate ultra-micropores in the aggregate structure model by using the probing method.52 The simulated density was calculated by eqn (12).25
| | |
Dhe = M × 1021/[(L3 − Vhe) × NA]
| (12) |
where
Dhe is the helium density, g cm
3;
M is the molecular weight of the aggregate molecule;
L is the side length of the lattice, nm;
Vhe can be calculated in the software by using helium as the probe; and
NA is the Avogadro constant, 6.02 × 10
23.
The XRD spectrum comparison between simulation and experiment was used to verify the spatial arrangement of coal molecular. The simulated XRD spectrum was calculated in the Reflex module in Materials Studio software, and the calculation of a simulated powder pattern was performed using the current powder diffraction parameters. The detail parameters were set as follows: the analogue function was selected as Pseudo-Voigt, and the temperature factor was atomic. X-ray diffraction with Cu Kα and λ = 1.54056 Å, 2θ = 10–80° were taken into account, and the polarizability value was 0.5, U = 30, V = 30, and W = 30 for FWHW.
The thermal simulation was performed using ReaxFF in ADF software, which is a reactive force field based on the bond order principle, and relates the bond energy to bond lengths, valence angles and torsion angle.53,54 The H/C/O/N/S/B force field parameters were taken into account in this study. A Berendsen thermostat with a damping constant of 0.1 ps was used to keep the temperature in equilibrium in this thermal simulation. This initial model system was further optimized through the energy minimization method. The model system was equilibrated at 300 K for 10 ps using the NVE ensemble with a time step of 0.25 fs. The system was relaxed at 300 K using the Velocity Verlet + algorithm to avoid any reaction. To study the mass loss and product distributions of the two Zhundong coal upon heating, a heat up simulation was performed on the model system from 300 to 3000 K at rates of 20 K ps−1. The simulation temperature of ReaxFF-MD is much higher than the temperature range of the pyrolysis experiment, which does not mean that the ReaxFF-MD pyrolysis simulation cannot react at the experimental temperature, but the simulation time is longer at low temperatures. Due to the limitation of computing power, the simulation process often needs to be completed in nanoseconds or even picoseconds, which is much lower than the reaction time scale of the experiment. Thus, it is worth mentioning that the higher temperature (300–3000 K) used in the ReaxFF simulation is higher than that employed in the laboratory experiment to allow the reactions to occur within picoseconds. According to the Arrhenius formula, increasing the reaction temperature can significantly increase the reaction rate. Therefore, ReaxFF-MD simulation often shortens the reaction time by increasing the reaction temperature.55,56 Despite time and temperature between the simulations and experiments are different, good qualitative agreement on product distribution and chemical reaction mechanism were obtained in the literature.57–59
3. Results and discussion
The petrographic analysis, mean maximum vitrinite reflectance (Ro), proximate analyses, and ultimate analyses of samples are shown in Table 1. ZD-V has a higher vitrinite content up to 95.8%, and the vitrinite/inertinite ratio is larger than that of ZD-I obviously. Proximate analysis shows that ZD-V has a higher volatile component content and ultimate analysis shows that the carbon content for ZD-V is lower than ZD-I, while the oxygen content is higher than ZD-I.
Table 1 The petrographic analysis, mean maximum vitrinite reflectance (Ro), proximate analysis, and ultimate analysis of samplesa
| Sample |
Petrographic analysis, vol/% |
V/I |
Proximate analysis, w/% |
Ro/% |
Ultimate analysis, wdaf/% |
| Vitrinite |
Inertinite |
Liptinite |
Mad |
Aad |
Vdaf |
FCd |
Cdaf |
Hdaf |
Odaf |
Ndaf |
St,d |
| Note: “—” is not detected. |
| ZD-V |
95.8 |
4.2 |
— |
22.67 |
15.14 |
2.93 |
48.57 |
51.30 |
0.37 |
72.92 |
4.27 |
21.57 |
0.61 |
0.63 |
| ZD-I |
18.3 |
81.7 |
— |
0.22 |
14.33 |
3.95 |
31.73 |
66.78 |
0.56 |
78.66 |
3.10 |
17.01 |
0.63 |
0.60 |
3.1 Crystalline structure parameters
The XRD spectrum of the two coal samples used in the experiment are shown in Fig. 1. Each coal sample exist high background intensity, which indicates that the coal sample contains a certain proportion of highly disordered material in the form of amorphous carbon. Two clear peaks, 002 and 100, are located at about 26° and 47°. Compared with ZD-V, ZD-I has a sharper 002 peak and a relatively obvious 100 peak. Origin 2018 was used to perform split-peak fitting of peaks from 5 to 35° and 35 to 50°. The corresponding structural parameters such as peak position, area, half-height and width can be obtained. Taking the peaks from 5 to 35° as an example, the fitting curve of ZD-V at 5–35° is shown in Fig. 1b and c, respectively, resulting in two Gaussian peaks: γ and 002. All structural parameters calculated by XRD are shown in Table 2. The microcrystalline structures of different enriched maceral of Zhundong coal are different. ZD-V has relatively larger aromatic layers, stacking degree, and smaller spacing between aromatic layers. According to the parameter La/Lc value, if the coal microcrystals are regarded as multiple completed BSU units, the lateral dimension of ZD-V develops more than the longitudinal height.
 |
| | Fig. 1 The XRD spectrum of two coal samples (a); Gaussian fitting curve of γ and 002 peak in 2θ range of 5–35° for ZD-V (b) and ZD-I (c). | |
Table 2 Structural parameters calculated by XRD experiment
| Sample |
d002/Å |
Lc/Å |
La/Å |
N |
La/Lc |
| ZD-V |
3.62 |
9.44 |
13.92 |
3.6 |
1.47 |
| ZD-I |
3.51 |
13.83 |
18.67 |
4.9 |
1.35 |
3.2 FTIR data
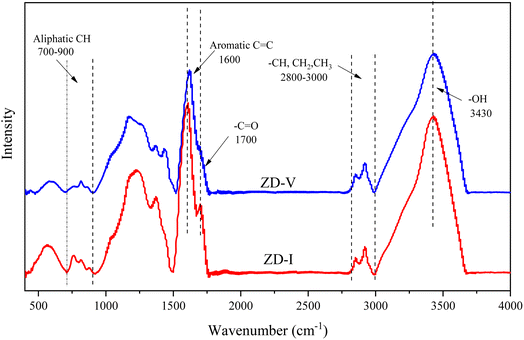
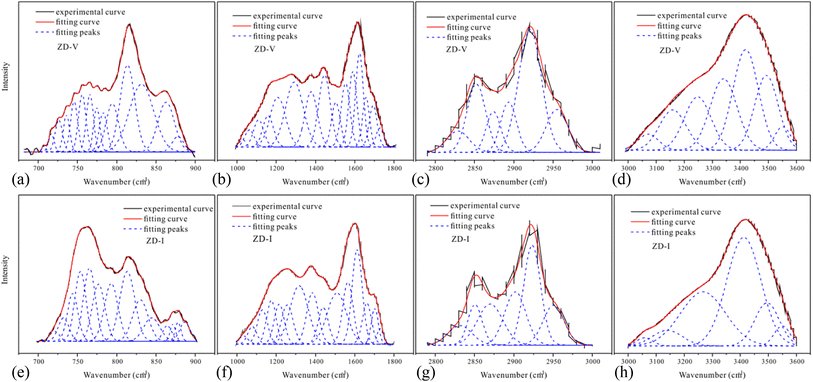
Fig. 2 shows the FTIR spectrum of Zhundong coal with baseline correction, and the obtained subtracted spectrum can be divided into 4 absorbance bands for analyzing the functional groups in coal, that is, aromatic structures (700–900 cm−1), oxygen-containing structures (1000–1800 cm−1), aliphatic structures (2800–3000 cm−1) and hydroxyl structures (3000–3600 cm−1).46,60 It can be clearly seen that despite the different coal maceral content, all the characteristic adsorption bands are similar, suggesting that vitrinite and inertinite have similar surface structures and functional groups.46 From the overall functional group assignment of the samples, the absorption peak (3000–3600 cm−1) is relatively obvious, indicating that Zhundong coal contains more –OH functional groups. There is a sharp main peak near 1600 cm−1, which is attributed to the aromatic nucleus (C![[double bond, length as m-dash]](https://www.rsc.org/images/entities/char_e001.gif) C), and the intensity of the C
C), and the intensity of the C![[double bond, length as m-dash]](https://www.rsc.org/images/entities/char_e001.gif) O vibration peak at 1700 cm−1 is weaker. Compared with ZD-V, ZD-I has a relatively obvious absorption peak at 1700 cm−1, indicating that inertinite has relatively more C
O vibration peak at 1700 cm−1 is weaker. Compared with ZD-V, ZD-I has a relatively obvious absorption peak at 1700 cm−1, indicating that inertinite has relatively more C![[double bond, length as m-dash]](https://www.rsc.org/images/entities/char_e001.gif) O functional groups. According to the detail information for absorption peak assignments in FTIR spectrum from the reference,40 the 4 absorbance bands were fitted with Gaussian curves respectively (Fig. 3) to quantify the functional groups of Zhundong coals with different maceral. The corresponding structural parameters (fa, I, DOC, A(CH2)/A(CH3) and ‘C’) are calculated from the fitted peaks with eqn (5)–(11) and the results are shown in Table 3. Compared with ZD-V, the aromaticity, I, DOC and ‘C’ of ZD-I are higher, but the degree of branching of aliphatic side-chains is lower. For the linkage between aromatic carbons, the aliphatic carbon in vitrinite rich coal will be considered to add more aliphatic side chains, while the aliphatic ring is the main one in inertinite rich coal. These results are helpful for the preliminary construction of structural model of Zhundong coal.
O functional groups. According to the detail information for absorption peak assignments in FTIR spectrum from the reference,40 the 4 absorbance bands were fitted with Gaussian curves respectively (Fig. 3) to quantify the functional groups of Zhundong coals with different maceral. The corresponding structural parameters (fa, I, DOC, A(CH2)/A(CH3) and ‘C’) are calculated from the fitted peaks with eqn (5)–(11) and the results are shown in Table 3. Compared with ZD-V, the aromaticity, I, DOC and ‘C’ of ZD-I are higher, but the degree of branching of aliphatic side-chains is lower. For the linkage between aromatic carbons, the aliphatic carbon in vitrinite rich coal will be considered to add more aliphatic side chains, while the aliphatic ring is the main one in inertinite rich coal. These results are helpful for the preliminary construction of structural model of Zhundong coal.
 |
| | Fig. 2 FTIR spectrum of Zhundong coal samples. | |
 |
| | Fig. 3 700–900 cm−1 spectra (a), 1000–1800 cm−1 spectra (b), 2800–3000 cm−1 spectra (c), 3000–3600 cm−1 spectra (d) of ZD-V; 700–900 cm−1 spectra (e), 1000–1800 cm−1 spectra (f), 2800–3000 cm−1 spectra (g), 3000–3600 cm−1 spectra (h) of ZD-I. | |
Table 3 FTIR parameters of ZD-V and ZD-I
| Sample |
fa |
I |
DOC |
A(CH2)/A(CH3) |
‘C’ |
| ZD-V |
0.72 |
0.382 |
0.082 |
3.041 |
0.378 |
| ZD-I |
0.85 |
0.786 |
0.131 |
2.011 |
0.425 |
3.3 XPS data
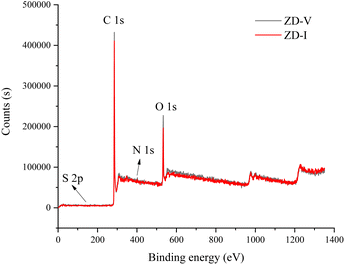
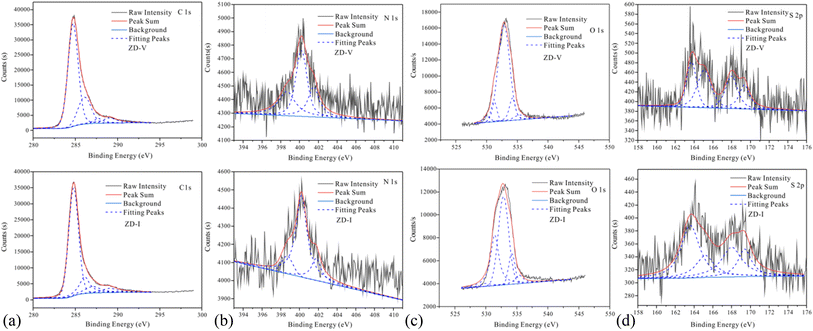
The information on different chemical functional groups of the coal particles can be obtained by XPS experiment.61,62 According to the XPS wide-scan spectra data (Fig. 4), the surface of the Zhundong coal particles is mainly composed of carbon and oxygen atoms, followed by little nitrogen and sulfur. These results are consistent with the data from elemental analysis (Table 1). Fig. 5 show the XPS C 1s, O 1s, N 1s, and S 2p scans of the two Zhundong coals. To quantify the contents of different types of functional groups, peak-fitting was performed on these XPS narrow scans. Here, Table 3 shows the peak-fitting results of C 1s, O 1s, N 1s, and S 2p scan spectrum of the two coal samples. For the results of C 1s, it can be seen that the form of three types of bonding C–C, C![[double bond, length as m-dash]](https://www.rsc.org/images/entities/char_e001.gif) C, and C–H occupy most of the total carbon atoms, and its content close to 70% for the two Zhundong coals. Thus, carbon atoms mainly exist in the chemical groups of aromatic rings and aliphatic chains. Apart from this, nearly 30% of total carbon atoms are bonded to oxygen atoms, where the bonding form of carbon and oxygen atoms is different. For the two Zhundong coals, the content of C–O is slightly more than that of C
C, and C–H occupy most of the total carbon atoms, and its content close to 70% for the two Zhundong coals. Thus, carbon atoms mainly exist in the chemical groups of aromatic rings and aliphatic chains. Apart from this, nearly 30% of total carbon atoms are bonded to oxygen atoms, where the bonding form of carbon and oxygen atoms is different. For the two Zhundong coals, the content of C–O is slightly more than that of C![[double bond, length as m-dash]](https://www.rsc.org/images/entities/char_e001.gif) O, which can be suggested that the functional groups of alcohol hydroxyl, phenolic hydroxyl, or ether/both more abundant than those of carbonyl and carboxyl functional group. Compared with the ZD-V coal, the content of the carbonyl functional group (C
O, which can be suggested that the functional groups of alcohol hydroxyl, phenolic hydroxyl, or ether/both more abundant than those of carbonyl and carboxyl functional group. Compared with the ZD-V coal, the content of the carbonyl functional group (C![[double bond, length as m-dash]](https://www.rsc.org/images/entities/char_e001.gif) O) in ZD-I is richer, and the content of C–O in ZD-I coal is less correspondingly. From Fig. 5 and Table 4, it can be found that nitrogen atoms in the Zhundong coals are mainly in the formation of pyrrolic nitrogen, followed by pyridinic and quaternary nitrogen. The content of pyrrolic nitrogen for ZD-V and ZD-I coal occupied 46% and 73% of the total nitrogen respectively, suggesting that pyrrole is the most abundant nitrogen of all types, which is considered to be added to the subsequent models. Although the content of sulfur atoms in the Zhundong coal is very low, it can be still detected in the existence of the following four formations: thiophenes sulfur, sulphoxides sulfur, sulphones sulfur, and sulphates sulfur, and thiophenes sulfur is the main form existed in the two coals. Considering the proportional assignment of the overall elements, sulfur atoms will not be added to the model.
O) in ZD-I is richer, and the content of C–O in ZD-I coal is less correspondingly. From Fig. 5 and Table 4, it can be found that nitrogen atoms in the Zhundong coals are mainly in the formation of pyrrolic nitrogen, followed by pyridinic and quaternary nitrogen. The content of pyrrolic nitrogen for ZD-V and ZD-I coal occupied 46% and 73% of the total nitrogen respectively, suggesting that pyrrole is the most abundant nitrogen of all types, which is considered to be added to the subsequent models. Although the content of sulfur atoms in the Zhundong coal is very low, it can be still detected in the existence of the following four formations: thiophenes sulfur, sulphoxides sulfur, sulphones sulfur, and sulphates sulfur, and thiophenes sulfur is the main form existed in the two coals. Considering the proportional assignment of the overall elements, sulfur atoms will not be added to the model.
 |
| | Fig. 4 XPS wide-scan spectra of the two Zhundong coals. | |
 |
| | Fig. 5 XPS C 1s, O 1s, N 1s and S 2p scan of the two Zhundong coals. | |
Table 4 Peak-fitting results of C 1s, O 1s, N 1s, and S 2p scan spectrum of the two Zhundong coals
| Elements |
ZD-V |
ZD-I |
Functionalities |
| Peak |
Position (eV) |
Area |
FWHM (eV) |
Percentage (%) |
Position (eV) |
Area |
FWHM (eV) |
Percentage (%) |
| C 1s |
1 |
284.74 |
54![[thin space (1/6-em)]](https://www.rsc.org/images/entities/char_2009.gif) 997.21 997.21 |
1.42 |
68.40 |
284.80 |
51![[thin space (1/6-em)]](https://www.rsc.org/images/entities/char_2009.gif) 090.71 090.71 |
1.37 |
69.15 |
C–C; C![[double bond, length as m-dash]](https://www.rsc.org/images/entities/char_e001.gif) C; C–H C; C–H |
| 2 |
286.10 |
17![[thin space (1/6-em)]](https://www.rsc.org/images/entities/char_2009.gif) 091.96 091.96 |
1.79 |
21.26 |
286.10 |
11![[thin space (1/6-em)]](https://www.rsc.org/images/entities/char_2009.gif) 549.88 549.88 |
1.40 |
15.63 |
C–O |
| 3 |
287.74 |
3000.00 |
1.20 |
3.73 |
287.06 |
6949.08 |
2.15 |
9.40 |
C![[double bond, length as m-dash]](https://www.rsc.org/images/entities/char_e001.gif) O O |
| 4 |
289.10 |
5320.91 |
2.00 |
6.62 |
289.10 |
4297.59 |
2.00 |
5.82 |
O![[double bond, length as m-dash]](https://www.rsc.org/images/entities/char_e001.gif) C–O C–O |
| O 1s |
1 |
530.00 |
1565.00 |
1.23 |
4.00 |
530.00 |
789.00 |
2 |
2.43 |
Inorganic oxygen |
| 2 |
531.20 |
3037.24 |
1.121 |
7.76 |
531.44 |
10![[thin space (1/6-em)]](https://www.rsc.org/images/entities/char_2009.gif) 421.08 421.08 |
1.56 |
32.11 |
O![[double bond, length as m-dash]](https://www.rsc.org/images/entities/char_e001.gif) C C |
| 3 |
532.82 |
28![[thin space (1/6-em)]](https://www.rsc.org/images/entities/char_2009.gif) 376.46 376.46 |
2.21 |
72.52 |
532.85 |
16![[thin space (1/6-em)]](https://www.rsc.org/images/entities/char_2009.gif) 080.44 080.44 |
1.97 |
49.54 |
–OH |
| 4 |
534.20 |
4249.64 |
1.12 |
10.86 |
534.20 |
3408.15 |
1.2 |
10.50 |
–COO |
| 5 |
535.40 |
1899.00 |
2.23 |
4.85 |
535.40 |
1759.41 |
1.5 |
5.42 |
Adsorbed oxygen |
| N 1s |
1 |
398.65 |
589.29 |
2.10 |
29.81 |
398.70 |
146.28 |
1.40 |
10.68 |
Pyridinic nitrogen |
| 2 |
400.20 |
899.48 |
1.42 |
45.51 |
400.20 |
993.44 |
1.40 |
72.56 |
Pyrrolic nitrogen |
| 3 |
401.50 |
487.73 |
1.40 |
24.68 |
401.78 |
229.41 |
1.20 |
16.76 |
Quaternary nitrogen |
| S 2p |
1 |
163.72 |
136.98 |
1.25 |
25.02 |
163.60 |
279.12 |
2.34 |
39.34 |
Thiophenes |
| 2 |
165.08 |
173.50 |
1.73 |
31.69 |
165.20 |
126.22 |
2.36 |
17.79 |
Sulphoxides |
| 3 |
168.00 |
137.87 |
1.56 |
25.18 |
168.01 |
189.68 |
2.63 |
26.73 |
Sulphones |
| 4 |
169.38 |
99.18 |
1.31 |
18.11 |
169.40 |
114.56 |
1.70 |
16.14 |
Sulphates |
3.4 13C-NMR data
The solid-state 13C-NMR has been proved as the most effective technique for 2D coal molecular model construction, which can get detail information about the chemical structure of coal. Referring to previous studies for the detail information of chemical shift assignments in 13C-NMR spectrums,63–66 the assignments of different carbon types can be obtained. Fig. 6 shows the solid-state 13C-NMR spectrum and its fitting curves of ZD-V and ZD-I. It was observed that there are three main chemical regions: aliphatic carbons (0–90 ppm), aromatic carbons (90–170 ppm), and carbonyl carbons (170–220 ppm). For the two coals, the aromatic carbons are the largest proportion of the total organic carbons, followed by aliphatic carbons and carbonyl carbons. The content distribution of the carbon types of the two coals is significantly different, and the aliphatic carbon of ZD-V is significantly higher than that of ZD-I. For the aromatic carbons (90–170 ppm) region, it is worth noting that in addition to the large peak at 127 ppm (indicating protonated aromatic carbons), ZD-V also contains peaks around 143 ppm and 154 ppm, both of which represent the substitution of oxygen atoms for H in the aromatic carbon. However, the substitution forms are different. The former is ortho-disubstituted arenes and the latter is meta-disubstituted arenes. The oxygen atoms for ZD-I is mainly composed of meta-disubstituted arenes. To further quantify the different carbon types of the two samples, Origin 2018 software was used for peak-fitting, and 12 structural parameters can be calculated based on the integral peak area (Table 5). Compared with ZD-V, ZD-I has a relatively large amount of aromatic rings (64.7%) and carbonyl content (10.56%), which is consistent with the result obtained by XPS. Accordingly, ZD-I has a low content of aliphatic carbons (24.75%), especially CH3 content (10.1%). Additionally, a key parameter, XBP, can be calculated. It presents the ratio of aromatic bridge carbon to aromatic pericarbon (XBP = fBa/(fHa + fPa + fSa)), which was usually used to calculate the size of the aromatic clusters. According to the calculation results of the parameter XBP, the XBP value of ZD-I (0.182) is larger than ZD-V (0.142). It can be suggested that inertinite has more polycondensed aromatic rings than vitrinite, and the result is consistent with XRD analysis. These structural parameters in Table 5 can provide basic information for the construction of the coal macromolecular model.
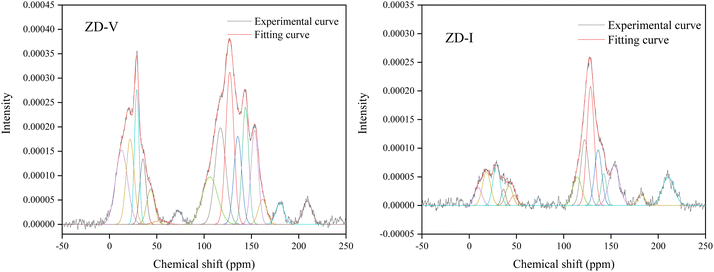 |
| | Fig. 6 Solid-state 13C-NMR spectrum and its fitting curves of ZD-V and ZD-I. | |
Table 5 Structural parameters of the two Zhundong coalsa
3.5 Construction and correction of the two coal molecular structure model
The construction of the coal molecular structure model is based on XPS, FTIR and 13C-NMR data. Among these, the formation of aromatic clusters is mainly based on the 13C-NMR data. The value of XBP for the two coal is very low, and its value is between the benzene (XBP = 0) and naphthalene (XBP = 0.25). Thus, it was considered that the aromatic clusters of Zhundong coal are mainly composed of benzene and naphthalene. Meanwhile, given that ACD Predictor can only calculate up to 255 carbon atoms, the number of different types of aromatic unit structures will be continuously adjusted under full alignment to make the XBP close to 0.182 and 0.142 for ZD-V and ZD-I, respectively. Combining results from XPS data and elemental analysis, the information of N atom type in the coal molecule is estimated, and the S atom did not put in the model because of the negligible amount. Finally, the determining types and quantities of aromatic unit structures are shown in Table 6.
Table 6 Types and quantities of aromatic unit structures of the two Zhundong coals
| Types |

|

|

|

|
| ZD-V |
5 |
4 |
1 |
1 |
| ZD-I |
4 |
6 |
1 |
1 |
The next step is to analyze the type and content of aliphatic carbon based on the 13C-NMR and FTIR data for better matching the aromatic rings in the model. The type and number of oxygen-containing functional groups in coal can be obtained by XPS data and 13C-NMR. After that, the crosslinking forms of these species is the key to establish the 2D coal model. In the initial model of ZD-V, more aliphatic long chains will be assigned considering a higher A(CH2)/A(CH3) value of ZD-V, whereas ZD-I is dominated by aliphatic rings. The experimental spectrum of 13C-NMR can be utilized to verify the connection of different species whether it is reasonable. Therefore, we need to continuously adjust the initial model by calculating the chemical shifts of the model to match the 13C-NMR data obtained from the experiment. Finally, the 2D chemical structure of the two Zhundong coal models enriched with different maceral was established as shown in Fig. 7. The green markers show visual differences in aromatic substitution, as reflected by 13C-NMR, and the red dashed line shows that ZD-V is dominated by chain hydrocarbons, while ZD-I is dominated by cyclic hydrocarbons with linked aromatic rings. The molecular formula of the constructed coal structure is C152H167NO36 for ZD-V and C155H119NO28 for ZD-I. The corresponding total molecular weight is 2584 and 2444 respectively. From Fig. 8, it can be seen that the calculated spectrum and experimental spectrum were in good agreement whether the regions of aromatic clusters or aliphatic structures.
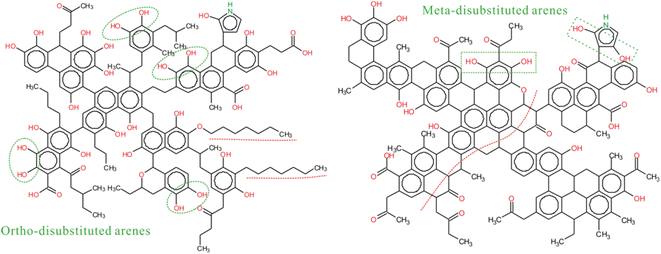 |
| | Fig. 7 The 2D chemical structure model of ZD-V (C152H167NO36) and ZD-I (C155H119NO28). | |
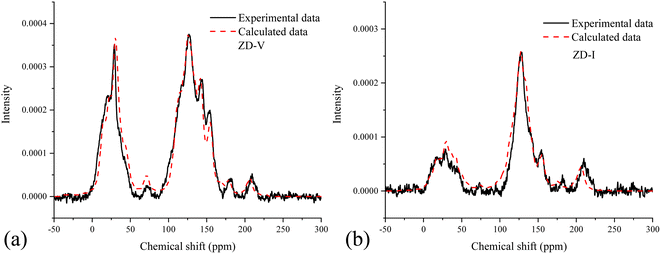 |
| | Fig. 8 Comparison between the experimental NMR spectrum and the calculated NMR spectrum based on the constructed 2D coal structure; ZD-V (a) and ZD-I (b). | |
Then, the initial 2D molecular model for the two coals were introduced into Materials Studio to calculate the three-dimensional (3D) minimum energy configuration respectively, and it was obtained by performing molecular mechanics (MM) and molecular dynamics (MD) calculations using the Dreiding force field in the Forcite module. Finally, two aggregate structure models of Zhundong coal were constructed as shown in Fig. 9. The aggregate structure model for the two Zhundong coals consist of six macromolecules respectively, and the dimension of the unit cell is 2.785 × 2.785 × 2.785 nm for ZD-V, and 2.743 × 2.743 × 2.743 nm for ZD-I. It can also be visualized from the models that ZD-I has a larger ultra-micropore size distribution and porosity compared to ZD-V (Fig. 9b and c). The construction details of the aggregate structure model can be found in the Methods section.
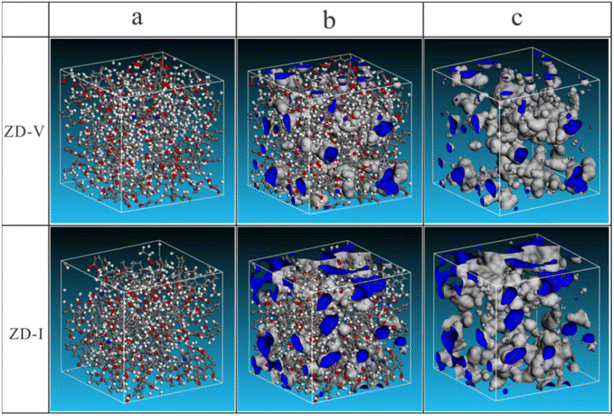 |
| | Fig. 9 The aggregate structure of the two Zhundong coals in the unit cell. (a) aggregate structure; (b) ultra-micropore in aggregate structure; (c) ultra-micropore (Probe: He). | |
3.6 Verification of the two Zhundong coal models
As we all known, verifying model validity is critical for efficient model application. Here, the Zhundong coal structure models constructed with different enrichment maceral were verified by combining experiments and simulations, including its physicochemical structures, density, spatial arrangement and pyrolysis behaviors.
3.6.1 Physicochemical structure verification. Table 7 shows some of the structural parameters obtained by the model, and the elemental content of the two Zhundong coals is basically consistent with the results of elemental analysis (Table 1). The XBP parameters obtained by the model are 0.148 and 0.186, respectively, which are close to the results obtained by the 13C-NMR experiment (Table 5). Meanwhile, the aromaticity of the two models was calculated, which was 0.612 and 0.658 respectively, and the aromaticity of inertinite-rich coal (ZD-I) was higher. Although the aromaticity parameters are different from the specific values obtained by FTIR and 13C-NMR, the maceral differences are consistent. Table 8 shows the distribution of oxygen-containing functional groups in the models, which are almost consistent with the results obtained by XPS (Table 4).
Table 7 Structural parameters of chemical structure model
| Sample |
Molecular formula |
Molecular weight |
Element content |
XBP |
Aromaticity |
| ZD-V |
C152H167NO36 |
2583.9 |
C(70.65%), H(6.51%), N(0.54%), O(22.29%) |
0.148 |
0.612 |
| ZD-I |
C155H119NO28 |
2443.6 |
C(76.19%), H(4.19%), N(0.57%), O(18.33%) |
0.186 |
0.658 |
Table 8 Assignment of functional groups in structure model of the two Zhundong coals
| Sample |
Oxygen-containing functional groups in models |
C![[double bond, length as m-dash]](https://www.rsc.org/images/entities/char_e001.gif) O O |
–OH |
–COOH |
C–O |
| ZD-V |
6.45% |
77.42% |
9.68% |
6.45% |
| ZD-I |
34.62% |
53.85% |
7.69% |
3.85% |
3.6.2 Density verification. According to the results of the He density experiment, the true densities of ZD-V and ZD-I are 1.40 g cm−3 and 1.48 g cm−3, respectively, which are close to the density values of ZD-V (1.37 g cm−3) and ZD-I (1.51 g cm−3) obtained by simulation calculation, respectively. ZD-I contains a large true density associated with its larger ultra-micropore size distribution and porosity. The rationality of the aggregated structure model of Zhundong coal is verified preliminarily.
3.6.3 Spatial arrangement verification. From the perspective of spatial arrangement, it is found that the simulated XRD spectrum for the two aggregate models are in good agreement with the experimental spectrum respectively (Fig. 10). In addition, the difference of the simulated XRD spectrum for ZD-V and ZD-I is significant. ZD-V has a wider 002 peak and an insignificant 100 peak compared with ZD-I, which is consistent with XRD results. These observation results also reflect the rationality of the spatial arrangement of the Zhundong coal aggregate structure model.
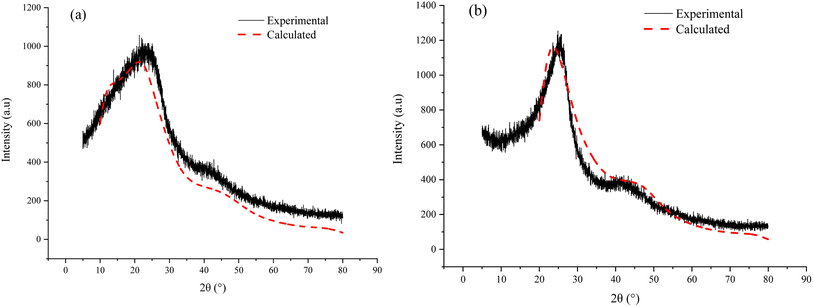 |
| | Fig. 10 Experimental and simulated XRD spectrum of the ZD-V (a) and ZD-I (b). | |
3.6.4 Pyrolysis behavior verification. TG is usually employed to investigate the thermogravimetric characteristics and identities of volatile components in coal pyrolysis.67–69 TG-DTG plots of two coals with different maceral content during pyrolysis are given in Fig. 11. From Fig. 11, it can be seen that the weight loss of samples increase gradually with increasing temperature, but the increasing degree is different. The thermal weight loss and weight loss rate of ZD-V are significantly larger than those of ZD-I, indicating that ZD-V has strong thermal reactivity and less thermal stability. This is mainly because ZD-V has a rich aliphatic structure and oxygen-containing functional groups, whose chemical bonds are easy to break in the pyrolysis process.70 Fig. 12 shows the TG plots of ZD-V and ZD-I during pyrolysis experiment and pyrolysis simulation. It can be seen that the thermal weight loss trend is almost the same, especially for ZD-V. However, the weight loss of ZD-I under pyrolysis simulation is significantly less than the experimental value, and the possible reason is that the simulated environment is rapidly heating up, resulting in an incomplete reaction. This incomplete reaction is due to the poor reactivity of the aromatic skeleton and aliphatic ring. Although the temperature and time scale of the ReaxFF MD simulation are different from that of the experiment, ReaxFF MD method can still get the results similar to the experiment. As a result, this is because increasing the temperature in the ReaxFF-MD simulation has a greater effect on the reaction rate but a smaller effect on the reaction mechanism.71 Further, by simulating the thermal decomposition progress of coal samples using ReaxFF-MD, it can be seen that a large number of aliphatic side chains and oxygen-containing functional groups in ZD-V fall off and decompose, while condensation occurs in ZD-I, which is mainly caused by the aliphatic rings.
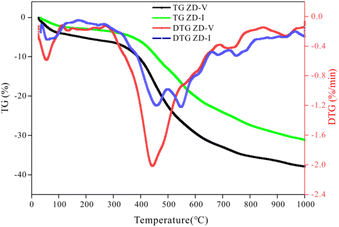 |
| | Fig. 11 TG-DTG plots of ZD-V and ZD-I during pyrolysis. | |
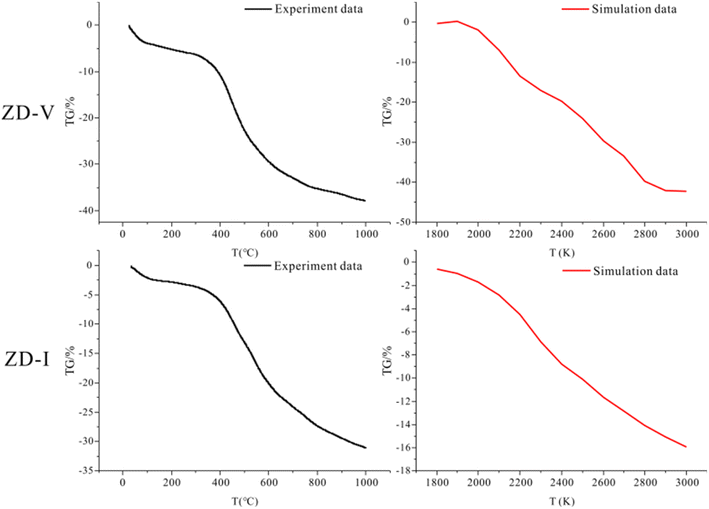 |
| | Fig. 12 TG plots of ZD-V and ZD-I during pyrolysis experiment and pyrolysis simulation. | |
On the other hand, ReaxFF-MD can describe the dynamic evolution of pyrolyzates during the coal pyrolysis process.58 To examine the constructed coal model further, the simulated molecular fragments of the two Zhundong coal models were compared with that obtained from pyrolysis experiments in which the volatile species was detected using online TG-MS. As indicated in Fig. 13, the simulated evolution tendency of cumulative total molecules released shows qualitative agreement with the experimental results, although the simulation temperatures do not consistent with the experimental temperature range. The experimental and simulated results consistently show that the thermal decomposition rate of ZD-V is faster than that of ZD-I. To compare the differences of gas release from the two enriched maceral samples to further verify the rationality of the model, here, taking CH4 gas generation as an example, the released behavior and the formation path of CH4 in the two enriched maceral samples were investigated by combining simulation and experiment. Fig. 14 shows the formation path of the first CH4 molecule during pyrolysis simulation for ZD-V (a and b) and ZD-I (d and e). It can be seen that CH4 is produced by methyl group at the end of the macromolecule for the two Zhundong coals. However, the detailed formation path is different. The methyl free radical shedding from ZD-V reacts with a hydrogen atom obtained from the hydroxyl group at the end of the other chain (Fig. 14a shows the broken bonds located on the hydroxyl group) to generate CH4. While CH4 generated by pyrolysis of ZD-I is via the reaction of the free methyl radical with a hydrogen atom on another methyl side chain group (Fig. 14d shows the specific location). Fig. 14c shows the time evolutions of the number of CH4 molecular fragments in ReaxFF MD for ZD-V and ZD-I (c), and the first generated CH4 for ZD-V and ZD-I were at 2188 K and 2416 K, respectively. In addition, ZD-V generates more CH4 molecules than ZD-I in the pyrolysis simulation process. These results were in consistent with those obtained by TG-MS (Fig. 14f).
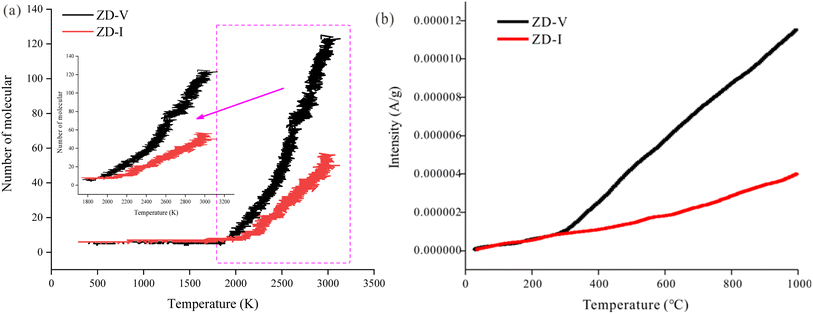 |
| | Fig. 13 Thermal evolution of cumulative total molecules released obtained from (a) ReaxFF MD simulations and (b) TG-MS pyrolysis experiments. | |
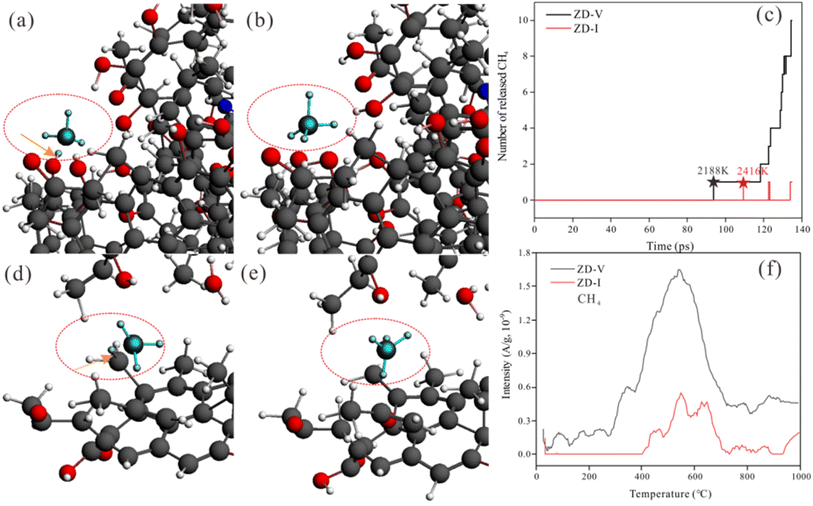 |
| | Fig. 14 Snapshots from ReaxFF heat up MD simulations show the formative path of the first CH4 molecule during pyrolysis for ZD-V (a and b) and ZD-I (d and e). The arrows located the broken bonds. Time evolutions of the number of CH4 molecular fragments in ReaxFF MD for ZD-V and ZD-I (c). The stellate signs show the simulated temperature of the first CH4 molecule released. Release curve of CH4 gas with temperature detected using TG-MS experiment (f). | |
3.7 Some ideas for structure model of Zhundong coal with different rich macerals
In this work, the initial structure models of different maceral-rich Zhundong coals were constructed by elemental analysis, FTIR, XPS, and 13C-NMR. Based on molecular mechanics and molecular dynamics simulation, the optimal 3D structure was obtained. Then, the aggregate structure models for different maceral-rich Zhundong coals were established according to the Amorphous Cell module. The 2D model was verified by elemental analysis, XPS, FTIR, and 13C-NMR, and the aggregate models was verified between He density, XRD, TG-MS experiment and their simulations results. Fig. 15 shows the final detailed modeling construction progress. The final models will be used to explore further thermal reactions (e.g. combustion, liquefaction, etc.) and may even be useful for studying the interactions between macerals.
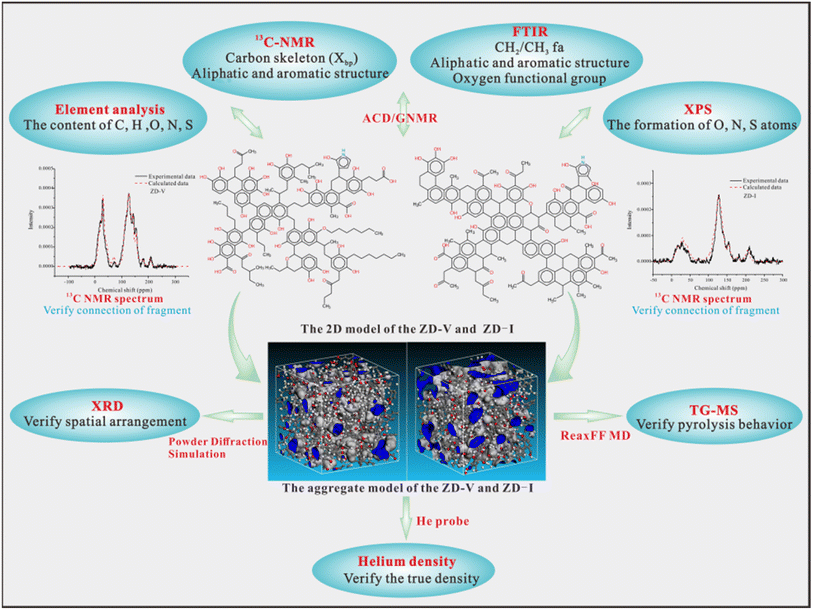 |
| | Fig. 15 A diagram of the final detailed approach for 2D and aggregate model construction based on various experiments and simulation verification. | |
Through the construction of different maceral-rich coal structure models, the differences in the chemical structure of macerals are significant and can be preliminarily assessed. It is also interesting to capture these differences more deeply through the model. For instance, the maceral differences in aromatic substitution of oxygen atoms obtained by 13C-NMR show that ZD-V is rich in ortho-disubstituted arenes, while ZD-I is rich in meta-disubstituted arenes. The differences in reactivity and quantum chemical properties on the aromatic substitution of oxygen atoms deserves to be explored. Meanwhile, the differences in the chemical structure and spatial arrangement of enriched-maceral coals will further affect their thermal behavior. In addition, the ultra-micropore structure is the key parameter in the aggregate structure of different maceral-rich coal, and its differential effect on its thermal behavior (e.g. combustion, liquefaction, etc.) deserves further investigation. Therefore, a maceral-related coal model is of great significance to the simulation of high-efficiency coal conversion process.
4. Conclusions
In this work, the Zhundong coal models of two enriched macerals (vitrinite, inertinite) were constructed respectively using elemental analysis, 13C-NMR, XPS, and FTIR experiment, and the models were verified by combining experiments (helium density test, XRD, and TG-MS experiment) and simulations. This study presents a comprehensive approach to construct and verify aggregate models from the spatial arrangement and thermal behavior perspective. Detailed conclusions are as follows:
The aromatic substitution of oxygen atoms for Zhundong coal with different enriched macerals is significantly different. ZD-V is mainly composed of ortho-disubstituted arenes, and ZD-I is mainly composed of meta-disubstituted arenes. ZD-V contains more aliphatic side chains and oxygen-containing functional groups, and has a lower ultra-micropore size distribution and porosity than ZD-I. Besides, ZD-V is dominated by chain hydrocarbons, while ZD-I is dominated by cyclic hydrocarbons with linked aromatic rings. The chemical formulas of 2D vitrinite-rich coal and inertinite-rich coal constructed is C152H167NO36 and C155H119NO28 respectively, and the corresponding total molecular weight is 2584 and 2444 respectively.
The final aggregate model for the two Zhundong coals consists of six macromolecules respectively, and the dimension of the unit cell is 2.785 × 2.785 × 2.785 nm for ZD-V, and 2.743 × 2.743 × 2.743 nm for ZD-I. The chemical structure of the two Zhundong coal models constructed are in good agreement with the experimental results. The spatial arrangement of the aggregate model was verified by experiment and simulation of He density and XRD, and the thermal behavior was verified by ReaxFF MD. The simulated trend of thermal weight loss and cumulative total molecules released were consistent with TG-MS. The final aggregate models can provide a basis for exploring the thermal behavior (e.g. combustion, liquefaction, etc.) of Zhundong coal at the maceral level in the future.
Conflicts of interest
There are no conflicts to declare.
Acknowledgements
The authors gratefully thank the National Natural Science Foundation of China (Research Project No. 42030807) and Key R & D Program of Ningxia Hui Autonomous Region (2021BEG02015) for financial support.
References
- D. Liang, Q. Xie, Z. Wei, C. Wan, G. Li and J. Cao, J. Anal. Appl. Pyrolysis, 2019, 142, 104661 CrossRef CAS.
- Y. Zhao, L. Liu, P. Qiu, X. Xie, X. Chen, D. Lin and S. Sun, Fuel Process. Technol., 2017, 155, 144–152 CrossRef CAS.
- H. Zhang, X. Guo and Z. Zhu, Fuel, 2017, 189, 301–311 CrossRef CAS.
- Z. Zhang, M. Zhu, Y. Zhang, H. Y. Setyawan, J. Li and D. Zhang, Proc. Combust. Inst., 2017, 36, 2139–2146 CrossRef CAS.
- Q. Zhang, M. B. Zhang, S. Liu, X. Guo and C. He, Energy Policy, 1994, 22, 1075–1077 CrossRef.
- C. Wang, L. Zhao, T. Han, W. Chen, Y. Yan, X. Jin and C. He, Energy Fuels, 2017, 32, 1242–1254 CrossRef.
- C. A. Wang, X. Jin, Y. Wang, Y. Yan, J. Cui, Y. Liu and D. Che, Energy Fuels, 2015, 29, 78–85 CrossRef CAS.
- X. Li, Z. Q. Bai and W. Li, Fuel, 2018, 213, 144–149 CrossRef CAS.
- D. Das, S. K. Das, P. K. Parhi, A. K. Dan, S. Mishra and P. K. Misra, Energy Nexus, 2021, 4, 100025 CrossRef.
- J. Meher, D. Das, A. K. Samal and P. K. Misra, Mater. Today: Proc., 2019, 9, 542–550 CAS.
- J. P. Mathews, A. Duin and A. L. Chaffee, Fuel Process. Technol., 2011, 92, 718–728 CrossRef CAS.
- P. H. Given, Fuel, 1960, 39, 147–153 CAS.
- I. Wender, Rev.: Sci. Eng., 1976, 14, 97–129 CAS.
- P. R. Solomon, New Approaches in coal chemistry, 1981, vol. 169, pp. 61–71 Search PubMed.
- J. H. Shinn, Fuel, 1984, 63, 1187–1196 CrossRef CAS.
- T. Takanohashi, M. Iino and K. Nakamura, Energy Fuels, 1998, 12, 1168–1173 CrossRef CAS.
- H. Kawashima and T. Takanohashi, Energy Fuels, 2001, 15, 591–598 CrossRef CAS.
- Z. Zhang, Q. Kang, S. Wei, T. Yun, G. Yan and K. Yan, Energy Fuels, 2017, 31, 1310–1317 CrossRef CAS.
- M. Gao, X. Li, C. Ren, Z. Wang, Y. Pan and L. Guo, Energy Fuels, 2019, 33, 2848–2858 CrossRef CAS.
- F. Castro-Marcano, V. V. Lobodin, R. P. Rodgers, A. M. Mckenna, A. G. Marshall and J. P. Mathews, Fuel, 2012, 95, 35–49 CrossRef CAS.
- Y. Zhang, S. Hu, Q. Zhong, J. Zhuo and J. P. Mathews, Fuel, 2021, 295, 120616 CrossRef CAS.
- Q. Zhong, Q. Mao, L. Zhang, J. Xiang, J. Xiao and J. P. Mathews, Carbon, 2018, 129, 790–802 CrossRef CAS.
- S. J. Billinge and C. L. Farrow, J. Phys.: Condens. Matter, 2013, 25, 454202 CrossRef PubMed.
- D. Hong, L. Liu, C. Wang, T. Si and X. Guo, Fuel, 2021, 300, 120972 CrossRef CAS.
- Y. Liu, S. Liu, R. Zhang and Y. Zhang, Int. J. Coal Geol., 2021, 246, 103833 CrossRef CAS.
- X. Wang, S. Wang, C. Hao, Y. Zhao and X. Song, Fuel, 2022, 309, 122180 CrossRef CAS.
- L. Liu, M. Du, G. Li, H. H. Schobert, J. Fan, J. Liu and Q. Wang, Fuel, 2022, 326, 124998 CrossRef CAS.
- W. Li, Y. Song, W. Yang and J. P. Mathews, Fuel, 2022, 311, 122581 CrossRef CAS.
- M. F. Russo Jr, R. Li, M. Mench and A. C. Van Duin, Int. J. Hydrogen Energy, 2011, 36, 5828–5835 CrossRef.
- M. Zheng, X. Li, J. Liu and L. Guo, Energy Fuels, 2013, 27, 2942–2951 CrossRef CAS.
- M. Zheng, X. Li, J. Liu, Z. Wang, X. Gong, L. Guo and W. Song, Energy Fuels, 2014, 28, 522–534 CrossRef CAS.
- F. Castro-Marcano, A. M. Kamat, M. F. Russo, A. C. T. van Duin and J. P. Mathews, Combust. Flame, 2012, 159, 1272–1285 CrossRef CAS.
- D. Hong and X. Guo, Fuel, 2017, 210, 58–66 CrossRef CAS.
- T. Si, D. Hong, P. Li and X. Guo, J. Anal. Appl. Pyrolysis, 2021, 156, 105098 CrossRef CAS.
- D. Hong, T. Si and X. Guo, Proc. Combust. Inst., 2021, 38, 4023–4032 CrossRef CAS.
- D. Hong, Z. Cao and X. Guo, J. Anal. Appl. Pyrolysis, 2018, 137, 246–252 CrossRef.
- D. Hong, T. Si, X. Li and X. Guo, Fuel Process. Technol., 2020, 199, 106305 CrossRef CAS.
- J. Zhou, X. Zhuang, A. Alastuey, X. Querol and J. Li, Int. J. Coal Geol., 2010, 82, 51–67 CrossRef CAS.
- M. J. Roberts, R. C. Everson, H. W. J. P. Neomagus, D. Van Niekerk, J. P. Mathews and D. J. Branken, Fuel, 2015, 142, 9–20 CrossRef CAS.
- R. C. Everson, G. N. Okolo, H. W. J. P. Neomagus and J. Dos Santos, Fuel, 2013, 109, 148–156 CrossRef CAS.
- H. Takagi, K. Maruyama, N. Yoshizawa, Y. Yamada and Y. Sato, Fuel, 2004, 83, 2427–2433 CrossRef CAS.
- D. Wu, G. Liu, R. Sun and X. Fan, Energy Fuels, 2013, 27, 5823–5830 CrossRef CAS.
- J. Ibarra, R. Moliner and A. J. Bonet, Fuel, 1994, 73, 918–924 CrossRef CAS.
- J. A. Orrego-Ruiz, R. Cabanzo and E. Mejía-Ospino, Int. J. Coal Geol., 2011, 85, 307–310 CrossRef CAS.
- Y. Guo and R. M. Bustin, Int. J. Coal Geol., 1998, 36, 259–275 CrossRef CAS.
- S. Wang, Y. Tang, H. H. Schobert, Y. Guo and Y. Su, Energy Fuels, 2011, 25, 5672–5677 CrossRef CAS.
- Y. Chen, M. Mastalerz and A. Schimmelmann, Int. J. Coal Geol., 2012, 104, 22–33 CrossRef CAS.
- X. He, X. Liu, B. Nie and D. Song, Fuel, 2017, 206, 555–563 CrossRef CAS.
- D. W. Van Krevelen, Coal: Typology-Physics-Chemistry-Constitution, 1993 Search PubMed.
- Z. Zhang, L. Guo, H. Zhang and J. Zhan, Int. J. Hydrogen Energy, 2019, 44, 25335–25346 CrossRef CAS.
- Y. Zhao, S. Wang, Y. Liu, X. Song, H. Chen, X. Zhang, Y. Lin and X. Wang, Energy Fuels, 2021, 35, 15663–15674 CrossRef CAS.
- Y. Liu, Y. Zhu, W. Li, C. Zhang and Y. Wang, Fuel, 2017, 210, 298–306 CrossRef CAS.
- K. Chenoweth, A. Duin and W. A. Goddard, J. Phys. Chem. A, 2008, 112, 1040–1053 CrossRef CAS PubMed.
- B. Sanjukta, T. Banerjee and K. Mohanty, Fuel, 2014, 136, 326–333 CrossRef.
- Z. Zhou, L. Guo, L. Chen, S. Shan and Z. Wang, Int. J. Energy Res., 2018, 42, 2465–2480 CrossRef CAS.
- L. Guo, Z. Zhou, L. Chen, S. Shan and Z. Wang, J. Mol. Model., 2019, 25, 174 CrossRef PubMed.
- E. Salmon, A. Duin, F. Lorant, P. M. Marquaire and W. A. Goddard III, Org. Geochem., 2009, 40, 1195–1209 CrossRef CAS.
- M. Zheng, X. Li, F. Nie and L. Guo, Energy Fuels, 2017, 31, 3675–3683 CrossRef CAS.
- F. Castro-Marcano, M. F. Russo, A. C. T. van Duin and J. P. Mathews, J. Anal. Appl. Pyrolysis, 2014, 109, 79–89 CrossRef CAS.
- J. V. Ibarra, E. Munoz, R. Moliner, C. Largeau and J. I. Hedges, Org. Geochem., 1996, 24, 725–735 CrossRef CAS.
- B. Wu, H. Hu, Y. Zhao, L. Jin and Y. Fang, J. Fuel Chem. Technol., 2009, 37, 385–392 CrossRef CAS.
- T. Grzybek, R. Pietrzak and H. Wachowska, Fuel Process. Technol., 2002, 77–78, 1–7 CrossRef CAS.
- G. Almendros, H. Knicker and F. J. González-Vila, Org. Geochem., 2003, 34, 1559–1568 CrossRef CAS.
- B. Erdenetsogt, I. Lee, S. K. Lee, Y. Ko and D. Bat-Erdene, Int. J. Coal Geol., 2010, 82, 37–44 CrossRef CAS.
- G. Gong, X. Yuan, Y. Zhang, Y. Li, W. Liu, M. Wang, Y. Zhao and L. Xu, RSC Adv., 2020, 10, 5468–5477 RSC.
- F. Xu, S. Pan, C. Liu, D. Zhao, H. Liu, Q. Wang and Y. Liu, RSC Adv., 2017, 7, 41512–41519 RSC.
- C. Zou, C. Ma, J. Zhao, R. Shi and X. Li, J. Anal. Appl. Pyrolysis, 2017, 127, 309–320 CrossRef CAS.
- M. Wang, Z. Li, W. Huang, J. Yang and H. Xue, Fuel, 2015, 156, 243–253 CrossRef CAS.
- F. Han, A. Meng, Q. Li and Y. Zhang, J. Energy Inst., 2016, 89, 94–100 CrossRef CAS.
- J. Wang, J. Du, L. Chang and K. Xie, Fuel Process. Technol., 2010, 91, 430–433 CrossRef CAS.
- X. Cheng, Q. Wang, J. Li, J. Wang and X. Li, J. Phys. Chem. A, 2012, 116, 9811–9818 CrossRef CAS PubMed.
|
| This journal is © The Royal Society of Chemistry 2023 |
Click here to see how this site uses Cookies. View our privacy policy here.  Open Access Article
 ,
Shaoqing Wang*,
Yungang Zhao and
Yu Liu
![[thin space (1/6-em)]](https://www.rsc.org/images/entities/char_2009.gif) sin
sin![[thin space (1/6-em)]](https://www.rsc.org/images/entities/char_2009.gif) θ002)
θ002)
![[thin space (1/6-em)]](https://www.rsc.org/images/entities/char_2009.gif) cos
cos![[thin space (1/6-em)]](https://www.rsc.org/images/entities/char_2009.gif) θ002)
θ002)
![[thin space (1/6-em)]](https://www.rsc.org/images/entities/char_2009.gif) cos
cos![[thin space (1/6-em)]](https://www.rsc.org/images/entities/char_2009.gif) θ100)
θ100)
![[double bond, length as m-dash]](https://www.rsc.org/images/entities/char_e001.gif) O to C
O to C![[double bond, length as m-dash]](https://www.rsc.org/images/entities/char_e001.gif) C groups, is used to indicate the maturation of coal,47,48 which can be determined as eqn (10).
C groups, is used to indicate the maturation of coal,47,48 which can be determined as eqn (10).
![[double bond, length as m-dash]](https://www.rsc.org/images/entities/char_e001.gif) C), and the intensity of the C
C), and the intensity of the C![[double bond, length as m-dash]](https://www.rsc.org/images/entities/char_e001.gif) O vibration peak at 1700 cm−1 is weaker. Compared with ZD-V, ZD-I has a relatively obvious absorption peak at 1700 cm−1, indicating that inertinite has relatively more C
O vibration peak at 1700 cm−1 is weaker. Compared with ZD-V, ZD-I has a relatively obvious absorption peak at 1700 cm−1, indicating that inertinite has relatively more C![[double bond, length as m-dash]](https://www.rsc.org/images/entities/char_e001.gif) O functional groups. According to the detail information for absorption peak assignments in FTIR spectrum from the reference,40 the 4 absorbance bands were fitted with Gaussian curves respectively (Fig. 3) to quantify the functional groups of Zhundong coals with different maceral. The corresponding structural parameters (fa, I, DOC, A(CH2)/A(CH3) and ‘C’) are calculated from the fitted peaks with eqn (5)–(11) and the results are shown in Table 3. Compared with ZD-V, the aromaticity, I, DOC and ‘C’ of ZD-I are higher, but the degree of branching of aliphatic side-chains is lower. For the linkage between aromatic carbons, the aliphatic carbon in vitrinite rich coal will be considered to add more aliphatic side chains, while the aliphatic ring is the main one in inertinite rich coal. These results are helpful for the preliminary construction of structural model of Zhundong coal.
O functional groups. According to the detail information for absorption peak assignments in FTIR spectrum from the reference,40 the 4 absorbance bands were fitted with Gaussian curves respectively (Fig. 3) to quantify the functional groups of Zhundong coals with different maceral. The corresponding structural parameters (fa, I, DOC, A(CH2)/A(CH3) and ‘C’) are calculated from the fitted peaks with eqn (5)–(11) and the results are shown in Table 3. Compared with ZD-V, the aromaticity, I, DOC and ‘C’ of ZD-I are higher, but the degree of branching of aliphatic side-chains is lower. For the linkage between aromatic carbons, the aliphatic carbon in vitrinite rich coal will be considered to add more aliphatic side chains, while the aliphatic ring is the main one in inertinite rich coal. These results are helpful for the preliminary construction of structural model of Zhundong coal.
![[double bond, length as m-dash]](https://www.rsc.org/images/entities/char_e001.gif) C, and C–H occupy most of the total carbon atoms, and its content close to 70% for the two Zhundong coals. Thus, carbon atoms mainly exist in the chemical groups of aromatic rings and aliphatic chains. Apart from this, nearly 30% of total carbon atoms are bonded to oxygen atoms, where the bonding form of carbon and oxygen atoms is different. For the two Zhundong coals, the content of C–O is slightly more than that of C
C, and C–H occupy most of the total carbon atoms, and its content close to 70% for the two Zhundong coals. Thus, carbon atoms mainly exist in the chemical groups of aromatic rings and aliphatic chains. Apart from this, nearly 30% of total carbon atoms are bonded to oxygen atoms, where the bonding form of carbon and oxygen atoms is different. For the two Zhundong coals, the content of C–O is slightly more than that of C![[double bond, length as m-dash]](https://www.rsc.org/images/entities/char_e001.gif) O, which can be suggested that the functional groups of alcohol hydroxyl, phenolic hydroxyl, or ether/both more abundant than those of carbonyl and carboxyl functional group. Compared with the ZD-V coal, the content of the carbonyl functional group (C
O, which can be suggested that the functional groups of alcohol hydroxyl, phenolic hydroxyl, or ether/both more abundant than those of carbonyl and carboxyl functional group. Compared with the ZD-V coal, the content of the carbonyl functional group (C![[double bond, length as m-dash]](https://www.rsc.org/images/entities/char_e001.gif) O) in ZD-I is richer, and the content of C–O in ZD-I coal is less correspondingly. From Fig. 5 and Table 4, it can be found that nitrogen atoms in the Zhundong coals are mainly in the formation of pyrrolic nitrogen, followed by pyridinic and quaternary nitrogen. The content of pyrrolic nitrogen for ZD-V and ZD-I coal occupied 46% and 73% of the total nitrogen respectively, suggesting that pyrrole is the most abundant nitrogen of all types, which is considered to be added to the subsequent models. Although the content of sulfur atoms in the Zhundong coal is very low, it can be still detected in the existence of the following four formations: thiophenes sulfur, sulphoxides sulfur, sulphones sulfur, and sulphates sulfur, and thiophenes sulfur is the main form existed in the two coals. Considering the proportional assignment of the overall elements, sulfur atoms will not be added to the model.
O) in ZD-I is richer, and the content of C–O in ZD-I coal is less correspondingly. From Fig. 5 and Table 4, it can be found that nitrogen atoms in the Zhundong coals are mainly in the formation of pyrrolic nitrogen, followed by pyridinic and quaternary nitrogen. The content of pyrrolic nitrogen for ZD-V and ZD-I coal occupied 46% and 73% of the total nitrogen respectively, suggesting that pyrrole is the most abundant nitrogen of all types, which is considered to be added to the subsequent models. Although the content of sulfur atoms in the Zhundong coal is very low, it can be still detected in the existence of the following four formations: thiophenes sulfur, sulphoxides sulfur, sulphones sulfur, and sulphates sulfur, and thiophenes sulfur is the main form existed in the two coals. Considering the proportional assignment of the overall elements, sulfur atoms will not be added to the model.
![[thin space (1/6-em)]](https://www.rsc.org/images/entities/char_2009.gif) 997.21
997.21![[thin space (1/6-em)]](https://www.rsc.org/images/entities/char_2009.gif) 090.71
090.71![[double bond, length as m-dash]](https://www.rsc.org/images/entities/char_e001.gif) C; C–H
C; C–H![[thin space (1/6-em)]](https://www.rsc.org/images/entities/char_2009.gif) 091.96
091.96![[thin space (1/6-em)]](https://www.rsc.org/images/entities/char_2009.gif) 549.88
549.88![[double bond, length as m-dash]](https://www.rsc.org/images/entities/char_e001.gif) O
O![[double bond, length as m-dash]](https://www.rsc.org/images/entities/char_e001.gif) C–O
C–O![[thin space (1/6-em)]](https://www.rsc.org/images/entities/char_2009.gif) 421.08
421.08![[double bond, length as m-dash]](https://www.rsc.org/images/entities/char_e001.gif) C
C![[thin space (1/6-em)]](https://www.rsc.org/images/entities/char_2009.gif) 376.46
376.46![[thin space (1/6-em)]](https://www.rsc.org/images/entities/char_2009.gif) 080.44
080.44 – carbonyl δ (chemical shift) > 165 × 10−6;
  – in an aromatic ring;
  – protonated and aromatic;
  – nonprotonated and aromatic;
  – phenolic or phenolic;
  – alkvlated aromatic;
  – aromatic bridgehead;
 – CH3 or nonprotonated;
  – CH or CH2;
  – bonded to oxygen.

![[double bond, length as m-dash]](https://www.rsc.org/images/entities/char_e001.gif) O
O


