 Open Access Article
Combined molecular dynamics simulations and experimental studies of the removal of cationic dyes on the eco-friendly adsorbent of activated carbon decorated montmorillonite Mt@AC†
Hassan Ouachtak *ab,
Anouar El Guerdaouic,
Rachid El Haoutic,
Redouane Haounatia,
Hamza Ighniha,
Yahya Toubiab,
Fadi Alakhrasd,
Rabia Rehman
 e,
Naima Hafidf,
Abdelaziz Ait Addi*a and
Mohamed Labd Tahaa
aLaboratory of Organic and Physical Chemistry, Faculty of Science, Ibn Zohr University, Agadir, Morocco. E-mail: ouachtakhassan@gmail.com; aitaddi.abdelaziz@gmail.com
bFaculty of Applied Science, Ait Melloul, Ibn Zohr University, Agadir, Morocco
cDepartment of Chemistry, Faculty of Science, Ibn Zohr University, Agadir, Morocco
dCollege of Pharmacy, Middle East University, Amman, 11831, Jordan
eInstitute of Chemistry, University of the Punjab, Lahore, 54590, Pakistan
fRegional Center of Education and Training Souss Massa, Morocco
First published on 8th February 2023
Abstract
In recent years, the combination of experimental and theoretical study to explain adsorbate/adsorbent interactions has attracted the attention of researchers. In this context, this work aims to study the adsorption of two cationic dyes, namely methylene blue (MB) and crystal violet (CV), on a green adsorbent Montmorillonite@activated carbon (Mt@AC) composite and to explain the adsorption behavior of each dye by the molecular dynamics (MD) simulation method. The eco-friendly nanocomposite Mt@AC is synthesized and characterized by the analysis methods: XRD, FTIR, BET, TGA/DTA, SEM-EDS, EDS-mapping and zeta potential. The experimental results of adsorption equilibrium show that the adsorption of the two dyes is well suited to the Langmuir adsorption model. The maximum adsorption capacity of the two dyes reaches 801.7 mg g−1 for methylene blue and 1110.8 mg g−1 for crystal violet. The experimental kinetics data fit well with a pseudo-first order kinetic model for the two dyes with coefficient of determination R2 close to unity, non-linear chi-square χ2 close to zero and lower Root Mean Square Error RMSE (R2 → 1 and χ2 → 0, RMSE lower). Molecular dynamic simulations are run to gain insights on the adsorption process. According to the RDF analysis and interaction energy calculations, the obtained results reveal a better affinity of the CV molecule with both the AC sheet and montmorillonite framework as compared with MB. This finding suggests that CV is adsorbed to a larger extent onto the nanocomposite material which is in good agreement with the adsorption isothermal experiment observations.
1. Introduction
In recent times, environmental management, waste reprocessing, contamination control and wastewater treatment have become the main significant issues all over the world.1,2 Nations that have experienced water contamination caused by toxic metals, synthetic dyes, organic and metal–organic compounds have faced many troubles, from both financial and ecological perspectives.3,4Synthetic dyes are widely explored in several industries, like: textile, paper, carpet, food, cosmetics, plastic and leather tanning.5,6 These complex materials are discharged into the aqueous effluents causing pollution and environmental crisis.7 Synthetic dyes generally have complex aromatic structures based on hydrocarbon moieties such as benzene, toluene, xylene, naphthalene, etc. The complex nature of these dyes makes them more stable and non-biodegradable.8 Additionally, dyes are toxic, carcinogenic and mutagenic molecules causing serious destruction of the kidneys, liver, brain, fertility and central nerve system.9 Accordingly, it is very important to manage the amount of toxic dyes in wastes before flowing into the environmental system.
Various treatment methods are improved to dyes removal from industrial effluents. For instance: biological treatment, membrane separation, aerobic coagulation, oxidation and electrochemical techniques are extensively used.10–13 However, the adsorption method is considered as one of the universal approaches utilized for the removal of toxic organic and inorganic poisons due to its simplicity, feasibility, and effective sorption ability.14,15 Different types of adsorbent materials are used effectively in removing of colored dyes from aqueous solutions. Nevertheless, sometimes the costly associated processes for the renewal and reprocess of the adsorbents warrant the researchers toward investigating alternative low-cost sorbent materials. There are different types of low cost sorbent materials such as: dead bio-mass, seaweed, mesoporous silica SBA-15, natural zeolite, mineral clay, and agricultural waste.16 Activated carbons (ACs) have gained increasing interest because these materials have broad range of industrial applications including gas and air cleaning.17 Furthermore, ACs are widely used in the treatment, purification and decolorization of wastewater.18 This process has particular significance in the pharmaceuticals, beverage, food and other industrial waste treatment plants. Activated carbon-based materials have high specific surface area and well-allocated pore volumes with the existence of some electron donor functional groups (hydroxyl, carboxyl, phenol, quinine and lactone) on the surface which are obtained from the feedstock materials. These functional groups are responsible for removing contaminants which makes ACs more effective toward different types of inorganic or organic pollutants discharging in aqueous solutions.19 Activated carbons can be obtained by chemical or physical activation process. The physical one includes the pyrolysis of the stock material and the pyrolytic char is activated in steam or carbon dioxide.20 Chemical process can be performed in a single step by executing the pyrolysis of precursor in the presence of chemical activating reagents with an inert atmosphere.19 However, chemical activation process is more preferable due to its low energy demand and operating cost, more carbon percentage yields and larger surface area.21
Recently, locally available and less expensive carbonaceous precursors are widely utilized in producing of ACs due to environmental, economic and societal perspectives. Different agricultural wastes such as peanut hulls, corncobs, coffee beans, cotton stalk, grape seeds and pistachio wood16 have been exploited as precursors for activated carbons.
On the other hand, clay minerals and their tailored derivatives have composed an outsized family of sorbents which could be utilized for the removal of diverse contaminants from solution.14,22 Among this family, montmorillonite is considered as one of the most adsorbent materials because it is naturally available, has good adsorption capacity, physical and chemical properties, inexpensive, good cation exchange capacity and high superficial area.7,14,22
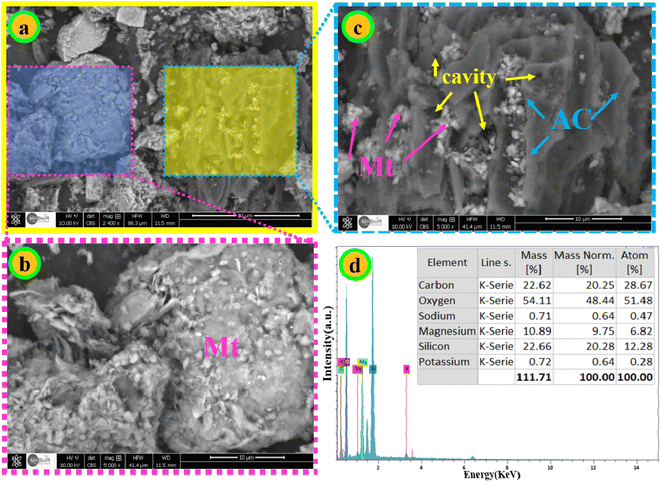
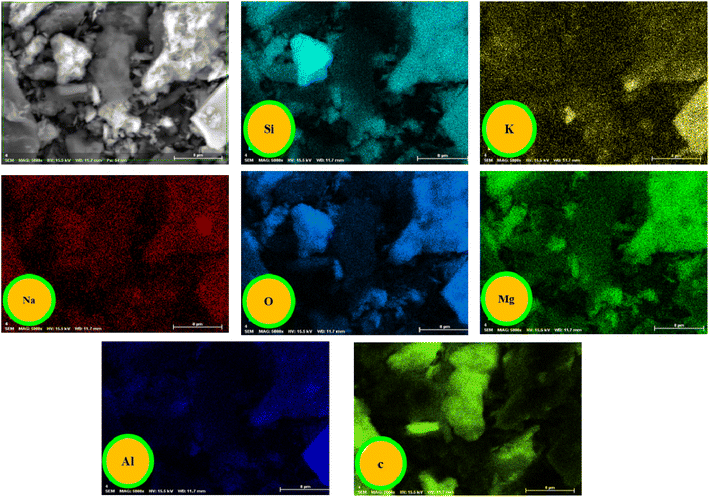
The main objective of this work is to develop a carbon-based nano-clay composite material for the treatment of contaminated water. For this, we exploit the Moroccan clay and wheat straw (WS) as the main bio-waste to develop a Montmorillonite-activated carbon (Mt@AC) composite material to exploit the interlayer structure of montmorillonite and the porosity of AC. This nanocomposite is a low-cost eco-friendly adsorbent material used for the removal of toxic cationic dyes from wastewater. The morphological and structural properties of prepared composite were characterized by different analysis techniques, such as: Fourier transform infrared (FT-IR) spectroscopy, thermogravimetric analysis/differential thermal analysis TGA/DTA, X-ray diffraction (XRD), zeta potential, Scanning electron microscopy (SEM), energy dispersive X-ray spectroscopy and nitrogen (N2) sorption (BET method). Batch adsorption tests were performed to find out the performance of the composite to adsorbed cationic dyes such as methylene blue and crystal violet. In addition, the Molecular dynamics (MD) is a very useful tool for better understanding of the adsorption mechanisms regarding the structural and energetic information. This information can be obtained from analyzing conformational rearrangements of compounds as well as interactions that occurred amongst the different components of a molecular system. In the present work, the adsorption process of the CV and MB organic dyes onto the Mt@AC composite material is theoretically analyzed using molecular dynamics method to assess the affinity and intermolecular interactions of the investigated dyes toward the synthesized nanomaterial.
2. Materials and methods
2.1. Chemicals and materials
The details of the origin and the type of montmorillonite (Mt) used in this work were published in our previous work1,7,14 All chemicals and reagents were of analytical grade and obtained from Sigma Aldrich. Crystal violet (CV) (C25H30N3Cl; molecular weight: 408 g mol−1, molecular color in λmax = 590 nm, solubility aqueous: 10 g); methylene blue (C16H18ClN3S; molecular weight: 319.9 g mol−1, molecular color in λmax = 661 nm, solubility aqueous: 10 g L−1); sodium hydroxide NaOH (molecular weight 39.99 g mol−1, 98%) and hydrochloric acid HCl (molecular weight 36.46 g mol−1, 37%).2.2. Preparation of Mt@AC composite
The montmorillonitet@activated carbon composite has been prepared by a simple and eco-friendly method.2.3. Characterization
More detailed characterizations are presented in the ESI S1.†2.4. Adsorption tests
The Mt@AC composite was tested for the removal of crystal violet (CV) and methylene blue (MB) dyes from aqueous solutions at room temperature (20 °C ± 0.5 °C) using batch technique. The adsorption trials were performed using a number of glass bottles (200 mL) containing the desired dose of Mt@AC adsorbent and 100 mL of CV or MB solution with a known concentration. The glass bottles were agitated at constant speed of 150 rpm. Finally, after each adsorption test, the liquid phase was obtained using a Millipore membrane filter (0.45 μm) and the amount of dye in each samples was measured using UV-visible spectrophotometer (UV-1800, SHIMADZU).The effect of the adsorbent dosage on the adsorption of CV and MB dyes was tested over the Mt@AC adsorbent dosage range of 0.2 to 1.2 g L−1; the glass vials were shaken for 2 h to ensure equilibrium. The effect of pH on the adsorption process was investigated at different pH values between 2.0 and 10.0 where the pH value of the solutions was adjusted using 0.1 mol L−1 HCl or 0.1 mol L−1 NaOH. For kinetic studies, the effect of contact time (5 to 180 min) was calculated for each dye at three initial concentrations (150, 250 and 400 mg L−1). The adsorption isotherm studies for each dye were also performed by shaking 1.0 g L−1 of Mt@AC with 100 mL of dye solution at initial concentrations ranging from 500 to 1500 mg L−1 for CV dye and 200 to 1250 mg L−1 for MB dye for 120 min.
Adsorbed quantities of dye Qt (mg g−1) at different time t or Qe (mg g−1) at diverse initial concentrations were evaluated using eqn (1). The % Removal for the adsorption process was estimated using eqn (2).
 | (1) |
 | (2) |
2.5. Analysis data
The mathematical equations corresponding to the different adsorption isotherm models and the kinetic models as well as the errors functions are summarized in Table 1.| Isotherm model or kinetic model | Equations | Reference |
|---|---|---|
| a Notation: Qt (mg g−1) and Qe (mg g−1) are the adsorbed quantities at time t (min) and equilibrium, respectively. k1 (min−1) and k2 (mg g−1 min−1), are the rate constants of pseudo-first order and pseudo-second order, respectively. Ce (mg L−1) is the equilibrium concentration, Qm is the maximum adsorbed quantity (mg g−1), KL is the Langmuir constant (L mg−1). KF (mg g−1) (mg L−1) n is the Freundlich isotherm constant; n is the heterogeneity factor; Qe,exp (mg g−1) is the adsorbed quantity obtained experimentally, Qe,cal (mg g−1) is the adsorbed quantity obtained from the kinetic model or isotherm adsorption model by using the Solver add-in “in Microsoft Excel”, Qe,mean (mg g−1) is the mean of the values of Qe, exp. N is the number of observations in the experimental data. | ||
| Pseudo first order | Qt = Qe,1(1 − ek1t), eqn (3) | 23 |
| Pseudo second order |  , eqn (4) , eqn (4) |
24 |
| Freundlich isotherm | Qe = KFC1/ne, eqn (5) | 25 |
| Langmuir isotherm |  , eqn (6) , eqn (6) |
26 |
![[thin space (1/6-em)]](https://www.rsc.org/images/entities/char_2009.gif) |
||
| Error functions | ||
| Error function | Equation | Reference |
| Chi-squared |  , eqn (7) , eqn (7) |
27 |
| Coefficient of determination R2 |  , eqn (8) , eqn (8) |
28 |
| Residual root mean square error RMSE |  , eqn (9) , eqn (9) |
29 |
3. Results and discussion
3.1. Characterization
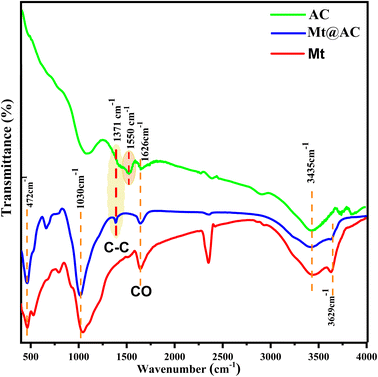
![[double bond, length as m-dash]](https://www.rsc.org/images/entities/char_e001.gif) O stretching vibrations of carbonyl and carboxyl groups.36 In addition, the band located at 1550 cm−1 is related to the C
O stretching vibrations of carbonyl and carboxyl groups.36 In addition, the band located at 1550 cm−1 is related to the C![[double bond, length as m-dash]](https://www.rsc.org/images/entities/char_e001.gif) C stretching vibration.37
C stretching vibration.37
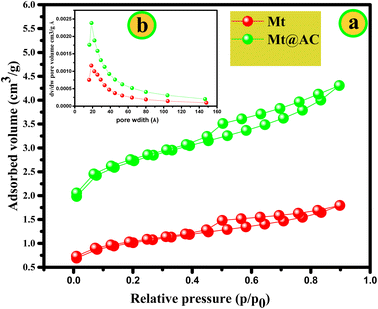 | ||
| Fig. 3 The nitrogen adsorption–desorption isotherm at 77 K (a) and pore size distribution curve (b) of Mt and Mt@AC composite. | ||
| Sample name | BET surface area ABET (m2 g−1) | Differential pore volume (cm−3 g−1 Å−1) | Pore size (Å−1) |
|---|---|---|---|
| Mt | 76.6531 | 0.0012 | 18.69 |
| Mt@AC | 199.6442 | 0.0024 | 18.80 |
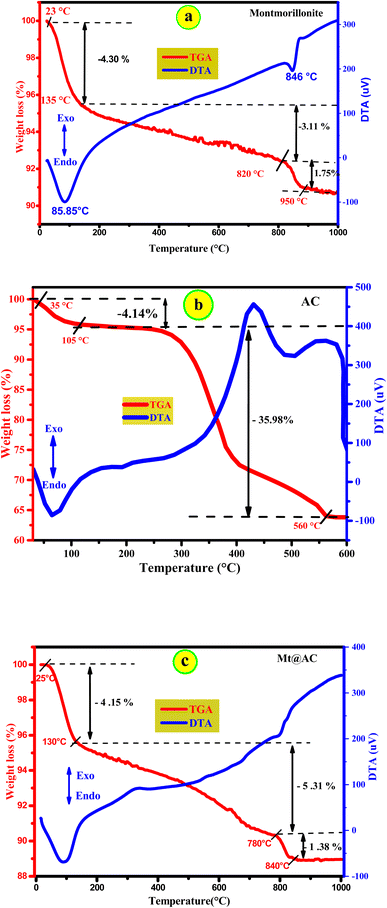
For three samples, a mass loss of 4.30% is observed for Mt, 4.14% for activated carbon and 4.15% for Mt@AC in the temperature range 25–130 °C corresponds to surface water. In parallel At the same time, the DTA analyzes of three samples shows an endothermic thermal process around 95 °C. A second loss of mass is observed with 3.11% for Mt, 35.98% for activated carbon and 5.31% for Mt@AC in the temperature range (≈130 °C – 800 °C) which is corresponding to the dehydration of intercalated water and exchangeable cations at interlayer space of the montmorillonite. The significant mass loss of the activated carbon could which is due to the easy to degradation of bonds carbon at high temperature compared to the Mt@AC sample (−5.31%) and the Mt (−3.11). The last loss of mass is recorded after 800 °C of the Mt and Mt@AC samples; 1.75% for Mt and 1.38% for Mt@AC can be attributed to the dehydroxylation of the silanol groups Si–OH and of the aluminol groups Al–OH of the montmorillonite. The results of thermogravimetric analysis show that Mt@AC composite is stable in the temperature range 20 °C–1000 °C with a total mass loss of ≈10%.
3.2. Adsorption process
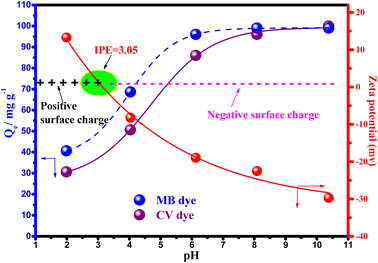 | ||
| Fig. 8 Zeta potential and effect of pH on the adsorption of MB and CV dyes onto Mt@AC (Experimental conditions: C0: 100 mg L−1, Adsorbent dose = 1 g L−1; contact time: 180 min; temperature = 20 °C). | ||
From Fig. 8, it is observed that two variations are studied as a function of pH; the adsorbed quantities of MB and CV dyes and the zeta potential of Mt@AC. As clearly depicted the percentage removal of MB and CV dyes increases when the pH increases from 2 to 8. The analysis of zeta potential in Fig. 8 further shows that the surface of Mt@AC is negatively charged from pH = 3 and thus may remove the positively charged dye (MB and CV) in aqueous solution via electrostatic interaction. Besides, the amount of dyes adsorbed by per unit mass of Mt@AC increases with increase in pH in the range from 2.0 to 8.0 because the negative surface charge on the Mt@AC is larger at higher pH values (Fig. 8). However, at pH < 3, the sorbent surface (Mt@AC) becomes more protonated owing to more H+ ions (zeta potential = +15.3 mV), which leads to decrease in the amount of dyes adsorbed by per unit mass of Mt@AC. This can be explained by the electrostatic repulsion between the cationic dyes (MB and CV) and the surface. More apparently, at higher pH values (8–10), the adsorption of the dyes (MB and CV) increases significantly due to the positive charges on the dyes ensured that they are attracted by anionic adsorbent (Mt@AC). Thus, there are strong attraction forces (electrostatic attractions) between the negative surface of the adsorbent and positive charges of dye. According to that, the mechanism of dyes adsorption onto the Mt@AC is believed to be an ion-exchange process between 3 < pH < 8 and more dominantly electrostatic attractions at higher pH values (8–10). Therefore, the optimal pH for the adsorption of the dyes (MB and CV) by adsorbent (Mt@AC) is chosen at pH 8 and used for the next investigations.
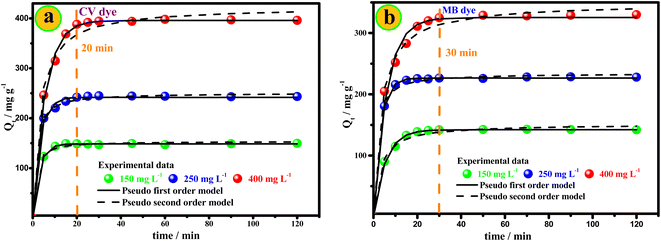
➢ At the first minutes of the experiment: the vacant sites on the surface of Mt@AC are in large numbers which promotes the adsorption of dyes on these sites.
➢ At the last minutes of the experiment: the vacant sites on the composite surface decrease due to their occupation by the adsorbed dye molecules, which explains the decrease in the amount of dyes adsorbed with contact time.
In addition, the remaining vacant sites on the surface of Mt@AC are difficult to be occupied due to the force of electrostatic repulsion. On the other hand, Fig. 9 shows an increase in the adsorbed quantity of dyes with the increase in the initial concentration of dyes. This phenomenon can be clarified by the increase in the possibility of collision between the dye molecules on the surface of Mt@AC composite.7 The contact time is estimated at 30 min for the CV dye and 50 min for the MB dye.
| Dye | CV | MB | |||||
|---|---|---|---|---|---|---|---|
| Initial concentration | mg L−1 | 150 | 250 | 400 | 150 | 250 | 400 |
| Qe,exp | (mg g−1) | 149.64 | 243.5 | 396.5 | 142.2 | 228.5 | 330.8 |
| Pseudo-first-order | |||||||
| Qe,cal | (mg g−1) | 149.35 | 241.80 | 395.79 | 142.18 | 226.50 | 325.37 |
| k1 | (min−1) | 0.346 | 0.3266 | 0.1796 | 0.1850 | 0.3165 | 0.1673 |
| R2 | — | 0.99 | 0.99 | 0.99 | 0.99 | 0.99 | 0.99 |
| χ2 | — | 0.0011 | 0.0039 | 0.1062 | 0.0316 | 0.0073 | 0.0978 |
| RMSE | — | 0.405 | 4.951 | 6.258 | 1.338 | 2.163 | 8.875 |
![[thin space (1/6-em)]](https://www.rsc.org/images/entities/char_2009.gif) |
|||||||
| Pseudo-second order | |||||||
| Qe,cal | (mg g−1) | 153.71 | 250.68 | 423.36 | 151.40 | 234.44 | 348.96 |
| k2 | (g mg−1 min−1) | 0.0065 | 0.0033 | 0.0007 | 0.0023 | 0.0035 | 0.0008 |
| R2 | — | 0.97 | 0.97 | 0.96 | 0.96 | 0.97 | 0.98 |
| χ2 | — | 0.0662 | 0.056 | 0.5083 | 0.1679 | 0.0940 | 0.2334 |
| RMSE | — | 3.112 | 3.635 | 13.698 | 4.983 | 4.802 | 9.848 |
| Adsorption models | Isotherm constants CV dye | CV dye | MB dye |
|---|---|---|---|
| Langmuir | Qm (mg g−1) | 1110.8 | 801.7 |
| Qm (mmol g−1) | 2.745 | 2.507 | |
| KL(L mmol−1) | 4.40 | 6.400 | |
| RL | 0.058–0.153 | 0.038–0.199 | |
| χ2 | 0.0077 | 0.0069 | |
| RMSE | 0.0562 | 0.0119 | |
| R2 | 0.999 | 0.990 | |
| Freundlich | nF | 6.70 | 2.99 |
| KF (mmol g−1) (mmol L−1)n | 2.876 | 2.458 | |
| χ2 | 0.0193 | 0.0140 | |
| RMSE | 0.216 | 0.1903 | |
| R2 | 0.93 | 0.96 |
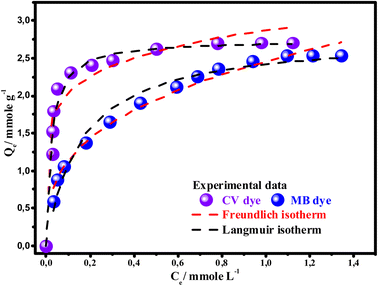
In addition, the maximum adsorption capacities obtained experimentally for the CV and MB dyes are respectively 2.7085 mmol g−1 (1105.6 mg g−1) and 2.521 mmol g−1 (806.4 mg g−1). These values are close to the quantities calculated using the Langmuir model 2.745 mmol g−1 (1110.8 mg g−1) for the CV dye and 2.507 mmol g−1 (801.7 mg g−1) for MB dye, which confirms that Langmuir isotherm is the best model explains the adsorption behavior of the two dyes on the Mt@AC composite. The confirmation that the adsorption of the two dyes is well adjusted by the Langmuir model is supported by the separation factor calculation RL.46 Indeed the value of RL ( ; KL is the Langmuir constant; C0 is initial concentration of dye) indicates whether the adsorption reaction is unfavorable (RL > 1), linear (RL = 1), favorable (0 < RL <1), or irreversible (RL = 0). The RL values for the CV and MB dyes presented in Table 4 show that RL is between 0 and 1, which indicates that the adsorption of CV and MB dyes onto Mt@AC surface is a favorable process.
According to these isotherms results and the Langmuir model hypotheses cited in the literature,5 it can be assumed that: (i) the active sites of surface adoption of the Mt@AC composite are energetically homogeneous, (ii) the adsorbed molecules form a monolayer on the composite surface (iii) no interaction exists between the adsorbed dye molecules.
On the other hand, from the values in the Table 4, it is noted that the CV dye is more adsorbed than the MB dye onto the composite surface; this behavior will be discussed in the theoretical section of this paper.
The maximum adsorption capacity of the two MB and CV dyes by Mt@AC composite was compared with that of other adsorbents reported in the literature as shown in Table 5. The adsorbent Mt@AC prepared in this work exhibits a higher adsorption capacity of the two dyes (801.7 mg g−1 for MB and 1110.8 mg g−1 for CV) compared to the other materials studied, and it can be considered a promising alternative adsorbent for the elimination of cationic dyes.
| Dye | Adsorbent | T (°C) pH | Qm (mg g−1) | References |
|---|---|---|---|---|
| MB dye | Montmorillonite | 20 °C pH = 7.9 | 327 | 47 |
| Activated carbon | 25 °C pH = 7.5 | 324.7 | 48 | |
| Natural clay mineral | 20 °C pH = 7.5 | 100 | 49 | |
| Mesoporous-activated carbon | 30 °C pH = 11 | 143.53 | 44 | |
| MMT@C nanocomposites | 25 °C pH = 10 | 194.2 | 50 | |
| Mt@AC | 20 °C pH = 8 | 801.7 | This study | |
| CV dye | Natural clay mineral | 20 °C pH = 7.5 | 330 | 49 |
| Zeolite-montmorillonite | 25 °C pH = 9 | 150.516 | 51 | |
| Montmorillonite | 20 °C pH = 7.9 | 640.15 | 47 | |
| Activated carbon | 25 °C pH = 9 | 84.11 | 51 | |
| Waste apricot (activated carbon) | 30 °C natural pH | 52.86 | 52 | |
| Mt@AC | 20 °C pH = 8 | 1110.8 | This study |
3.3. Molecular dynamics study
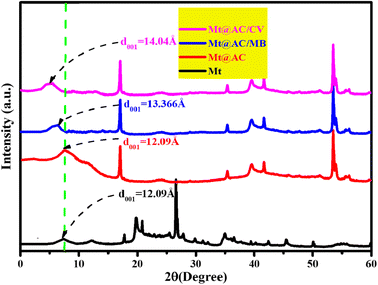
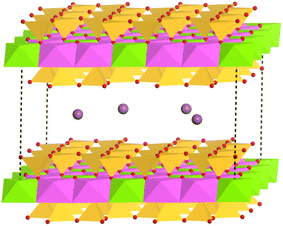
On the other hand, from the X-ray diffraction (XRD) patterns of the Mt@AC/CV and Mt@AC/MB powders displayed in Fig. 2, the observed decrease in the 2θ values of the first diffraction peak when compared with Mt@AC (d001 reflection at 7.303° 2θ) indicates that both CV and MB are integrated in the interlayer region of the Mt. The basal spacing increases during the adsorption process and reaches the values of 1.404 nm and 1.366 nm for CV and MB, respectively. Based on the results obtained from the X-ray diffraction (XRD) patterns, the intercalation of CV and MB dyes molecules within the interlayer space of the Mt lattice is modeled as following; a Mt model consists of two layers is built starting from relevant crystallographic coordinates published by Tsipursky and Drits.55 The built pyrophyllite crystal unit cell is recreated three times in the a direction and two times in the b direction through the conditions of periodic boundary and then having a 3a × 2b × 1c super cell with the following dimensions 15.6 Å × 18.4 Å × 10.13 Å (unit cell dimensions were a = 5.20 Å, b = 9.20 Å, c = 10.13 Å). Thereafter, 4 Al atoms are substituted randomly by an equivalent number of Mg atoms in the octahedral sheets. The charge defect caused by the mentioned isomorphic substitutions (the charge on these sites is decreased from +3e to +2e and thus the total net charge in the Mt framework lattice has a value of −4e) is recompensed by the inclusion of 4Na+ counter-ion placed arbitrarily in the interlayer region (Fig. 12). Thus, the chemical unit cell composition of Mt lattice is Na0.75Si8(Al3.25Mg0.75)O20(OH)4.
Next, one CV or MB molecule in their cationic forms are manually incorporated in the interlayer space by removing one Na+ ion and thus obtaining the Mt/CV and Mt MB−1 adsorbate–adsorbent complexes. Each of the prepared AC/CV, AC/MB, Mt/CV and Mt MB−1 complexes are first annealed using “anneal” task within Forcite module. This process is consisted by heating of the system from 300 K to 500 K with temperature increments of 10 K, and then cooling to 300 K again in the same way for 20 annealing cycles. 250 MD steps of 1.0 fs are run in every heating/cooling step. At the end of each cycle the system is geometry optimized. Subsequently, MD simulations in canonical ensemble NVT (constant number of particles, volume and temperature) are run at room temperature (298 K) using COMPASS (see ESI S2†) force field to obtain the most stable configuration. During the simulations, the SMART geometry optimization algorithm is used with convergence thresholds set to 1 × 10⁻⁵ kcal mol−1 for convergence tolerance and 5 × 10⁻³ (kcal mol−1)/Å for maximum force. Temperature control is made by Nosé thermostat and the length of the simulations is attuned to make certain equilibration and relevant sampling. In the current study, a time step of 1 fs is used for 500 ps of molecular dynamics, during which the positions of the Na+, Mt and AC atoms are fixed but the CV and MB are allowed to move consequently. The summation of Ewald method is used to treat van der Waals and the electrostatic interactions with a cutoff distance of 12 Å and accuracy of 1 × 10⁻⁵ kcal mol−1, respectively.
The relative affinity between molecules in each equilibrated model gained from the conducted simulations is computed by calculation of the interaction energy (Eint) using the following equation:
| Eint = Edye/surface − Esurface − Edye | (10) |
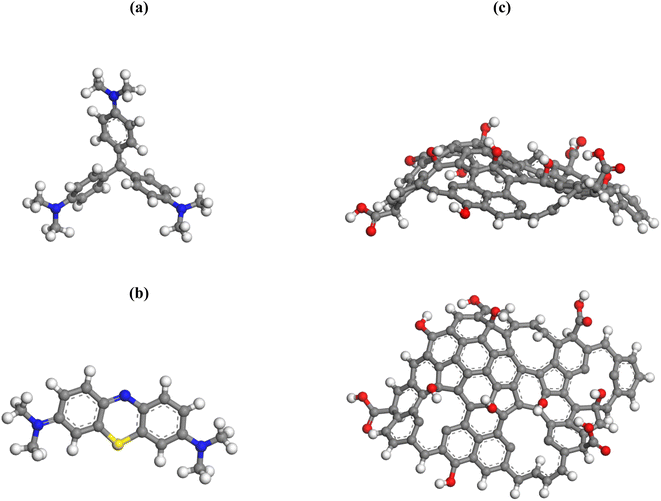
3.3.3.1 Behavior of CV and MB dyes towards AC. From the conducted simulations, the most energetic stable AC/CV and AC/MB configuration snapshots (Fig. 13) show a perpendicular positioning of CV over AC surface, whereas MB molecule lies parallel on this surface.
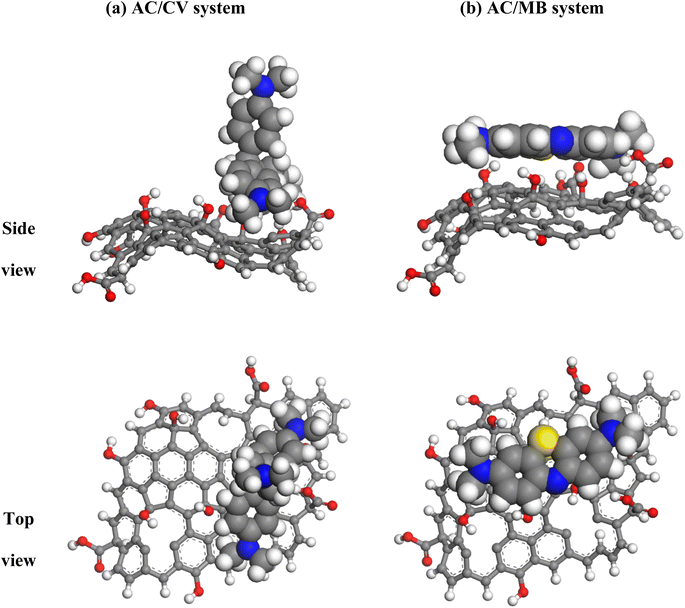 | ||
| Fig. 13 Top and side views of the most energetic stable configurations of (a) CV and (b) MB (CPK model) over the AC surface (ball and stick model) from the NVT MD simulations. | ||
Radial distribution function (RDF) analysis of MD simulations reveals that the hydrophobic H-bonded-to-C atoms of CV dye molecule are located at short distances from O atoms of AC (2.87 Å) (red line in Fig. 14). Whereas, in the case of MB molecule, the H(C) atoms are located at larger distances (3.35 Å) from the framework of O atoms (blue line in Fig. 14). In fact, MB molecule adsorbs on the AC surface following a parallel mode. Therefore, due to the curved form of the AC surface and the rigid structure of the MB, the interatomic distances between the surface and the MB can be varied considerably. While the perpendicular adsorption mode and the flexibility of CV molecule allows a good adaptation over the curved AC surface and thus leading to more beneficial contact. When realistic configurations are considered (more than one CV molecule has been absorbed), the adsorption process is predicted to be efficient and easier. This prediction is corresponded to the adsorbed molecules that occupy a lower space on the available surface when compared with MB molecules, which bind horizontally and therefore make the adsorption process less efficient and more difficult.
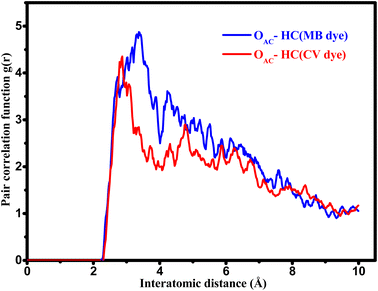 | ||
| Fig. 14 Comparison of RDFs between OAC (oxygen atoms on AC surface) and the different H atoms of the CV (red line) and MB (blue line) molecules. | ||
The interaction energy between the adsorbent and adsorbate, bonded (intramolecular) and non-bonded (intermolecular) energy contributions to the total energy for each molecular configuration (i.e., most stable structure from MD calculations) are summarized in Table 6.
| Most stable adsorbate/adsorbent configuration | Eint (kcal mol−1) | Bonded energy (kcal mol−1) | Non bonded energy (kcal mol−1) | |
|---|---|---|---|---|
| van der Waals | Electrostatic | |||
| AC/CV | −69.476 | 75.497 | 27.813 | −38.949 |
| AC/MB | −42.743 | 24.71 | 6.479 | −5.710 |
| Mt/CV | −135.740 | −11.425 | −11.402 | −72.139 |
| Mt/MB | −57.987 | 14.206 | −29.057 | −0.718 |
As displayed in Table 6, the obtained Eint values indicate stronger interaction between CV and AC (−69.5 kcal mol−1) than that between MB and AC surface (−42.7 kcal mol−1), which suggests a high binding affinity of CV dye with the AC as compared with MB. In addition, the conducted calculations reveal that the intramolecular forces are mainly contributed in the total energy for both AC/CV and AC/MB complexes. For the intermolecular contribution, positive values of van der Waals forces indicate their repulsive character. Meanwhile, electrostatic interactions are found to be attractive (negative values). Therefore, electrostatic interactions are highly suggested between the AC surface which is negatively charged (owing to the existence of polar oxygen-containing functional groups) at the pH of the solution (pH = 8) and the positively charged dye molecules. On the other hand, the excessively close location of the CV molecule from the surface of AC, as revealed by the RDF analysis as well as to its highest flexibility, allows these molecules to be easily adsorbed on AC due to π–π interactions between the aromatic rings of CV molecule and AC, which leads to further stabilization of the resulting AC/CV complex. For MB molecule, the π–π interactions are highly suggested due to the large aromatic backbone of MB molecule.56,57 However, the curved form of the AC surface and the rigid structure of the MB molecule can prevent the close contact with this surface and consequently, such interactions are expected to be weaker as compared with the case of CV. Hence, it is concluded that CV molecules are more favorable to be adsorbed onto the AC with respect to MB.
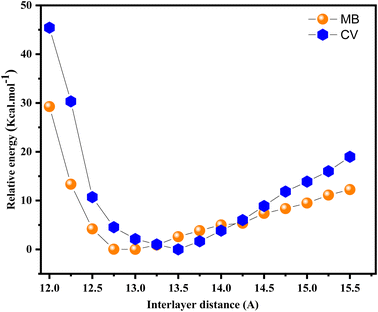
3.3.3.2 Behavior of CV and MB dyes towards montmorillonite. The COMPASS force-field58 is used to model the molecular structure and the interaction energies of CV and MB within the interlayer space of the Mt lattice. The relative stability of the CV and MB molecules within the interlayer space of the Mt framework as a function of the interlayer distance is shown in Fig. 15. As can be seen, a significant raise of the stability (decrease of the relative energy) with increasing interlayer space up to a distance from which a continuous decrease of stability (increase of the relative energy) is observed. The results obtained from the COMPASS force-field for the most stable interlayer distances (being 13.5 Å for CV and 13.00 Å for MB) show a very good agreement with the experimentally observed interlayer distances which have values of 14.04 Å for CV and 13.66 Å for MB. Even though the used models in the simulation process do not take into account the water molecules within the interlayer space. These findings demonstrate that the computational models and the setting parameters are adequate to properly simulate the swelling of montmorillonite during the inclusion of the dyes molecules.
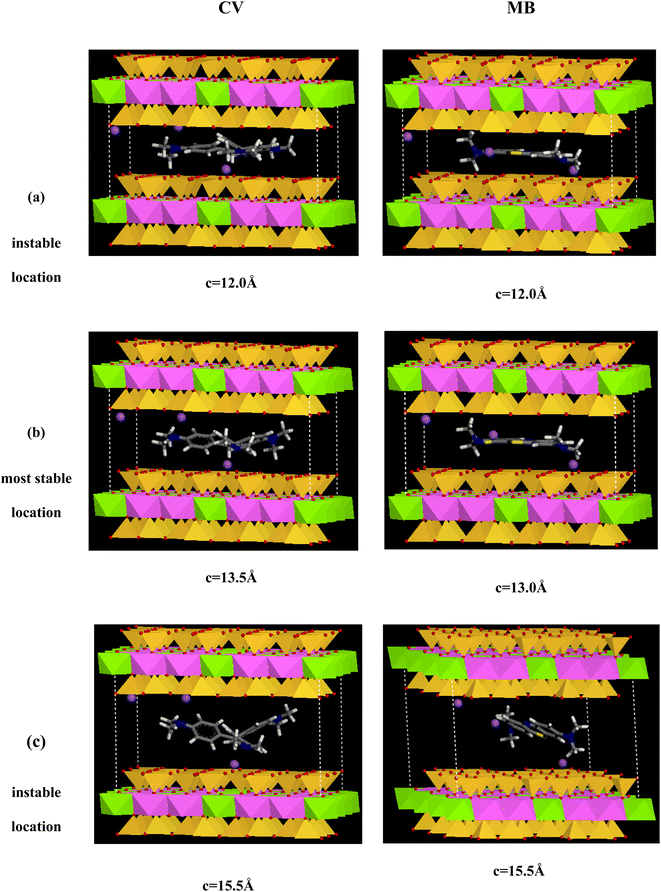
As observed in Fig. 15, an increase of the interlayer space leads to cumulative stabilization of the Mt/CV and Mt MB−1 complexes, since a progressive larger space is available to accommodate the guest CV and MB cations. When the CV and MB cations are loaded in the original montmorillonite framework (of the Mt@AC composite) with initial “c” parameter of 12.0 Å (see Fig. 16a), RDF curve depicted in Fig. 17a reveals too short distances between oxygen atoms of the siloxane interlayer surfaces (OMt) and the different H(C) atoms of both CV (2.41 Å) and MB (2.48 Å) molecules. This causes a significant steric repulsions and thus less stable structures.
The most stable configurations of the Mt/CV and Mt/MB complexes, as calculated by the COMPASS force field, are obtained when CV and MB cations are loaded in the Mt lattice with c values of 13.50 Å and 13.0 Å, respectively (Fig. 16b). In this case, the distances between O–Mt atoms and the H atoms are relatively large (2.81 Å and 3.26 Å for CV and MB respectively as displayed in Fig. 17b). The interlayer space in the Mt lattice seems to be large enough to accommodate the dyes molecules and consequently prevents steric repulsions. The interaction energy Eint values shown in Table 6 indicate stronger interaction of CV with both layers of the Mt lattice (−135.7 kcal mol−1) than that for MB with these layers (−57.9 kcal mol−1). Moreover, van der Waals and electrostatic forces are found to be attractive (have negative values) for the both systems, which indicates high stability of the resulting complexes. However, a decrease in the stability of the Mt/CV and Mt/MB complexes is observed again when the interlayer space is further increased (Fig. 15). RDF results displayed in Fig. 17c which are obtained from analysis of Mt lattice with large interlayer space (c = 15.5 Å as an example) show that H(C) atoms are too far to interact with the OMt atoms (4.23 Å and 4.31 Å for CV and MB, respectively). In this case, the interlayer distance is too large to allow strong interactions, which results in a lower stability of the obtained complexes (Fig. 16c).
4. Conclusion
In this paper, an eco-friendly nanocomposite Mt@AC is synthesized and characterized utilizing the Moroccan natural montmorillonite clay and wheat straw. The nanocomposite is used as potential adsorbent to remove two cationic dyes; methylene blue and crystal violet from aqueous solutions. The removal of the two dyes by adsorption on Mt@AC composite increases with pH and contact time which needs around 30 min for MB dye and 20 min for CV dye to reach equilibrium. The equilibrium adsorption isotherm results correlate well with the Langmuir isotherm model with a maximum adsorption capacity of 801.7 mg g−1 for the MB and 1110.8 mg g−1 for the CV at pH 8. The kinetic data is well fitted with pseudo-first order kinetic model for the two dyes with coefficient of determination R2 close to unity, non-linear chi-square χ2 close to zero and lower Root Mean Square Error RMSE. The intermolecular interaction energy Eint calculations and RDF analysis retrieved from the MD simulations demonstrate a stronger interaction of the CV molecule with both AC sheet and Mt framework as compared with MB. The simulation results are consistent with the experimental outcome, which proves the accuracy and feasibility of the simulation calculation.Conflicts of interest
There are no conflicts to declare.Acknowledgements
We would like to thank Dr Samira Dalbouha from the Faculty of Science Ait Melloul Ibn Zohr University-Morocco for their help and support in the revision phase of this work.References
- R. Haounati, H. Ouachtak, R. El Haouti, S. Akhouairi, F. Largo, F. Akbal, A. Benlhachemi, A. Jada and A. A. Addi, Elaboration and properties of a new SDS/CTAB@Montmorillonite organoclay composite as a superb adsorbent for the removal of malachite green from aqueous solutions, Sep. Purif. Technol., 2021, 255, 117335, DOI:10.1016/j.seppur.2020.117335.
- M. R. Bilad, Membrane bioreactor for domestic wastewater treatment: principles, challenges and future research directions, Indones. J. Sci. Technol., 2017, 2, 97, DOI:10.17509/ijost.v2i1.5993.
- M. Anbia, N. Mohammadi and K. Mohammadi, Fast and efficient mesoporous adsorbents for the separation of toxic compounds from aqueous media, J. Hazard. Mater., 2010, 176, 965–972, DOI:10.1016/j.jhazmat.2009.11.135.
- F. Alakhras, E. Alhajri, R. Haounati, H. Ouachtak, A. A. Addi and T. A. Saleh, A comparative study of photocatalytic degradation of Rhodamine B using natural-based zeolite composites, Surf. Interfaces, 2020, 20, 100611, DOI:10.1016/j.surfin.2020.100611.
- S. Akhouairi, H. Ouachtak, A. A. Addi, A. Jada and J. Douch, Natural Sawdust as Adsorbent for the Eriochrome Black T Dye Removal from Aqueous Solution, Water, Air, Water, Air, Soil Pollut., 2019, 230, 181, DOI:10.1007/s11270-019-4234-6.
- H. Ouachtak, S. Akhouairi, R. Haounati, A. A. Addi, A. Jada, M. L. Taha and J. Douch, 3,4-Dihydroxybenzoic acid removal from water by goethite modified natural sand column fixed-bed: experimental study and mathematical modeling, Desalin. Water Treat., 2020, 194, 439–449, DOI:10.5004/dwt.2020.25562.
- R. El Haouti, H. Ouachtak, A. El Guerdaoui, A. Amedlous, E. Amaterz, R. Haounati, A. A. Addi, F. Akbal, N. El Alem and M. L. Taha, Cationic dyes adsorption by Na-Montmorillonite Nano Clay: Experimental study combined with a theoretical investigation using DFT-based descriptors and molecular dynamics simulations, J. Mol. Liq., 2019, 290, 111139, DOI:10.1016/j.molliq.2019.111139.
- F. Alakhras, H. Ouachtak, E. Alhajri, R. Rehman, G. Al-Mazaideh, I. Anastopoulos and E. C. Lima, Adsorptive Removal of Cationic Rhodamine B Dye from Aqueous Solutions Using Chitosan-Derived Schiff Base, Sep. Sci. Technol., 2022, 57, 542–554, DOI:10.1080/01496395.2021.1931326.
- D. Shen, J. Fan, W. Zhou, B. Gao, Q. Yue and Q. Kang, Adsorption kinetics and isotherm of anionic dyes onto organo-bentonite from single and multisolute systems, J. Hazard. Mater., 2009, 172, 99–107, DOI:10.1016/j.jhazmat.2009.06.139.
- R. Haounati, A. El Guerdaoui, H. Ouachtak, R. El Haouti, A. Bouddouch, N. Hafid, B. Bakiz, D. M. F. Santos, M. Labd Taha, A. Jada and A. Ait Addi, Design of direct Z-scheme superb magnetic nanocomposite photocatalyst Fe3O4/Ag3PO4@Sep for hazardous dye degradation, Sep. Purif. Technol., 2021, 277, 119399, DOI:10.1016/j.seppur.2021.119399.
- C. V. Reddy, R. Koutavarapu, K. R. Reddy, N. P. Shetti, T. M. Aminabhavi and J. Shim, Z-scheme binary 1D ZnWO4 nanorods decorated 2D NiFe2O4 nanoplates as photocatalysts for high efficiency photocatalytic degradation of toxic organic pollutants from wastewater, J. Environ. Manage., 2020, 268, 110677, DOI:10.1016/j.jenvman.2020.110677.
- F. Largo, R. Haounati, S. Akhouairi, H. Ouachtak, R. El Haouti, A. El Guerdaoui, N. Hafid, D. M. F. Santos, F. Akbal, A. Kuleyin, A. Jada and A. A. Addi, Adsorptive removal of both cationic and anionic dyes by using sepiolite clay mineral as adsorbent: Experimental and molecular dynamic simulation studies, J. Mol. Liq., 2020, 318, 114247, DOI:10.1016/j.molliq.2020.114247.
- R. Haounati, F. Alakhras, H. Ouachtak, T. A. Saleh, G. Al-Mazaideh, E. Alhajri, A. Jada, N. Hafid and A. A. Addi, Synthesized of Zeolite@Ag2O Nanocomposite as Superb Stability Photocatalysis Toward Hazardous Rhodamine B Dye from Water, Arabian J. Sci. Eng., 2023, 48, 169–179, DOI:10.1007/s13369-022-06899-y.
- H. Ouachtak, R. El Haouti, A. El Guerdaoui, R. Haounati, E. Amaterz, A. A. Addi, F. Akbal and M. L. Taha, Experimental and molecular dynamics simulation study on the adsorption of Rhodamine B dye on magnetic montmorillonite composite γ-Fe2O3@Mt, J. Mol. Liq., 2020, 309, 113142, DOI:10.1016/j.molliq.2020.113142.
- R. Ait Akbour, H. Ouachtak, A. Jada, S. Akhouairi, A. Ait Addi, J. Douch and M. Hamdani, Humic acid covered alumina as adsorbent for the removal of organic dye from coloured effluents, Desalin. Water Treat., 2018, 112, 207–217, DOI:10.5004/dwt.2018.22006.
- S.-A. Sajjadi, A. Meknati, E. C. Lima, G. L. Dotto, D. I. Mendoza-Castillo, I. Anastopoulos, F. Alakhras, E. I. Unuabonah, P. Singh and A. Hosseini-Bandegharaei, A novel route for preparation of chemically activated carbon from pistachio wood for highly efficient Pb(II) sorption, J. Environ. Manage., 2019, 236, 34–44, DOI:10.1016/j.jenvman.2019.01.087.
- R. A. Raso, M. Zeltner and W. J. Stark, Indoor Air Purification Using Activated Carbon Adsorbers: Regeneration Using Catalytic Combustion of Intermediately Stored VOC, Ind. Eng. Chem. Res., 2014, 53, 19304–19312, DOI:10.1021/ie503851q.
- R. I. Kosheleva, A. C. Mitropoulos and G. Z. Kyzas, Synthesis of activated carbon from food waste, Environ. Chem. Lett., 2019, 17, 429–438, DOI:10.1007/s10311-018-0817-5.
- Y. Ma, Comparison of Activated Carbons Prepared from Wheat Straw via ZnCl2 and KOH Activation, Waste Biomass Valorization, 2017, 8, 549–559, DOI:10.1007/s12649-016-9640-z.
- Y.-P. Huang, C.-H. Hou, H.-C. Hsi and J.-W. Wu, Optimization of highly microporous activated carbon preparation from Moso bamboo using central composite design approach, J. Taiwan Inst. Chem. Eng., 2015, 50, 266–275, DOI:10.1016/j.jtice.2014.12.019.
- P. Nowicki, J. Kazmierczak and R. Pietrzak, Comparison of physicochemical and sorption properties of activated carbons prepared by physical and chemical activation of cherry stones, Powder Technol., 2015, 269, 312–319, DOI:10.1016/j.powtec.2014.09.023.
- R. Zhu, Q. Chen, Q. Zhou, Y. Xi, J. Zhu and H. He, Adsorbents based on montmorillonite for contaminant removal from water: A review, Appl. Clay Sci., 2016, 123, 239–258, DOI:10.1016/j.clay.2015.12.024.
- E. D. Revellame, D. L. Fortela, W. Sharp, R. Hernandez and M. E. Zappi, Adsorption kinetic modeling using pseudo-first order and pseudo-second order rate laws: A review, Clean. Eng.Technol., 2020, 1, 100032, DOI:10.1016/j.clet.2020.100032.
- G. Blanchard, M. Maunaye and G. Martin, Removal of heavy metals from waters by means of natural zeolites, Water Res., 1984, 18, 1501–1507, DOI:10.1016/0043-1354(84)90124-6.
- C. Sheindorf, M. Rebhun and M. Sheintuch, A Freundlich-type multicomponent isotherm, J. Colloid Interface Sci., 1981, 79, 136–142, DOI:10.1016/0021-9797(81)90056-4.
- I. Langmuir, The constitution and fundamental properties of solids and liquids. part i. solids, J. Am. Chem. Soc., 1916, 38, 2221–2295, DOI:10.1021/ja02268a002.
- H. N. Tran, S.-J. You, A. Hosseini-Bandegharaei and H.-P. Chao, Mistakes and inconsistencies regarding adsorption of contaminants from aqueous solutions: A critical review, Water Res., 2017, 120, 88–116, DOI:10.1016/j.watres.2017.04.014.
- J. C. Ng, W. Cheung and G. McKay, Equilibrium Studies of the Sorption of Cu(II) Ions onto Chitosan, J. Colloid Interface Sci., 2002, 255, 64–74, DOI:10.1006/jcis.2002.8664.
- S. Parimal, M. Prasad and U. Bhaskar, Prediction of Equilibrium Sorption Isotherm: Comparison of Linear and Nonlinear Methods, Ind. Eng. Chem. Res., 2010, 49, 2882–2888, DOI:10.1021/ie9013343.
- K. Wang, H. Ma, S. Pu, C. Yan, M. Wang, J. Yu, X. Wang, W. Chu and A. Zinchenko, Hybrid porous magnetic bentonite-chitosan beads for selective removal of radioactive cesium in water, J. Hazard. Mater., 2019, 362, 160–169, DOI:10.1016/j.jhazmat.2018.08.067.
- F. Zahran, H. H. El-Maghrabi, G. Hussein and S. M. Abdelmaged, Fabrication of bentonite based nanocomposite as a novel low cost adsorbent for uranium ion removal, Environ. Nanotechnol., Monit. Manage., 2019, 11, 100205, DOI:10.1016/j.enmm.2018.100205.
- A. Kumar, P. Raizada, P. Singh, R. V Saini, A. K. Saini and A. Hosseini-Bandegharaei, Perspective and status of polymeric graphitic carbon nitride based Z-scheme photocatalytic systems for sustainable photocatalytic water purification, Chem. Eng. J., 2020, 391, 123496, DOI:10.1016/j.cej.2019.123496.
- N. Horri, E. S. Sanz-Pérez, A. Arencibia, R. Sanz, N. Frini-Srasra and E. Srasra, Amine grafting of acid-activated bentonite for carbon dioxide capture, Appl. Clay Sci., 2019, 180, 105195, DOI:10.1016/j.clay.2019.105195.
- S. Saja, A. Bouazizi, B. Achiou, H. Ouaddari, A. Karim, M. Ouammou, A. Aaddane, J. Bennazha and S. Alami Younssi, Fabrication of low-cost ceramic ultrafiltration membrane made from bentonite clay and its application for soluble dyes removal, J. Eur. Ceram. Soc., 2020, 40, 2453–2462, DOI:10.1016/j.jeurceramsoc.2020.01.057.
- A. E. Gabor, C. M. Davidescu, A. Negrea, M. Ciopec, M. Butnariu, C. Ianasi, C. Muntean and P. Negrea, Lanthanum Separation from Aqueous Solutions Using Magnesium Silicate Functionalized with Tetrabutylammonium Dihydrogen Phosphate, J. Chem. Eng. Data, 2016, 61, 535–542, DOI:10.1021/acs.jced.5b00687.
- N. Mojoudi, N. Mirghaffari, M. Soleimani, H. Shariatmadari, C. Belver and J. Bedia, Phenol adsorption on high microporous activated carbons prepared from oily sludge: equilibrium, kinetic and thermodynamic studies, Sci. Rep., 2019, 9, 19352, DOI:10.1038/s41598-019-55794-4.
- J. Bedia, M. Peñas-Garzón, A. Gómez-Avilés, J. J. Rodriguez and C. Belver, Review on Activated Carbons by Chemical Activation with FeCl3, C — J. Carbon Res., 2020, 6, 21, DOI:10.3390/c6020021.
- K. A. Cychosz and M. Thommes, Progress in the Physisorption Characterization of Nanoporous Gas Storage Materials, Engineering, 2018, 4, 559–566, DOI:10.1016/j.eng.2018.06.001.
- H. Ouachtak, A. El Guerdaoui, R. Haounati, S. Akhouairi, R. El Haouti, N. Hafid, A. Ait Addi, B. Šljukić, D. M. F. Santos and M. L. Taha, Highly efficient and fast batch adsorption of orange G dye from polluted water using superb organo-montmorillonite: Experimental study and molecular dynamics investigation, J. Mol. Liq., 2021, 335, 116560, DOI:10.1016/j.molliq.2021.116560.
- E. Al Abbad and F. Alakhras, Removal of Dye Acid Red 1 from Aqueous Solutions Using Chitosan-iso-Vanillin Sorbent Material, Indones, J. Sci. Technol., 2020, 5, 352–365, DOI:10.17509/ijost.v5i3.24986.
- N. Thinakaran, P. Panneerselvam, P. Baskaralingam, D. Elango and S. Sivanesan, Equilibrium and kinetic studies on the removal of Acid Red 114 from aqueous solutions using activated carbons prepared from seed shells, J. Hazard. Mater., 2008, 158, 142–150, DOI:10.1016/j.jhazmat.2008.01.043.
- G. Crini, H. Peindy, F. Gimbert and C. Robert, Removal of C.I. Basic Green 4 (Malachite Green) from aqueous solutions by adsorption using cyclodextrin-based adsorbent: Kinetic and equilibrium studies, Sep. Purif. Technol., 2007, 53, 97–110, DOI:10.1016/j.seppur.2006.06.018.
- H. N. Tran, F. Tomul, N. Thi Hoang Ha, D. T. Nguyen, E. C. Lima, G. T. Le, C.-T. Chang, V. Masindi and S. H. Woo, Innovative spherical biochar for pharmaceutical removal from water: Insight into adsorption mechanism, J. Hazard. Mater., 2020, 394, 122255, DOI:10.1016/j.jhazmat.2020.122255.
- F. Marrakchi, M. J. Ahmed, W. A. Khanday, M. Asif and B. H. Hameed, Mesoporous-activated carbon prepared from chitosan flakes via single-step sodium hydroxide activation for the adsorption of methylene blue, Int. J. Biol. Macromol., 2017, 98, 233–239, DOI:10.1016/j.ijbiomac.2017.01.119.
- M. Hadi, M. R. Samarghandi and G. McKay, Equilibrium two-parameter isotherms of acid dyes sorption by activated carbons: Study of residual errors, Chem. Eng. J., 2010, 160, 408–416, DOI:10.1016/j.cej.2010.03.016.
- K. R. Hall, L. C. Eagleton, A. Acrivos and T. Vermeulen, Pore- and Solid-Diffusion Kinetics in Fixed-Bed Adsorption under Constant-Pattern Conditions, Ind. Eng. Chem. Fundam., 1966, 5, 212–223, DOI:10.1021/i160018a011.
- G. Rytwo, Enthalpies of adsorption of methylene blue and crystal violet to montmorillonite, J. Therm. Anal. Calorim., 2003, 71, 751–759, DOI:10.1023/A:1023309806214.
- J. Gao, Y. Qin, T. Zhou, D. Cao, P. Xu, D. Hochstetter and Y. Wang, Adsorption of methylene blue onto activated carbon produced from tea (Camellia sinensis L.) seed shells: kinetics, equilibrium, and thermodynamics studies, J. Zhejiang Univ., Sci., B, 2013, 14, 650–658, DOI:10.1631/jzus.B12a0225.
- O. Sakin Omer, M. A. Hussein, B. H. M. Hussein and A. Mgaidi, Adsorption thermodynamics of cationic dyes (methylene blue and crystal violet) to a natural clay mineral from aqueous solution between 293.15 and 323.15 K, Arabian J. Chem., 2018, 11, 615–623, DOI:10.1016/j.arabjc.2017.10.007.
- L. Ai and L. Li, Efficient removal of organic dyes from aqueous solution with ecofriendly biomass-derived carbon@montmorillonite nanocomposites by one-step hydrothermal process, Chem. Eng. J., 2013, 223, 688–695, DOI:10.1016/j.cej.2013.03.015.
- M. Sarabadan, H. Bashiri and S. M. Mousavi, Adsorption of crystal violet dye by a zeolite-montmorillonite nano-adsorbent: modelling, kinetic and equilibrium studies, Clay Miner., 2019, 54, 357–368, DOI:10.1180/clm.2019.48.
- Y. Önal, Kinetics of adsorption of dyes from aqueous solution using activated carbon prepared from waste apricot, J. Hazard. Mater., 2006, 137, 1719–1728, DOI:10.1016/j.jhazmat.2006.05.036.
- D. Bahamon, L. Carro, S. Guri and L. F. Vega, Computational study of ibuprofen removal from water by adsorption in realistic activated carbons, J. Colloid Interface Sci., 2017, 498, 323–334, DOI:10.1016/j.jcis.2017.03.068.
- A. K. Rappe, C. J. Casewit, K. S. Colwell, W. A. Goddard and W. M. Skiff, UFF, a full periodic table force field for molecular mechanics and molecular dynamics simulations, J. Am. Chem. Soc., 1992, 114, 10024–10035, DOI:10.1021/ja00051a040.
- S. I. Tsipursky and V. A. Drits, The distribution of octahedral cations in the 2:1 layers of dioctahedral smectites studied by oblique-texture electron diffraction, Clay Miner., 1984, 19, 177–193, DOI:10.1180/claymin.1984.019.2.05.
- A. M. M. Vargas, A. L. Cazetta, M. H. Kunita, T. L. Silva and V. C. Almeida, Adsorption of methylene blue on activated carbon produced from flamboyant pods (Delonix regia): Study of adsorption isotherms and kinetic models, Chem. Eng. J., 2011, 168, 722–730, DOI:10.1016/j.cej.2011.01.067.
- C. Moreno-Castilla, Adsorption of organic molecules from aqueous solutions on carbon materials, Carbon, 2004, 42, 83–94, DOI:10.1016/j.carbon.2003.09.022.
- H. Sun, COMPASS: An ab Initio Force-Field Optimized for Condensed-Phase ApplicationsOverview with Details on Alkane and Benzene Compounds, J. Phys. Chem. B, 1998, 102, 7338–7364, DOI:10.1021/jp980939v.
Footnote |
| † Electronic supplementary information (ESI) available. See DOI: https://doi.org/10.1039/d2ra08059a |
| This journal is © The Royal Society of Chemistry 2023 |

