 Open Access Article
Effect of autohydrolysis and ionosolv treatments on eucalyptus fractionation and recovered lignin properties†
Antonio Ovejero-Pérez *,
Victoria Rigual
 ,
Juan C. Domínguez
 ,
M. Virginia Alonso,
Mercedes Oliet
 and
Francisco Rodriguez
Department of Chemical Engineering and Materials, Complutense University of Madrid, 28040 Madrid, Spain. E-mail: antonioo@ucm.es
First published on 3rd April 2023
Abstract
Wood fractionation is key for the integral valorization of its three main components. In this sense, recovering the hemicellulosic fraction after the ionosolv treatment of lignocellulosic materials is one of the main drawbacks of this process. Thus, the incorporation of a previous autohydrolyisis step to recover the hemicellulosic sugars before the ionosolv treatment is an interesting approach. The influence of both treatments, autohydrolysis and ionosolv, on the biomass fractions recovery yields was studied by a central composite design of experiments, varying the autohydrolysis temperature in a 175–195 °C range and ionosolv time between 1–5 h. Lignin recovery and cellulose purity were maximized at 184 °C and 3.5 h of autohydrolysis temperature and ionosolv time, respectively. In addition, lignin properties were incorporated to the statistical model, revealing lignin recondensation at severe conditions and a higher influence of the ionosolv treatment on lignin characteristics. These results remarked the importance of studying the effect of both treatments in the whole fractionation process and not each process separately and enhanced the understanding of the treatments combination in a complete fractionation biorefinery approach.
1 Introduction
Over the last years, energy consumption has increased due to the technological advances in our world, causing an increment in fossil fuel utilization, decreasing fossil fuel reserves and increasing the level of greenhouse gas emissions, which has raised the Earth's average temperature by 1.9 °C above pre-industrial levels.1–3 To overcome this, biorefinery emerged as one of the most interesting alternatives, considering biomass utilization as substitute of fossil fuels.4,5 One of the most employed biomass sources is the lignocellulosic biomass due to its availability, abundance, and the fact that it does not conflict with the food sector. It is also cheaper than other types of agricultural raw materials, can be produced locally and has low nitrogen and sulfur contents.5,6 Its exploitation can be done through different approaches, being the biomass fractionation into its main components one of the most promising ones, and thus developing technically and economically viable processes for a biorefinery based on cellulose, hemicellulose, and lignin.7 A correct fractionation of lignocellulosic biomass is a key step in achieving economically competitive biorefineries, being able to produce fuels, chemical products, and high value-added materials.8Among the main biomass components, lignin has been underutilized and just burned for energy, leading to an ineffective economic efficiency.8,9 After cellulose, lignin is the second-most abundant biopolymer on Earth, making up 15–30% (w/w) of lignocellulosic biomass.10 In addition, it is the biggest biosource of aromatic compounds, which has led to growing interest in its economically competitive utilization.11,12 Lignin presents an heterogeneous structure and composition; thus, it can be employed in many different applications, for example, as a source of carbon fibers that can be mixed with biopolymers to enhance lithium-ion battery performance, dispersants, thermal reinforcements, coatings, adhesives, and as a source of platform chemicals (xylene, benzene, vanillin, etc.).13–18 It has also been used in the medical field, for example, in the formulation of hydrogels that can be employed as wound dressings, or as an additive in tablet formulation for drug release.19–22 Lately, lignin has attracted great attention in the formulation of lignin nanoparticles, overcoming the existing limitations for its employment (high heterogeneity, large particle size, among others).23
Different processes have been proposed over the last years for lignin isolation and recovery, being one of them the ionosolv process. This process involves the (partial) solubilization of lignin and hemicellulose employing ionic liquids, while the cellulose fraction remains practically intact, making possible to recover the biomass fractions separately for valorization.24,25 Then, lignin can be precipitated, using water as an antisolvent.26 The ionosolv process has been successfully employed with hardwoods, softwoods, and herbaceous woods, obtaining yields of up to 90% lignin recovery.27–33 However, the hemicellulosic fraction is normally difficult to recover after the ionosolv treatment, making the fractionation process less efficient. In this sense, the incorporation of a previous autohydrolysis step to recover hemicelluloses seems an interesting option.
Autohydrolysis is one of the most widely used physicochemical treatments for the extraction of hemicelluloses from lignocellulosic biomass since it only uses water without any catalyst, which makes it attractive from an economic and environmental point of view.34 The solubilization of hemicelluloses occurs by the action of hydronium ions from water and the release of acetic acid from the hemicelluloses in the biomass, which act as autocatalysts of the process.35,36 By means of autohydrolysis, a high recovery of hemicelluloses can be achieved in the liquid phase, being able to solubilize and recover between 50 and 90% of them.37,38
In this work, the combination of autohydrolysis + ionosolv treatments to completely fractionate eucalyptus wood was studied, analyzing the influence of both processes on the recovered fractions. A central composite design of experiments was performed with autohydrolyisis temperature, in the range of 175–195 °C, and ionosolv time, 1–5 h, as factors was performed. Hemicelluloses recovery, lignin and cellulose recoveries, and cellulose purity were set as the main responses. In addition, the recovered lignins were characterized in terms of thermal stability and molecular weight distribution. Although this is not the first time that autohydrolysis and ionosolv treatments are combined, it has always been done towards enhancing enzymatic digestibility, and not in a biomass fractionation concept. Thus, this works offers a first approach to a combined fractionation process and enhances the understanding of the influence of autohydrolysis and ionosolv treatments on both the fractionation efficiency and the recovered fraction characteristics.
2 Materials and methods
2.1 Materials
Eucalyptus globulus was used as feedstock and was provided by CIFOR-INIA (“Centro de Investigación Forestal-Instituto Nacional de Investigación y Tecnología Agraria y Alimentaria”, in Spain). The ionic liquid 1-methylimidazolium chloride ([Mim][Cl], 98% purity) was supplied by Iolitec GmbH. Ethanol was used as antisolvent and supplied by Panreac (96% purity). N,N-Dimethylformamide (DMF, ≥99.9%, Panreac) and ReadyCal Kit PMMA standards (Polymer Standards Service GmbH) were used in GPC analysis.2.2 Design of experiments and statistical analysis
In order to study the influence of the different process variables in the combined fractionation process configuration of autohydrolysis + ionosolv, a 22 with 4 axial points and center point triplicates central composite design using response surface methodology was employed. The studied factors were the autohydrolysis temperature (TAH) and the ionosolv treatment time (tiono). Hemicellulose recovery (only affected by the first step), lignin recovery, cellulose recovery, and cellulose purity were selected as responses. This selection also remarks the importance of studying the fate of the cellulosic fraction in a fractionation process. In addition, some lignin characterization responses, such as weight-average molecular weight, polydispersity, and degradation temperature at 10% weight loss, were also included.All the data from the design were statistically analyzed to study the influence of each factor on the fractionation responses and model and optimize the autohydrolysis + ionosolv process. ANOVA was performed in the central composite design. All the statistical tests were done using the OriginPro software.
2.3 Autohydrolysis step
The autohydrolysis treatment was carried out in a 450 mL Parr reactor (Parr Instrument Company, Moline, IL, USA) with a turbine impeller stirrer. Previous autohydrolysis tests were performed to set the autohydrolysis temperature range for the design of experiments of the treatments' combination. Water and raw eucalyptus were mixed in a liquid to solid ratio of 5 kg of water per kg of wood. The mixture was heated up to 165, 175, 185, 195, and 205 °C during 50 min at a constant rate. Then, the set point temperature was maintained for 30 min and cooled at the maximum possible cooling rate (approximately 15 °C min−1). The corresponding severity factors were 3.42, 3.72, 4.00, 4.26, and 4.57 for the selected temperatures. The detailed temperature profile can be found in Fig. S1 in the ESI.† After pretreatment, the solid and liquid phases were separated by vacuum filtration. The solid phase was washed with water, employing twice the volume used for the autohydrolysis treatment. The hemicellulose-free solid was freeze dried and characterized, following the NREL/TP-510-42618 procedure.39 The composition of the resulting liquid phase was determined following the NREL/TP-510-42623 procedure.402.4 Ionosolv treatment
The ionosolv treatment was performed in 25 mL glass reactors with anchor stirrer due to the high viscosity of the wood/protic ionic liquid (PIL) mixture. The PIL [Mim][Cl] was mixed with the autohydrolyzed wood at a 10% (w/w) biomass loading and heated up to 135 °C, according to our previous work, using a silicone bath and run during different treatment times (see Table 2).41 After the ionosolv treatment, 0.5 g of pure ethanol per g PIL were added as antisolvent to precipitate a cellulose rich fraction (CRF). The precipitated solid was washed with 2 g of ethanol per g of PIL for each washing step until no PIL was observed in the washing fractions (conductivity of washing fractions approximately 0.3 μS cm−1). The CRF was vacuum dried at 70 °C and stored for further analysis. The ethanol of the PIL/ethanol resulting mixture was removed by vacuum distillation and 3 g of water per g PIL were added as antisolvent to precipitate a lignin fraction which was freeze dried and stored for further analysis. Both solid fractions were characterized following the NREL/TP-510-42618 procedure adapted to small amounts of sample.39,422.5 Analytical methods
![[thin space (1/6-em)]](https://www.rsc.org/images/entities/char_2009.gif) 200
200![[thin space (1/6-em)]](https://www.rsc.org/images/entities/char_2009.gif) 000 Da) from Polymer Standards Service GmbH were used for the equipment calibration. All samples were prepared at a concentration of 1 mg mL−1 and filtered (PTFE, 0.22 μ m filters) before analysis.
000 Da) from Polymer Standards Service GmbH were used for the equipment calibration. All samples were prepared at a concentration of 1 mg mL−1 and filtered (PTFE, 0.22 μ m filters) before analysis.3 Results and discussion
3.1 Autohydrolysis temperature (TAH) and ionosolv time (tiono) interval selection
A previous study of autohydrolysis with eucalyptus wood in the range of 165–205 °C was carried out to determine the temperature operating range in the design of experiments for the autohydrolysis + ionosolv treatments combination. The composition of the obtained liquors is shown in Table 1.| Compound | 165 °C | 175 °C | 185 °C | 195 °C | 205 °C |
|---|---|---|---|---|---|
| a Calculated regarding to total hemicelluloses present in eucalyptus wood. | |||||
| Gluco-oligosaccharides | 0.74 | 0.96 | 1.37 | 1.28 | 1.84 |
| Xylo-oligosaccharides | 21.97 | 26.10 | 17.99 | 5.49 | 1.51 |
| Galacto-oligosaccharides | 3.16 | 2.85 | 1.86 | 0.70 | 0.62 |
| Arabino-oligosaccharides | 0.32 | 0.25 | 0.14 | 0.13 | 0.02 |
| Manno-oligosaccharides | 0.38 | 1.35 | 1.49 | 0.62 | 0.35 |
| Glucose | 0.17 | 0.26 | 0.46 | 1.25 | 2.57 |
| Xylose | 0.87 | 5.01 | 12.58 | 14.12 | 5.41 |
| Galactose | 1.18 | 2.13 | 2.78 | 2.62 | 1.39 |
| Arabinose | 0.86 | 0.87 | 0.76 | 0.57 | 0.25 |
| Mannose | 0.41 | 0.11 | 0.39 | 1.13 | 0.65 |
| Formic acid | 0.05 | 0.15 | 0.60 | 0.66 | 0.78 |
| Acetic acid | 0.95 | 2.09 | 4.20 | 6.74 | 8.70 |
| 5-Hydroxymethylfurfural | 0.03 | 0.11 | 0.27 | 0.70 | 1.91 |
| Furfural | 0.06 | 0.36 | 1.23 | 3.13 | 5.12 |
| Hemicelluloses recovery (%)a | 58.98 | 85.21 | 87.45 | 58.49 | 23.96 |
Hemicelluloses concentration increased with treatment temperature up to a maximum at 185 °C, indicating a higher sugar solubilization and conversion to their dissolved oligomers and to monomeric sugars. This behavior can be most clearly observed in xylo-oligosaccharides and xylose, due to the composition of eucalyptus hemicelluloses (mostly xylan). A xylo-oligosaccharides concentration maximum of 26.10 g L−1 can be found at 175 °C, then decreasing. The concentration of free xylose increased to 14.12 g L−1 at 195 °C. This fact is due to a higher conversion of xylo-oligosaccharides to xylose with increasing temperature. However, the xylose concentration decreased significantly at 205 °C, dropping to 5.41 g L−1. An increase in the furfural concentration was also observed since it is the main dehydration product of pentoses. As for glucose, an increase in the concentration of gluco-oligosaccharides and glucose was observed with temperature. However, the concentrations of both gluco-oligosaccharides and glucose are lower than 3 g L−1, reflecting that the structural glucan was not solubilized.45
Considering the hemicellulose recovery yields (Table 1), calculated as the total hemicellulosic sugar content in the autohydrolysis liquor compared to the hemicellulose content in the raw material, a maximum of 87.4% is observed at 185 °C. Recovery yields of 85.2 and 58.5% were obtained at 175 °C and 195 °C, respectively, indicating that the maximum recovery of hemicelluloses is in that range. Therefore, this range of autohydrolysis temperatures was selected for the design of experiments for the autohydrolysis + ionosolv treatments combination. This response was selected as the main one in the autohydrolysis step since no specific applications are considered in this work for the hemicellulosic fraction, so our goal was to maximize the total sugar recovery.
As for the ionosolv time, the interval was selected according to our previous work with the same ionic liquid and autohydrolyzed poplar wood, a very similar hardwood, stablishing an ionosolv treatment time interval of 1–5 h.46 The levels of the selected factors of this work are shown in Table 2.
| Factors | Responses | |||||
|---|---|---|---|---|---|---|
| Run no. | TAH (°C) | tiono (h) | RecHEMa (%) | RecLIGb (%) | RecCRFc (%) | LCRFd |
| a g recovered hemicelluloses/100 g of hemicelluloses in eucalyptus.b g lignin/100 g lignin in autohydrolyzed eucalyptus.c g CRF/100 g of autohydrolyzed eucalyptus.d g lignin/100 g CRF, calculated from NREL/TP-510-42618 procedure. | ||||||
| 1 | 175 | 1 | 85.21 | 41.81 | 58.52 | 10.00 |
| 2 | 195 | 1 | 58.49 | 54.35 | 62.84 | 11.73 |
| 3 | 185 | 3 | 87.45 | 57.51 | 55.92 | 9.18 |
| 4 | 175 | 5 | 85.21 | 59.94 | 54.78 | 11.34 |
| 5 | 195 | 5 | 58.49 | 64.34 | 58.30 | 12.21 |
| 6 | 185 | 3 | 87.45 | 59.01 | 54.25 | 10.70 |
| 7 | 170.9 | 3 | 84.73 | 54.08 | 58.72 | 11.73 |
| 8 | 199.1 | 3 | 52.52 | 54.50 | 58.02 | 11.39 |
| 9 | 185 | 0.17 | 87.45 | 36.16 | 72.27 | 18.00 |
| 10 | 185 | 5.83 | 87.45 | 68.20 | 55.87 | 13.92 |
| 11 | 185 | 3 | 87.45 | 55.32 | 58.62 | 10.03 |
3.2 Influence of TAH and tiono on hemicelluloses, lignin, and cellulose recoveries and cellulose purity
The results of the hemicelluloses recovery (RecHEM), lignin recovery (RecLIG), CRF recovery (RecCRF) and lignin content in CRF (LCRF) are shown in Table 2. It was possible to calculate statistical regressions for each of them. Details of the statistical regressions can be found in ANOVA table in Table S1 in the ESI.† All regressions passed the F test.| RecHEM = 85.64–11.93·TAH − 10.11·T2AH | (1) |
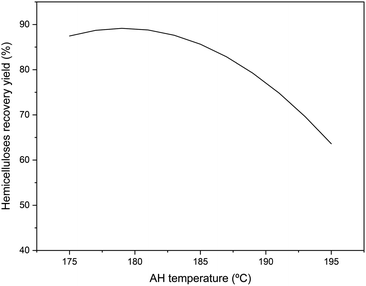 | ||
| Fig. 1 Representation of statistical adjustment of hemicelluloses recovery as a function of autohydrolysis temperature. | ||
Hemicelluloses recovery yield followed a similar trend as described in the previous section for the recovery of sugars and oligosaccharides with temperature, reaching a maximum at 180 °C with a recovery yield of 89.07%, and then decreasing due to the degradation of sugars into furanic and acidic compounds.36,47 The trend observed here is similar to those described by other authors employing hardwoods as raw material at temperatures between 130–30 °C, increasing the concentration of hemicelluloses with the treatment temperature up to a maximum, subsequently decreasing due to their depolymerization and degradation to acids and furanic compounds.36,47–49
| RecLIG = 5.77 + 2.19·TAH + 9.18·tiono | (2) |
| RecCRF = 56.79 + 0.85·TAH − 3.93·tiono + 3.03·t2iono | (3) |
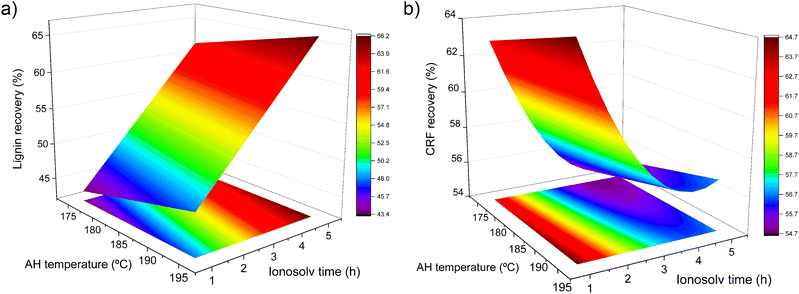
In the regression eqn (3) and in Fig. 2a, it is observed that the ionosolv treatment time has a greater influence than the autohydrolysis temperature on lignin recovery. Thus, for an ionosolv time of 1 h, approximately 40% of lignin is recovered, compared to 5 h, where approximately 60% is recovered, for an autohydrolysis temperature of 175 °C, whereas approximately 45% and 65% of lignin is recovered at 1 and 5 h, respectively, for an autohydrolysis temperature of 195 °C. Lignin recovery always increases with increasing ionosolv time, without an observed maximum. We have observed in a previous work, with the same ionic liquid and eucalyptus as feedstock, that greatly increasing ionosolv time leads to a decrease in lignin recovery.41 This is caused by the formation of different degradation products that can act as inhibitors and possible degradation of the ionic liquid.50 However, in this case, there is not a maximum in this response, which indicates that either the operating conditions are not severe enough to decrease lignin recovery or some of those degradation products are precipitating with the lignin fraction. This could not be verified by the compositional analysis since these degradation products are measured as Klason lignin by the NREL/TP-510-42618 procedure.
The autohydrolysis temperature presents a low influence on CRF recovery (Fig. 2b), although a slight slope is observed on that axis. With increasing ionosolv treatment time, CRF recovery decreased to a minimum at around 3 h, reaching a value of 54.25% and increasing thereafter. This is due to the precipitation of degradation and condensation products with the CRF under severe treatment conditions. This fact that was already observed by Tu et al.51 As a consequence, cellulose purity decreased from this point, making it more difficult to valorize it, as will be shown below.
| LCRF = 10.17–0.17·tiono + 2.31·t2iono | (4) |
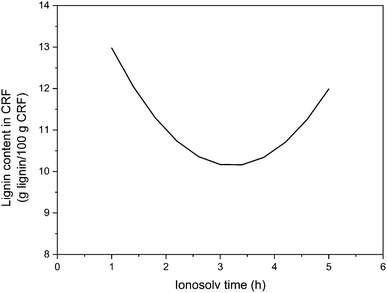 | ||
| Fig. 3 Representation of statistical adjustment of lignin content in the cellulose rich fraction as a function of ionosolv time. | ||
A minimum lignin content was observed around 3 h of ionosolv treatment, a condition that maximized CRF purity, obtaining an experimental lignin content of 9.18 g lignin/100 g CRF. From this point on, the lignin content increases with ionosolv treatment time, probably due to pseudolignin precipitation with increasing treatment severity.51 This result justifies the aforementioned fact that CRF recovery increases at higher ionosolv treatment severities as pseudolignin precipitates with CRF, formed by degraded and recondensed products.
3.3 Optimization and validation
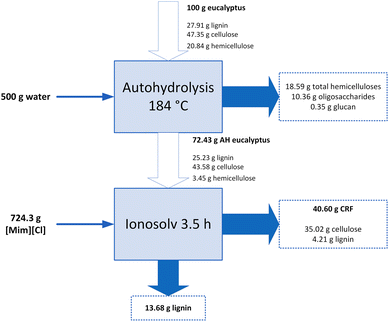
The process combination proposed in this work is an interesting alternative for wood fractionation, and specially for lignin isolation. Therefore, the operating conditions need to be optimized to maximize lignin recovery and minimize lignin content in CRF. From Fig. 1–3, it was found that lignin recovery could be maximized while maintaining a low lignin content in the CRF at a TAH of 184 °C and tiono of 3.5 h. Under these conditions, the statistical model predicted a 56.85% of lignin recovery, with a 10.19% of lignin in the CRF. In addition, a 55.91% of CRF and an 86.73% of hemicelluloses are predicted to be recovered after the ionosolv treatment and in the autohydrolysis liquid phase, respectively.To validate the predicted operating conditions, an additional experiment was carried out at a TAH of 184 °C and tiono of 3.5 h. Thus, 89.22% of the hemicelluloses, 54.23% of lignin, and 56.05% of CRF were recovered, with a 10.38% lignin content in the CRF. All these results are within a 5% interval of the predicted values, indicating a good accuracy of the statistical model. The mass balance of the combined fractionation process under these conditions is depicted in Fig. 4.
The raw eucalyptus wood was fractionated into its three main components: hemicelluloses, cellulose, and lignin. The first autohydrolysis step made possible to recover 18.59 g of hemicelluloses/100 g of eucalyptus, with almost no glucan solubilization in this step and negligible lignin losses. 72.43 g of autohydrolyzed eucalyptus/100 g of wood were recovered, with a very low hemicelluloses content. Then, this solid was separated into lignin and a cellulose-rich fraction. 40.60 g of CRF/100 g of eucalyptus were recovered, of which only 4.21 g were lignin, indicating a high glucan purity. 13.68 g lignin/100 g eucalyptus were recovered in another fraction, with no sugars in it. It can be observed that there were still some unrecovered glucan and lignin after the ionosolv step, indicating that they were possibly degraded into furanic and phenolic compounds, respectively, which could present a high added value. However, these could not be measured because of their low concentrations in the ionic liquid phase.
3.4 Effect of TAH and tiono on lignin properties
The recovered lignins after the combination of AH + ionosolv treatments were characterized to study the influence of autohydrolysis temperature and ionosolv treatment time on molecular weight distribution, thermal stability, and chemical structure. The thermograms and the molecular weight distributions are exhibited in Fig. 5. From them, the mass average molecular weight (Mw), polydispersity index (PDI), and degradation temperature at 10% mass loss (TD10%) were calculated and are shown in Table 3. They were incorporated into the central composite design so the data could be statistically adjusted, and response surfaces represented. The ANOVA table can be found in Table S3 in the ESI.† All regressions passed the F test, and a 95% confidence interval was selected, so effects with a P > 0.05 were not considered.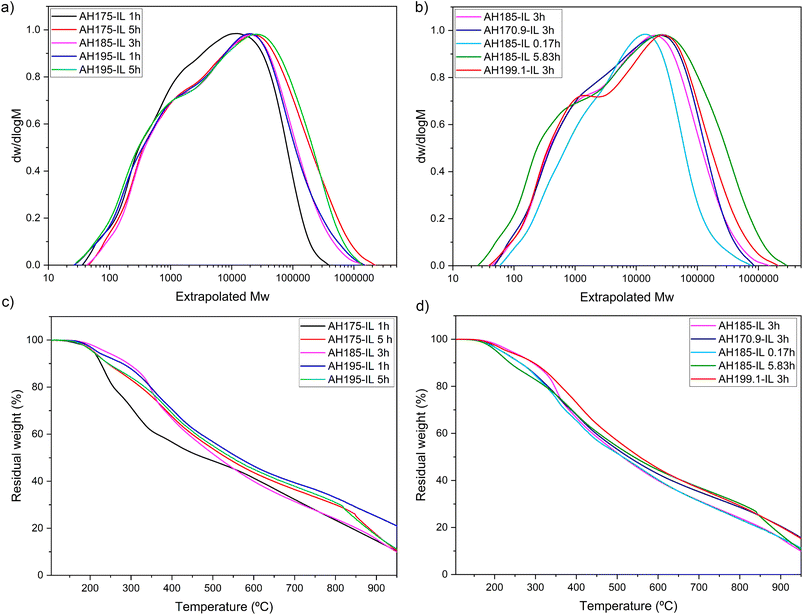 | ||
| Fig. 5 Representation of (a) and (b) molecular weight distributions (c) and (d) thermograms of the recovered lignins. | ||
| Factors | Responses | ||||
|---|---|---|---|---|---|
| Run no. | TAH (°C) | tiono (h) | Mw (Da) | PDIa | TD10% (°C) |
| a Mw/Mn. | |||||
| 1 | 175 | 1 | 17![[thin space (1/6-em)]](https://www.rsc.org/images/entities/char_2009.gif) 853 853 |
18.57 | 226 |
| 2 | 195 | 1 | 36![[thin space (1/6-em)]](https://www.rsc.org/images/entities/char_2009.gif) 055 055 |
37.73 | 280 |
| 3 | 185 | 3 | 22![[thin space (1/6-em)]](https://www.rsc.org/images/entities/char_2009.gif) 720 720 |
24.90 | 293 |
| 4 | 175 | 5 | 56![[thin space (1/6-em)]](https://www.rsc.org/images/entities/char_2009.gif) 714 714 |
42.16 | 243 |
| 5 | 195 | 5 | 46![[thin space (1/6-em)]](https://www.rsc.org/images/entities/char_2009.gif) 473 473 |
46.65 | 245 |
| 6 | 185 | 3 | 28![[thin space (1/6-em)]](https://www.rsc.org/images/entities/char_2009.gif) 748 748 |
26.75 | 294 |
| 7 | 170.9 | 3 | 31![[thin space (1/6-em)]](https://www.rsc.org/images/entities/char_2009.gif) 854 854 |
25.79 | 262 |
| 8 | 199.1 | 3 | 49![[thin space (1/6-em)]](https://www.rsc.org/images/entities/char_2009.gif) 719 719 |
34.46 | 296 |
| 9 | 185 | 0.17 | 20![[thin space (1/6-em)]](https://www.rsc.org/images/entities/char_2009.gif) 902 902 |
14.33 | 262 |
| 10 | 185 | 5.83 | 71![[thin space (1/6-em)]](https://www.rsc.org/images/entities/char_2009.gif) 527 527 |
75.62 | 237 |
| 11 | 185 | 3 | 26![[thin space (1/6-em)]](https://www.rsc.org/images/entities/char_2009.gif) 058 058 |
26.32 | 293 |
Mw (Da) = 25![[thin space (1/6-em)]](https://www.rsc.org/images/entities/char_2009.gif) 734 + 15 734 + 15![[thin space (1/6-em)]](https://www.rsc.org/images/entities/char_2009.gif) 109·tiono + 6469·T2AH + 9183·t2iono − 7110·TAH 109·tiono + 6469·T2AH + 9183·t2iono − 7110·TAH
| (5) |
| PDI = 27.92 + 14.90·tiono + 8.47·t2iono | (6) |
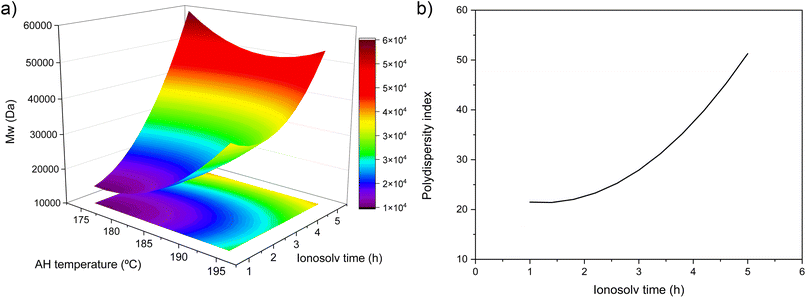 | ||
| Fig. 6 (a) Response surface plot for Mw and (b) representation of statistical adjustment polydispersity index as a function of ionosolv time. | ||
From the molecular weight distributions (Fig. 5a and b) and the representation of Mw as a function of TAH and tiono (Fig. 6a), it can be observed how the mass average molecular weight increased with ionosolv time, whose effect is more remarkable than the autohydrolysis temperature (eqn (6)). The maximum Mw value of 60![[thin space (1/6-em)]](https://www.rsc.org/images/entities/char_2009.gif) 000 Da was obtained at an autohydrolysis temperature of 175 °C and an ionosolv time of 5 h. The effect of autohydrolysis temperature is more significant at ionosolv treatment times shorter than 2 h, indicating a greater dominance of the latter over the Mw at longer times, as was already the case for lignin recovery (Fig. 2a). The increase in molecular weight with ionosolv time was already observed in our previous work with eucalyptus and the same ionic liquid.41 This fact is due to the recondensation of lignins in acidic medium with increasing treatment severity.52 On the other hand, the increase of the average molecular weight with autohydrolysis temperature at short ionosolv times is probably related to the recondensation of lignin on the surface of the autohydrolyzed material at severe autohydrolysis conditions, above 185 °C, so the lignin extracted by the ionic liquid was already recondensed before the ionic liquid acted.53
000 Da was obtained at an autohydrolysis temperature of 175 °C and an ionosolv time of 5 h. The effect of autohydrolysis temperature is more significant at ionosolv treatment times shorter than 2 h, indicating a greater dominance of the latter over the Mw at longer times, as was already the case for lignin recovery (Fig. 2a). The increase in molecular weight with ionosolv time was already observed in our previous work with eucalyptus and the same ionic liquid.41 This fact is due to the recondensation of lignins in acidic medium with increasing treatment severity.52 On the other hand, the increase of the average molecular weight with autohydrolysis temperature at short ionosolv times is probably related to the recondensation of lignin on the surface of the autohydrolyzed material at severe autohydrolysis conditions, above 185 °C, so the lignin extracted by the ionic liquid was already recondensed before the ionic liquid acted.53
The PDI value (Fig. 6b) increased with ionosolv treatment time. This fact corroborates the recondensation of lignin with increasing ionosolv treatment time, which would cause the lignins recovered under these severe conditions (times longer than 3 h) to present a heterogeneous structure, probably making their valorization difficult. The recondensation of lignin in acidic media is associated to the breaking of C–O bonds and the formation of C–C bonds, resulting in more thermally and chemically stable lignins.52,54 It is striking that PDI does not depend on the autohydrolysis temperature when Mw does. This fact reflects that the autohydrolysis treatment modifies the Mn value in the same way it modifies the Mw and thus not having an influence on PDI.
Comparing the molecular weights and polydispersity indexes obtained by combining the autohydrolysis + ionosolv treatments with eucalyptus wood with those obtained with the ionosolv treatment alone using the same ionic liquid and eucalyptus wood, it can be observed that the inclusion of a previous autohydrolysis stage produces lignins with similar average molecular weights, between 10![[thin space (1/6-em)]](https://www.rsc.org/images/entities/char_2009.gif) 000 and 100
000 and 100![[thin space (1/6-em)]](https://www.rsc.org/images/entities/char_2009.gif) 000 Da in both cases, but higher PDI values (2–18 without autohydrolysis step vs. 18–75 with it).41 This has also been observed with different ionic liquids and raw materials. For example, the employment of protic ionic liquids with different chain lengths with anions derived from organic acids and sugarcane bagasse lead to the recovery of lignins with similar molecular weights (5000–20
000 Da in both cases, but higher PDI values (2–18 without autohydrolysis step vs. 18–75 with it).41 This has also been observed with different ionic liquids and raw materials. For example, the employment of protic ionic liquids with different chain lengths with anions derived from organic acids and sugarcane bagasse lead to the recovery of lignins with similar molecular weights (5000–20![[thin space (1/6-em)]](https://www.rsc.org/images/entities/char_2009.gif) 000 Da) but with much lower PDI (7.1 as maximum).55 Similar results were observed with an hydrogensulfate-based ionic liquids and miscanthus, recovering lignins with similar Mw but lower PDI (maximum of 4).30 This indicates that the autohydrolysis stage is favoring the deposition of recondensed and heterogeneous lignin particles on the surface of eucalyptus wood, leading to the recovery of lignins with very high PDI, even in lignins with low molecular weights (around 10
000 Da) but with much lower PDI (7.1 as maximum).55 Similar results were observed with an hydrogensulfate-based ionic liquids and miscanthus, recovering lignins with similar Mw but lower PDI (maximum of 4).30 This indicates that the autohydrolysis stage is favoring the deposition of recondensed and heterogeneous lignin particles on the surface of eucalyptus wood, leading to the recovery of lignins with very high PDI, even in lignins with low molecular weights (around 10![[thin space (1/6-em)]](https://www.rsc.org/images/entities/char_2009.gif) 000–30
000–30![[thin space (1/6-em)]](https://www.rsc.org/images/entities/char_2009.gif) 000 Da), hindering their utilization as a base chemical compound and directing their utilization to the reinforcement of materials, or dispersant.15,16,18,56
000 Da), hindering their utilization as a base chemical compound and directing their utilization to the reinforcement of materials, or dispersant.15,16,18,56
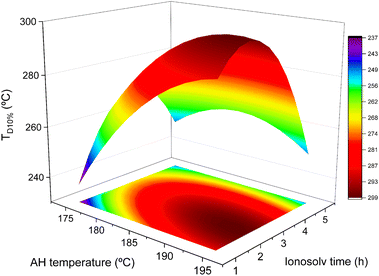
| TD10% (°C) = 293 + 13.01·TAH − 6.67·tiono − 10.94·T2AH − 25.69·t2iono − 13·TAH·tiono | (7) |
The degradation temperature at 10% mass loss of lignins (Fig. 7) increased with autohydrolysis temperature and ionosolv time up to a maximum of 297 °C at an autohydrolysis temperature of 190 °C and an ionosolv time of 2 h. TD10% does not decrease at autohydrolysis temperatures higher than 190 °C, which indicates that the autohydrolysis step is causing the deposition of recondensed lignins in the material surface, as it was stated before, a fact that is associated with a decrease in the relative content of C–O bonds and an increase in C–C bonds, resulting in more thermally stable lignins.57 Lignin recondensation was also observed with ionosolv time, causing the aforementioned increase on thermal stability. However, at ionosolv times longer than 3 h, TD10% decreased for every TAH, a fact that is possibly related to the recovery of pseudolignin and degradation products at long ionosolv times, as commented in Section 3.2.2. It is also important to remark that due to the negligible sugar content in the recovered lignins, the observed differences are due to the lignin structure. The lowest TD10% obtained was 226 °C at 175 °C and 1 h. This value is higher than that obtained for lignins from Kraft and organosolv processes (around 220 °C) with poplar wood, indicating that the combination of autohydrolysis + ionosolv treatments produces, at least, equally thermally stable lignins in the worst case scenario.58 Comparing these lignins to those obtained without a previous autohydrolysis stage and the same ionic liquid with eucalyptus, it is clear that the inclusion of an autohydrolysis step produces lignins with higher thermal stabilities (TD10% = 225–265 °C vs. 226–293 °C), a fact that remarks their possible utilization as a reinforcement in biomaterials.56,59,60
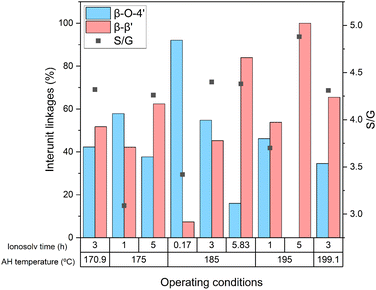
Comparing the results obtained for different ionosolv times at the same autohydrolysis temperature, it can be seen that increasing treatment time produced a β-O-4′ linkages degradation with an enrichment in β-β′ ones. This increase in resinol substructures supports the previously mentioned lignin recondensation and, consequently, an increase in the molecular weight of lignin and thermal stability. Similar findings have been reported using different imidazolium-based ionic liquids to depolymerize lignin from poplar, eucalyptus, and model compounds.41,61,62 Autohydrolysis temperature presented a similar effect at temperatures above 185 °C, recovering lignins with higher β-β′ content at higher autohydrolysis temperatures. This effect supports the higher thermal stability of lignins recovered at increasing autohydrolysis temperatures and the augment of Mw due to lignin recondensation in the autohydrolysis step that was anticipated before in Section 3.4.1.
Attending to the relative proportion of S and G units, S units were predominant as it is the main structural unit in hardwoods.63,64 The calculated S/G ratios were similar to that of the MWL lignin of the same eucalyptus species (3.7).41 S/G ratio increased from 1 to 3 h and then, excepting the lignin recovered at an autohydrolysis temperature of 195 °C and ionosolv time of 3 h, it remained practically constant at ionosolv times equal or longer than 3 h for every autohydrolysis temperature. Hence, the autohydrolysis step had no influence on the relative proportion of S and G units in the studied temperature interval. These results suggest a non-preferential action of the ionic liquids towards any of the lignin substructures. However, the degradation of G units from 1 to 3 h can be attributed to the preferential degradation of these units by the action of ionic liquids.65,66
4 Conclusions
The combination of autohydrolysis and ionosolv treatments for eucalyptus fractionation made possible to recover hemicelluloses, cellulose, and lignin separately. The design of experiments approach was successful in statistically modeling the fractionation process, which allowed the maximization of lignin recovery (56.85%) and minimization of lignin content in the cellulosic fraction (10.19%) at an autohydrolysis temperature of 184 °C and an ionosolv time of 3.5 h. The prediction validation by an experiment under those operating conditions revealed that the statistical model was successful to describe the fractionation process. Lignin properties were also measured and varied with both treatments operating conditions, having the ionosolv treatment a higher influence on lignin characteristics. It was revealed that increasing treatment severity, especially ionosolv time, caused lignin recondensation and produced more thermally stable lignins. This study enhances the understanding of the effect of autohydrolysis and ionosolv treatments on the overall fractionation process and on lignin characteristics in a treatment combinations approach.Author contributions
A. O.: investigation, writing-original draft, formal analysis. V. R.: investigation, conceptualization, methodology. J. C. D.: conceptualization, validation, methodology. M. V. A.: writing-review and editing, supervision, project administration. M. O.: writing-review and editing, supervision, project administration. F. R.: project administration, funding acquisition.Conflicts of interest
There are no conflicts to declare.Acknowledgements
The authors are grateful to the “Ministerio de Ciencia e Innovación” in Spain for the financial support under the project PID2020-113570RB-100 and to “Comunidad de Madrid” for the project P2018/EMT-4348.Notes and references
- Y. Cheng, U. Awan, S. Ahmad and Z. Tan, Technol. Forecast. Soc. Change, 2021, 162, 120398 CrossRef.
- G. P. Peters, R. M. Andrew, J. G. Canadell, P. Friedlingstein, R. B. Jackson, J. I. Korsbakken, C. L. Quéré and A. Peregon, Nat. Clim. Change, 2020, 10, 3–6 CrossRef.
- M. Umar, X. Ji, D. Kirikkaleli and Q. Xu, J. Environ. Manage., 2020, 271, 111026 CrossRef PubMed.
- C. Conteratto, F. D. Artuzo, O. I. B. Santos and E. Talamini, Renewable Sustainable Energy Rev., 2021, 151, 111527 CrossRef.
- M. K. Shahid, A. Batool, A. Kashif, M. H. Nawaz, M. Aslam, N. Iqbal and Y. Choi, J. Environ. Manage., 2021, 297, 113268 CrossRef CAS PubMed.
- S. Peleteiro, S. Rivas, J. L. Alonso, V. Santos and J. C. Parajo, J. Agric. Food Chem., 2015, 63, 8093–8102 CrossRef CAS PubMed.
- S. I. Mussato, Biomass Fractionation: Technologies for a Lignocellulosic Feedstock Based Biorefinery, Elsevier, 2016, pp. 1–641 Search PubMed.
- A. J. Ragauskas, G. T. Beckham, M. J. Biddy, R. Chandra, F. Chen, M. F. Davis, B. H. Davison, R. A. Dixon, P. Gilna and M. Keller, Science, 2014, 344, 1246843 CrossRef PubMed.
- A. M. Asim, M. Uroos and N. Muhammad, RSC Adv., 2020, 10, 44003–44014 RSC.
- H. Wang, Y. Pu, A. Ragauskas and B. Yang, Bioresour. Technol., 2019, 271, 449–461 CrossRef CAS PubMed.
- C. Chio, M. Sain and W. Qin, Renewable Sustainable Energy Rev., 2019, 107, 232–249 CrossRef CAS.
- S. Imman, P. Khongchamnan, W. Wanmolee, N. Laosiripojana, T. Kreetachat, C. Sakulthaew, C. Chokejaroenrat and N. Suriyachai, RSC Adv., 2021, 11, 26773–26784 RSC.
- M. Culebras, A. Beaucamp, Y. Wang, M. M. Clauss, E. Frank and M. N. Collins, ACS Sustainable Chem. Eng., 2018, 6, 8816–8825 CrossRef CAS.
- M. Culebras, M. J. Sanchis, A. Beaucamp, M. Carsí, B. K. Kandola, A. R. Horrocks, G. Panzetti, C. Birkinshaw and M. N. Collins, Green Chem., 2018, 20, 4461–4472 RSC.
- T. Saito, R. H. Brown, M. A. Hunt, D. L. Pickel, J. M. Pickel, J. M. Messman, F. S. Baker, M. Keller and A. K. Naskar, Green Chem., 2012, 14, 3295–3303 RSC.
- T. Saito, J. H. Perkins, D. C. Jackson, N. E. Trammel, M. A. Hunt and A. K. Naskar, RSC Adv., 2013, 3, 21832–21840 RSC.
- W. Schutyser, T. Renders, S. V. den Bosch, S.-F. Koelewijn, G. T. Beckham and B. F. Sels, Chem. Soc. Rev., 2018, 47, 852–908 RSC.
- D. Yang, H. Li, Y. Qin, R. Zhong, M. Bai and X. Q. Qiu, J. Dispersion Sci. Technol., 2015, 36, 532–539 CrossRef CAS.
- F. N. U. Asina, I. Brzonova, E. Kozliak, A. Kubátová and Y. Ji, Renewable Sustainable Energy Rev., 2017, 77, 1179–1205 CrossRef CAS.
- M. Pishnamazi, H. Y. Ismail, S. Shirazian, J. Iqbal, G. M. Walker and M. N. Collins, Cellulose, 2019, 26, 6165–6178 CrossRef CAS.
- M. Pishnamazi, J. Iqbal, S. Shirazian, G. M. Walker and M. N. Collins, Int. J. Biol. Macromol., 2019, 124, 354–359 CrossRef CAS PubMed.
- Y. Zhang, M. Jiang, Y. Zhang, Q. Cao, X. Wang, Y. Han, G. Sun, Y. Li and J. Zhou, Mater. Sci. Eng., C, 2019, 104, 110002 CrossRef CAS PubMed.
- W. D. H. Schneider, A. J. P. Dillon and M. Camassola, Biotechnol. Adv., 2021, 47, 107685 CrossRef CAS PubMed.
- A. Brandt, M. J. Ray, T. Q. To, D. J. Leak, R. J. Murphy and T. Welton, Green Chem., 2011, 13, 2489–2499 RSC.
- R. Muazzam, A. M. Asim, M. Uroos, N. Muhammad and J. P. Hallett, RSC Adv., 2021, 11, 19095–19105 RSC.
- T. C. Pin, P. S. Nakasu, S. C. Rabelo and A. C. Costa, Energy, 2021, 235, 121279 CrossRef CAS.
- E. C. Achinivu, R. M. Howard, G. Li, H. Gracz and W. A. Henderson, Green Chem., 2014, 16, 1114–1119 RSC.
- A. Brandt-Talbot, F. J. V. Gschwend, P. S. Fennell, T. M. Lammens, B. Tan, J. Weale and J. P. Hallett, Green Chem., 2017, 19, 3078–3102 RSC.
- B. J. Cox and J. G. Ekerdt, Bioresour. Technol., 2013, 134, 59–65 CrossRef CAS PubMed.
- F. J. V. Gschwend, F. Malaret, S. Shinde, A. Brandt-Talbot and J. P. Hallett, Green Chem., 2018, 20, 3486–3498 RSC.
- F. J. V. Gschwend, C. L. Chambon, M. Biedka, A. Brandt, P. Fennell and J. Hallett, Green Chem., 2019, 21, 692–703 RSC.
- P. Y. S. Nakasu, C. J. Clarke, S. C. Rabelo, A. C. Costa, A. Brandt-Talbot and J. P. Hallett, ACS Sustainable Chem. Eng., 2020, 8, 7952–7961 CrossRef CAS.
- E. G. A. Rocha, T. C. Pin, S. C. Rabelo and A. C. Costa, Fuel, 2017, 206, 145–154 CrossRef CAS.
- F. M. Gírio, C. Fonseca, F. Carvalheiro, L. C. Duarte, S. Marques, R. Bogel-Łukasik, F. M. Girio, C. Fonseca, F. Carvalheiro, L. C. Duarte, S. Marques and R. Bogel-Lukasik, Bioresour. Technol., 2010, 101, 4775–4800 CrossRef PubMed.
- L. A. Batalha, Q. Han, H. Jameel, H. M. Chang, J. L. Colodette and F. J. B. Gomes, Bioresour. Technol., 2015, 180, 97–105 CrossRef CAS PubMed.
- M. Ertas, Q. Han, H. Jameel and H. M. Chang, Bioresour. Technol., 2014, 152, 259–266 CrossRef CAS PubMed.
- H. A. Ruiz, D. S. Ruzene, D. P. Silva, F. F. da Silva, A. A. Vicente and J. A. Teixeira, Appl. Biochem. Biotechnol., 2011, 164, 629–641 CrossRef CAS PubMed.
- M. E. Vallejos, M. D. Zambon, M. C. Area and A. A. da Silva Curvelo, Ind. Crops Prod., 2015, 65, 349–353 CrossRef CAS.
- A. Sluiter, B. Hames, R. Ruiz, C. Scarlata, J. Sluiter, D. Templeton and D. Crocker, National Renewable Energy Laboratory NREL/TP-510-42618, 2011, pp. 1–16 Search PubMed.
- A. Sluiter, B. Hames, R. Ruiz, C. Scarlata, J. Sluiter and D. Templeton, National Renewable Energy Laboratory NREL/TP-510-42623, 2008 Search PubMed.
- A. Ovejero-Pérez, V. Rigual, J. C. Domínguez, M. V. Alonso, M. Oliet and F. Rodriguez, Int. J. Biol. Macromol., 2020, 157, 461–469 CrossRef PubMed.
- A. B. Ibáñez and S. Bauer, Biomass Bioenergy, 2014, 68, 75–81 CrossRef.
- J. D. Timpa, J. Agric. Food Chem., 1991, 39, 270–275 CrossRef CAS.
- Z. Grubisic, P. Rempp and H. Benoit, J. Polym. Sci., Part B: Polym. Phys., 1967, 5, 753–759 CrossRef.
- V. Rigual, T. M. Santos, J. C. Domínguez, M. V. Alonso, M. Oliet and F. Rodriguez, Biomass Bioenergy, 2018, 117, 190–197 CrossRef CAS.
- A. Ovejero-Pérez, V. Rigual, J. C. Domínguez, M. V. Alonso, M. Oliet and F. Rodriguez, Int. J. Biol. Macromol., 2022, 197, 131–140 CrossRef PubMed.
- A. Romaní, G. Garrote, F. López and J. C. Parajó, Bioresour. Technol., 2011, 102, 5896–5904 CrossRef PubMed.
- S. Rivas, V. Rigual, J. C. Domínguez, M. V. Alonso, M. Oliet, J. C. Parajó and F. Rodriguez, Food Bioprod. Process., 2020, 123, 398–408 CrossRef CAS.
- L. Penín, S. Peleteiro, V. Santos, J. L. Alonso and J. C. Parajó, Cellulose, 2019, 26, 1125–1139 CrossRef.
- A. M. da Costa Lopes, K. G. João, A. R. C. Morais, E. Bogel-Łukasik and R. Bogel-Łukasik, Sustainable Chem. Processes, 2013, 1, 1–31 CrossRef.
- W.-C. Tu, L. Weigand, M. Hummel, H. Sixta, A. Brandt-Talbot and J. P. Hallett, Cellulose, 2020, 27, 4745–4761 CrossRef CAS.
- F. Araya, E. Troncoso, R. T. Mendonça and J. Freer, Biotechnol. Bioeng., 2015, 112, 1783–1791 CrossRef CAS PubMed.
- C. K. Nitsos, T. Choli-Papadopoulou, K. A. Matis and K. S. Triantafyllidis, ACS Sustainable Chem. Eng., 2016, 4, 4529–4544 CrossRef CAS.
- Y. Pu, F. Hu, F. Huang, B. H. Davison and A. J. Ragauskas, Biotechnol. Biofuels, 2013, 6, 15 CrossRef CAS PubMed.
- T. C. Pin, L. B. Brenelli, V. M. Nascimento, A. C. Costa, Y. Pu, A. J. Ragauskas and S. C. Rabelo, Ind. Crops Prod., 2021, 159, 113080 CrossRef CAS.
- M. E. Eugenio, R. Martin-Sampedro, J. I. Santos, B. Wicklein, J. A. Martin and D. Ibarra, Int. J. Biol. Macromol., 2021, 181, 99–111 CrossRef CAS PubMed.
- Y. Sun and B. Xue, Ind. Crops Prod., 2018, 123, 600–609 CrossRef CAS.
- R. Martín-Sampedro, J. I. Santos, Ú. Fillat, B. Wicklein, M. E. Eugenio and D. Ibarra, Int. J. Biol. Macromol., 2019, 126, 18–29 CrossRef PubMed.
- J. H. Choi, S. M. Cho, J. C. Kim, S. W. Park, Y. M. Cho, B. Koo, H. W. Kwak and I. G. Choi, ACS Omega, 2021, 6, 1534–1546 CrossRef CAS PubMed.
- S. Zhai, Q. Liu, Y. Zhao, H. Sun, B. Yang and Y. Weng, Polymers, 2021, 13, 1–15 CrossRef PubMed.
- B. J. Cox and J. G. Ekerdt, Bioresour. Technol., 2012, 118, 584–588 CrossRef CAS PubMed.
- S. Jia, B. J. Cox, X. Guo, Z. C. Zhang and J. G. Ekerdt, ChemSusChem, 2010, 3, 1078–1084 CrossRef CAS PubMed.
- A. Tolbert, H. Akinosho, R. Khunsupat, A. K. Naskar and A. J. Ragauskas, Biofuels, Bioprod. Biorefin., 2014, 8, 836–856 CrossRef CAS.
- J. Rencoret, G. Marques, A. Gutiérrez, D. Ibarra, J. Li, G. Gellerstedt, J. I. Santos, J. Jiménez-Barbero, Á. T. Martínez and J. C. del Río, Holzforschung, 2008, 62, 514–526 CrossRef CAS.
- P. O. Çetinkol, D. C. Dibble, C. Gang, M. S. Kent, B. Knierim, M. Auer, D. E. Wemmer, J. G. Pelton, Y. B. Melnichenko, J. Ralph, B. A. Simmons and B. M. Holmes, Biofuel, 2010, 1, 33–46 CrossRef.
- J.-L. Wen, T.-Q. Yuan, S.-L. Sun, F. Xu and R.-C. Sun, Green Chem., 2014, 16, 181–190 RSC.
Footnote |
| † Electronic supplementary information (ESI) available: Autohydrolysis temperature profiles, ANOVA tables, composition of autohydrolyzed solids and HSQC-NMR spectra of lignins. See DOI: https://doi.org/10.1039/d2ra08013c |
| This journal is © The Royal Society of Chemistry 2023 |

