 Open Access Article
Two-step leaching of spent lithium-ion batteries and effective regeneration of critical metals and graphitic carbon employing hexuronic acid†
Sibananda Sahua and
Niharbala Devi *ab
*ab
aBiofuels and Bioprocessing Research Center, Institute of Technical Education and Research, Siksha ‘O’ Anusandhan Deemed to be University, Bhubaneswar, Odisha, India. E-mail: niharbaladevi@soa.ac.in
bDepartment of Chemistry, Institute of Technical Education and Research, Siksha ‘O’ Anusandhan Deemed to be University, Bhubaneswar, Odisha, India
First published on 3rd March 2023
Abstract
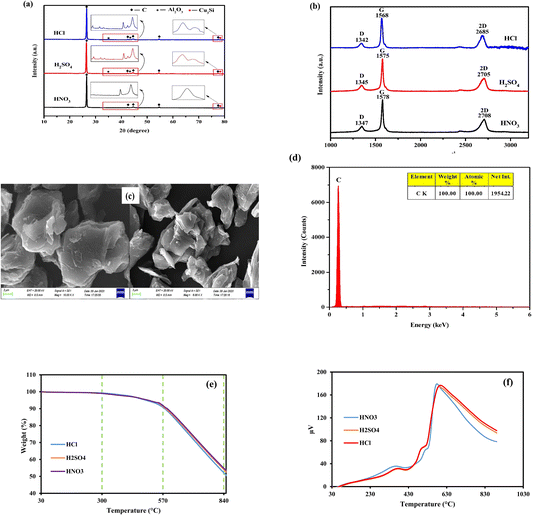
Recovering precious metal ions like Co, Li, Mn, and Ni from discarded lithium-ion batteries (LIBs) has significant environmental and economic benefits. Also, graphite will be in high demand in the coming years due to the development of LIBs for use in electric vehicles (EVs) and the need for it for electrodes in a variety of energy storage devices. However, it has been overlooked during the recycling of used LIBs, which resulted in resource waste and environmental pollution. In this work, a comprehensive and environmentally friendly approach for recycling critical metals as well as graphitic carbon from discarded LIBs was proposed. To optimize the leaching process, various leaching parameters were investigated by employing hexuronic acid or ascorbic acid. The feed sample was analyzed using XRD, SEM-EDS, and a Laser Scattering Particle Size Distribution Analyzer to determine the phases, morphology, and particle size. 100% of Li and 99.5% of Co were leached at the optimum conditions of 0.8 mol L−1 ascorbic acid, a particle size of −25 μm, 70 °C, 60 min of leaching time, and 50 g L−1 of S/L ratio. A detailed study of the leaching kinetics was carried out. The leaching process was found to be well-fitted with the surface chemical reaction model based on the findings of temperature, acid concentration, and particle size variations. To obtain pure graphitic carbon after the initial leaching, the leached residue was subjected to further leaching with various acids (HCl, H2SO4, and HNO3). The Raman spectra, XRD, TGA, and SEM-EDS analysis of the leached residues following the two-step leaching process were examined to exemplify the quality of the graphitic carbon.
1 Introduction
Lithium-ion batteries (LIBs), which have the distinctive qualities of higher specific energy density, higher charging capacity, and exceptional cycle longevity, are extensively used in electric vehicles, computers, laptops, smartphones, video cameras, solar energy storage devices, and many electronic gadgets.1 The need for LIBs has significantly increased, particularly with the meteoric rise of electric and hybrid vehicles.2 Sales of lithium-ion batteries for electric vehicles are expected to rise from 7 million in 2020 to 180 million in 2045.3 Although LIBs have many useful advantages, one drawback is that they generally have a lifespan of fewer than 1000 cycles.4 As LIBs have a limited lifespan, the dramatic increase in LIB consumption may suggest that there will be a huge amount of waste in the form of spent LIBs in the coming decades.5 The total number of spent LIBs worldwide is predicted to exceed 11 million tonnes by 2030.6 Concerns about the environment, human health, and safety have been raised by the disposal of used LIBs and the little efforts made to recycle them. In addition, non-recycled LIB parts provide pollution issues owing to the possibility of toxic leaks that must damage soils and eventually water systems.7 So, the advancement of efficient and affordable methods to recycle and transform LIB components are essential for reducing harmful emissions to the environment and the excess use of precious natural resources.Due to the high recycling values, there is currently a strong emphasis on collecting scarce and precious energy materials from spent LIBs.8,9 The recovery of such valuable metals (Li, Co, Mn, Ni, etc.) from discarded LIBs has been summarized in numerous publications.10–13 Graphitic carbon recycling, on the other hand, has received little attention in the past due to its abundance and lower economic value.14 Graphitic carbon is typically obtained during the recycling of spent LIBs as a residual scrap and by-product, both of which are not effectively recycled. Graphite is indeed present in LIBs in amounts ranging from 12 to 21 wt%.15,16 Without a doubt, the rise in spent LIBs results in the generation of a significant amount of spent graphite. Additionally, the cost of battery graphite, which makes up about 8% to 13% of the overall cost of the battery, is between $8000 and $13![[thin space (1/6-em)]](https://www.rsc.org/images/entities/char_2009.gif) 000 per ton.17 Due to an unanticipated surge in EV sales over the past few years, the worldwide graphite sector has seen constantly rising demand and limited supply. The market for graphite was estimated to be worth USD 14.3 billion in 2019 and is expected to grow to USD 21.6 billion by 2027, based on a recent analysis by Allied Market Research.18 If used graphite is not properly recycled, resources will be wasted and environmental pollution will be increased. Therefore, for the preservation of resources and the protection of the environment, effective recycling of spent graphite is crucial.19
000 per ton.17 Due to an unanticipated surge in EV sales over the past few years, the worldwide graphite sector has seen constantly rising demand and limited supply. The market for graphite was estimated to be worth USD 14.3 billion in 2019 and is expected to grow to USD 21.6 billion by 2027, based on a recent analysis by Allied Market Research.18 If used graphite is not properly recycled, resources will be wasted and environmental pollution will be increased. Therefore, for the preservation of resources and the protection of the environment, effective recycling of spent graphite is crucial.19
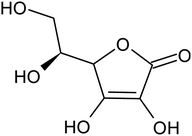
Various techniques have been utilized to develop LIB recycling, however, hydrometallurgy is frequently employed in industrial sectors as a cost-effective and environmentally sustainable method to extract valuable metals from spent LIBs due to its higher efficiency and lower harmful gas emissions.20–22 Several investigations have been conducted on the leaching of critical metals using both inorganic acids (such as HCl,23 HNO3,24 H2SO4,25,26 and H3PO4![[thin space (1/6-em)]](https://www.rsc.org/images/entities/char_2009.gif) 27) and organic acids (such as citric acid,28,29 malic acid,30,31 lactic acid,32 ascorbic acid,33 oxalic acid,34 and succinic acid35). Compared to inorganic acids, organic acids are almost natural and sustainable. Employing organic acids as efficient leaching agents that are also safe for the environment, allowing for the selective leaching of certain metals whilst delaying equipment corrosion and preventing secondary emissions.36 Furthermore, organic acids are biodegradable, don't often emit toxic gases, and the leaching-related trash would be easy to treat.37 Musariri et al. reported that employing 1.5 mol L−1 citric acid with 2% H2O2 as reductant at 95 °C, 97% of Li and 95% of Co were leached.38 Succinic acid was utilized as a leaching agent and H2O2 as a reductant by Li et al. to leach metal values from waste calcined LiCoO2 battery samples. The results showed that with 1.5 mol L−1 succinic acid and 4% H2O2, nearly 96% of Li and 100% of Co were leached.35 Another report used citric acid and H2O2 to dissolve the NCM-type battery sample, and the results showed that Li, Co, Ni, and Mn leached out at rates of 96%, 87%, 93%, and 90.5%, respectively.39 A detailed survey of the literature revealed that H2O2 is the most efficient reductant for the leaching of Li and Co,40–42 whereas the leaching of both Li and Co is ineffective without the presence of a reducing agent.43 To avoid the increasing cost of the leaching process by the addition of H2O2, it is essential to select a lixiviant that has dual capacity i.e., leachant and reductant. Ascorbic acid can be a candidate for this purpose because of its capacity to reduce metal ions from higher oxidation states to lower oxidation states. Li et al.44 reported the recycling of Co and Li from the cathode materials using ultrasonic washing followed by calcination and then leaching with ascorbic acid. Using 1.25 mol L−1 ascorbic acid at 70 °C temperature, pulp density of 25 g L−1, 98.5% Li and 94.8% Co were leached. In another study, a closed vessel microwave leaching was reported using ascorbic acid for the recovery of Co, Mn, and Li from spent LIB cathode powder.45 The reduction property of ascorbic acid was studied using XPS studies. Oxalates of Co and Mn were precipitated using oxalic acid. Although the optimal leaching efficiency was achieved at a higher temperature (125 °C), it was not a favorable condition from an environmental perspective. For the recovery of graphitic carbon majority of investigations were carried out after removing the cathode and anode from the spent LIBs. Da et al.46 demonstrated a feasible method for recycling spent graphite (SG) anode. In order to obtain pure SG, residual insoluble impurities including Al and Fe-based compounds were successfully removed through alkali roasting at a higher temperature. Yuwen et al.47 reported that the separation of graphite and Cu foil under microwave irradiation is about 100% due to the LIBs anode's strong microwave absorption capability. The recovery of Li is then accomplished through water leaching and subsequent heating. Markey et al.48 showed the effectiveness of an upcycling technique that directly regenerates spent graphite anodes while also incorporating healing and doping. In particular, employing a boric acid pretreatment and a brief annealing step, their regeneration technique not only corrected the compositional and structural defects of degraded graphite but also functionally doped the surface of the graphite particles, resulting in high electrochemical activity and outstanding cycling stability. But, there haven't been any studies on simultaneously separating graphitic carbon and precious metal values from the used LIB sample using a leaching-based method. Using ascorbic acid as the lixiviant, limited research studies have been reported for spent LiCoO2 batteries. However, the detailed leaching kinetics of the leaching process and the recycling of both critical metals and graphitic carbon from spent LiCoO2 in a single approach were not explored. Because of the higher acid content and lower S/L ratio of the previous studies, the findings need to be reconsidered to enhance the leaching efficiency with minimum acid consumption with a higher S/L ratio. In this work, the most effective ascorbic acid was chosen from different organic acid leaching studies for further investigations followed by two-step leaching to recover graphitic carbon along with Co and Li. All leaching parameters, variations in acid concentration, leaching time, temperature, and solid to liquid ratio (S/L) were studied. The rate of reaction and the mechanism behind the leaching process were both determined by analyzing the leaching kinetics. Following the initial leaching process, the leached residue was subjected to further acid leaching to obtain pure graphitic carbon. The effect of various acids on the regeneration of pure graphitic carbon was also investigated.
27) and organic acids (such as citric acid,28,29 malic acid,30,31 lactic acid,32 ascorbic acid,33 oxalic acid,34 and succinic acid35). Compared to inorganic acids, organic acids are almost natural and sustainable. Employing organic acids as efficient leaching agents that are also safe for the environment, allowing for the selective leaching of certain metals whilst delaying equipment corrosion and preventing secondary emissions.36 Furthermore, organic acids are biodegradable, don't often emit toxic gases, and the leaching-related trash would be easy to treat.37 Musariri et al. reported that employing 1.5 mol L−1 citric acid with 2% H2O2 as reductant at 95 °C, 97% of Li and 95% of Co were leached.38 Succinic acid was utilized as a leaching agent and H2O2 as a reductant by Li et al. to leach metal values from waste calcined LiCoO2 battery samples. The results showed that with 1.5 mol L−1 succinic acid and 4% H2O2, nearly 96% of Li and 100% of Co were leached.35 Another report used citric acid and H2O2 to dissolve the NCM-type battery sample, and the results showed that Li, Co, Ni, and Mn leached out at rates of 96%, 87%, 93%, and 90.5%, respectively.39 A detailed survey of the literature revealed that H2O2 is the most efficient reductant for the leaching of Li and Co,40–42 whereas the leaching of both Li and Co is ineffective without the presence of a reducing agent.43 To avoid the increasing cost of the leaching process by the addition of H2O2, it is essential to select a lixiviant that has dual capacity i.e., leachant and reductant. Ascorbic acid can be a candidate for this purpose because of its capacity to reduce metal ions from higher oxidation states to lower oxidation states. Li et al.44 reported the recycling of Co and Li from the cathode materials using ultrasonic washing followed by calcination and then leaching with ascorbic acid. Using 1.25 mol L−1 ascorbic acid at 70 °C temperature, pulp density of 25 g L−1, 98.5% Li and 94.8% Co were leached. In another study, a closed vessel microwave leaching was reported using ascorbic acid for the recovery of Co, Mn, and Li from spent LIB cathode powder.45 The reduction property of ascorbic acid was studied using XPS studies. Oxalates of Co and Mn were precipitated using oxalic acid. Although the optimal leaching efficiency was achieved at a higher temperature (125 °C), it was not a favorable condition from an environmental perspective. For the recovery of graphitic carbon majority of investigations were carried out after removing the cathode and anode from the spent LIBs. Da et al.46 demonstrated a feasible method for recycling spent graphite (SG) anode. In order to obtain pure SG, residual insoluble impurities including Al and Fe-based compounds were successfully removed through alkali roasting at a higher temperature. Yuwen et al.47 reported that the separation of graphite and Cu foil under microwave irradiation is about 100% due to the LIBs anode's strong microwave absorption capability. The recovery of Li is then accomplished through water leaching and subsequent heating. Markey et al.48 showed the effectiveness of an upcycling technique that directly regenerates spent graphite anodes while also incorporating healing and doping. In particular, employing a boric acid pretreatment and a brief annealing step, their regeneration technique not only corrected the compositional and structural defects of degraded graphite but also functionally doped the surface of the graphite particles, resulting in high electrochemical activity and outstanding cycling stability. But, there haven't been any studies on simultaneously separating graphitic carbon and precious metal values from the used LIB sample using a leaching-based method. Using ascorbic acid as the lixiviant, limited research studies have been reported for spent LiCoO2 batteries. However, the detailed leaching kinetics of the leaching process and the recycling of both critical metals and graphitic carbon from spent LiCoO2 in a single approach were not explored. Because of the higher acid content and lower S/L ratio of the previous studies, the findings need to be reconsidered to enhance the leaching efficiency with minimum acid consumption with a higher S/L ratio. In this work, the most effective ascorbic acid was chosen from different organic acid leaching studies for further investigations followed by two-step leaching to recover graphitic carbon along with Co and Li. All leaching parameters, variations in acid concentration, leaching time, temperature, and solid to liquid ratio (S/L) were studied. The rate of reaction and the mechanism behind the leaching process were both determined by analyzing the leaching kinetics. Following the initial leaching process, the leached residue was subjected to further acid leaching to obtain pure graphitic carbon. The effect of various acids on the regeneration of pure graphitic carbon was also investigated.
2 Experimental methods
2.1 Reagents and materials
The spent LIB sample was collected from an authorized supplier of waste materials. Ascorbic acid (C6H8O6) was purchased from Merck life science Pvt. with a purity of ≥ 99%. Similarly, HCl (36% purity), H2SO4 (98% purity), HNO3 (69% purity), and all other reagents were purchased from Merck of analytical grade. All solutions were prepared with Millipore water.2.2 Analytical method
The total metal content of the spent LIB sample was analyzed using ICP-OES (inductively coupled plasma optical emission spectrometry) of PerkinElmer make after treatment with a 3![[thin space (1/6-em)]](https://www.rsc.org/images/entities/char_2009.gif) :
:![[thin space (1/6-em)]](https://www.rsc.org/images/entities/char_2009.gif) 1 solution of hydrochloric and nitric acid (aqua regia) (Table 1). In the digestion process, 1 g sample was mixed with 40 mL of aqua regia, heated to boiling, and then stirred for one hour. The cooled sample was filtered into a 100 mL volumetric flask and the final volume was made up to 100 mL. Before and after leaching, the solid samples were investigated using X-ray diffraction (XRD, Rigaku Ultima IV), scanning electron microscopy, and energy-dispersive X-ray spectroscopy (SEM-EDS, EVO-18, Carl Zeiss). Raman spectra of the leached residues were analyzed using Renishaw's inVia Raman Microscope. The thermogravimetric analysis (TGA) and differential thermal analysis (DTA) were carried out using a Hitachi thermogravimetric analyzer (Hitachi STA 7200) at a heating rate of 25 °C min−1 with a temperature range of 30 °C to 900 °C.
1 solution of hydrochloric and nitric acid (aqua regia) (Table 1). In the digestion process, 1 g sample was mixed with 40 mL of aqua regia, heated to boiling, and then stirred for one hour. The cooled sample was filtered into a 100 mL volumetric flask and the final volume was made up to 100 mL. Before and after leaching, the solid samples were investigated using X-ray diffraction (XRD, Rigaku Ultima IV), scanning electron microscopy, and energy-dispersive X-ray spectroscopy (SEM-EDS, EVO-18, Carl Zeiss). Raman spectra of the leached residues were analyzed using Renishaw's inVia Raman Microscope. The thermogravimetric analysis (TGA) and differential thermal analysis (DTA) were carried out using a Hitachi thermogravimetric analyzer (Hitachi STA 7200) at a heating rate of 25 °C min−1 with a temperature range of 30 °C to 900 °C.
| Metals | Li | Co | Cu | Al |
| Concentration, g L−1 | 0.39 | 3.412 | 0.031 | 0.027 |
2.3 Leaching process
A 500 mL three-necked flat-bottomed flask with a magnetic stirrer, a temperature sensor, and a vapor condenser was used to leach the waste LIB sample. A certain amount of LIB sample was exactly weighed, and ascorbic acid solutions of varying concentrations were made as leaching reagents. Solid–liquid separation was carried out through filtration. The metal ions present in the leach liquor were examined using ICP-OES. The leaching efficiency for different metals was evaluated using eqn (1). The experimental conditions for different leaching parameters using ascorbic acid were addressed in Table 2. The second step leaching was carried out with the leached residues of ascorbic acid.
 | (1) |
| Figures | Ascorbic acid concentration (mol L−1) | Leaching time (min) | Temperature (°C) | Particle size (μm) | Solid to liquid ratio (g L−1) |
|---|---|---|---|---|---|
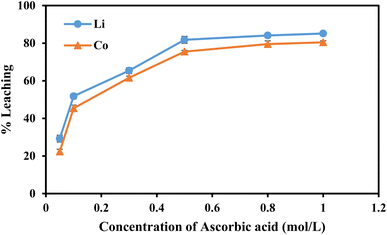
| Fig. 4 | 0.05, 0.1, 0.3, 0.5, 0.8, 1.0 | 60 | 30 | −25 | 10 |
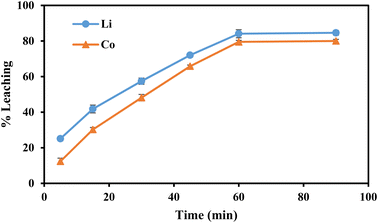
| Fig. 5 | 0.8 | 5, 15, 30, 45, 60, 90 | 30 | −25 | 10 |
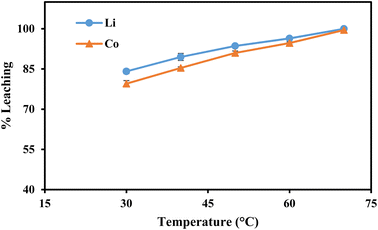
| Fig. 6 | 0.8 | 60 | 30, 40, 50, 60, 70 | −25 | 10 |
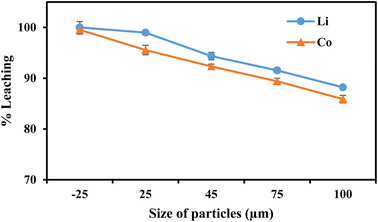
| Fig. 7 | 0.8 | 60 | 70 | −25, 25, 45, 75, 100 | 10 |
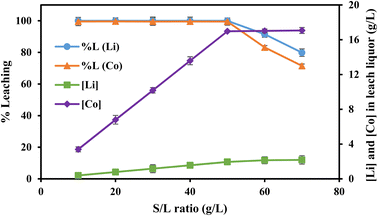
| Fig. 8 | 0.8 | 60 | 70 | −25 | 10, 20, 30, 40, 50, 60, 70 |
3 Results and discussion
3.1 Characterization of the LIB sample
The waste LIB sample was characterized using XRD analysis with a Cu Kα radiation source (λ = 1.5406 Å). The LIB sample was scanned at 25 °C in the 2θ range from 10° to 80°. The diffraction patterns were compared to the reference data (LiCoO2 = 01-070-2685 and C = 00-008-0415) in the JCPDS database. The presence of Li and Co in the form of LiCoO2 was confirmed by XRD analysis (Fig. 1a). Additionally, the same feed sample was analyzed using SEM and EDS analysis at various magnifications, and the SEM images showed the presence of LiCoO2 particles with irregular shape and a wider particle size distribution (Fig. 1b). The presence of cobalt, carbon, and oxygen was also confirmed by elemental analysis. But lithium was not detected by EDS elemental analysis due to its lightweight, and light elements emit an auger electron rather than a proton most of the time, which is another reason. Because of the low weight% (<0.4%), the presence of Al and Cu can be neglected. The particle size distribution of the spent LIB sample has been analyzed with Laser Scattering Particle Size Distribution Analyzer LA-960, HORIBA (Fig. 1c). With D10 = 10.5 μm and D50 = 18.3 μm, the average particle size was found to be 16.2 μm.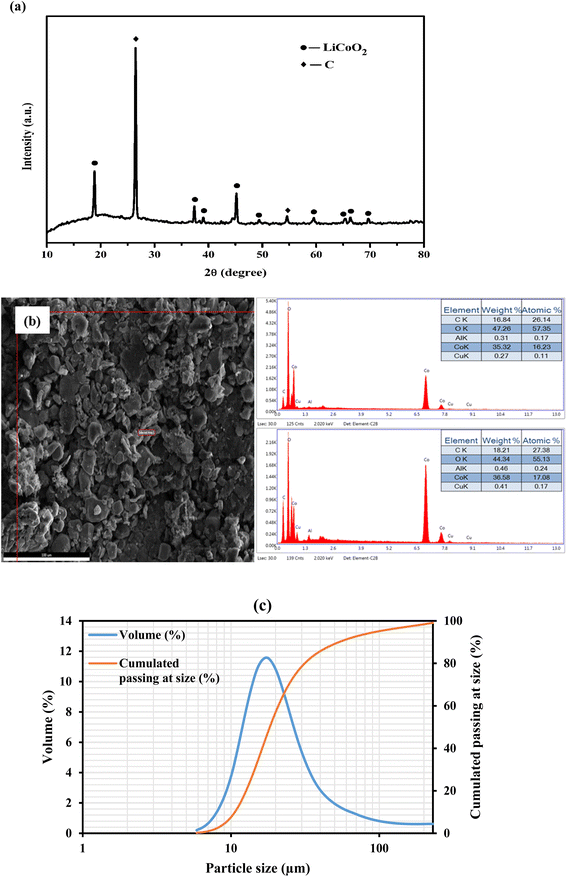 | ||
| Fig. 1 (a) XRD patterns of the spent LIB sample, (b) SEM-EDS analysis of the spent LIB sample, and (c) particle size distribution of the spent LIB sample. | ||
3.2 Leaching of waste LIB sample
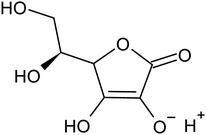
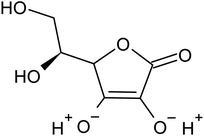
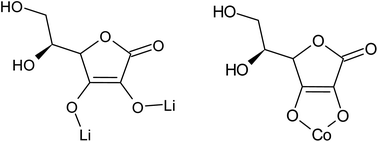
| 2LiCoO2(s) + 4C6H8O6(aq) → C6H6O6Li2(aq) + 2C6H6O6Co(aq) + C6H6O6(aq) + 4H2O | (2) |
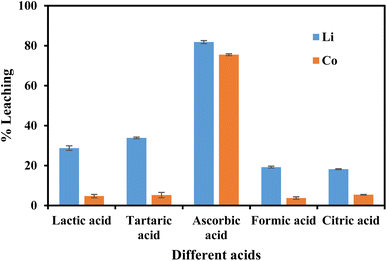 | ||
| Fig. 2 Effect of different organic acids on the leaching efficiency of Li and Co (acid conc. = 0.5 mol L−1, S/L = 10 g L−1, temperature = 30 °C, leaching time = 60 min, particle size = −25 μm). | ||
(a) Surface chemical reaction control
 | (3) |
(b) Diffusion control through the product layer
 | (4) |
Another kinetic model that is employed to describe the multi-metal leaching for some solid–liquid heterogeneous processes is the Avrami equation, which is a mixed control model that involves both diffusion and chemical reaction control.
(c) Avrami equation
| −ln(1 − X) = krt | (5) |
By taking the natural logarithm on both sides, eqn (5) will be expressed as,
ln(−ln(1 − X)) = ln![[thin space (1/6-em)]](https://www.rsc.org/images/entities/char_2009.gif) kr + ln kr + ln![[thin space (1/6-em)]](https://www.rsc.org/images/entities/char_2009.gif) t t
| (6) |
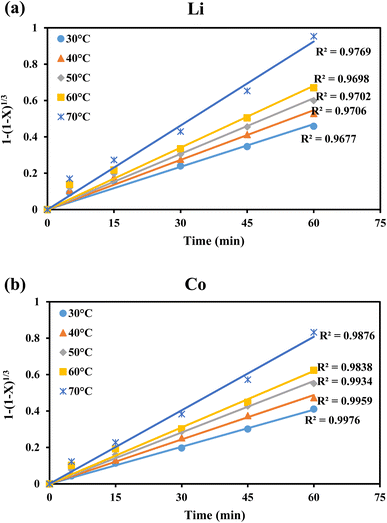 | ||
| Fig. 9 Dissolution of Li and Co vs. time at different temperatures, fitted by surface chemical reaction control model for leaching of (a) Li and (b) Co. | ||
The specific rate constants (k) for Li and Co were determined using the surface chemical reaction model (Fig. 9a and b). The specific rate constant (k), pre-exponential factor (A), apparent activation energy (Ea), and absolute temperature (T) are related by the Arrhenius equation (eqn (7)).
 | (7) |
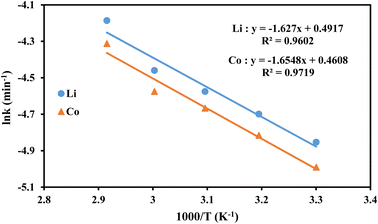
It was observed that the reaction rate constants increased with increasing temperature, indicating that increasing the temperature is beneficial for enhancing the leaching efficiencies of Li and Co. Fig. 10 showed the plot of ln![[thin space (1/6-em)]](https://www.rsc.org/images/entities/char_2009.gif) k vs. 1000/T and higher correlation coefficient values (R2 > 0.96) suggested a better fit of the surface chemical reaction model for the leaching of Li and Co. From Fig. 10, the apparent activation energies of Li and Co were found to be 13.5 kJ mol−1 and 13.7 kJ mol−1, respectively.
k vs. 1000/T and higher correlation coefficient values (R2 > 0.96) suggested a better fit of the surface chemical reaction model for the leaching of Li and Co. From Fig. 10, the apparent activation energies of Li and Co were found to be 13.5 kJ mol−1 and 13.7 kJ mol−1, respectively.
To support the surface chemical reaction model, the data of variation in ascorbic acid concentration (Fig. 4) was analyzed. The higher R2 values (>0.98) for Li and Co (Fig. 11a and b), and the plot of ln![[thin space (1/6-em)]](https://www.rsc.org/images/entities/char_2009.gif) k vs. ln[ascorbic acid] (Fig. 11c) justified the fitting of the surface chemical reaction model for the leaching of both metals.
k vs. ln[ascorbic acid] (Fig. 11c) justified the fitting of the surface chemical reaction model for the leaching of both metals.
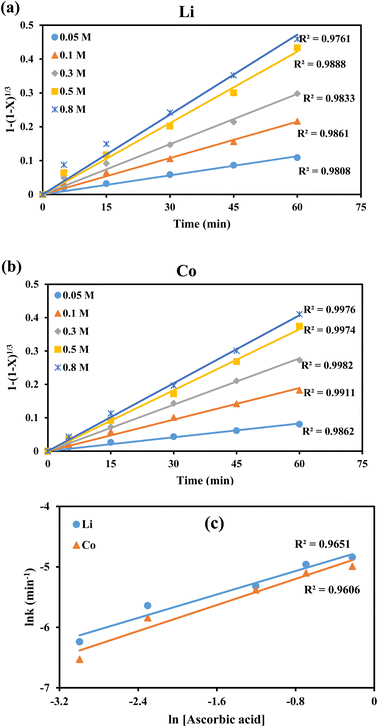 | ||
Fig. 11 Applicability of surface chemical reaction control model for leaching of (a) Li and (b) Co with different ascorbic acid concentrations and (c) plot of ln![[thin space (1/6-em)]](https://www.rsc.org/images/entities/char_2009.gif) k vs. ln[ascorbic acid]. k vs. ln[ascorbic acid]. | ||
Further justification of the kinetic model was checked with the effect of particle size (data from Fig. 7) using the surface chemical reaction control eqn (3). Higher correlation coefficient values were obtained for Li and Co (Fig. S3a and b†), ensuring a better match of the surface chemical reaction model.
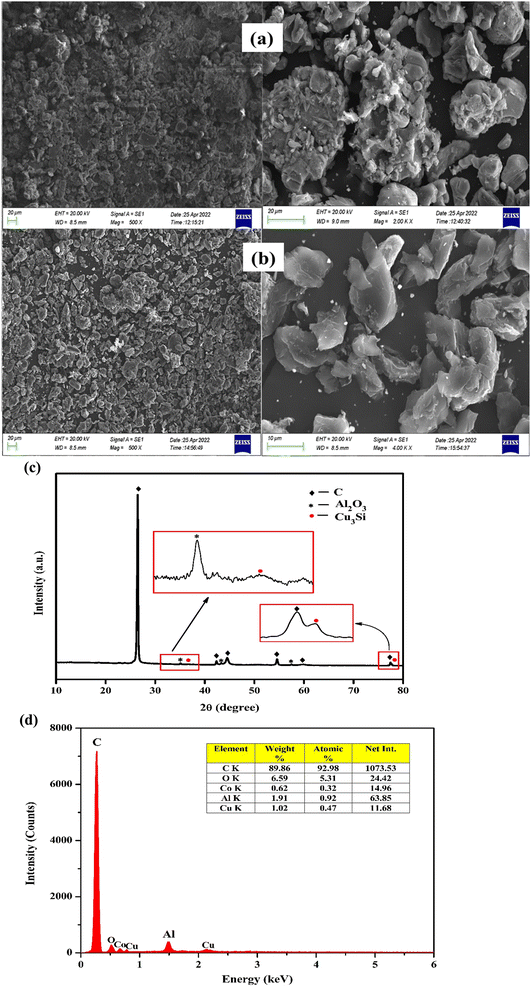
The SEM images of the spent LIB samples, taken at various magnifications before and after leaching, were shown in Fig. 12a and b. According to Fig. 12a, the materials had an asymmetrical and agglomerated shape before leaching. However, the particles with agglomerated shape vanished after leaching with ascorbic acid (Fig. 12b). To determine whether complete Li and Co leaching was achieved or not, the XRD patterns of LIB samples were examined after leaching. According to Fig. 12c, Li and Co were completely leached leaving carbon, aluminum oxide, and copper silicon in the residue (JCPDS data: C = 01-089-7213, Al2O3 = 01-075-1865 and Cu3Si = 00-051-0916). Additionally, some impurities have been reflected in the XRD plot as irregular patterns, but with less intensity. Also, it was confirmed through the EDS analysis of the leached residue (Fig. 12d).
4 Conclusion
This work proposed an efficient and environmentally acceptable approach for recycling essential metals as well as graphitic carbon from discarded LIBs. At room temperature (30 °C), about 84.1% of Li and 79.5% of Co were leached with 0.8 mol L−1 ascorbic acid, which was increased to 100% and 99.5%, respectively, at 70 °C. Also, it was revealed from the variation in particle size that the maximal leaching of both metals was accomplished with the smaller particle size (−25 μm). It was caused by ascorbic acid's dual action as both an acid and a reducing agent. From the possible dissociations of ascorbic acid, it was concluded that the two most likely and thermodynamically stable products are C6H6O6Li2 and C6H6O6Co. The detailed leaching kinetics was studied and the higher correlation coefficient values suggested a better match of the surface chemical reaction model with apparent activation energies (Ea) of Li (13.5 kJ mol−1) and Co (13.7 kJ mol−1). Further leaching of the leached residue was carried out in order to get pure graphitic carbon and to leach the leftover aluminum oxide and other impurities. From the Raman spectra, XRD, TGA, and SEM-EDS analysis of the final residues, it was confirmed that HNO3 was the effective lixiviant to regenerate the graphitic carbon. The 2D band's appearance clearly illustrates that the leached residue is considered to be completely graphitized, or referred to as graphitic carbon.Author contribution
Sibananda Sahu (first author): writing – original draft, visualization, data curation, formal analysis, investigation, software. Niharbala Devi (corresponding author): conceptualization, methodology, supervision, Writing – review and editing, validation.Conflicts of interest
The authors declare that there is no conflict of interest.Acknowledgements
The authors express their gratitude to S‘O’A (Deemed to be University) for providing the research facilities.References
- A. Masias, J. Marcicki and W. A. Paxton, ACS Energy Lett., 2021, 6, 621 CrossRef CAS.
- J. Xiao, B. Niu and Z. Xu, J. Hazard. Mater., 2021, 418, 126319, DOI:10.1016/j.jhazmat.2021.126319.
- E. Mossali, N. Picone, L. Gentilini, O. Rodrìguez, J. M. Pérez and M. Colledani, J. Environ. Manage., 2020, 264, 110500, DOI:10.1016/j.jenvman.2020.110500.
- W. Wang, Y. Zhang, L. Zhang and S. Xu, J. Cleaner Prod., 2020, 249, 119340, DOI:10.1016/j.jclepro.2019.119340.
- E. Asadi Dalini, Gh. Karimi and S. Zandevakili, Miner. Eng., 2021, 173, 107226, DOI:10.1016/j.mineng.2021.107226.
- J. Li, Y. Lai, X. Zhu, Q. Liao, A. Xia, Y. Huang and X. Zhu, J. Hazard. Mater., 2020, 398, 122955, DOI:10.1016/j.jhazmat.2020.122955.
- S. Sun, C. Jin, W. He, G. Li, H. Zhu and J. Huang, Sci. Total Environ., 2021, 776, 145913, DOI:10.1016/j.scitotenv.2021.145913.
- J. C.-Y. Jung, P.-C. Sui and J. Zhang, J. Energy Storage, 2021, 35, 102217, DOI:10.1016/j.est.2020.102217.
- S. Jin, D. Mu, Z. Lu, R. Li, Z. Liu, Y. Wang, S. Tian and C. Dai, J. Cleaner Prod., 2022, 340, 130535, DOI:10.1016/j.jclepro.2022.130535.
- J. J. Roy, S. Rarotra, V. Krikstolaityte, K. W. Zhuoran, Y. D. Cindy, X. Y. Tan, M. Carboni, D. Meyer, Q. Yan and M. Srinivasan, Adv. Mater., 2021, 34, 2103346, DOI:10.1002/adma.202103346.
- J. J. Roy, B. Cao and S. Madhavi, Chemosphere, 2021, 282, 130944, DOI:10.1016/j.chemosphere.2021.130944.
- Y. Li, W. Lv, H. Huang, W. Yan, X. Li, P. Ning, H. Cao and Z. Sun, Green Chem., 2021, 23, 6139, 10.1039/D1GC01639C.
- X. Chen, J. Li, D. Kang, T. Zhou and H. Ma, Green Chem., 2019, 21, 6342, 10.1039/C9GC02844G.
- B. Niu, J. Xiao and Z. Xu, J. Hazard. Mater., 2022, 439, 129678, DOI:10.1016/j.jhazmat.2022.129678.
- S. Natarajan and V. Aravindan, Adv. Energy Mater., 2020, 10, 2002238, DOI:10.1002/aenm.202002238.
- H. Da, M. Gan, D. Jiang, C. Xing, Z. Zhang, L. Fei, Y. Cai, H. Zhang and S. Zhang, ACS Sustainable Chem. Eng., 2021, 9, 16192, DOI:10.1021/acssuschemeng.1c05374.
- Y. Gao, J. Zhang, H. Jin, G. Liang, L. Ma, Y. Chen and C. Wang, Carbon, 2022, 189, 493, DOI:10.1016/j.carbon.2021.12.053.
- K. Yeware, Graphite Market by Type and Application: Global Opportunity Analysis and Industry Forecast, 2019–2027, Bulk Chem, 2020, p. A01635 Search PubMed.
- S. Natarajan, M. L. Divya and V. Aravindan, J. Energy Chem., 2022, 71, 351, DOI:10.1016/j.jechem.2022.04.012.
- A. Mohanty, S. Sahu, L. B. Sukla and N. Devi, Mater. Today: Proc., 2021, 47, 1203, DOI:10.1016/j.matpr.2021.03.645.
- S. Sahu, M. Mohapatra and N. Devi, Mater. Today: Proc., 2022, 67, 1016, DOI:10.1016/j.matpr.2022.05.491.
- X. Zhang, L. Li, E. Fan, Q. Xue, Y. Bian, F. Wu and R. Chen, Chem. Soc. Rev., 2018, 47, 7239, 10.1039/C8CS00297E.
- S. P. Barik, G. Prabaharan and L. Kumar, J. Cleaner Prod., 2017, 147, 37, DOI:10.1016/j.jclepro.2017.01.095.
- H. Chen, S. Gu, Y. Guo, X. Dai, L. Zeng, K. Wang, C. He, G. Dodbiba, Y. Wei and T. Fujita, Hydrometallurgy, 2021, 205, 105746, DOI:10.1016/j.hydromet.2021.105746.
- D. Dutta, A. Kumari, R. Panda, S. Jha, D. Gupta, S. Goel and M. K. Jha, Sep. Purif. Technol., 2018, 200, 327, DOI:10.1016/j.seppur.2018.02.022.
- F. Wang, R. Sun, J. Xu, Z. Chen and M. Kang, RSC Adv., 2016, 6, 85303, 10.1039/C6RA16801A.
- X. Chen, H. Ma, C. Luo and T. Zhou, J. Hazard. Mater., 2017, 326, 77, DOI:10.1016/j.jhazmat.2016.12.021.
- M. Xu, S. Kang, F. Jiang, X. Yan, Z. Zhu, Q. Zhao, Y. Teng and Y. Wang, RSC Adv., 2021, 11, 27689, 10.1039/D1RA04979H.
- J. Wang, K. Huang, H. Dong, Y. Lu, K. Liu, Z. Chen, X. Shan, G. Huang and L. Wei, RSC Adv., 2022, 12, 23683, 10.1039/D2RA04391B.
- L. Yao, H. Yao, G. Xi and Y. Feng, RSC Adv., 2016, 6, 17947, 10.1039/C5RA25079J.
- J. de Oliveira Demarco, J. Stefanello Cadore, F. da Silveira de Oliveira, E. Hiromitsu Tanabe and D. Assumpção Bertuol, Hydrometallurgy, 2019, 190, 105169, DOI:10.1016/j.hydromet.2019.105169.
- M. Roshanfar, R. Golmohammadzadeh and F. Rashchi, J. Environ. Chem. Eng., 2019, 7, 102794, DOI:10.1016/j.jece.2018.11.039.
- G. P. Nayaka, Y. Zhang, P. Dong, D. Wang, Z. Zhou, J. Duan, X. Li, Y. Lin, Q. Meng, K. V. Pai, J. Manjanna and G. Santhosh, J. Environ. Chem. Eng., 2019, 7, 102854, DOI:10.1016/j.jece.2018.102854.
- A. Verma, G. H. Johnson, D. R. Corbin and M. B. Shiflett, ACS Sustainable Chem. Eng., 2020, 8, 6100, DOI:10.1021/acssuschemeng.0c01128.
- L. Li, W. Qu, X. Zhang, J. Lu, R. Chen, F. Wu and K. Amine, J. Power Sources, 2015, 282, 544, DOI:10.1016/j.jpowsour.2015.02.073.
- N. B. Horeh, S. M. Mousavi and S. A. Shojaosadati, J. Power Sources, 2016, 320, 257, DOI:10.1016/j.jpowsour.2016.04.104.
- L. Li, Y. Bian, X. Zhang, Q. Xue, E. Fan, F. Wu and R. Chen, J. Power Sources, 2018, 377, 70, DOI:10.1016/j.jpowsour.2017.12.006.
- B. Musariri, G. Akdogan, C. Dorfling and S. Bradshaw, Miner. Eng., 2019, 137, 108, DOI:10.1016/j.mineng.2019.03.027.
- A. Islam, S. Roy, M. A. Khan, P. Mondal, S. H. Teo, Y. H. Taufiq-Yap, M. T. Ahmed, T. R. Choudhury, G. Abdulkreem-Alsultan, S. Khandaker and Md. R. Awual, J. Mol. Liq., 2021, 338, 116703, DOI:10.1016/j.molliq.2021.116703.
- J. YANG, L. JIANG, F. LIU, M. JIA and Y. LAI, Trans. Nonferrous Met. Soc. China, 2020, 30, 2256, DOI:10.1016/S1003-6326(20)65376-6.
- M. Yu, Z. Zhang, F. Xue, B. Yang, G. Guo and J. Qiu, Sep. Purif. Technol., 2019, 215, 398, DOI:10.1016/j.seppur.2019.01.027.
- L. Li, J. B. Dunn, X. X. Zhang, L. Gaines, R. J. Chen, F. Wu and K. Amine, J. Power Sources, 2013, 233, 180, DOI:10.1016/j.jpowsour.2012.12.089.
- X. Chen, B. Fan, L. Xu, T. Zhou and J. Kong, J. Cleaner Prod., 2016, 112, 3562, DOI:10.1016/j.jclepro.2015.10.132.
- L. Li, J. Lu, Y. Ren, X. X. Zhang, R. J. Chen, F. Wu and K. Amine, J. Power Sources, 2012, 218, 21, DOI:10.1016/j.jpowsour.2012.06.068.
- J. Lie and J.-C. Liu, Sep. Purif. Technol., 2021, 266, 118458, DOI:10.1016/j.seppur.2021.118458.
- H. Da, M. Gan, D. Jiang, C. Xing, Z. Zhang, L. Fei, Y. Cai, H. Zhang and S. Zhang, ACS Sustainable Chem. Eng., 2021, 9, 16192, DOI:10.1021/acssuschemeng.1c05374.
- C. Yuwen, B. Liu, H. Zhang, S. Tian, L. Zhang, S. Guo and B. Zhou, J. Cleaner Prod., 2022, 333, 130197, DOI:10.1016/j.jclepro.2021.130197.
- B. Markey, M. Zhang, I. Robb, P. Xu, H. Gao, D. Zhang, J. Holoubek, D. Xia, Y. Zhao, J. Guo, M. Cai, Y. S. Meng and Z. Chen, J. Electrochem. Soc., 2020, 167, 160511, DOI:10.1149/1945-7111/abcc2f.
- R. Golmohammadzadeh, F. Faraji and F. Rashchi, Resour., Conserv. Recycl., 2018, 136, 418, DOI:10.1016/j.resconrec.2018.04.024.
- J. Nielsen, M. Fussenegger, J. Keasling, S. Y. Lee, J. C. Liao, K. Prather and B. Palsson, Nat. Chem. Biol., 2014, 10, 319, DOI:10.1038/nchembio.1519.
- A. Apelblat, Citric acid, Springer, 2014 Search PubMed.
- M. M. Theron and J. F. Rykers Lu, Organic acids and food preservation, CRC press, 2010. DOI:10.1201/9781420078435.
- L.-P. He, S.-Y. Sun, Y.-Y. Mu, X.-F. Song and J.-G. Yu, ACS Sustainable Chem. Eng., 2016, 5, 714, DOI:10.1021/acssuschemeng.6b02056.
- G. P. Nayaka, K. V. Pai, G. Santhosh and J. Manjanna, Hydrometallurgy, 2016, 161, 54, DOI:10.1016/j.hydromet.2016.01.026.
- L. Li, L. Zhai, X. Zhang, J. Lu, R. Chen, F. Wu and K. Amine, J. Power Sources, 2014, 262, 380, DOI:10.1016/j.jpowsour.2014.04.013.
- D. Chen, S. Rao, D. Wang, H. Cao, W. Xie and Z. Liu, Chem. Eng. J., 2020, 388, 124321, DOI:10.1016/j.cej.2020.124321.
- S. Yan, C. Sun, T. Zhou, R. Gao and H. Xie, Sep. Purif. Technol., 2021, 257, 117930, DOI:10.1016/j.seppur.2020.117930.
- S. Refly, O. Floweri, T. R. Mayangsari, A. Sumboja, S. P. Santosa, T. Ogi and F. Iskandar, ACS Sustainable Chem. Eng., 2020, 8, 16104, DOI:10.1021/acssuschemeng.0c01006.
- P. K. Parhi, K. H. Park and G. Senanayake, J. Ind. Eng. Chem., 2013, 19, 589, DOI:10.1016/j.jiec.2012.09.028.
- W. Gao, J. Song, H. Cao, X. Lin, X. Zhang, X. Zheng, Y. Zhang and Z. Sun, J. Cleaner Prod., 2018, 178, 833, DOI:10.1016/j.jclepro.2018.01.040.
- S. Yan, C. Sun, T. Zhou, R. Gao and H. Xie, Sep. Purif. Technol., 2021, 257, 117930, DOI:10.1016/j.seppur.2020.117930.
- K. Gu, W. Zheng, B. Ding, J. Han and W. Qin, Miner. Eng., 2022, 186, 107736, DOI:10.1016/j.mineng.2022.107736.
- F. Meng, Q. Liu, R. Kim, J. Wang, G. Liu and A. Ghahreman, Hydrometallurgy, 2020, 191, 105160, DOI:10.1016/j.hydromet.2019.105160.
- I. A. Nnanwube and O. D. Onukwuli, S. Afr. J. Chem. Eng., 2023, 43, 24, DOI:10.1016/j.sajce.2022.09.014.
- I. A. Nnanwube, O. D. Onukwuli and E. O. Ekumankama, Can. Metall. Q., 2022 DOI:10.1080/00084433.2022.2099725.
- I. A. Nnanwube and O. D. Onukwuli, J. Eng. Appl. Sci., 2018, 13, 63 Search PubMed.
- F. Mori, M. Kubouchi and Y. Arao, J. Mater. Sci., 2018, 53, 12807, DOI:10.1007/s10853-018-2538-3.
- V. Zólyomi, J. Koltai and J. Kürti, Phys. Status Solidi B, 2011, 248, 2435, DOI:10.1002/pssb.201100295.
- Z. Lin, P. Karthik, M. Hada, T. Nishikawa and Y. Hayashi, Nanomaterials, 2017, 7, 125, DOI:10.3390/nano7060125.
- D. B. Schuepfer, F. Badaczewski, J. M. Guerra-Castro, D. M. Hofmann, C. Heiliger, B. Smarsly and P. J. Klar, Carbon, 2020, 161, 359, DOI:10.1016/j.carbon.2019.12.094.
- H. Da, M. Gan, D. Jiang, C. Xing, Z. Zhang, L. Fei, Y. Cai, H. Zhang and S. Zhang, ACS Sustainable Chem. Eng., 2021, 9, 16192, DOI:10.1021/acssuschemeng.1c05374.
- A. Sarkar, P. Shrotriya and I. C. Nlebedim, Waste Manage., 2022, 150, 320, DOI:10.1016/j.wasman.2022.07.026.
- L. Li, E. Fan, Y. Guan, X. Zhang, Q. Xue, L. Wei, F. Wu and R. Chen, ACS Sustainable Chem. Eng., 2017, 5, 5224, DOI:10.1021/acssuschemeng.7b00571.
Footnote |
| † Electronic supplementary information (ESI) available. See DOI: https://doi.org/10.1039/d2ra07926g |
| This journal is © The Royal Society of Chemistry 2023 |


