 Open Access Article
A coumarin-based fluorescent chemosensor as a Sn indicator and a fluorescent cellular imaging agent†
Hamide Hosseinjani-Pirdehia,
Soode Amigh b,
Afshan Mohajeric,
Elahe Nazeria,
Amir Taheria,
Keivan Majidzadeh-Aa,
Zahra Mohammadpour
 *d and
Rezvan Esmaeili
 *a
*a
aGenetics Department, Breast Cancer Research Center, Motamed Cancer Institute, ACECR, Tehran, Iran. E-mail: esmaeili.rezvan@gmail.com; r_esmaeili@acecr.ac.ir
bDepartment of Chemistry, Shahid Bahonar University of Kerman, Kerman, Iran
cDepartment of Chemistry, College of Sciences, Shiraz University, Shiraz 7194684795, Iran
dBiomaterials and Tissue Engineering Department, Breast Cancer Research Center, Motamed Cancer Institute, ACECR, Tehran, Iran. E-mail: mohammadpour@acecr.ac.ir
First published on 27th March 2023
Abstract
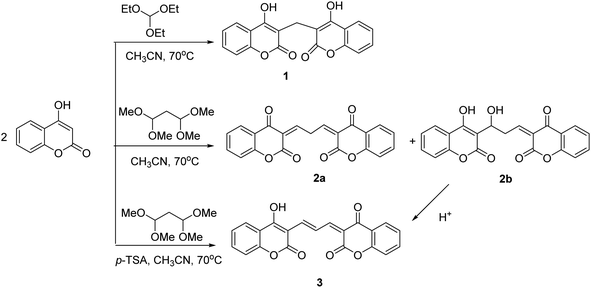
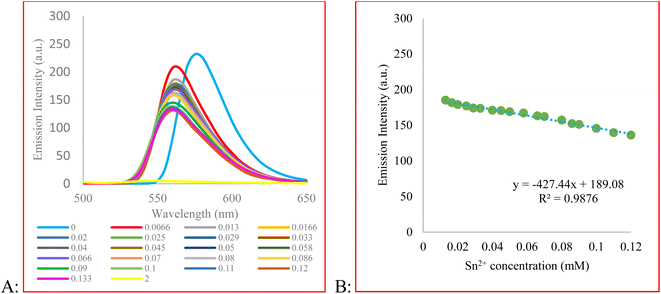
In the present study, fluorogenic coumarin-based probes (1–3) through condensation of 4-hydroxy coumarin with malondialdehyde bis(diethyl acetal)/triethyl orthoformate were prepared. The absorption and fluorescence emission properties of 2b and 3 in different solvents were studied, and a considerable solvatochromic effect was observed. The sensitivity of chemosensors 2b and 3 toward various cations and anions was investigated. It was revealed that compound 3 had a distinct selectivity toward Sn2+, possibly via a chelation enhanced quenching mechanism. The fluorescence signal was quenched over the concentration range of 6.6–120 μM, with an LOD value of 3.89 μM. The cytotoxicity evaluation of 3 against breast cancer cell lines demonstrated that the chemosensor was nontoxic and could be used successfully in cellular imaging. The probe responded to tin ions not only via fluorescence quenching, but also through colorimetric signal change. The change in optical properties was observed in ambient conditions and inside living cells.
1 Introduction
Tin is a heavy metal with widespread use in industry. It is employed as a protective coating in the food industry for canned foods and drinks.1 As fluoride or chloride salts, it is used in toothpaste, soap, perfume, and food additives. Furthermore, organotin compounds are applied in preparing plastics and pesticides.2 Due to the widespread use of organic and inorganic tin compounds, large amounts of this ion discharge into aquatic systems and the environment, which pose serious health issues to various organisms and human lives at high concentrations. As a reducing agent, SnCl2 is necessary for fixation of technetium-99 (Tc-99m) radioisotope on pharmaceuticals. Tc-99m and SnCl2 are co-administered intravenously for diagnostic purposes in nuclear medicine. Reports indicated that Sn2+ could cause damage to DNA.3–6 Moreover, Turgay Şişman observed teratogenic effects in zebrafish embryos after exposure to various concentrations of SnCl2.7 Therefore, detecting tin ions in a selective and sensitive manner is essential.Among the analytical techniques available for quantitatively measuring Sn2+ ions, only a few reports are devoted to electrochemical analyses.8–10 Most studies have focused on molecular probes for colorimetric and fluorometric assay of Sn ions in both oxidation states (II and IV).11–20 Fluorometric approaches offer rapid detection, the feasibility of operation, and high sensitivity. Their sensing mechanism is based on fluorescence enhancement or quenching in the presence of a target analyte. Coumarin-based fluorescent probes have received special attention for sensing various metal ions, including Pb2+,21 Hg2+,22,23 and Cu2+,24,25 among others.26–28 Coumarin, a natural compound found in plants, belongs to flavonoids and possesses a variety of biological activities. Its importance in biology relies on its antiviral, anti-inflammatory, anticancer, antioxidant, enzyme inhibition, and antimicrobial properties.29 Alongside the biological features, coumarin is a fluorophore with high quantum yield and photostability, thus exhibiting promising performance in detecting metal ions at trace levels. Furthermore, its toxicity is low and other molecules can easily modify it for functionality enhancement. To this end, coumarin is linked to other molecules by several linkers including hydrazine,30,31 ethylenediamine,32 tris(2-aminoethyl) amine,33 and diethylenetriamine.34
In the present study, we synthesized compound 3, a derivative of coumarin, to detect Sn2+ ions in aqueous environments via fluorescence quenching selectively. We found that the synthesized compound was nontoxic to cells, ensuring their biocompatibility. Therefore, we employed the synthesized compound for the imaging of Sn2+ in cellular models. The present research is an extension of our research on synthesizing chemosensors active in cellular environments.35 Herein, we report the malondialdehyde bis(diethyl acetal)-based coumarin derivatives as fluorescent indicators, which among them only compound 3 demonstrated a high potency to Sn2+ detection.
2 Experiment section
2.1 Materials and instruments
All of the solvents and reagents were purchased from Merck and Sigma-Aldrich. Melting points were measured with an Electrothermal 9100 apparatus without corrections. FTIR spectra were recorded on a NICOLET FTIR 100 spectrometer using KBr pellets. Ultraviolet-Visible (UV-Vis) and fluorescence spectra were recorded with a Rayleigh UV-2601 double-beam spectrophotometer and a PerkinElmer LS45 fluorescence spectrophotometer, respectively. 1H NMR and 13C NMR spectra were measured with Bruker DRX-500 AVANCE spectrometer. Chemical shifts of 1H and 13C NMR spectra were expressed in parts per million (ppm) downfield from tetramethylsilane (TMS) as an internal reference, using chloroform (CDCl3) and dimethyl sulfoxide (DMSO-d6) as the solvents at room temperature (25 °C). Mass spectra were recorded on a FINNIGAN-MATT 8430 mass spectrometer operating at an ionization potential of 20 or 70 eV. The CHN analysis was performed on a Vario ELIII elemental analyzer.2.2 Synthesis of 3-(4-hydroxy-2-oxo-2H-chromen-3-ylmethylene)-chromane-2,4-dione (1)
4-Hydroxy coumarin (2.0 eq., 2.0 × 10⁻³ mol, 0.324 g) and triethyl orthoformate (1.0 eq., 1.0 × 10⁻³ mol, 0.148 g) were dissolved in dry acetonitrile (1.0 × 10⁻³ L). The reaction mixture was allowed to stir at 70 °C for 3 hours. After completion of the reaction, monitored by TLC, the reaction mixture was filtered and the residue was washed with cold acetonitrile. A white powder was obtained in 80% yield (0.269 g). The ESI† extensively discusses the characterization data of compound 1 (Fig. A.1 and A.2†).2.3 Synthesis of (3Z,3′Z)-3,3′-(propane-1,3-diylidene) bis(chromane-2,4-dione) (2a)
4-Hydroxy coumarin (2.0 eq., 2.0 × 10⁻³ mol, 0.324 g) and malondialdehyde bis(diethyl acetal) (1.0 eq., 1.0 × 10⁻³ mol, 0.22 g) were dissolved in dry acetonitrile (1.0 × 10⁻³ L). The reaction mixture allowed to stir at 70 °C for 5 hours. After completion of the reaction, monitored by TLC, the reaction mixture was filtered, the residue was washed with cold acetonitrile. A white powder was obtained in 90% yield (0.324 g). The ESI† extensively discusses characterization data of compound 2a (Fig. B.1 and B.2†).2.4 Synthesis of 3-[3-hydroxy-3-(4-hydroxy-2-oxo-2H-chromen-3-yl)-propylidene]-chromane-2, 4-dione (2b)
Compound 2a is a white powder, which upon dispersion in DMF or water, converts to 2b. The chemical transformation is irreversible. To this end, (0.0108 g, 3.0 × 10⁻⁵ mol) of 2a was dissolved in DMF (1.0 × 10⁻² L) to afford the stock solution with the concentration of 3.0 × 10⁻³ M. After 4 hours, the solution color changed to pink. This stock solution was diluted to the desired concentration. Characterization data of compound 2b is extensively discussed in the ESI (Fig. C.1 and C.2†).2.5 Synthesis of 3-[3-(4-hydroxy-2-oxo-2H-chromen-3-yl) allylidene]chromane-2,4-dione (3)
4-Hydroxy coumarin (2.0 eq., 2.0 × 10⁻³ mol, 0.324 g) and malondialdehyde bis(diethyl acetal) (1.0 eq., 1.0 × 10⁻³ mol, 0.220 g) were dissolved in dry acetonitrile (1.0 × 10⁻³ L). Afterward, p-toluenesulfonic acid (2.0 eq, 2.0 × 10⁻³ mol, 0.280 g) as the catalyst was added. The reaction was completed after 5 minutes at 70 °C. The reaction mixture was filtered and the residue was washed with cold acetonitrile. A red powder was obtained in 95% yield (0.342 g). Characterization data of compound 3 is extensively discussed in the ESI (Fig. D.1 and D.2†).2.6 Fluorescence titration of 3 with ions
A stock solution of compound 3 was prepared in ethanol to the final concentration of 3.0 × 10⁻³ M. This stock solution was diluted to the desired concentration. Chloride salts of the cations (Sn2+, Fe3+, As3+, Li+, Ni2+, Ba2+, Hg2+, K+, Sn2+, Mn2+, Na+, Ca2+, Zn2+, Cd2+, Co2+, Al3+, Cu+, Cu2+) and sodium salts of the anions (Cl−, OAc−, NO3−, SO42−, SCN−, PO43−, 10 eq.) were prepared in deionized water to afford 2 × 10⁻² M aqueous solution. The ions were added to a solution of compound 3 in a quartz cell (path length of 1 cm). The change in the fluorescence spectrum of 3 at 480 nm was recorded immediately after preparing sample. All the experiments were conducted at room temperature. The excitation wavelength of 3 was 480 nm.2.7 Cell culture and imaging
The breast cancer cell line MCF7, received from the Pasteur institute (Tehran, Iran), was grown in Dulbecco's Modified Eagle Medium (DMEM) supplemented with 10% (v/v) fetal bovine serum (FBS) and 1.5% (v/v) Penicillin-Streptomycin (Pen-Strep) at 37 °C in a humidified environment of 5% CO2. Then cells were treated with 2.5 × 10⁻⁵ M of compound 3 in EtOH–water 2![[thin space (1/6-em)]](https://www.rsc.org/images/entities/char_2009.gif) :
:![[thin space (1/6-em)]](https://www.rsc.org/images/entities/char_2009.gif) 3 (v/v) for 45 minutes at 37 °C, then incubated with SnCl2 (0.5, 0.1 and 1.0 × 10⁻⁴ M) for 60 minutes. The fluorescence images were obtained on a fluorescent microscope with an objective lens (×200).
3 (v/v) for 45 minutes at 37 °C, then incubated with SnCl2 (0.5, 0.1 and 1.0 × 10⁻⁴ M) for 60 minutes. The fluorescence images were obtained on a fluorescent microscope with an objective lens (×200).
2.8 Cytotoxicity assays
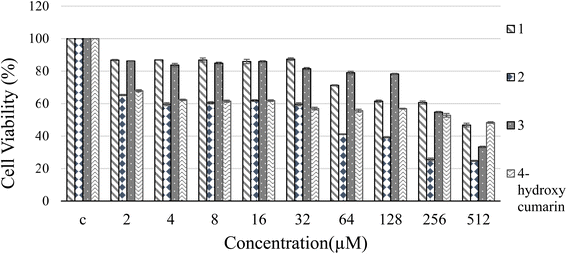
In 96-well plate, 10![[thin space (1/6-em)]](https://www.rsc.org/images/entities/char_2009.gif) 000 cells were seeded per well. One molar concentration of different components was prepared in 40% ethanol. Then, serial dilution of components was prepared in fresh medium. They were added triplicate after 24 h of seeding. The incubation time was 24 h. The fresh medium containing 0.5 mg mL−1 of MTT was added. Optical density was measured at 570 nm with solvent as blank using a Bio-Rad microplate reader. The negative control was the cell culture medium without components. The IC50 (concentration for 50% cell growth inhibition) was calculated from the dose–response curve.
000 cells were seeded per well. One molar concentration of different components was prepared in 40% ethanol. Then, serial dilution of components was prepared in fresh medium. They were added triplicate after 24 h of seeding. The incubation time was 24 h. The fresh medium containing 0.5 mg mL−1 of MTT was added. Optical density was measured at 570 nm with solvent as blank using a Bio-Rad microplate reader. The negative control was the cell culture medium without components. The IC50 (concentration for 50% cell growth inhibition) was calculated from the dose–response curve.
3 Result and discussion
3.1 Design and synthesis of compounds 2–3
Coumarin is a natural product derived from plants and is known for its biological characteristics. The molecule is fluorescent over the emission range of 400–500 nm. Dicoumarol (1) is a natural anticoagulant bearing two equivalent coumarins, which are linked via a –CH2– group. As shown in Fig. E.1A,† the maximum emission wavelength of 1 is almost the same as the parent molecule, coumarin, since the connection between the two fluorescent motifs is through a methylene bridge. In the present study, we attached coumarins through conjugated π bonds. Extending the conjugation system shifted the emission wavelength to higher values. To this end, we used malondialdehyde bis(dimethyl acetal) to produce compound 2a (Scheme 1). Exposure of 2a to DMF or water converts it to 2b in an irreversible manner. The higher emission intensity of 2b compared with 2a, makes the former more favorable for sensor design. Therefore, we evaluated several solvents and temperatures to find experimental conditions at which the transformation of 2a to 2b occurs at high rates. The results showed that the conversion of compound 2a to compound 2b in protic and aprotic solvents with different polarities occurs at different rates, and no order was observed. Also, using dried solvents and reducing the temperature significantly decreased the conversion speed. However, among the various conditions tested, incubating 2a with DMF at RT for 4 h was the best for the completion of the reaction. The conversion of 2a to 2b was monitored in DMF with fluorescence spectroscopy. The evolution of the fluorescence emission upon dispersion of 2a in DMF is represented in Fig. E.1B.† As is shown, the emission of 2a (0 min) is very weak, while 2b has a strong emission intensity at the same concentration. The results showed that this conversion was completed by 4 hours at room temperature. NMR spectroscopy verified the conversion of 2a to 2b (Fig. F.1†). The 1HNMR of 2a was recorded in CDCl3, while that of 2b was measured in DMSO-d6. The result confirmed that 92% of 2a converted to 2b.In an acidic environment without any catalyst being involved, 2b transformed to 3 (Scheme 1). So, we examined different acids such as HCl, p-TSA, CuCl, LiClO4. After confirming p-TSA as the best, the amount of the acid was determined, which showed the equivalent of p-TSA in the shortest time had the best results in the formation of product 3 from 2b. Nevertheless, 3 can be directly prepared from the reactant and the linker in the presence of p-TSA. Both 2b and 3 showed strong fluorescence emission in the visible range of the electromagnetic spectrum. In the following experiments, the binding affinity of the two compounds toward various metal ions was studied.
3.2 Solvatochromic effect of 2b and 3
The solvatochromic effect was studied by the measurement of the emission profiles of 2b and 3 in solvents with different polarities. The fluorescence spectra of compounds 2b and 3 as well as the absorption spectra of 3 in solvents of different polarities at room temperature were recorded. In general, the solvent polarity decreases according to the order of water > methanol (MeOH) > ethanol (EtOH) > acetonitrile (CH3CN) > DMSO > DMF > acetone > ethyl acetate (EtOAc) > THF. Solvatochromism originates from the differences between the solvation energy of the initial and excited state of the dye in various solvents. Accordingly, we observed that the absorption and emission profiles of both dyes strongly depend on the solvent. UV-Vis absorption and fluorescence spectroscopy confirmed the solvatochromic effect of 3 (Fig. G.1†). We used solvents of distinct polarity. Fig. G.1A† shows solvent-dependent peak shift. Except for DMSO and DMF, which shows a reverse trend, with decreasing solvent polarity (EtOH![[thin space (1/6-em)]](https://www.rsc.org/images/entities/char_2009.gif) :
:![[thin space (1/6-em)]](https://www.rsc.org/images/entities/char_2009.gif) H2O (2
H2O (2![[thin space (1/6-em)]](https://www.rsc.org/images/entities/char_2009.gif) :
:![[thin space (1/6-em)]](https://www.rsc.org/images/entities/char_2009.gif) 3) > EtOH
3) > EtOH![[thin space (1/6-em)]](https://www.rsc.org/images/entities/char_2009.gif) :
:![[thin space (1/6-em)]](https://www.rsc.org/images/entities/char_2009.gif) H2O (2
H2O (2![[thin space (1/6-em)]](https://www.rsc.org/images/entities/char_2009.gif) :
:![[thin space (1/6-em)]](https://www.rsc.org/images/entities/char_2009.gif) 1) > MeOH > EtOH > DMSO > DMF), the maximum emission wavelength shows a red shift from 569 nm to 580 nm. Fig. G.1A† also illustrates that compound 3 does not emit light in certain solvents (THF, EtOAc, CH2Cl2, acetone, CH3CN, EtOH
1) > MeOH > EtOH > DMSO > DMF), the maximum emission wavelength shows a red shift from 569 nm to 580 nm. Fig. G.1A† also illustrates that compound 3 does not emit light in certain solvents (THF, EtOAc, CH2Cl2, acetone, CH3CN, EtOH![[thin space (1/6-em)]](https://www.rsc.org/images/entities/char_2009.gif) :
:![[thin space (1/6-em)]](https://www.rsc.org/images/entities/char_2009.gif) H2O (1
H2O (1![[thin space (1/6-em)]](https://www.rsc.org/images/entities/char_2009.gif) :
:![[thin space (1/6-em)]](https://www.rsc.org/images/entities/char_2009.gif) 5)). The measured stock shift of compound 3 in EtOH/water (2
5)). The measured stock shift of compound 3 in EtOH/water (2![[thin space (1/6-em)]](https://www.rsc.org/images/entities/char_2009.gif) :
:![[thin space (1/6-em)]](https://www.rsc.org/images/entities/char_2009.gif) 3 v/v) was 42 nm (λex = 480 nm, λem = 570 nm, λabs = 528). The peak shift is also observed in the UV-Vis absorption profile of 3 (Fig. G.1B†). The spectral shift of 3 in Fig. G.1B† almost follows the order of solvent polarity. Except for DMF, which does not show a reasonable trend, with decreasing polarity from methanol to THF, the absorption peak shows a redshift of 8 nm.
3 v/v) was 42 nm (λex = 480 nm, λem = 570 nm, λabs = 528). The peak shift is also observed in the UV-Vis absorption profile of 3 (Fig. G.1B†). The spectral shift of 3 in Fig. G.1B† almost follows the order of solvent polarity. Except for DMF, which does not show a reasonable trend, with decreasing polarity from methanol to THF, the absorption peak shows a redshift of 8 nm.
In the case of 2b, it is notable that this compound mostly solubilizes in DMF. Therefore, to study the solvatochromic effect, we prepared a solvent mixture in such a way that DMF was used as a co-solvent with a volume ratio of 1![[thin space (1/6-em)]](https://www.rsc.org/images/entities/char_2009.gif) :
:![[thin space (1/6-em)]](https://www.rsc.org/images/entities/char_2009.gif) 5 (DMF
5 (DMF![[thin space (1/6-em)]](https://www.rsc.org/images/entities/char_2009.gif) :
:![[thin space (1/6-em)]](https://www.rsc.org/images/entities/char_2009.gif) solvent (x)). The results showed with increasing the solvent polarity, the fluorescence intensity of 2b decreased, and the maximum emission wavelength showed a slight shift to lower values (Fig. G.2†). An exception of the wavelength shift was observed for water, at which case the shift was toward the opposite direction. It is possible that other type of solvent–solute interactions is present in water.36 The stock shift in the DMF/water (1
solvent (x)). The results showed with increasing the solvent polarity, the fluorescence intensity of 2b decreased, and the maximum emission wavelength showed a slight shift to lower values (Fig. G.2†). An exception of the wavelength shift was observed for water, at which case the shift was toward the opposite direction. It is possible that other type of solvent–solute interactions is present in water.36 The stock shift in the DMF/water (1![[thin space (1/6-em)]](https://www.rsc.org/images/entities/char_2009.gif) :
:![[thin space (1/6-em)]](https://www.rsc.org/images/entities/char_2009.gif) 5 v/v) was 32 nm (λex = 470 nm, λem = 565 nm, and λabs = 533 nm). Similar to 3, the UV-Vis spectral shift of 2b with decreasing solvent polarity directed toward longer wavelengths (data not shown). According to the UV-Vis absorption spectroscopy, the solvatochromic behavior of 2b and 3 was similar.
5 v/v) was 32 nm (λex = 470 nm, λem = 565 nm, and λabs = 533 nm). Similar to 3, the UV-Vis spectral shift of 2b with decreasing solvent polarity directed toward longer wavelengths (data not shown). According to the UV-Vis absorption spectroscopy, the solvatochromic behavior of 2b and 3 was similar.
3.3 Ion sensing property of 2b and 3
2b was added to a standard solution of each ion (Fe3+, As3+, Li+, Ni2+, Ba2+, Hg2+, K+, Sn2+, Mn2+, Na+, Ca2+, Zn2+, Cd2+, Co2+, Al3+, Cu+, Cu2+, Cl−, OAc−, NO3−, SO42−, SCN−, PO43−, 10 eq.) to determine their contribution in signal change (Fig. 1A). The result showed that the signal of 2b did not change, except, partially, for Fe2+. The selectivity of 3 toward the same ions were tested. We observed that, Sn2+ quenched the fluorescence signal of 3 almost completely. Fe2+ and, to some extent, Fe3+quenched the fluorescence signal possibly due to their strong quenching behavior and paramagnetic properties.12,37,38 A competitive study was carried out with the co-existence of other metal ions. To this end, the fluorescence spectra of compound 3 + Sn2+ (10 eq.) in the presence of other cations and anions (10 eq.) as coexisting species were measured. As shown in Fig. 1B, the response of 3 to Sn2+ was almost identical to the signal observed in the presence of Sn2+ + other ions. Overall, the data in Fig. 1 demonstrates high selectivity of 3 toward Sn2+.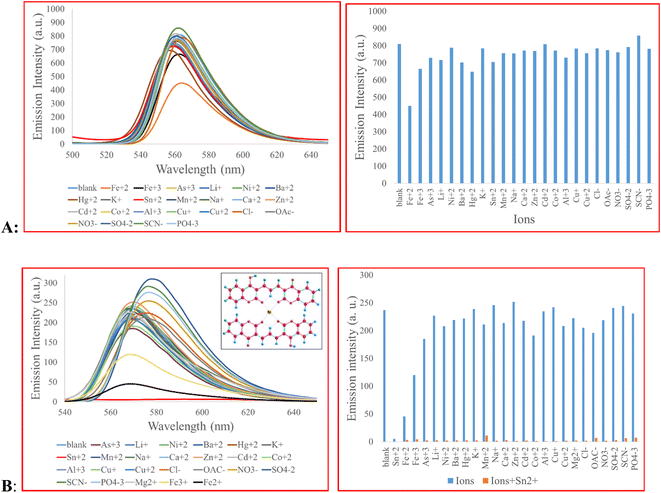 | ||
| Fig. 1 (A) Fluorescence emission of 2b (5.0 × 10⁻⁵ M) in the presence of different ions (10 eq.), 2b was solubilized in DMF–H2O (1/5, v/v) with λex of 470 nm; (B) fluorescence emission of 3 (5.0 × 10⁻⁵ M) in response to various ions (10 eq.), 3 was solubilized in EtOH–H2O (2/3, v/v) with λex of 480 nm. The concentration of sodium and potassium ions is 34 mM and 120 mM, respectively, equal to the values found in normal lymphocytes.39 | ||
Table 1 compares the analytical performance of 3 to other probes used for the optical determination of metal ions. The one-step synthesis of 3 is accomplished under mild experimental condition and a short time. The starting material and the product are not toxic. Our probe is highly selective toward Sn2+. Except for Fe2+ and partially Fe3+, no ion is interfering in signal quenching. The selectivity of 3 is better or comparable to most of the reported probes in Table 1. While some reports determined metal ions down to nanomolar concentration, our LOD value is in the micromolar concentration range, similar to ref. 40–43. Besides, the fluorescence signal of our probe is stable under physiological conditions and it can penetrate into the living cells.
| Fluorophore | Metal ion | Detection mode | Detection limit | Interferences | References |
|---|---|---|---|---|---|
| 4-Phenyl-2-(2′-pyridyl) quinoline | Fe3+ | Turn on (Fe3+) | Fe2+: 8.772 × 10⁻⁹ mol L−1 | Fe2+ interferes the detection of Fe3+ and vice versa | 44 |
| Fe2+ | Turn off (Fe2+) | Fe3+: 1.912 × 10⁻⁹ mol L−1 | |||
| A naphthol hydrazone Schiff base bearing benzothiadiazole | Fe3+ | Turn off | 0.036 μM | — | 45 |
| A composite film containing (18-crown-6)-styrylpyridine | Hg2+ | Fluorescence signal blue shift | 10−8 mol L−1 | — | 46 |
| Anthracene benzene conjugate | Ag+ | Turn off | 1.4 nM | Bi3+ | 47 |
| 2,2′-Bipyridyl acylhydrazone Schiff base | Cu2+ | Turn off | 2.7 × 10⁻⁶ mol L−1 | Zn2+ enhances the signal | 40 |
| [(Z)-2-((Pyren-1-ylmethylene)amino)phenol] | Ga3+ | Turn on | 3.35 nM | The interference of Fe2+ or Fe3+ is not investigated | 48 |
| 1-(6-Aminopyridin2-yl)-3-phenylthiourea | Hg2+, Ag+, Au3+ | Turn on | 5.01 × 10⁻⁷ M for Hg2+ | Each target ion interferes with the fluorescence signals of the others | 49 |
| 2.14 × 10⁻⁸ M for Ag+ | |||||
| 34 × 10−7 M for Au3+ | |||||
| 2-Hydroxy-naphthalene hydrazone based probe | Cu2+ and Al3+ | Colorimetric for Cu2+ | 0.4 μM for Cu2+ | Al3+ interferes with the colorimetric signal of Cu2+ | 50 |
| Fluorometric for Al3+ | 14 nM for Al3+ | ||||
| Macroacyclic Schiff base ligand ((1E)-1-(2-methylphenyl)-N-[2-(4-{2-[(E)-[(2-methylphenyl) methylidene]amino]phenyl}-1,4-diazepan-1-yl)phenyl]methani mine) | Al3+ | Turn on | 2.1 × 10⁻⁹ M | Cu2+, Sn2+, Fe2+, Fe3+ | 51 |
| 1,2-Alternate thiacalix [4]arene-based fluorophore | Ag+ | Turn off | 7.6 × 10⁻⁹ M | The interference of Fe2+ is not investigated, Al3+ interferes | 52 |
| Anthracene-based Schiff base 2-(anthracen-9-ylmethylene)-N-methylhydrazine-1-carbothioamide | Ag+ | Turn off | 5.95 × 10⁻⁷ M | — | 53 |
| Naphthalene based fluorophores (OHHN) | Al3+ | Turn on | 0.176 × 10⁻⁵ M | — | 54 |
| 4-Vinyl substituted triphenylamine | Hg2+ | Turn off | 0.146 μM | Fe2+ | 55 |
| Styrylflavylium dye with a di-(2-picolyl)amine (DPA) moiety as the metal chelating unit | Zn2+ | Turn off | 0.39 μM | Cu2+ | 56 |
| (E)-4-Methyl-N′-((2,3,6,7-tetrahydro-1H,5H-pyrido[3,2,1-ij]quinolin-9-yl)methylene)benzenesulfonohydrazide | Bi3+ | Fluorescence (Turn on) | 6.39 nM 170 nM | The interference of Fe2+ is not investigated | 57 |
| UV-Vis (from colorless to crimson yellow) | |||||
| 1,4-Bis((ferrocenylidenehydrazono)methyl)benzene | Cu2+ | Turn on | 4.2 × 10⁻⁶M | — | 41 |
| N-(Pyrimidin-2-yl) thiophene-2-carboxamide | Fe3+ | Fluorescence (turn off) | 1.24 μM | — | 42 |
| UV-Vis (color change from colorless to yellow) | 2.03 μM | ||||
| 2-(2′-Hydroxyphenyl) benzothiazole derivative | Cd2+ | Turn on | 1.16 μM | Zn2+ | 43 |
| Coumarin-Schiff base compounds | Co2+ | Turn off | 0.11 μM | Co2+ | 58 |
| Ni2+ | 0.09 μM | Ni2+ | |||
| Cu2+ | 0.24 μM | Cu2+ | |||
| Coumarin-Picolinohydrazone derived Schiff base | Al3+ | Turn on | 0.0490 μM | Cu2+, Fe2+ | 59 |
| Coumarin azo dye | Cu2+ | Colorimetry | 0.0779 mg L−1 | — | 60 |
| Polyurethane nanoemulsion bearing coumarin derivative (PU-co-HCCA) | Hg2+ | Turn on | 1.61 ppb | — | 61 |
| TPPB | Sn2+ | Turn on | 0.116 μM | — | 20 |
| 2-(4-Chlorophenyl)-N-(4-((4-((1,4-dioxo-3-(thiophen-2-ylthio)-1,4-dihydronaphthalen-2-yl)amino) phenyl)sulfonyl)phenyl)acetamide | Sn2+ | Turn on | 79 nM | — | 62 |
| 4-((3-Chloro-1,4-dioxo-1,4-dihydronaphthalen-2-yl)amino)-benzenesulfonamide | Sn2+ | Turn on | 0.115 μM | — | 63 |
| Rhodamine-triazole-pyridine ternary conjugation | Sn2+ | Turn on | 2.6 × 10⁻⁸ mol L−1 | — | 64 |
| 1-Aminopyrene and 5-bromo-2-thiophene carboxaldehyde | Sn2+ | Turn on | 5.4 × 10⁻⁶ M | — | 65 |
| Coumarin derivative | Sn2+ | Turn off | 3.89 × 10⁻⁶ M | Fe2+, Fe3+ | This work |
To gain more information about the sensing behavior of compound 3 toward Sn2+, the fluorescence titration experiment was performed. For this purpose, emission spectra of 3 upon the addition of Sn2+ ion were recorded (Fig. 2). As a result, with the increasing concentration of Sn2+, the fluorescence intensity gradually decreased. The measured detection limit (LOD = 3σ/m) was 3.89 × 10⁻⁶ M. The probe responded immediately after the addition of Sn2+ and its signal reached a plateau after 10 min (Fig. H.1†). We evaluated the reversibility of the system by adding EDTA, as a strong chelating reagent, to a solution of 3 + Sn2+. Fig. H.1 in the ESI† shows that the signal restores by 79% of its initial value showing system reversibility.
The quenching behavior of 3 in response to Sn2+ was studied by Stern–Volmer equation (eqn (1))
| F0/F = 1 + KSV [Q] | (1) |
F0 and F are the fluorescence intensity before and after the addition of the quencher, respectively, and [Q] is the quencher concentration. KSV is the Stern–Volmer quenching constant, which in case of dynamic (collisional) quenching is expressed as KD. On the other hand, when the quenching is static, KSV is designated as an association constant (KS). A linear Stern–Volmer plot indicates that either dynamic or static quenching occurs between the quencher and fluorophore (Fig. 3A).66 However, to determine which mechanism is involved in the quenching process, we compared the absorption profile of 3 before and after the addition of Sn2+ (Fig. 3B and C).66 After adding Sn2+, the intensity of the maximum absorption peak of 3 decreased. To obtain the difference spectrum, however, we normalized both spectra (Fig. 3B) and calculated the difference spectrum by point-by-point subtraction. As shown in Fig. 3C, a decrease in absorbance at 460 nm and an absorbance increase at 541 nm is observed, indicating the change in the absorbance spectrum of the fluorophore. Besides, the high value of KSV indicates static quenching.66,67 In the present study, the magnitude of KSV is 4.1 × 10³. Therefore, we speculate that the mechanism of quenching is static quenching.
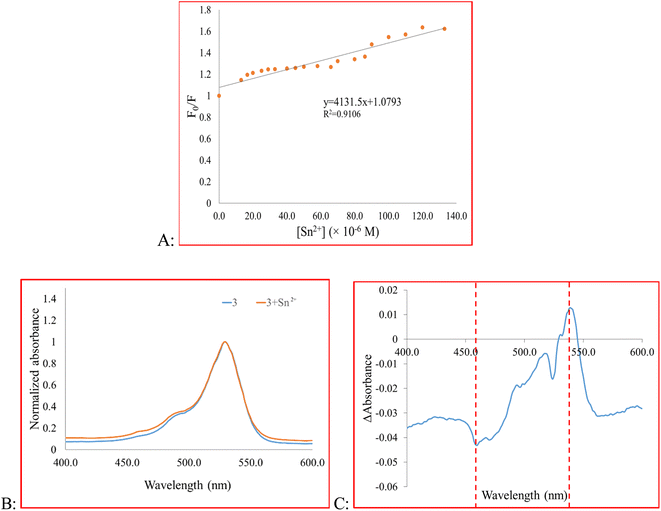 | ||
| Fig. 3 (A) Fluorescence quenching behavior of 3, (B) the absorbance spectra of 3 and 3 + Sn2+, (C) the difference spectrum of 3 and 3 + Sn2+. | ||
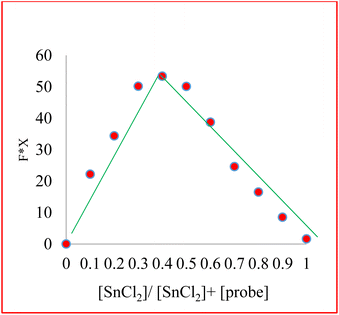
Job's plot analyses determined the binding stoichiometry of compound 3 with Sn2+ via analyzing the different Sn2+ concentrations' effect on fluorescence emission intensity changes. The maximum fluorescence change is produced when the molar fraction of Sn2+ is close to 0.4, indicating that the binding ratio of compound 3 to Sn2+ is 2![[thin space (1/6-em)]](https://www.rsc.org/images/entities/char_2009.gif) :
:![[thin space (1/6-em)]](https://www.rsc.org/images/entities/char_2009.gif) 1 (Fig. 4).
1 (Fig. 4).
The FT-IR analysis of 3 + Sn2+ strongly endorses complex formation (Fig. I.1†). The stretching vibration frequency of the esteric C![[double bond, length as m-dash]](https://www.rsc.org/images/entities/char_e001.gif) O (1718 cm−1) shifted to the lower frequency region (1711 cm−1) due to the reduction of the electron density, whereas stretching vibration frequencies of OH (3467 cm−1) and ketonic C
O (1718 cm−1) shifted to the lower frequency region (1711 cm−1) due to the reduction of the electron density, whereas stretching vibration frequencies of OH (3467 cm−1) and ketonic C![[double bond, length as m-dash]](https://www.rsc.org/images/entities/char_e001.gif) O (1636 cm−1) are relatively unchanged. This data indicated that complexation has occurred from the esteric functional group of the coumarin framework. The typical absorptions for Sn–O vibration in the complex are located in the normal range 420–480 cm−1, which can be seen as a broad signal and more intense than the compound 3 signal in this region. The binding behavior of Sn2+ could be rationally explained by acid–base principle. Sn2+ is a soft acid with electrophilic properties. It preferentially coordinates with the electronegative soft base of oxygen.
O (1636 cm−1) are relatively unchanged. This data indicated that complexation has occurred from the esteric functional group of the coumarin framework. The typical absorptions for Sn–O vibration in the complex are located in the normal range 420–480 cm−1, which can be seen as a broad signal and more intense than the compound 3 signal in this region. The binding behavior of Sn2+ could be rationally explained by acid–base principle. Sn2+ is a soft acid with electrophilic properties. It preferentially coordinates with the electronegative soft base of oxygen.
3.4 Biological assessment
![[thin space (1/6-em)]](https://www.rsc.org/images/entities/char_2009.gif) :
:![[thin space (1/6-em)]](https://www.rsc.org/images/entities/char_2009.gif) Water 2
Water 2![[thin space (1/6-em)]](https://www.rsc.org/images/entities/char_2009.gif) :
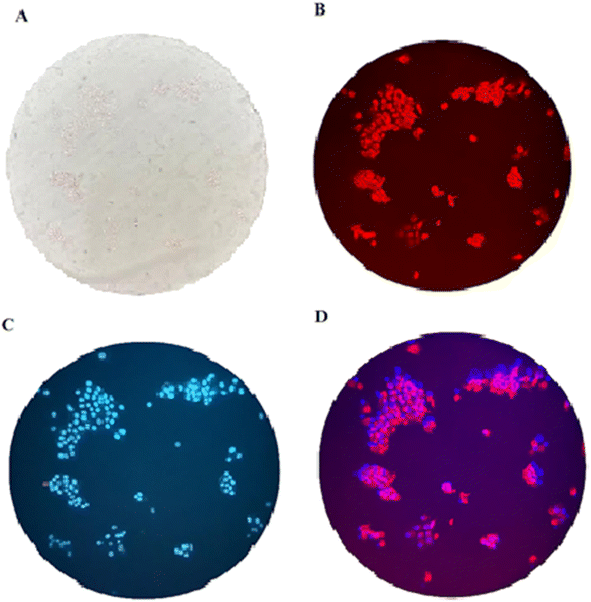
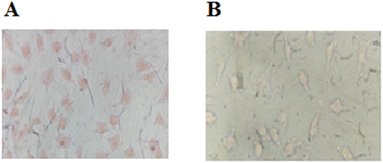
:![[thin space (1/6-em)]](https://www.rsc.org/images/entities/char_2009.gif) 3 (v/v) at 37 °C for 60 min to test the ability of compound 3 for live-cell imaging. The extra amount of the probe was removed by three times washing with PBS (pH = 7.2). Cells were also stained by DAPI as a nucleus-specific dye in the blue filter (Fig. 6). The MCF7 cells were further incubated with SnCl2 (100 μM). 5 to 30 min later, the fluorescence images were obtained on a fluorescent microscope with an objective lens (×200). Probe is located in nucleus and cytoplasm with higher aggregation in nucleus (Fig. J.1†). A significant decrease in the probe's fluorescence signal was observed after incubating cells with SnCl2 (Fig. 7). These results indicate that the probe is cell membrane permeable and can respond to the added SnCl2 in the living cells. Studies showed that tin compounds have genotoxicity, resulting in DNA damage and chromosomal aberrations.7 So, this probe can be used to detect tin pollution in cells. Notably, the cells became red under visible light in the first minute after staining. This property can be used for the colorimetric study of SnCl2 sensing. For this purpose, the image was obtained on a light microscope with an objective lens (×200) (Fig. 8).
3 (v/v) at 37 °C for 60 min to test the ability of compound 3 for live-cell imaging. The extra amount of the probe was removed by three times washing with PBS (pH = 7.2). Cells were also stained by DAPI as a nucleus-specific dye in the blue filter (Fig. 6). The MCF7 cells were further incubated with SnCl2 (100 μM). 5 to 30 min later, the fluorescence images were obtained on a fluorescent microscope with an objective lens (×200). Probe is located in nucleus and cytoplasm with higher aggregation in nucleus (Fig. J.1†). A significant decrease in the probe's fluorescence signal was observed after incubating cells with SnCl2 (Fig. 7). These results indicate that the probe is cell membrane permeable and can respond to the added SnCl2 in the living cells. Studies showed that tin compounds have genotoxicity, resulting in DNA damage and chromosomal aberrations.7 So, this probe can be used to detect tin pollution in cells. Notably, the cells became red under visible light in the first minute after staining. This property can be used for the colorimetric study of SnCl2 sensing. For this purpose, the image was obtained on a light microscope with an objective lens (×200) (Fig. 8).
3.5 Theoretical calculations
To rationalize the sensing behavior of compound 3 toward Sn2+ and the quenching of its fluorescence signal in the presence of Sn2+, we have performed a computational study in the framework of density functional theory (DFT). In a computational study, the choice of a proper calculation level is an important task that should be carried out with care to ensure the reliable prediction of electronic and optical properties. To this end, we have examined six functions belonging to different categories of DFT to choose the best method for our study. The examined functions were assessed for reproducing the experimental fluorescence emission signal of compound 3 (λmax = 560 nm). The geometry of the molecules was optimized at the first singlet excited state using the time-dependent DFT (TD-DFT) approach as implemented in Gaussian 09 package to simulate the fluorescence spectra.68 The implicit solvent effect has been included by employing the polarizable continuum model (PCM)69 within EtOH–H2O (2/3) medium. The results (Fig. K.1 in the ESI†) indicated that the hybrid B3LYP functional remarkably outperforms other tested functionals, and its result for the maximum emission wavelength of compound 3 (λmax = 534 nm) is in better agreement with the measured experimental value. Accordingly, all calculations were performed using the B3LYP functional and triple zeta valence plus polarization (TZVP) basis set.To gain deep insight into the sensing behavior of compound 3 toward Sn2+, we have compared the fluorescence emission of 3 in response to Sn2+ with its responses to three representative ions such as Li+, Na+, and Cl−. For reliable estimation of fluorescence emission wavelength, finding the correct geometry and the global minima of the complexes between compound 3 and ions on the potential energy surface is the first requirement. Accordingly, several possible initial configurations were constructed by aligning the considered ions on different adsorption sites of compound 3. Then, full geometrical optimizations without any symmetry constraint were performed and after relaxation, the most stable complexes were identified by comparing the adsorption energies. The optimized structures for the 3–ions complexes in their lowest energy configurations and the calculated adsorption energies are shown in Fig. L.1.†
The adsorption energies were calculated as the difference between the total energy of 3–ions complexes and the sum of energies of isolated 3 and ion fragments. The calculated adsorption energies follow the order of 3–Sn2+ ≫ 3–Na+ > 3–Li+ > 3–Cl−. The trend shows that the 3–Sn2+ complex is highly stable and its adsorption energy can be in the order of a chemical bond. The optimized configuration of 3–Sn2+ confirms the strong binding between compound 3 and Sn2+ by forming two Sn–O bonds. For further evidence, we simulated the IR spectra of 3–Sn2+ complex and the Sn–O vibration band located in 477 cm−1 was observed. In the case of Li+ and Na+, the cation is also positioned in the same plane of coumarins but taking a larger distance from the oxygen of C![[double bond, length as m-dash]](https://www.rsc.org/images/entities/char_e001.gif) O group resulting in weaker interaction. The adsorption energies for 3–Li+ and 3–Na+ complexes are about 8 to 10 times less than that of 3–Sn2+ complex. By contrast, Cl− is located above the molecular plane with an adsorption energy of less than 1 kcal mol−1, which is in the order of weak der Waals interactions. Based on the obtained results, it seems that the difference in the adsorption configuration and the binding strength might be responsible for the difference between the sensing behaviors of compound 3 toward various cations and anions.
O group resulting in weaker interaction. The adsorption energies for 3–Li+ and 3–Na+ complexes are about 8 to 10 times less than that of 3–Sn2+ complex. By contrast, Cl− is located above the molecular plane with an adsorption energy of less than 1 kcal mol−1, which is in the order of weak der Waals interactions. Based on the obtained results, it seems that the difference in the adsorption configuration and the binding strength might be responsible for the difference between the sensing behaviors of compound 3 toward various cations and anions.
Fig. 9 presents the fluorescence emission spectra of isolated compound 3 and its complexes with four examined ions recorded in EtOH–H2O (2/3) media. As evident, after the adsorption of ions, the intensity of the fluorescence peak of the resultant complex depends on the interaction strength between 3 and ions. The strong binding between 3 and Sn2+ leads to complete quenching of the fluorescence signal, while complexes having weak interactions (3–Li+, 3–Na+, and 3–Cl−) still show fluorescence signals in the visible region.
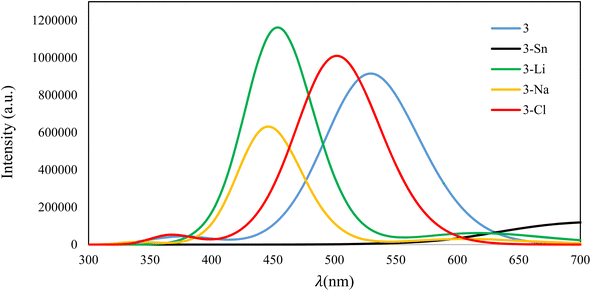 | ||
| Fig. 9 Fluorescence emission of 3 and its complexes with Sn2+, Li+, Na+, and Cl− ions in EtOH–H2O (2/3) solvent. | ||
To provide more insight into the origin of the fluorescence peak, we performed hole–electron analysis which gives a definitive picture of the hole and electron distribution for any emission peak, by describing where the excited electron leaves (hole) and arrives (electron). The cube grid information on the hole–electron distribution was generated using the Multiwfn package,70 followed by their visualization using the VMD software.71 The hole and electron distributions associated with the fluorescence peak of the isolated compound 3 and its complexes with Sn2+, Li+, Na+, and Cl− ions are presented in Fig. 10. The fluorescence emission of compound 3 exhibits one main typical fluorescence band centered at 534 nm which is associated with the π → π* transition within the pyranone moiety and the π conjugation extension between two coumarins. Fig. 10 shows that in 3–Li+, 3–Na+, and 3–Cl− complexes, the hole–electron distribution resembles compound 3 indicating that the adsorption of Li+, Na+, and Cl− does not change the electronic properties of free-standing compound 3. It means no significant charge transfer occurs during the complex formation. By contrast, for the 3–Sn2+ complex, the hole and electron pattern is completely different from those of isolated 3 with the higher contribution of σ → σ* transition. It seems that the bond formation between Sn and oxygen leads to electron transfer from the π orbitals and redistributes the electronic density within the dicoumarol. As the σ → σ* transition requires higher energy thus does not fall in the visible range and just quenching of π → π* transition is observable.
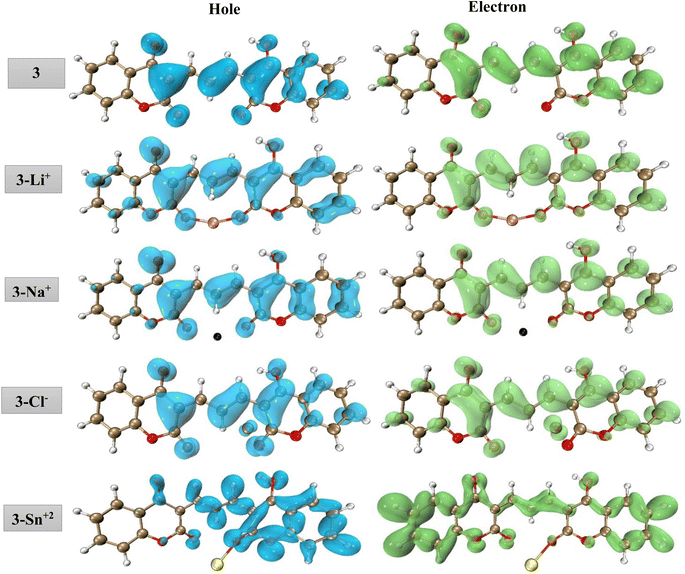 | ||
| Fig. 10 Real-space representation of hole (blue) and electron (green) distributions for the main transitions of 3 and its complexes with Sn2+, Li+, Na+, and Cl− (isovalue = 0.001). | ||
4 Conclusion
In summary, biocompatible coumarin-based fluorophores were synthesized, and their photophysical properties were investigated. Among 18 different cations (including Sn2+) and 6 anions, compound 3 exhibited an immediate and selective fluorescence quenching behavior toward Sn2+. The binding stoichiometry of 3 to Sn2+ was 2![[thin space (1/6-em)]](https://www.rsc.org/images/entities/char_2009.gif) :
:![[thin space (1/6-em)]](https://www.rsc.org/images/entities/char_2009.gif) 1, according to the Job's plot. FTIR study revealed that the complexation proceeds through binding the ligand's esteric carbonyl to Sn2+ ions. Based on the value of KSV and UV-Vis absorption studies, a static quenching was verified. According to the MTT results, the IC50 value of 3 was calculated as 711 μM, which made it suitable for cellular imaging. Due to the widespread use of tin(II) chloride in industry, and its importance in DNA damage studies, we propose that 3 is an appropriate fluorescent probe for the colorimetric and fluorimetric detection of tin ions in the environment and in cellular media.
1, according to the Job's plot. FTIR study revealed that the complexation proceeds through binding the ligand's esteric carbonyl to Sn2+ ions. Based on the value of KSV and UV-Vis absorption studies, a static quenching was verified. According to the MTT results, the IC50 value of 3 was calculated as 711 μM, which made it suitable for cellular imaging. Due to the widespread use of tin(II) chloride in industry, and its importance in DNA damage studies, we propose that 3 is an appropriate fluorescent probe for the colorimetric and fluorimetric detection of tin ions in the environment and in cellular media.
Author contributions
Hamide Hosseinjani-Pirdehi: chemistry experiment, writing – original draft. Soode Amigh: theoretical calculation. Afshan Mohajeri: theoretical calculation. Elahe Nazeri: biological experiment. Amir Taheri: chemistry experiment, conceptualization. Keivan Majidzadeh-A: conceptualization. Zahra Mohammadpour: methodology, data curation, reviewing and editing. Rezvan Esmaeili: biological conceptualization, grant receiving and biological editing.Conflicts of interest
All authors declare no conflict of interest.Acknowledgements
This work was supported by the National Institute for Medical Research Development, NIMAD, with the foundation number 957590 and Motamed Cancer Institute (MCI).References
- M. E. Conti, in Mineral Components in Foods, CRC press, 2006, pp. 339–362 Search PubMed.
- M. Hoch, Appl. Geochem., 2001, 16, 719–743 CrossRef CAS.
- I. Rajan, N. Narayanan, R. Rabindran, P. R. Jayasree and P. R. Manish Kumar, Biol. Trace Elem. Res., 2013, 155, 455–459 CrossRef CAS PubMed.
- J. C. P. De Mattos, V. C. d. Matos, M. P. Rodrigues, M. B. N. d. Oliveira, F. J. S. Dantas, S. D. Santos-Filho, M. Bernardo-Filho and A. Caldeira-de-Araujo, Molecules, 2012, 17, 12974–12983 CrossRef PubMed.
- E. S. Motta, P. T. Souza-Santos, T. R. Cassiano, F. J. S. Dantas, A. Caldeira-de-Araujo and J. C. P. De Mattos, J. Biomed. Biotechnol., 2010, 2010, 376218 Search PubMed.
- J. R. N. McLean, H. C. Birnboim, R. Pontefact and J. G. Kaplan, Chem.-Biol. Interact., 1983, 46, 189–200 CrossRef CAS PubMed.
- T. Şişman, Environ. Toxicol., 2011, 26, 240–249 CrossRef PubMed.
- A. Niknezhadi and A. Nezamzadeh-Ejhieh, J. Colloid Interface Sci., 2017, 501, 321–329 CrossRef CAS PubMed.
- C. H. Lien, C. C. Hu, Y. D. Tsai and D. S. H. Wang, ECS Trans., 2013, 50, 147–163 CrossRef.
- Y.-D. Tsai, C.-H. Lien and C.-C. Hu, Electrochim. Acta, 2011, 56, 7615–7621 CrossRef CAS.
- P. Ravichandiran, D. S. Prabakaran, N. Maroli, A. R. Kim, B. H. Park, M. K. Han, T. Ramesh, S. Ponpandian and D. J. Yoo, J. Hazard. Mater., 2021, 419, 126409 CrossRef CAS PubMed.
- P. Ravichandiran, D. S. Prabakaran, A. P. Bella, A. Boguszewska-Czubara, M. Masłyk, K. Dineshkumar, P. M. Johnson, B.-H. Park, M.-K. Han, H. G. Kim and D. J. Yoo, ACS Sustainable Chem. Eng., 2020, 8(29), 10947–10958 CAS.
- J. Cheng, E. Yang, P. Ding, J. Tang, D. Zhang, Y. Zhao and Y. Ye, Sens. Actuators, B, 2015, 221, 688–693 CrossRef CAS.
- Q. Wang, C. Li, Y. Zou, H. Wang, T. Yi and C. Huang, Org. Biomol. Chem., 2012, 10, 6740–6746 RSC.
- H. Lan, Y. Wen, Y. Shi, K. Liu, Y. Mao and T. Yi, Analyst, 2014, 139, 5223–5229 RSC.
- S. Pu, Y. Xue, C. Zheng, W. Geng, S. Cui and G. Liu, Tetrahedron, 2014, 70, 9070–9076 CrossRef CAS.
- S. Adhikari, S. Mandal, A. Ghosh, S. Guria and D. Das, Dalton Trans., 2015, 44, 14388–14393 RSC.
- P. Ravichandiran, D. S. Prabakaran, N. Maroli, A. Boguszewska-Czubara, M. Maslyk, A. R. Kim, P. Kolandaivel, P. Ramalingam, B. H. Park, M. K. Han, T. Ramesh and D. J. Yoo, J. Hazard. Mater., 2021, 415, 125593 CrossRef CAS PubMed.
- L. Brulikova, T. Volna and J. Hlavac, ACS Omega, 2020, 5, 9324–9333 CrossRef CAS PubMed.
- X. Meng, L. You, S. Li, Q. Sun, X. Luo, H. He, J. Wang and F. Zhao, RSC Adv., 2020, 10, 37735–37742 RSC.
- X. Meng, D. Cao, Z. Hu, X. Han, Z. Li and W. Ma, RSC Adv., 2018, 8, 33947–33951 RSC.
- X. Cheng, S. Qu, L. Xiao, W. Li and P. He, J. Photochem. Photobiol., A, 2018, 364, 503–509 CrossRef CAS.
- C. G. Chen, N. Vijay, N. Thirumalaivasan, S. Velmathi and S. P. Wu, Spectrochim. Acta, Part A, 2019, 219, 135–140 CrossRef CAS PubMed.
- S. Mukherjee, S. Hazra, S. Chowdhury, S. Sarkar, K. Chattopadhyay and A. Pramanik, J. Photochem. Photobiol., A, 2018, 364, 635–644 CrossRef CAS.
- K. S. Mani, R. Rajamanikandan, B. Murugesapandian, R. Shankar, G. Sivaraman, M. Ilanchelian and S. P. Rajendran, Spectrochim. Acta, Part A, 2019, 214, 170–176 CrossRef CAS PubMed.
- W. Wang, J. Wu, Q. Liu, Y. Gao, H. Liu and B. Zhao, Tetrahedron Lett., 2018, 59, 1860–1865 CrossRef CAS.
- G. Zhu, Y. Huang, C. Wang, L. Lu, T. Sun, M. Wang, Y. Tang, D. Shan, S. Wen and J. Zhu, Spectrochim. Acta, Part A, 2019, 210, 105–110 CrossRef CAS PubMed.
- H. Li, X. Sun, T. Zheng, Z. Xu, Y. Song and X. Gu, Sens. Actuators, B, 2019, 279, 400–409 CrossRef CAS.
- F. Borges, F. Roleira, N. Milhazes, L. Santana and E. Uriarte, Curr. Med. Chem., 2005, 12, 887–916 CrossRef CAS PubMed.
- N. Mergu, M. Kim and Y.-A. Son, Spectrochim. Acta, Part A, 2018, 188, 571–580 CrossRef CAS PubMed.
- C. Zhao, J. Chen, D. Cao, J. Wang and W. Ma, Tetrahedron, 2019, 75, 1997–2003 CrossRef CAS.
- L. I. Li, S. Yun, Z. Yuan-Hui, M. U. Lan, Z. Xi, C. Redshaw and W. E. I. Gang, Sens. Actuators, B, 2016, 226, 279–288 CrossRef CAS.
- X. Meng, S. Li, W. Ma, J. Wang, Z. Hu and D. Cao, Dyes Pigm., 2018, 154, 194–198 CrossRef CAS.
- G. Ambrosi, M. Formica, V. Fusi, L. Giorgi, E. Macedi, G. Piersanti, M. Retini, M. A. Varrese and G. Zappia, Tetrahedron, 2012, 68, 3768–3775 CrossRef CAS.
- H. Hosseinjani-Pirdehi, N. O. Allah Mahmoodi, A. Taheri, K. A. A. Asalemi and R. Esmaeili, Spectrochim. Acta, Part A, 2020, 229, 117989 CrossRef CAS PubMed.
- X. Liu, J. M. Cole and K. S. Low, J. Phys. Chem. C, 2013, 117, 14731–14741 CrossRef CAS.
- I. H. Hwang, Y. W. Choi, K. B. Kim, G. J. Park, J. J. Lee, L. Nguyen, I. Noh and C. Kim, New J. Chem., 2016, 40, 171–178 RSC.
- B. Bodenant, F. Fages and M.-H. Delville, J. Am. Chem. Soc., 1998, 120, 7511–7519 CrossRef CAS.
- M. A. Lichtman and R. I. Weed, Blood, 1969, 34, 645–660 CrossRef CAS PubMed.
- T. Jiang, L.-C. Tian, C. Huang, B.-X. Zhu, D.-M. Chen and C. Zhu, Inorg. Chim. Acta, 2023, 547, 121367 CrossRef CAS.
- S. Sharifi, A. Wahid Mesbah and E. Iravani, Results Chem., 2023, 5, 100747 CrossRef CAS.
- P. Patil, S. Shinde and S. Sahoo, Trends Sci., 2022, 19, 4487 CrossRef.
- J. Li, Y. Chen, T. Chen, J. Qiang, Z. Zhang, T. Wei, W. Zhang, F. Wang and X. Chen, Sens. Actuators, B, 2018, 268, 446–455 CrossRef CAS.
- L. Guo, X. Chen, R. Xie, L. Han and N. Zhu, J. Mol. Struct., 2023, 1275, 134615 CrossRef CAS.
- B. Musikavanhu, D. Zhu, M. Tang, Z. Xue, S. Wang and L. Zhao, Spectrochim. Acta, Part A, 2023, 289, 122242 CrossRef CAS PubMed.
- F. T. Souto and V. G. Machado, Carbohydr. Polym., 2023, 304, 120480 CrossRef CAS PubMed.
- S. Suguna, R. Nandhakumar and J. Prabhu, Spectrochim. Acta, Part A, 2023, 288, 122196 CrossRef CAS PubMed.
- P. Rasin, J. Haribabu, K. M. Malappuram, V. Manakkadan, V. N. V. Palakkeezhillam, C. Echeverria and A. Sreekanth, J. Photochem. Photobiol., A, 2023, 437, 114493 CrossRef CAS.
- P. Mohanty, P. P. Dash, S. Naik, R. Behura, M. Mishra, H. Sahoo, S. K. Sahoo, A. K. Barick and B. R. Jali, J. Photochem. Photobiol., A, 2023, 437, 114491 CrossRef CAS.
- S. Sharma, Chayawan, A. Jayaraman, J. Debnath and K. S. Ghosh, J. Photochem. Photobiol., A, 2023, 437, 114408 CrossRef CAS.
- M. Abdollahi-Moghadam, H. Keypour, R. Azadbakht and M. Koolivand, J. Mol. Struct., 2023, 1273, 134289 CrossRef CAS.
- M. Yu, B. Liu, J. Guo and F. Wu, Dyes Pigm., 2023, 210, 110983 CrossRef CAS.
- A. Kumar, B. M. Virender, J. Parikh and K. Modi, Spectrochim. Acta, Part A, 2023, 285, 121889 CrossRef CAS PubMed.
- S. Suguna, A. Puthoor, D. Parimala devi, A. Abiram, R. Nandhakumar and J. Prabhu, J. Photochem. Photobiol., A, 2023, 435, 114268 CrossRef CAS.
- N. K. Choudhary, L. L. Mittapelli, P. Kumar Roy, G. Das, M. Mandal and K. R. Gore, Spectrochim. Acta, Part A, 2023, 285, 121887 CrossRef CAS PubMed.
- L. J. Gomes, J. P. Carrilho, P. M. Pereira and A. J. Moro, Sensors, 2023, 23, 471 CrossRef CAS PubMed.
- L. K. Shaji, J. Jose, R. Bhaskar, R. Selva Kumar, V. Vetriarasu, S. G. Bhat and S. K. Ashok Kumar, Inorg. Chem. Commun., 2023, 147, 110252 CrossRef CAS.
- T. Nantapon, P. Naweephattana, P. Surawatanawong, P. Saetear, T. Chantarojsiri and N. Ruangsupapichat, Spectrochim. Acta, Part A, 2022, 282, 121662 CrossRef CAS PubMed.
- D. Ravichandran, M. Ranjani, G. Prabu Sankar, R. Shankar, M. Karthi, S. Selvakumar and R. Prabhakaran, J. Mol. Struct., 2023, 1273, 134329 CrossRef CAS.
- J. M. V. Ngororabanga, T. O. Dembaremba, N. Mama and Z. R. Tshentu, Spectrochim. Acta, Part A, 2023, 289, 122202 CrossRef CAS PubMed.
- R. Gao, X. Liu, J. Feng, L. Han, J. Xu and C. Kan, Spectrochim. Acta, Part A, 2022, 281, 121612 CrossRef CAS PubMed.
- P. Ravichandiran, D. S. Prabakaran, N. Maroli, A. Boguszewska-Czubara, M. Masłyk, A. R. Kim, P. Kolandaivel, P. Ramalingam, B.-H. Park, M.-K. Han, T. Ramesh and D. J. Yoo, J. Hazard. Mater., 2021, 415, 125593 CrossRef CAS PubMed.
- P. Ravichandiran, V. K. Kaliannagounder, A. P. Bella, A. Boguszewska-Czubara, M. Masłyk, C. S. Kim, C. H. Park, P. M. Johnson, B.-H. Park, M.-K. Han, A. R. Kim and D. J. Yoo, Anal. Chem., 2021, 93, 801–811 CrossRef CAS PubMed.
- Z. Yan, G. Wei, S. Guang, M. Xu, X. Ren, R. Wu, G. Zhao, F. Ke and H. Xu, Dyes Pigm., 2018, 159, 542–550 CrossRef CAS.
- V. Singh Rana, V. Anand, S. Shekhar Sarkar, N. Sandhu, M. Verma, S. Naidu, K. Kumar, R. K. Yadav, R. Shrivastava and A. P. Singh, J. Photochem. Photobiol., A, 2023, 436, 114409 CrossRef CAS.
- M. Rahman and H. J. Harmon, Spectrochim. Acta, Part A, 2006, 65, 901–906 CrossRef PubMed.
- M. Pannipara, A. G. Al-Sehemi, A. Kalam, A. M. Asiri and M. N. Arshad, Spectrochim. Acta, Part A, 2017, 183, 84–89 CrossRef CAS PubMed.
- M. J. Frisch, G. W. Trucks, H. B. Schlegel, G. E. Scuseria, M. A. Robb, J. R. Cheeseman, G. Scalmani, V. Barone, G. A. Petersson, H. Nakatsuji, X. Li, M. Caricato, A. V. Marenich, J. Bloino, B. G. Janesko, R. Gomperts, B. Mennucci, H. P. Hratchian, J. V. Ortiz, A. F. Izmaylov, J. L. Sonnenberg, D. Williams-Young, F. Ding, F. Lipparini, F. Egidi, J. Goings, B. Peng, A. Petrone, T. Henderson, D. Ranasinghe, V. G. Zakrzewski, J. Gao, N. Rega, G. Zheng, W. Liang, M. Hada, M. Ehara, K. Toyota, R. Fukuda, J. Hasegawa, M. Ishida, T. Nakajima, Y. Honda, O. Kitao, H. Nakai, T. Vreven, K. Throssell, J. A. Montgomery Jr, J. E. Peralta, F. Ogliaro, M. J. Bearpark, J. J. Heyd, E. N. Brothers, K. N. Kudin, V. N. Staroverov, T. A. Keith, R. Kobayashi, J. Normand, K. Raghavachari, A. P. Rendell, J. C. Burant, S. S. Iyengar, J. Tomasi, M. Cossi, J. M. Millam, M. Klene, C. Adamo, R. Cammi, J. W. Ochterski, R. L. Martin, K. Morokuma, O. Farkas, J. B. Foresman and D. J. Fox, Gaussian 09, Revision D.01, Gaussian, Inc., Wallingford, CT, 2009 Search PubMed.
- J. Tomasi, B. Mennucci and R. Cammi, Chem. Rev., 2005, 105, 2999–3094 CrossRef CAS PubMed.
- T. Lu and F. Chen, J. Comput. Chem., 2012, 33, 580–592 CrossRef CAS PubMed.
- W. Humphrey, A. Dalke and K. Schulten, J. Mol. Graphics, 1996, 14(33–38), 27–38 Search PubMed.
Footnote |
| † Electronic supplementary information (ESI) available. See DOI: https://doi.org/10.1039/d2ra07884h |
| This journal is © The Royal Society of Chemistry 2023 |

