 Open Access Article
The electrosorption behavior of shuttle-like FeP: performance and mechanism
Gengen Peng and
Haibo Li *
*
Ningxia Key Laboratory of Photovoltaic Materials, School of Materials and New Energy, Ningxia University, Yinchuan 750021, China. E-mail: lihaibo@nxu.edu.cn
First published on 29th March 2023
Abstract
Owing to its high electrochemical ability, the FeP is envisioned to be the potential electrode for capacitive deionization (CDI) with enhanced performance. However, it suffers from poor cycling stability due to the active redox reaction. In this work, a facile approach has been designed to prepare the mesoporous shuttle-like FeP using MIL-88 as the template. The porous shuttle-like structure not only alleviates the volume expansion of FeP during the desalination/salination process but also promotes ion diffusion dynamics by providing convenient ion diffusion channels. As a result, the FeP electrode has demonstrated a high desalting capacity of 79.09 mg g−1 at 1.2 V. Further, it proves the superior capacitance retention, which maintained 84% of the initial capacity after the cycling. Based on post-characterization, a possible electrosorption mechanism of FeP has been proposed.
Introduction
The shortage of fresh water is one of the global challenges worldwide.1–3 Since the majority of the planet is covered by seawater, desalination is deemed as the solution to overcome this issue. Despite the typical desalination technologies based on thermal separation and membrane separation that already have been developed for the past few decades, the high capital cost, great energy consumption, and secondary pollution are associated with these desalination technologies.4 Alternatively, capacitive deionization (CDI) emerged as a new desalination technique and has attracted a lot of attention due to its high desalination efficiency, cost-effectiveness, and is environmentally benign.5,6 In previous studies, the CDI electrodes were often composed of carbon materials that aimed to remove salty ions by establishing an electric double layer (EDL).7,8 In this case, the desalting capacity of carbon electrodes9 was dominantly determined and limited by the specific surface area. Moreover, the carbon-based CDI actually suffers from low current efficiency due to the presence of strong co-ion impaction in relation to carbon electrodes.10 Differing from the carbon electrodes, the faradaic electrode stores salty ions through redox reactions rather than the EDL manner. As a result, the faradaic CDI realizes high desalting capacity and current efficiency.11,12Transition metal phosphide (TMP) has quasi-metallic characteristics and high electrical conductivity features,13,14 which is a typical representative of faradaic material. Compared with transition metal oxides/sulfides and conducting polymers, TMP realized lower polarization and a more favorable potential for salty ion removal, which makes them suitable anodes for CDI.15–18 For example, Jin19 tested the desalting ability of composite electrodes by separately coupling CoP, CoS, and Co3O4 with activated carbon felt (ACF). The results showed that the removal of Pb2+ by ACF-CoP electrode reached 90 mg g−1, which was much higher than that of ACF-CoS (67 mg g−1) and ACF-Co3O4 (35 mg g−1). Remarkably, the TMP electrode has shown exceptional desalting performance at ultra-low voltage.20 The study also explored that the carbon aerogel (CA)/CoP/Co3O4 composite electrode achieved high Li+ and B(OH)4− removal capacities of 37 and 70 mg g−1 at 0.6 V, respectively.21 Iron is one of the richest elements in nature and the phosphide (FeP) has the merits of low cost, environmental-friendliness, and high electrosorption capacity.20–22 Unfortunately, they encountered poor cycling performance16,23 and electrochemical stability due to the serious volume expansion and the phase decomposition upon cycling. Essentially, constructing porous structures or nano-sizing FeP can effectively suppress the collapse of structures caused by volume expansion.24
In this work, we propose a template method to prepare the shuttle-like FeP for CDI with enhanced capacity and long cycling stability. FeP nanoparticles confined within the shuttle-like framework benefit from the relief of the volume change during the desalination/salination. Meanwhile, the porous structure of shuttle-like FeP favors promoting the ion diffusion kinetics by providing muti-channels for salty ion diffusion. Hence, the morphology, structure, electrochemical behavior, and CDI performance of shuttle-like FeP have been explored, as well as the desalination mechanism.
Experimental
Materials
Ferric nitrate nine hydrate (Fe(NO3)3·9H2O, Macklin), fumaric acid (C4H4O4, Aladdin), sodium hypophosphate (NaH2PO2·H2O, Aladdin) and absolute ethanol (C2H5OH, Sinopharm Chemical Reagent) are analytical grade reagents and have not undergone any purification treatment.Preparation of the MIL-88A precursor
Firstly, 280 mg C4H4O4 was added to 40 mL deionized water (DI) and stirred in an oil bath at 70 °C for 10 min until the solution became clear and transparent. It was denoted as solution A. At the same time, 1060 mg of Fe(NO3)3·9H2O was completely dissolved in 10 mL DI and denoted as solution B. After that, solution B was slowly dropped into solution A, accompanied by stirring for 10 min. Subsequently, the mixed solution was transferred to a 100 mL Teflon reaction liner and kept at 110 °C for 6 h. After cooling naturally to room temperature, the precipitate was washed with ethanol using centrifugation several times and dried at 70 °C. Finally, the yellow MIL-88A precipitate was collected.The preparation of FeP
The Mil-88A was transferred to the Muffle furnace heating to 400 °C at 2 °C min−1 and kept for 2 h, leading to the synthesis of Fe2O3 powder. Then, the Fe2O3 powder and NaH2PO2·H2O were placed on the porcelain boat at a mass ratio of 1 to 20 and kept in a tubular furnace. The sample was heated to 400 °C at 2 °C min−1 under a nitrogen atmosphere, and held for 2 h to obtain FeP.Electrochemical test
The cyclic voltammetry (CV), electrochemical impedance spectra (EIS), and galvanostatic charge/discharge (GCD) test were performed in 1 M NaCl solution on a CHI 660D electrochemical workstation employing a three-electrode system. According to the CV curve, the specific capacitance of the working electrode is calculated using eqn (1):
 | (1) |
Basically, the three-electrode system is configured by a working electrode, a platinum counter electrode, and an Ag/AgCl reference electrode. The working electrode is made as described below. The FeP was mixed with superconducting carbon black and vinylidene fluoride (PVDF) at a mass ratio of 8![[thin space (1/6-em)]](https://www.rsc.org/images/entities/char_2009.gif) :
:![[thin space (1/6-em)]](https://www.rsc.org/images/entities/char_2009.gif) 1
1![[thin space (1/6-em)]](https://www.rsc.org/images/entities/char_2009.gif) :
:![[thin space (1/6-em)]](https://www.rsc.org/images/entities/char_2009.gif) 1 upon adding the appropriate amount of N,N-dimethyl pyrrolidone (NMP). Then, the mixture was coated on graphite paper with a doctor's blade with an area of 1 cm × 2 cm.
1 upon adding the appropriate amount of N,N-dimethyl pyrrolidone (NMP). Then, the mixture was coated on graphite paper with a doctor's blade with an area of 1 cm × 2 cm.
Desalination test
The homemade CDI system was employed to conduct the seawater desalination experiment. The core of the CDI system is the CDI unit which was composed of a FeP-positive electrode, the anion exchange membrane, sealing ring, separator, sealing ring, cation exchange membrane, and activated carbon (AC) negative electrode. The graphite paper with the dimension of 7 cm × 7 cm was used as the substrate and current collector for both electrodes. The preparation of FeP and AC electrodes involved following the same depicted process for preparing the working electrode in the electrochemical test and the mass of the active substance was maintained at about 20 mg.Desalination experiments were conducted using a batch-mode circulation system, where 40 mL 1000 μS cm−1 NaCl solutions (C0 = 529 mg L−1) were circulated in a constant-current pump and CDI module at 20 mL min−1. 0.8, 1.0, and 1.2 V were applied on the CDI unit to achieve the desalination, respectively. The external conductivity meter and ammeter monitor the NaCl solution conductivity and desalting current in real-time. The desalting capacity (Γ, mg g−1) and charge efficiency (Λ, %) were calculated by the following equations:
 | (2) |
 | (3) |
![[thin space (1/6-em)]](https://www.rsc.org/images/entities/char_2009.gif) 485C g−1), M is the molar mass of NaCl, and i is the desalination current.
485C g−1), M is the molar mass of NaCl, and i is the desalination current.
Results and discussion
X-ray diffraction (XRD, SmartLab, Japan) was employed to analyze the crystal structure of the shuttle-like FeP. The X-ray source was a K alpha 1 ray using Cu as the target, where the power of K alpha 1 was 2 kW. Fig. 1a shows the XRD pattern of FeP, which showed strong characteristic signals at 2θ of 32.78°, 37.19°, 46.99°, and 48.37°, corresponding to the (0 1 1) (1 1 1), (2 0 2), and (2 1 1) crystal planes of FeP, respectively, which are identical to those from the standard XRD card (PDF#65-2595). The simultaneous thermal analyzer (STA S16, France) was used to analyze the composition of shuttle-like FeP qualitatively by increasing temperature from 25 to 800 °C at 5°C min−1 under air conditions, and the corresponding curve is shown in Fig. 1b. The small mass loss below 200 °C is attributed to the removal of the adsorbed water from the surface of FeP. Thereafter, the oxidation of FeP and the combustion of a small amount of residual carbon occurred simultaneously between 200 °C and 700 °C.25 It can be seen that the oxidation of FeP results in a sharp increase in the mass, which reaches 38% of the total mass. By calculation, the theoretical mass increase of the pure FeP should be 74% after withstanding the complete oxidation. Thus, the actual mass increase is 36%, which is much less than 74%, indicating that partial FeP has been oxidized in the air in advance in addition to the mass loss caused by adsorbed water and carbon combustion. The oxidation reaction of FeP is as below:| FeP + 2O2 → FePO4 | (4) |
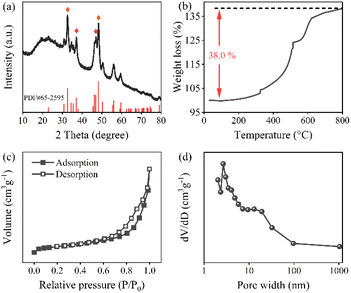 | ||
| Fig. 1 (a) XRD pattern, (b) TG curves, (c) N2 adsorption–desorption isotherms, and (d) pore size distribution curves of FeP. | ||
The specific surface area (SSA) and pore texture of FeP were examined by a BET analyzer (JW-BK200C, China). Fig. 1c shows the nitrogen adsorption–desorption isothermal curves, which belong to the typical IV curve. Moreover, it has hysteresis loops in the medium pressure range, suggesting the presence of a large number of mesopores.26 Besides, the SSA of FeP was 22.45 m2 g−1 according to the multi-point BET method. Fig. 1d displays the pore size distribution curves of FeP. A strong peak concentrated at ∼3 nm, accompanied by a shoulder peak at ∼12 nm, highlights the existence of abundant mesopores that formed by the confinement of FeP within the shuttle-like framework.
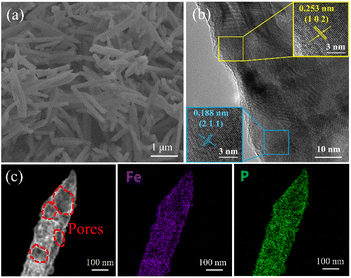
The scanning electron microscopy (SEM, Hitachi SU5000, Japan) image of FeP is exhibited in Fig. 2a. It clearly shows the shuttle-like structure and the diameter is ∼200 nm. Fig. 2b shows the high-resolution transmission electron microscopy (HRTEM, Talos F200S) image of shuttle-like FeP. The lattice spacing of 0.253 nm and 0.188 nm can be captured, which correspond to the (1 0 2) and (2 1 1) crystal planes of FeP. Fig. 2c shows the high-angle annular dark field (HAADF) image of FeP, together with the mapping image of Fe and P. Basically, many voids are observed from the HAADF image, which is consistent with the pore texture analysis. This is very beneficial to promote the diffusion of the ions and suppress the volume change of FeP during the desalination/salination process. Further, the P and Fe are evenly distributed in FeP.
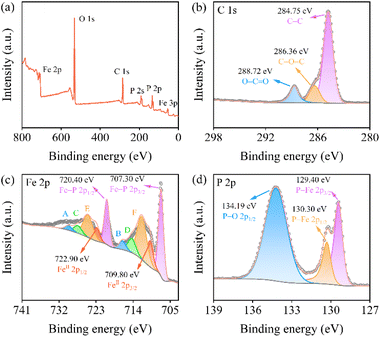
Fig. 3a shows the X-ray photoelectron spectra (XPS, Thermo ESCALAB 250Xi) of FeP. It mainly involves the Fe 2p, O 1s, C 1s, and P 2P signals. In Fig. 3b, relating to C 1s spectra, the peak presented at 284.75 eV, 286.36 eV, and 288.72 eV are attributed to the C–C bond, C–O–C bond, and O–C![[double bond, length as m-dash]](https://www.rsc.org/images/entities/char_e001.gif) O bond.27 Among the characteristic peaks of the Fe 2p orbital in Fig. 3c, two peaks at 707.3 eV and 720.4 eV correspond to Fe–P bonds.25 Owing to the strong activity of TMP, an oxide layer was easily formed on the surface of FeP,28 thus the remaining peaks can be ascribed to the oxidation state of iron (FeOx). Significantly, the peaks at 709.80 eV and 722.90 eV, corresponding to FeII in Fe3O4 or FeO, and the A/B, C/D, and E/F peaks on the left side can be assigned to satellite peaks, surface peaks, and FeIII, respectively.29–33 In Fig. 3d, associated with P 2p spectra, it has three typical peaks at 129.40 eV, 130.30 eV, and 134.19 eV, which correspond to P 2p3/2 and P 2P1/2 in P–Fe bond and P–O bonds,34 respectively. The formation of the P–O bond may be ascribed to oxidation when exposed to air.35 On the other hand, the incomplete decomposition of the organic ligand of the precursor may also provide residual oxygen.
O bond.27 Among the characteristic peaks of the Fe 2p orbital in Fig. 3c, two peaks at 707.3 eV and 720.4 eV correspond to Fe–P bonds.25 Owing to the strong activity of TMP, an oxide layer was easily formed on the surface of FeP,28 thus the remaining peaks can be ascribed to the oxidation state of iron (FeOx). Significantly, the peaks at 709.80 eV and 722.90 eV, corresponding to FeII in Fe3O4 or FeO, and the A/B, C/D, and E/F peaks on the left side can be assigned to satellite peaks, surface peaks, and FeIII, respectively.29–33 In Fig. 3d, associated with P 2p spectra, it has three typical peaks at 129.40 eV, 130.30 eV, and 134.19 eV, which correspond to P 2p3/2 and P 2P1/2 in P–Fe bond and P–O bonds,34 respectively. The formation of the P–O bond may be ascribed to oxidation when exposed to air.35 On the other hand, the incomplete decomposition of the organic ligand of the precursor may also provide residual oxygen.
Fig. 4a shows the CV curve of the FeP electrode at 1 mV s−1. A pair of redox peaks appear at 0.4 and 0.5 V, which are related to the activation of the FeP active site at low potential. Obviously, when the voltage rises to 0.5 V, an oxidation peak appears, which is represented by the conversion of FeII to FeIII. On the contrary, when the voltage decreases from 1.0 to 0.4 V, a weak reduction peak emerges. Based on the CV curves, the specific capacitance with respect to scan rate is given in Fig. 4b. At a lower scan rate, electrolytes have more chance to participate in the reaction. Therefore, the specific capacitance decreases from 311.1 to 81.4 F g−1 when the scan rate increases from 1.0 to 100 mV s−1. To analyze the resistivity of the electrode, EIS curves after different CV cycling were plotted and are shown in Fig. 4c. Essentially, the point of intersection with the real axis indicates the bulk solution resistance (RΩ), and the diameter of the semicircle in the high-frequency region represents charge transfer resistance (Rct).6,36 Besides, the slope of the low-frequency region reflects the mass transfer. The higher the slope, the easier the diffusion. When the cycle ranges from 1 to 10, the RΩ decreases from 9.79 to 6.29 Ω. As the CV cycles continue to increase to 100, the RΩ almost keeps the same value. This may be ascribed to the formation of a passivation layer in the early stage. Fig. 4d shows the GCD curve of the FeP electrode. When the current density decreased from 3 to 0.5 A g−1, the charging capacity increased from 47.25 to 75.88 mA h g−1.
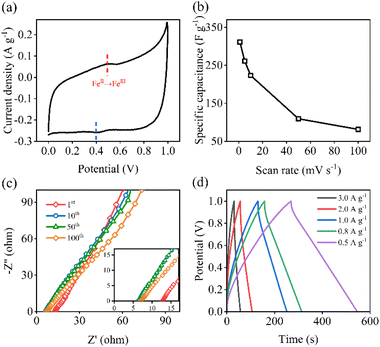 | ||
| Fig. 4 (a) CV curve of FeP, (b) specific capacitance (F g−1) with respect to scan rate (mV s−1), (c) EIS spectra upon the CV cycling, (d) GCD plots at different current densities. | ||
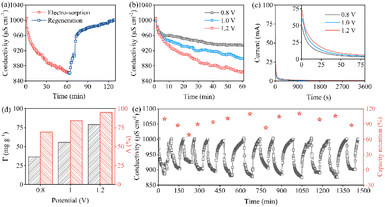
Fig. 5a exhibits the conductivity transient of the FeP//AC CDI system during Electro-sorption and regeneration in 1000 μS cm−1 NaCl solution at 1.2 V. The solution conductivity dramatically decreases once the voltage is applied. After 60 minutes, it does not change anymore, suggesting saturation. Specifically, the conductivity decreases from 1000 μS cm−1 to 862 μS cm−1 within 60 min at 1.2 V and then recovers to the initial state at −0.8 V. Fig. 5b and c show the simultaneous variation of the solution conductivity and current of FeP//AC CDI under working voltage ranging from 0.8 to 1.2 V, respectively. Before 10 minutes, the conductivity and current drop sharply due to the rapid capture of salty ions. As time goes by, the ion capture slows down and gradually reaches saturation, which causes the fact that conductivity and current are becoming stable. Fig. 5d illustrates the Γ (mg g−1) and Λ (%) at different voltages. It can be seen that the Γ increases from 35.45 to 79.09 mg g−1 as the voltage increases from 0.8 to 1.2 V. Significantly, Λ increases from 70% to 95%, accordingly. Fig. 5e represents the regeneration of FeP//AC CDI and capacitance retention upon cycling. It can be seen that 84% of the initial capacity of the FeP electrode is maintained after 13 cycles. The high desalination capacity and capacitance retention are accounted for by the porous shuttle-like structure, which can alleviate the volume expansion of FeP and thus effectively reinforce the cycle stability. It should be mentioned that the desalting capacity decreases in the first three cycles and then increases in the subsequent cycles. This is presumably attributed to the gradual depletion of iron oxide on the surface. Table 1 summarizes the desalination capacity of various CDI electrodes, which highlights that the shuttle-like FeP possesses the highest value.
| Electrodes | Voltage (V) | Con. (mg L−1) | Capacity (mg g−1) | Ref. |
|---|---|---|---|---|
| VS2 | 1.6 | 500 | 72 | 37 |
| MoS2@NCS-800 | 1.4 | 1060 | 59.9 | 38 |
| Co@CP | 1.2 | 530 | 47.8 | 39 |
| O-FePO4@C | 1.2 | 500 | 61.3 | 40 |
| CFP/3DG/NiO‖CFP/3DG/MnO2 | 1.2 | 530 | 21.01 | 41 |
| PANI/Mn2O3 | 1.2 | 500 | 21.6 | 42 |
| NiCo2O4 | 1.2 | 530 | 44.3 | 43 |
| Cu/Cu2O/C-700 | 1.2 | 500 | 16.4 | 44 |
| Co-Co3O4/N-CNTs | 1.4 | 824 | 66.91 | 45 |
| FeP | 1.2 | 530 | 79.09 | This work |
The post-XPS characterization was carried out to explore the desalination mechanism of the FeP electrode. Fig. 6a shows the full XPS spectrum of raw-/desalinated-FeP, in which both curves have strong O 1s peaks. This presumably resulted from the surface oxidation of the FeP electrode. Owing to the employment of a graphite current collector, a distinct characteristic peak at 291 eV associated with the carbon π–π* bond can be observed in Fig. 6b. Meanwhile, both the C–O–C bond and O–C![[double bond, length as m-dash]](https://www.rsc.org/images/entities/char_e001.gif) O bond peaks are significantly enhanced after the desalination, proving the oxidation of the electrode. In Fe 2p spectra, shown in Fig. 6c, characteristic peaks of 709.83 and 722.63 eV represent the FeII in the oxidized species, and their peaks almost disappear after desalination. Meanwhile, Cl− moves towards the FeP electrode under the action of an electric field and forms a Fe–Cl bond. The surface atomic ratio of FeIII (E and F peak) increases from 30.9% to 34.5% after desalination. As we have stated above, ferric oxidation is easily generated on the surface of FeP. In the lasted process of desalting, the ferric oxidation breaks, after which the FeP is involved in the desalination. As a result, the characteristic peaks at 707.49 and 722.63 eV that are indexed to the Fe–P bond are significantly reduced after desalination. Accordingly, the surface atomic ratio of Fe in the Fe–P bond decreases from 28.1% to 20.5%. Fig. 6d shows the high-resolution P 2p spectra. It can be seen that the peak at 129.7 and 130.6 eV are decreased, while the peak at 134.24 eV is increased, implying that partial P was oxidized due to the formation of phosphate.
O bond peaks are significantly enhanced after the desalination, proving the oxidation of the electrode. In Fe 2p spectra, shown in Fig. 6c, characteristic peaks of 709.83 and 722.63 eV represent the FeII in the oxidized species, and their peaks almost disappear after desalination. Meanwhile, Cl− moves towards the FeP electrode under the action of an electric field and forms a Fe–Cl bond. The surface atomic ratio of FeIII (E and F peak) increases from 30.9% to 34.5% after desalination. As we have stated above, ferric oxidation is easily generated on the surface of FeP. In the lasted process of desalting, the ferric oxidation breaks, after which the FeP is involved in the desalination. As a result, the characteristic peaks at 707.49 and 722.63 eV that are indexed to the Fe–P bond are significantly reduced after desalination. Accordingly, the surface atomic ratio of Fe in the Fe–P bond decreases from 28.1% to 20.5%. Fig. 6d shows the high-resolution P 2p spectra. It can be seen that the peak at 129.7 and 130.6 eV are decreased, while the peak at 134.24 eV is increased, implying that partial P was oxidized due to the formation of phosphate.
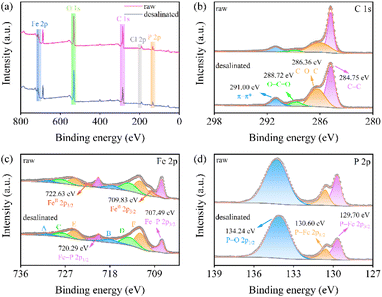 | ||
| Fig. 6 (a) XPS survey spectrum, (b) C 1s, (c) Fe 2p, and (d) P 2p spectrum of the raw- and desalinated-FeP electrode. | ||
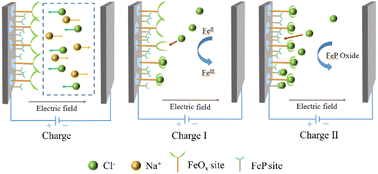
In order to explain the chloride removal process, a schematic mechanism is displayed in Fig. 7. At the initial state, when a direct potential difference was applied to the CDI unit, Cl− and Na+ moved toward the anode and cathode under the drive of the electric field, respectively. Owing to the presence of the FeOx layer on FeP, the conversion of FeII to FeIII in FeOx was triggered by charging, accompanied by the electrosorption of Cl− instantaneously. With continuous electrosorption, the oxidation of FeOx gradually saturated and then FeP was involved in the desalination.
Conclusion
In this work, the mesoporous shuttle-like FeP was prepared using MIL-88 as a template for a high-performance CDI electrode. The maximum desalting capacity of FeP reached 79.1 mg g−1 at 1.2 V in 1000 μS cm−1 NaCl solution. Further, the desalting capacity remained at 84% of the initial value after 13 cycles, manifesting the robust regeneration of the FeP electrode. The prominent desalination performance of FeP is ascribed to the novel nanostructure where the FeP nanoparticles are confined within the shuttle-like framework, which alleviates the large volume expansion during desalination/salination. The mechanism analysis features indicate that the conversion of FeII to FeIII is responsible for the removal of salty ions.Conflicts of interest
There are no conflicts to declare.Notes and references
- K. Sun, C. Wang and M. Tebyetekerwa, et al., Chem. Eng. J., 2022, 446, 137211 CrossRef CAS.
- S. Porada, R. Zhao and A. van der Wal, et al., Prog. Mater. Sci., 2013, 58, 1388–1442 CrossRef CAS.
- H. Saleem, S. J. Zaidi and A. F. Ismail, et al., Desalination, 2022, 542, 116061 CrossRef CAS.
- W. Xing, J. Liang and W. Tang, et al., Desalination, 2020, 482, 114390 CrossRef CAS.
- G. Folaranmi, M. Bechelany and P. Sistat, et al., Membranes, 2020, 10, 96 CrossRef CAS PubMed.
- Z. Liu, D. Jiang and L. Yang, et al., Nano Energy, 2021, 88, 106302 CrossRef CAS.
- Y. Liu, K. Wang and X. Xu, et al., ACS Nano, 2021, 15, 13924–13942 CrossRef CAS PubMed.
- S. Liu, V. Q. Do and K. C. Smith, et al., Electrochemistry, 2020, 22, 72–79 CAS.
- H. Liu, J. Zhang and X. Xu, et al., Chemistry, 2020, 26, 4403–4409 CrossRef CAS PubMed.
- P. Liu, T. Yan and L. Shi, et al., J. Mater. Chem. A, 2017, 5, 13907–13943 RSC.
- Q. Li, Y. Zheng and D. Xiao, et al., Adv. Sci., 2020, 7, 2002213 CrossRef CAS PubMed.
- M. Peng, L. Wang and L. Li, et al., eScience, 2021, 1, 83–90 CrossRef.
- X. Wang, G. Zhang and W. Yin, et al., Carbon Energy, 2022, 4, 246–281 CrossRef CAS.
- M. Yi, F. Xiang and X. Yue, et al., Appl. Surf. Sci., 2022, 604, 154503 CrossRef CAS.
- Z. Zheng, H. H. Wu and H. Liu, et al., ACS Nano, 2020, 14, 9545–9561 CrossRef CAS PubMed.
- X. Li, A. M. Elshahawy and C. Guan, et al., Small, 2017, 13, 1701530 CrossRef PubMed.
- P. Jiang, Q. Liu and Y. Liang, et al., Angew. Chem., Int. Ed. Engl., 2014, 53, 12855–12859 CrossRef CAS PubMed.
- Y. Lu, T. Wang and X. Li, et al., RSC Adv., 2016, 6, 87188–87212 RSC.
- W. Jin and M. Hu, Sep. Purif. Technol., 2020, 237, 116343 CrossRef CAS.
- F. Yang, H. Gao, J. Hao, J. Chen and Z. Guo, et al., Adv. Funct. Mater., 2019, 29, 1808291 CrossRef.
- W. Jin, M. Hu and Z. Sun, et al., Chem. Eng. J., 2021, 420, 127661 CrossRef CAS.
- J. Ma, X. Guo and Y. Yan, et al., Adv. Sci., 2018, 5, 1700986 CrossRef PubMed.
- M. Jiang, X. Li and W. Huang, et al., Electrochim. Acta, 2019, 323, 134813 CrossRef CAS.
- C. Wu, P. Kopold and P. A. van Aken, et al., Adv. Mater., 2017, 29, 1604015 CrossRef PubMed.
- C. Wang, J. Yan and T. Li, et al., Angew. Chem., Int. Ed., 2021, 60, 25013–25019 CrossRef CAS PubMed.
- F. Wang, X. Yang and B. Dong, et al., Electrochem. Commun., 2018, 92, 33–38 CrossRef CAS.
- X. Chen, X. Wang and D. Fang, et al., Fullerenes, Nanotubes, Carbon Nanostruct., 2020, 28, 1048–1058 CrossRef CAS.
- Z. Wu, L. Huang and H. Liu, et al., Nano Res., 2020, 14, 2264–2267 CrossRef.
- X. Wang, K. Chen and G. Wang, et al., ACS Nano, 2017, 11, 11602–11616 CrossRef CAS PubMed.
- Z. Yan, Z. Sun and H. Liu, et al., J. Colloid Interface Sci., 2022, 617, 442–453 CrossRef CAS PubMed.
- Y. Yang, W. Fu and C. Bell, et al., ACS Appl. Mater. Interfaces, 2021, 13, 34074–34083 CrossRef CAS PubMed.
- L. Han, M. Zhang and H. Wang, et al., Nanoscale, 2020, 12, 24477–24487 RSC.
- Q. Tan, K. Han and W. Zhao, et al., Sustainable Energy Fuels, 2021, 5, 844–854 RSC.
- Y. Zhang, Y. Wang and R. Luo, et al., Nanoscale Horiz., 2020, 5, 530–540 RSC.
- S. Shi, C. Sun and X. Yin, et al., Adv. Funct. Mater., 2020, 30, 1909283 CrossRef CAS.
- F. Guo, Y. Xie and Y. Zhang, Nano Res., 2021, 15, 2052–2059 CrossRef.
- L. Gao, Q. Dong and C. Hu, et al., J. Colloid Interface Sci., 2022, 627, 1011–1020 CrossRef CAS PubMed.
- T. K. A. Nguyen, T.-H. Wang and R.-a. Doong, Desalination, 2022, 540, 115979 CrossRef CAS.
- Z. Zhang and H. Li, Chem. Eng. J., 2022, 447, 137438 CrossRef CAS.
- S. Xiang, Y. Xu and Z. Fu, et al., Desalination, 2022, 539, 115931 CrossRef CAS.
- M. Hosseinzadeh, S. A. Mozaffari and F. Ebrahimi, Electrochim. Acta, 2022, 427, 140844 CrossRef CAS.
- Y. Li, Y. Yin and F. Xie, et al., Environ. Res., 2022, 212, 113331 CrossRef CAS PubMed.
- Z. Liu, W. Xi and H. Li, Environ. Sci. Water Resour., 2020, 6, 283–289 RSC.
- G. Zhu, L. Chen and T. Lu, et al., Environ. Res., 2022, 210, 112909 CrossRef CAS PubMed.
- X. Hu, X. Min and X. Li, et al., J. Colloid Interface Sci., 2022, 616, 389–400 CrossRef CAS PubMed.
| This journal is © The Royal Society of Chemistry 2023 |

