
 Open Access Article
 This Open Access Article is licensed under a Creative Commons Attribution-Non Commercial 3.0 Unported Licence
Cr(VI) permanently binds to the lipid bilayer in an inverted hexagonal phase throughout the reduction process†
Michal Nowakowski a,
Anna Wiśniewska-Beckerb,
Joanna Czapla-Masztafiaka,
Jakub Szlachetkoc,
Andrzej Budziakd,
Żaneta Polańskae,
Zuzanna Pietralik-Molińskae,
Maciej Kozake and
Wojciech M. Kwiatek*a
a,
Anna Wiśniewska-Beckerb,
Joanna Czapla-Masztafiaka,
Jakub Szlachetkoc,
Andrzej Budziakd,
Żaneta Polańskae,
Zuzanna Pietralik-Molińskae,
Maciej Kozake and
Wojciech M. Kwiatek*a
aInstitute of Nuclear Physics Polish Academy of Sciences, PL-31342 Krakow, Poland. E-mail: wojciech.kwiatek@ifj.edu.pl
bJagiellonian University in Krakow, Faculty of Biochemistry, Biophysics and Biotechnology, PL-30387, Krakow, Poland
cSolaris National Synchrotron Radiation Centre, Jagiellonian University, 30-392 Krakow, Poland
dAGH University of Science and Technology, Faculty of Energy and Fuels, Krakow, Poland
eAdam Mickiewicz University in Poznan, Faculty of Physics, PL-61-614, Poznan, Poland
First published on 21st June 2023
Abstract
Cr(VI) is a harmful, carcinogenic agent with a high permeability rate throughout the lipid membranes. In an intracellular environment and during interactions with cellular membranes, it undergoes an instant reduction to lower oxidation states throughout radical states, recognized as the most dangerous factor for cells. The cellular membrane is the most visible cellular organelle in the interior and exterior of a cell. In this study, liposomes and non-lamellar inverted hexagonal phase lipid structures based on phosphoethanolamine (PE) were used as model cellular bilayers because of their simple composition, preparation procedure, and the many other properties of natural systems. The lipid membranes were subjected to 0.075 mM Cr(VI) for 15 min, after which the Cr content was removed via dialysis. This way, the remaining Cr content could be studied qualitatively and quantitatively. Using the combined XRF/XAS/EPR approach, we revealed that some Cr content (Cr(III) and Cr(VI)) was still present in the samples even after long-term dialysis at a temperature significantly above the phase transition for the chosen liposome. The amount of bound Cr increased with increasing PE and –C![[double bond, length as m-dash]](https://www.rsc.org/images/entities/char_e001.gif) C– bond content in lipid mixtures. Internal membrane order decreased in less fluid membranes, while in more liquified ones, internal order was only slightly changed after subjecting them to the Cr(VI) agent. The results suggest that the inverted hexagonal phase of lipid structures is much more sensitive to oxidation than the lamellar lipid phase, which can play an important role in the strong cytotoxicity of Cr(VI).
C– bond content in lipid mixtures. Internal membrane order decreased in less fluid membranes, while in more liquified ones, internal order was only slightly changed after subjecting them to the Cr(VI) agent. The results suggest that the inverted hexagonal phase of lipid structures is much more sensitive to oxidation than the lamellar lipid phase, which can play an important role in the strong cytotoxicity of Cr(VI).
Introduction
The rapid development of technology and increasing environmental pollution generate more hazards to human health. Intoxications with heavy metals, like Hg, Pb, Cr, Cd, Ni, or Pd, due to their industrial or environmental origins as well as their mis-supplementation, induce severe medical issues. Moreover, they are commonly associated with multiple post-exposure health complications, which in many cases are emerging due to DNA damage and cancer initiation processes.1Chromium (Cr) is a 3d group metal, and its ions exhibit both positive as well as toxic effects, depending on the oxidation state. Chromium(III) is treated as a trace element involved in glucose metabolism,2–4 while Cr(VI) exhibits high toxicity and carcinogenic (mutagenic) properties.5–7 It is an emerging problem since a rapidly developing industry causes increased use of Cr compounds and leads to growing environmental pollution, leading to constantly increasing exposure to this harmful element.
Although there are reports that anionic transporters are involved in the regulation of the Cr(VI) permeation process,8 the possibility for Cr(VI) compounds to pass lipid (and cellular) membranes directly was not excluded.9 The leading indicators of this process are oxidative damage of lipid membrane6 with a simultaneous reduction of the Cr(VI) oxidation state to the Cr(III) occurring during the passage of chromium ions through the cellular membrane.10 Such a mechanism has already been proven indirectly by biochemical approaches.10,11 This leads to the general problem of Cr contamination and protection due to recent reports that undermined the safety of popular dietary supplements containing Cr(III) compound, chromium(III) picolinate.12,13 The research suggests that the Cr(III), so far considered safe, can be re-oxidized in a cellular environment or inside tissue and become cytotoxic again.3 For example, popular nutrient compounds Cr(pic)3 and CrCl3 can be oxidized by H2O2 originating from enzymatic activity in neutral aqueous conditions, leading to DNA damage.2,4,14
Focusing on Cr(VI) toxicity, it should be mentioned that numerous investigations have been done regarding the cytotoxicity of Cr(VI) compounds. In the case of humans, it was observed that Cr(VI) compounds are immunotoxic, enlarge the risk of asthma,9 and also, on a longer time scale, they act as carcinogenic factors.5,9 Cr(VI) compounds also disturb the redox balance in human liver cells, which induces apoptosis.9 In particular, growing exposition to the Cr(VI) leads to the activation of antioxidant enzymes such as the superoxide dismutase (SOD), the cysteine ligase catalytic subunit (CLCS), and the heme oxygenase 1 (HO-1). Simultaneously, mitochondria were increasingly more damaged, and apoptotic biochemical paths were predominantly promoted.9
Various organic compounds may coordinate Cr ions, and a range of the metal oxidation states in these complexes spans from −2 up to +6. The 0-oxidation state can be coordinated mainly by aromatic chains via π electrons15 or small inorganic ligands, for example, CO.16 In the case of the interactions with lipid membranes, especially the Cr(VI), radical chain reactions can occur due to the high initial oxidation state. The Cr(VI) has a low initial negative free Gibbs energy, G0 of reactions with phospholipid molecules. The Cr(VI) radical reactions with lipid membranes are connected with the oxidation state reduction from the +6 to the +3 through +5, and +4 states.17 Metastates, including Cr(V) and Cr(IV), belong to the strongest oxidizing agents, and they could easily alternate a structure of a lipid membrane throughout the direct oxidation or peroxidation process.17
Simple ionic Cr(VI) compounds can be hydrated in a water solution. In this form, they are relatively stable and could be transported inside a cell or liposome. Cr(VI) might enter the membrane interior throughout the phosphate and sulfonic anions exchange mechanism via ionic channels.5,18 Cr(VI) has a considerable permeability potential, and right after incorporation into a lipid membrane, it also starts to reduce to a relatively stable Cr(III) form 7,8. It was proposed that the most destructive factor for a lipid membrane is oxidative stress.6,10,11 After a lipid membrane was exposed to the Cr(VI), the mobility of an EPR spin label incorporated into the membrane significantly increased due to increasing membrane fluidity.17 Moreover, unstable Cr(V) and Cr(IV) intermediate products in both the hydrophobic and hydrophilic parts of the membrane were observed, and electric potential through the cell membrane was changed. It was undeniably evidenced that the Cr(VI) can modify the structure of the cell membrane and directly access the interior of the cell without employing any other mechanisms. However, there was no distinction in the role played by membrane lipids and other molecules.
All cellular membranes are composed of amphipathic molecules-phospholipids, generally having two structural parts: one smaller hydrophilic end and a longer hydrocarbon chain. In a water environment, phospholipids spontaneously form, so that hydrophobic chains are as isolated from water as possible. Liposomes are spherical vesicles created from a lipid bilayer or multilayer with a diameter ranging from 30 nm to micrometric sizes.19 Depending on the desired properties, a bilayer and a multilayer can contain one phospholipid or a mixture. Liposomes created in a water environment are a reliable model of a cellular membrane. They could preserve most of the significant properties of natural membranes, such as tunable fluidity, permeability, electrochemical gradient through a membrane, and even in a limited way, detailed composition and curvature.20,21
Phosphatidylethanolamines (PE) are widely present in the cellular membranes of mammals. Unsaturated PE phospholipids tend to organize in an inverted hexagonal phase (HII), where hydrophobic chains are exposed to the aqueous solution.22 This can happen spontaneously at 10 °C,23,24 in a neutral or acidic environment.25,26 Mixtures containing phosphatidylcholine (PC) and lamellar phospholipids will form the HII phase if the PC content is significant.27 The HII phase is important in biology: while to preserve compartmentalization and structural purposes, lamellar membranes are essential, HII domains are required to maintain enzyme activity28,29 and membrane fusion capabilities.30,31 As such, non-lamellar lipid structures are recognized as key factors in membrane fusion and merging processes.32,33 Additionally, non-lamellar lipid phases and HII in particular are involved in signal transduction by promoting G-proteins bonding to relevant membrane region.34 Phosphoethanolamine (PE) lipids, have tendencies to form HII phases in model and cellular membranes.33,34 Lack of PE phospholipids results in pathologic cytokinesis in eukaryotic cells.35 The high cellular biosynthetic activity towards PE phospholipids during the mitosis and G3 parts of cell cycle36,37 suggests crucial role of PE lipids,35 and subsequently, the HII phase in cell division process. The HII lipid phases, exhibits also increased permeability rates for small ions and can be used to modulate ion flux across the membranes of eukaryotic cells.38 Moreover, as the unsaturated aliphatic chains are exposed to the external environment, they can become a target for oxidizing agents, leading to membrane damage, and in more extensive scale, to pathologic cell division.
Here, we examine an outcome from the interaction between Cr, lamellar liposomes, and non-lamellar HII phase structures. Structural and chemical changes are tracked quantitatively and qualitatively by physical methods. As a result, we present a dramatic increase in sensitivity towards toxic Cr(VI) when HII structures dominate a membrane. Moreover, we established that the Cr(V) radical is a main cytotoxic factor and that Cr tends to accumulate in lamellar structures. The conclusions are placed in a broader biological context.
Results and discussion
Liposome evaluation
The phase transition temperatures Tc of liposomes were examined before the subsequent dialysis procedure. Dialysis was planned to be performed at a temperature higher than the Tc to facilitate the dialysis procedure. IR measurements were done in a broad range of temperatures to find the main phase transition of lipid membranes. Infrared spectra plotted for changing temperatures in the range of 4–40 °C for 1,2-dimyristoyl-sn-glycero-3-phosphocholine (DMPC) and DMPC:DOPE (where: DOPE – 1,2-dioleoyl-sn-glycero-3-phos-phoethanolamine) liposomes in ratio 100![[thin space (1/6-em)]](https://www.rsc.org/images/entities/char_2009.gif) :1, 10:1 5:1 and 1:1 are presented in Fig. S1.1-5a,† while in Fig. S1.1-5b,† the Tc were determined. For DMPC the result was 24.9(4) °C. Obtained Tc value for all liposomes was in good agreement with the literature values,39,40 and are listed in Table S1.† Our data suggest that we obtained reliable liposomal suspensions for further experiments. For the selected liposomal samples, enthalpies of phase transitions were measured with differential scanning calorimetry (DSC). With increasing DOPE content in studied systems, the enthalpy was decreasing, indicating gradual fluidization of the membranes structure (Fig. S1.6†). The whole characterization protocol was repeated to ensure obtained results are not affected by errors.
:1, 10:1 5:1 and 1:1 are presented in Fig. S1.1-5a,† while in Fig. S1.1-5b,† the Tc were determined. For DMPC the result was 24.9(4) °C. Obtained Tc value for all liposomes was in good agreement with the literature values,39,40 and are listed in Table S1.† Our data suggest that we obtained reliable liposomal suspensions for further experiments. For the selected liposomal samples, enthalpies of phase transitions were measured with differential scanning calorimetry (DSC). With increasing DOPE content in studied systems, the enthalpy was decreasing, indicating gradual fluidization of the membranes structure (Fig. S1.6†). The whole characterization protocol was repeated to ensure obtained results are not affected by errors.
The structural characteristics of liposomes were also conducted using small angle X-ray scattering and the data are presented in Fig. S1.7.† At high temperature, i.e. above the main phase transition, the lamellar phases were observed for all studied samples. At the temperature below Tc, the diffraction peaks for the lamellar structure and the hexagonal phase were present. The intensities of peaks assigned to hexagonal phase was increased with the increase of DOPE content in the liposomes. Probably, reduced fluidity at low temperature led to phase separation whereas at high temperature the distribution of lipids is more even and the contribution of lamellar phase characteristic for DMPC liposomes prevails.
As a final step, samples were concentrated by water evaporation to form a thick gel to increase the concentration of Cr for X-ray experiments.
Structural changes in the membrane organization
Studied liposomes were analyzed using X-ray diffraction (XRD) at room temperature (22 °C). Although any XRD data analysis obtained from a biological-like sample is difficult, we have acquired diffraction patterns that exhibit systematic differences between models. All results are presented as the relation between peak intensity and the 2θ value. The DOPE concentration (and by this the DMPC:DOPE ratio) was treated as a parameter and systematically increased in the samples to cover as broad range of concentrations as possible.
Results of XRD measurements conducted on pure liposomes compared to Cr(VI)-treated samples are presented in Fig. 1A and B, while a comparison between all pure liposomes is shown in Fig. S2.† All XRD patterns have sets of reflections that have a well-defined shape. Therefore, all liposomal samples maintain some level of internal order, manifested by a group of characteristic dhkl values, similar for all of them. These values were blurred because even dried samples preserved the internal dynamics of phospholipid molecules in a plane of membranes that remained elastic. Discussed peaks are presented in Table S2.† There were two distinct groups of liposomes: (1) DMPC and DMPC:DOPE 100:1 and (2) DMPC:DOPE 10:1, 5:1, and 1:1. When a DOPE ratio increased in the membrane, the complex structure visible in the first group of liposomes was replaced by a different and simpler pattern. The DOPE phospholipid and its mixtures with phosphatidylcholines are well known to form inversed hexagonal phases in water, where lipid molecules form regular hexagonal structures with polar head groups directed to water channels and hydrophobic tails to each other.41 In such a case, the fluidity of created membranes is significantly higher, which agrees with changes observed in our XRD data. Despite that, several structures in the XRD patterns are common for all mixtures. The peak around 1.7–1.94° indicated a subgel space between two bilayers.42 For angles between 3.8 and 2.8° (marked by a green background in Table S2†), there are visible characteristic broad maxima in XRD patterns. In the XRD method, the experimental angular resolution is a function of the 2θ value, dropping with a decreasing 2θ value. Thus, this broad structure is probably created by multiple overlapped peaks. The equivalent dhkl distances varied between 51.7 and 45.4 Å, corresponding to the total bilayer thickness. Moreover, this averaged structure is present in all XRD spectra, including liposomes treated with Cr(VI) (see Fig. 1A and B). The peak in the range of 6.6–6.9° (12.9–13.5 Å) corresponds to averaged hydrocarbon chain length.43 The last common structure in all XRD patterns of pure phospholipids is a broad maximum between 21–21.7° (4.1–4.2 Å) which we associate with the hydrophilic part of the lipid membrane. The XRD patterns of liposomal samples treated with a Cr(VI) in Fig. 1A and B have less internal order and higher fluidity since fewer reflections are visible.17 Moreover, after interaction with the Cr(VI), the differences between the groups of liposomes due to the DOPE concentration were significantly reduced. All XRD patterns share an additional common peak in the range of 13.1–14.4° (6.1–6.7 Å), which can be related to the position of the choline group in the membrane. Additionally, upon interaction with Cr(VI), all patterns except for pure DMPC liposomes have a peak between 9.8–10.2° (8.7–9.1 Å). This is a region where a pair of DOPE unsaturated bonds is present. On the other hand, a characteristic double peak feature for group 1 appeared in the region of 27.2–27.6° (3.2–3.3 Å). Since it is present only in patterns of relatively rigid liposomes in the lamellar phase, we expect that the peaks reflect the association of Cr compounds on the membrane surface. Moreover, after exposition to Cr(VI), all lipid samples exhibit very similar XRD patterns, especially in comparison to the DMPC. Thus, due to the damage done by Cr(VI) reduction process to the membrane elements, we suspect that the HII phase was replaced with a lamellar structure, as it is the stable structure for saturated form of lipids. More details on structural analysis are provided in ESI.†
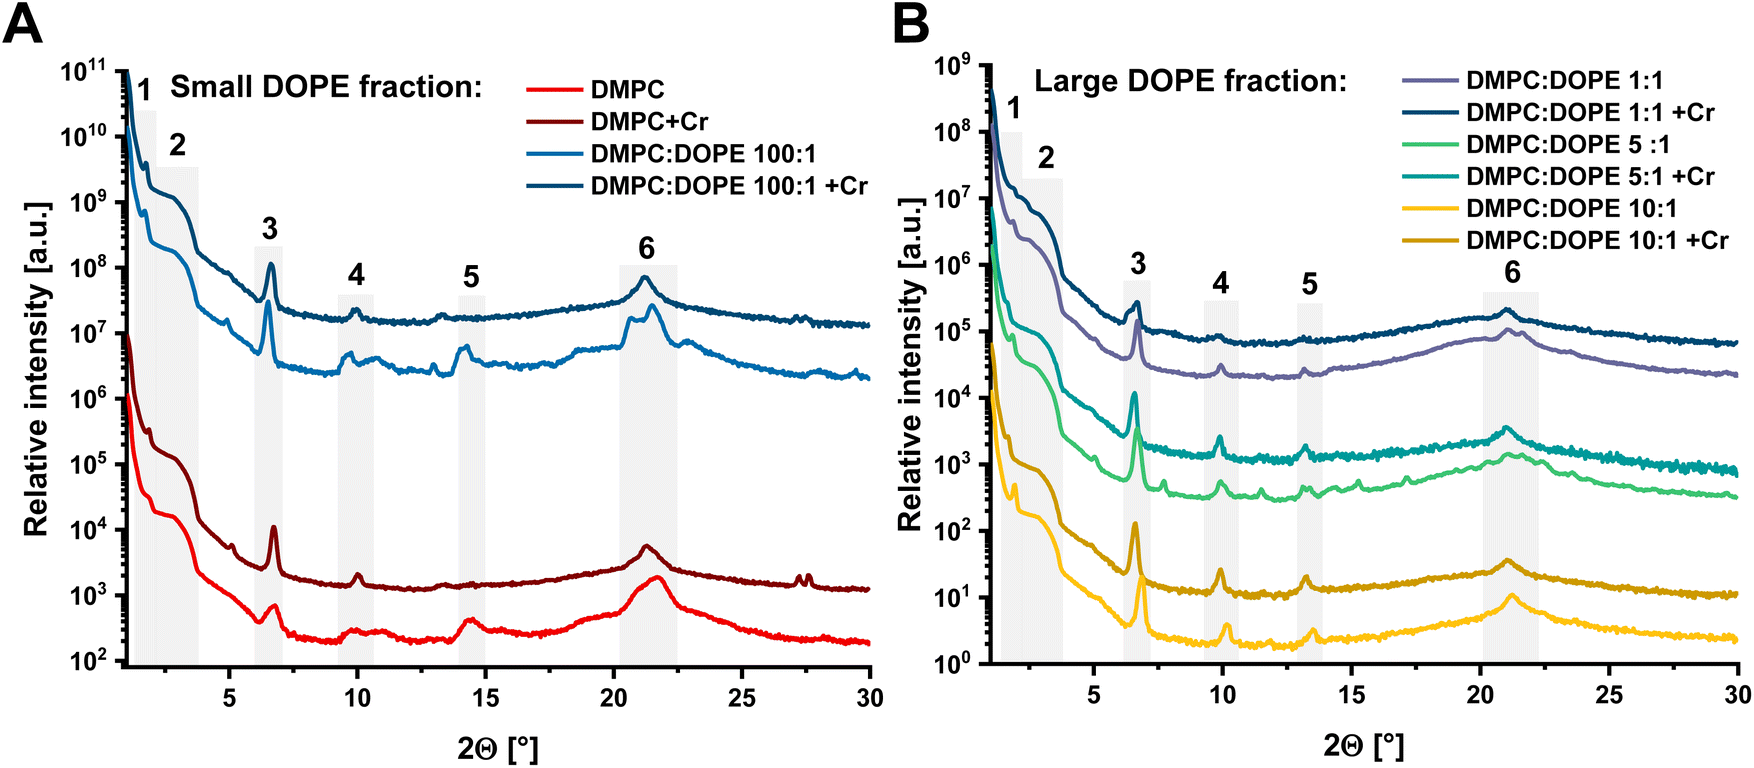 | ||
| Fig. 1 X-ray powder diffractograms of two of liposomal sample groups that were both treated and not treated with Cr(VI): (A) – small DOPE fraction liposomes; (B) – large DOPE fraction liposomes. Grey areas represents regions described in the text. | ||
Reduction of the Cr(VI) in the liposomal environment
During the reaction of liposomes with the K2Cr2O7, the most critical challenge was maintaining clean samples and not contaminating them with a residual Cr from the environment or laboratory equipment. A strict protocol was developed to obtain as pure as possible samples. Control samples were prepared in the same way, including the dialysis procedure. XAS spectra of all samples are presented in Fig. 2A, while a pre-edge region is shown in detail in Fig. 2B. No differences were observed between samples measured in RT and at 10 K, except the lower signal quality due to lower absorber concentration, thus there was no evidence of either a beam damage effect or a hydration effect. Fig. 2B additionally shows that during subsequent replacement DMPC with a DOPE in liposomes, a higher amount of reduced form of Cr was generated. A very pronounced pre-edge peak structure characteristic for the K2Cr2O7 at 5992 eV consequently diminished and was finally replaced by a very weak pre-edge of DMPC:DOPE 1:1 + Cr of an unknown chemical sate with Cr on a lower oxidation state. Avery low, broad, double-peak structure (maxima at 5988.8 eV and 5992.3 eV) of the pre-edge feature suggests a distorted octahedral geometry of the final product. Although the Cr(III) electronic configuration is the most stable in which Cr could occur, other products also have to be considered. The likely reduction process would lead throughout the metastable Cr(V) and the unstable Cr(IV) oxidation states down to Cr(III). The final product had to be stable enough to be measured, so it could not be the Cr(IV) compound.17 The absorption edge position for the DMPC:DOPE 1:1 + Cr sample was 5999.6 eV. A significant absorption edge shift (6.2(3) eV) suggested that our last sample contained Cr(III) complex44 made through the reduction process. A calibration curve for the oxidation state was calculated, shown in Fig. 2C, to place observed changes in a broader context. The figure presents an average oxidation state of Cr in the samples. For DMPC and DMPC:DOPE 100:1, the average oxidation state was +5.5. For samples with a large DOPE fraction, the average oxidation state was +4.5 for the ratios of 10:1 and 5:1 and 3.4 for the 1:1. An average oxidation state of the final products in DMPC:DOPE 1:1 + Cr sample was around +3.4, and the reduction process can be considered to be complete. XAS spectra from our other samples (DMPC, DMPC:DOPE + Cr 100:1, 10:1, and 5:1), except the K2Cr2O7, were a linear combination of a reduced Cr(III) and non-reduced Cr(VI) components, and this fact strongly influenced an obtained edge positions. Relation between Cr(VI) and Cr(III) in the function of a DOPE concentration was obtained from the Linear Combination Fitting (LCF) procedure. Results are presented in Table 1 and Fig S3.† It can be seen that all experimental spectra were reproduced by linear combinations of K2Cr2O7 and DMPC:DOPE 1:1 + Cr spectra. The quality of fits was good (R < 0.05), and results indicated a gradual reduction process from Cr(VI) to Cr(V)/Cr(III) oxidation state represented by the DMPC:DOPE 1:1 + Cr spectrum.
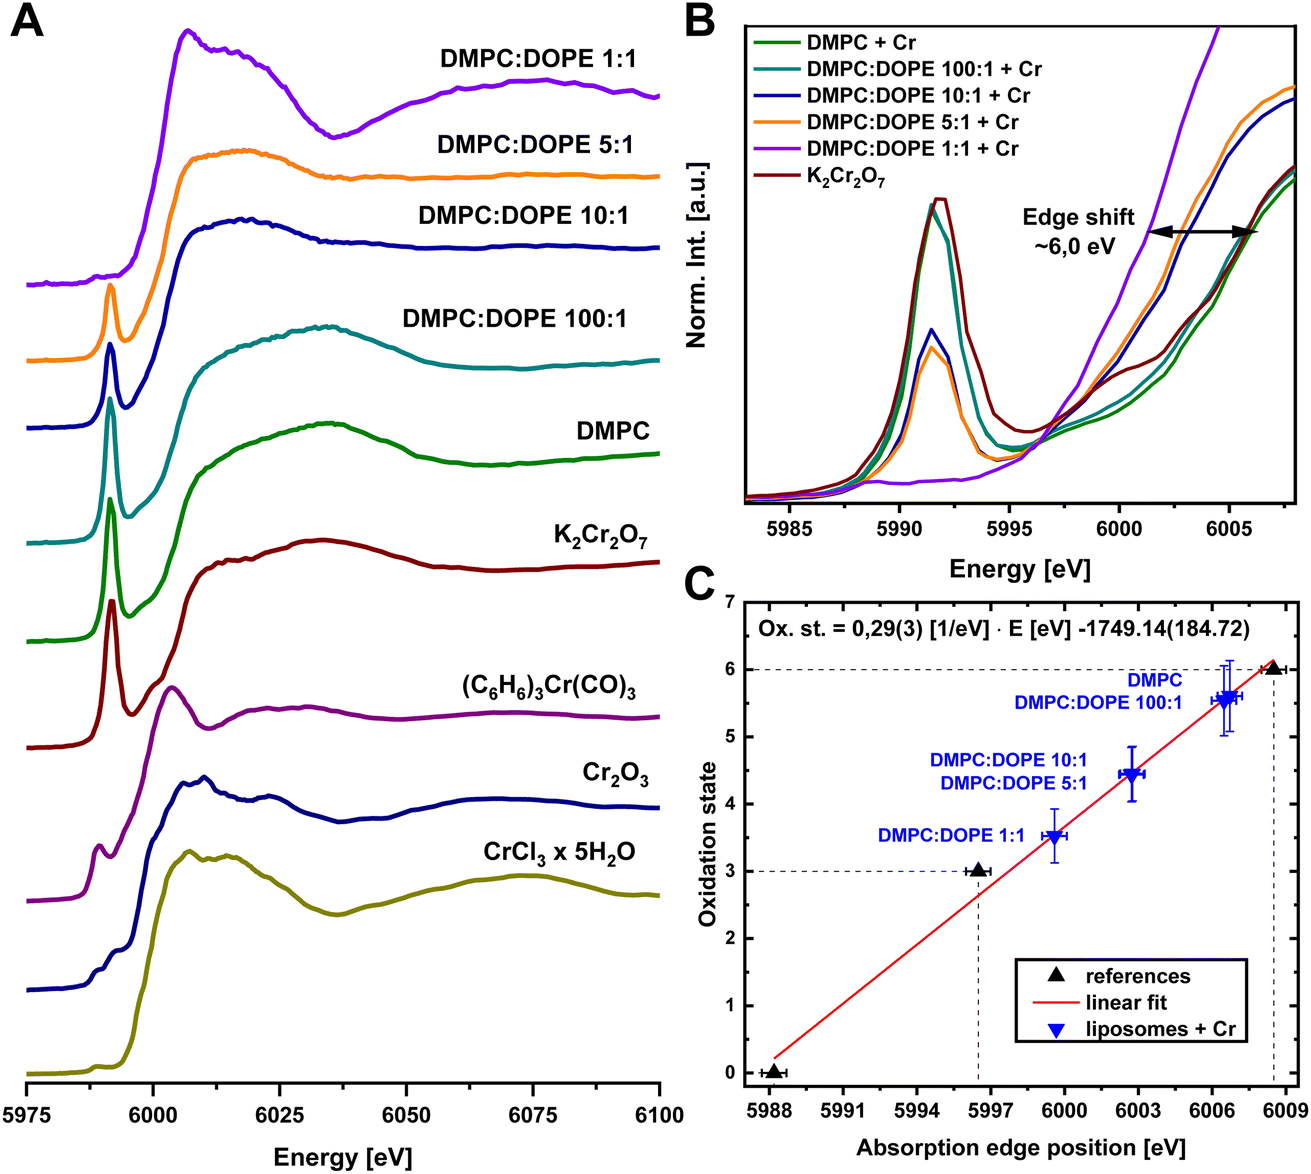 | ||
| Fig. 2 Data obtained in the XAS experiment. (A) – Cr K-edge XANES region; (B) – pre-edge region of XANES spectra. Arrow indicates an edge shift; (C) – calibration curve of oxidation state versus Cr K edge position. | ||
:1 samples were used as references for Cr(VI) and Cr(III) respectively. The R value was fit evaluation and is defined as  where N is a number of data points, yi is a data point value and
  is fitted value at the same data point
| Sample | Cr reference | [CrVI]/[CrIII] | R | |
|---|---|---|---|---|
| K2Cr2O7 (CrVI) | DMPC:DOPE 1:1 (CrIII) |
|||
| DMPC | 0.922(15) | 0.078(17) | 11.821(355) | 0.037 |
| DMPC:DOPE 100:1 |
0.933(16) | 0.067(16) | 13.925(46) | 0.041 |
| DMPC:DOPE 10:1 |
0.540(10) | 0.460(10) | 1.174(235) | 0.037 |
| DMPC:DOPE 5:1 |
0.500(11) | 0.500(11) | 1.000(220) | 0.043 |
| DMPC:DOPE 1:1 |
0 | 1 | 0 | N/A |
Quantitative evaluation of Cr bonded to the membrane
To quantitatively describe the reduction process from Cr(VI) to Cr(III), it was necessary to access information about the amount of Cr bound to a lipid membrane in each sample. Using the X-ray fluorescence (XRF) method, we have obtained information about residual Cr content inside liposomal samples. The same samples were used for the XRF experiment as in the XAS analysis. Example results from the XRF experiment are presented in Fig. 3, where data is present for two types of liposomes. Details about XRF data treatment are shown in ESI Section.† These results were subsequently combined with the conclusions from the LCF (Table 1) procedure, and using a calibration curve, relationships presented in Fig. 4 were calculated. In the first two samples: DMPC and DMPC:DOPE 100:1, the lipid membrane was insufficient to maintain an effective diffusion throughout it. It is consistent with XRD results, for which, in the first two samples, the membrane is more structured, and Cr(VI) was more deposited on the surface or trapped inside instead of penetrating inside membranes. Moreover, as seen in Fig. 4, the amounts of reduced Cr are not statistically significant due to large uncertainties in total Cr content and Cr(VI). However, in the DOPE concentration range of 9–50% in lipid membranes, there is a stable growth of total Cr content in the function of the amount of –HCCH– bonds, indicating that the unsaturated bonds in aliphatic chains are the target for oxidation during Cr permeation throughout a lipid membrane with non-lamellar structure.38,45 With inverted hexagonal phase more accessible targets for oxidation are possible, as aliphatic chains are exposed to the environment. The Cr(VI)/Cr(III) ratio drops with growing DOPE concentration, and for 17% of DOPE, the [Cr(VI)]/[Cr(III)] value equals 1, which supports the statement that not all Cr(VI) is reduced instantly in contact with a lipid membrane. The LCF results show that despite explicit dependency between a total Cr concentration in samples and DOPE (–HCCH–) concentration, a significant fraction of Cr is bounded to pure DMPC liposomes (Table 1). This result is similar to the one presented on the Cr(VI) treatment of unsaturated Pseudochrobactrum saccharolyticum LY10 biofilms,44 except that biofilms derived from bacteria are not only pure lipid membranes. Additionally, it is consistent with the presence of two peaks in the 2θ range of 28–29.5° in XRD spectra for DMPC + Cr and DMPC:DOPE 100:1 + Cr liposomes, which reflect higher ordering on the surface of the liposomes. Finally, it clearly presents that the inverted hexagonal phase of the lipids is much more sensitive to damage by Cr(VI) and other oxidative agents than regular lipid membranes, as shown for lipid mixtures with higher DOPE concentrations.
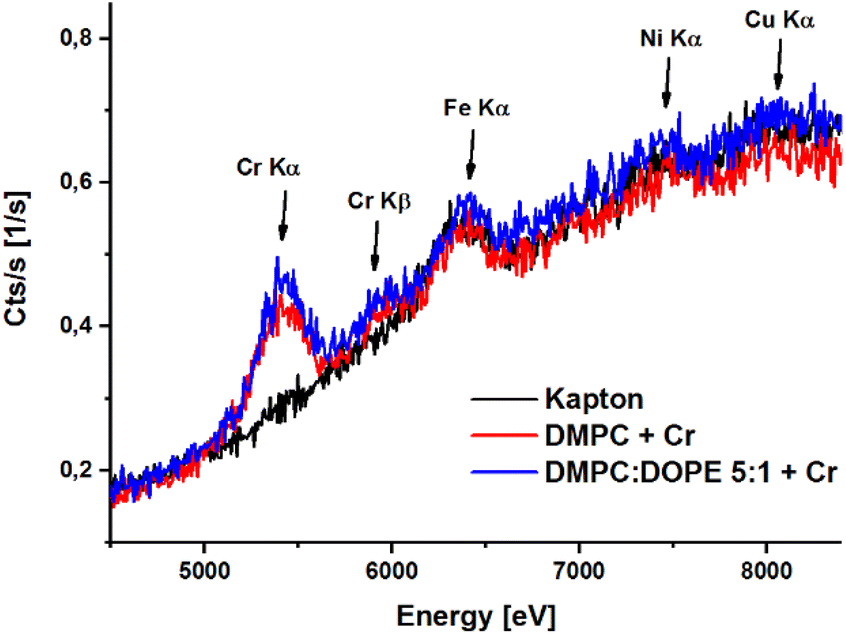 | ||
| Fig. 3 Data obtained in XRF experiment for Kapton foil (background, black line), DMPC + Cr liposomes (red line) and DMPC/DOPE 5:1 + Cr (blue line) liposomes. | ||
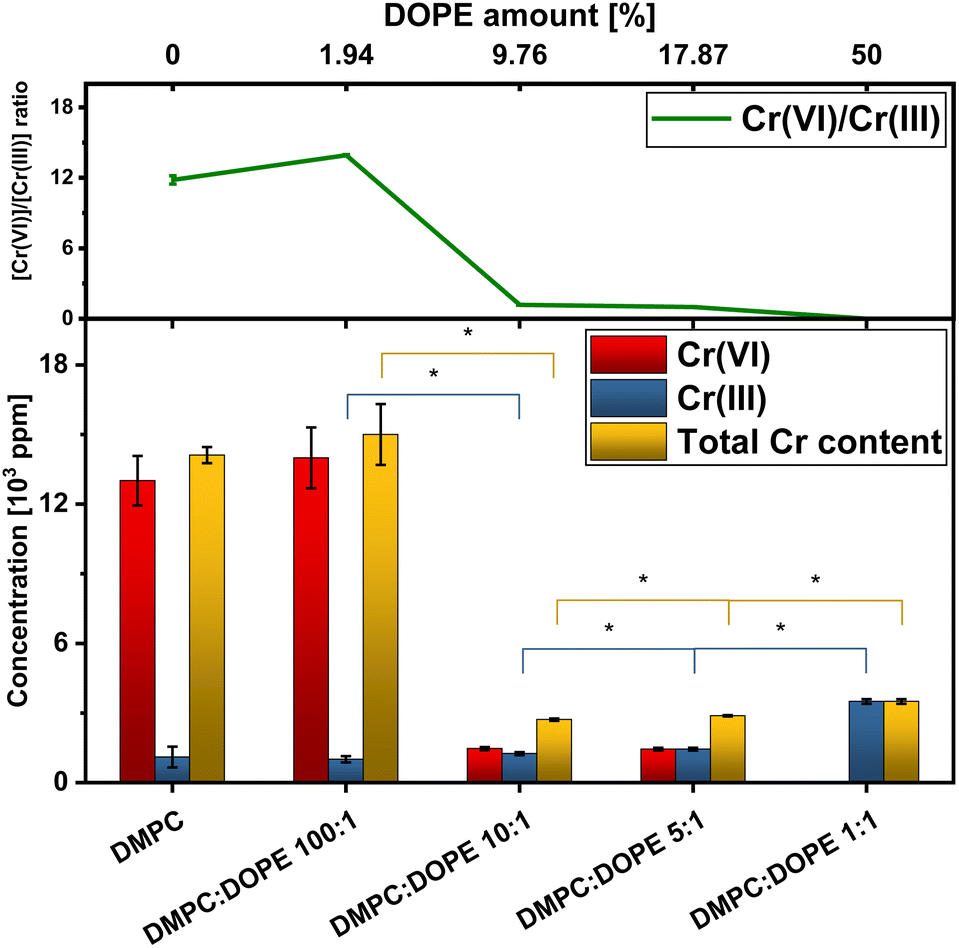 | ||
| Fig. 4 Top: a relation between Cr(VI) and reduced fraction of Cr in function of the DOPE concentration; bottom: a total Cr concentration (yellow) and each components: Cr(VI) (red) Cr(III) (blue) in respect to the DOPE concentration. Results are plotted as mean ± total uncertainty. The * symbol indicates statistically significant difference for t-student test at p-0.05. | ||
DOPE-dependent permanent Cr binding in membrane
The Cr(VI) permeability throughout a lipid membrane has a much higher rate than the Cr(III).46 The fact is accounted to an effective anion exchange mechanism,46 which is not the case for the Cr(III), the other most common chromium state. Inorganic Cr(VI) compounds are present in solution in hydrated form as anions, e.g., Cr2O72− or CrO42− and they can exhibit a passive membrane transport, strictly dependent on the membrane thickness.47 So far, a model describing the mechanism of passive diffusion assumes that due to a stochastic movement of a semiliquid membrane, short-lived junctions are created in these membranes.48 This way, ionic compounds are transported throughout bilayers, and an electrochemical balance is maintained in a living system.49 Since DMPC and DMPC:DOPE 100:1 mixtures are liposomes and less permeable for ionic compounds, we believe that the overall Cr concentration difference between them and the large DOPE fraction group is the effect of passive transport and subsequent trapping of the Cr inside the liposome. For liposomes, the membrane–Cr(VI) interaction begins when the Cr(VI) compound associates on a membrane surface. When the liposomal XRD patterns were compared, this effect was seen in the DMPC and DMPC:DOPE 100:1 samples. After Cr(VI) treatment, a double peak emerged at 27.0–27.2° and 27.5–27.6° of 2θ for Cr(VI)-treated samples (see Fig. 1A and a description in text). According to Fig. 4, a reduction of the Cr(VI) in these samples was minimal – in addition to low fluidity, this could support the statement about creating a layer of adsorbed Cr-based compounds. On the other hand, the permeability rate is much increased in the HII phase due to its structure. Cr(VI) undergoes a reduction in a radical reaction on the exposed –CC– bonds, which produces oxidative stress and results in lipid peroxidation.6,45 In Fig. 4, the total amount of Cr increases with increasing DOPE concentration for an initial DOPE fraction ≥10%. Cr(VI), e.g., Cr2O72− or HCrO42−, have high redox potential E0 equal to 1.36 V and 1.35 V respectively50 and in reaction with –CC– and can get reduced to Cr(V) and bonded to an aliphatic chain, where the double bond was present. To prove this concept, we have performed a simple CW EPR experiment to confirm the presence of the Cr(V) species.
Detection of Cr(V) in liposomes by EPR
Fig. 5 shows EPR spectra obtained for four types of liposomes prepared in a 0.075 mM solution of K2Cr2O7. The signal typical for Cr(V) (g = 1.9849, Aiso = 18.6 G, 6, ΔH0 = 2.73 G) was observed only at DMPC/DOPE mixture. The values of EPR parameters are in accordance with literature data.51 Slight differences in Aiso and ΔH0 may result from different properties of the local environment of Cr species. The spectrum of Cr(V) presented in Chappell et al.51 was registered in the solution, whereas the spectrum in Fig. 5 was derived from Cr(V) present in the membrane, where molecular mobility is restricted. The results above suggested that for the one-electron reduction of Cr(VI), the lipid double bonds CC are responsible. However, no EPR signal was observed in the presence of DOPC, which contains the same CC bonds as DOPE. Also, the ethanolamine head group was not responsible for the reduction since, in the presence of DMPE no EPR signal was observed either. This leads to the conclusion that the PE group and double bonds in the alkyl chains are required for the reduction process. Due to the small size of their polar head group and low hydration, PE lipids tend to form an inverted hexagonal phase (HII).27,41 The presence of unsaturated alkyl chains enhances this tendency. The temperature of the phase transition between the lamellar liquid crystalline phase and inverted hexagonal phase for DOPE is relatively low, i.e., 10 °C.23
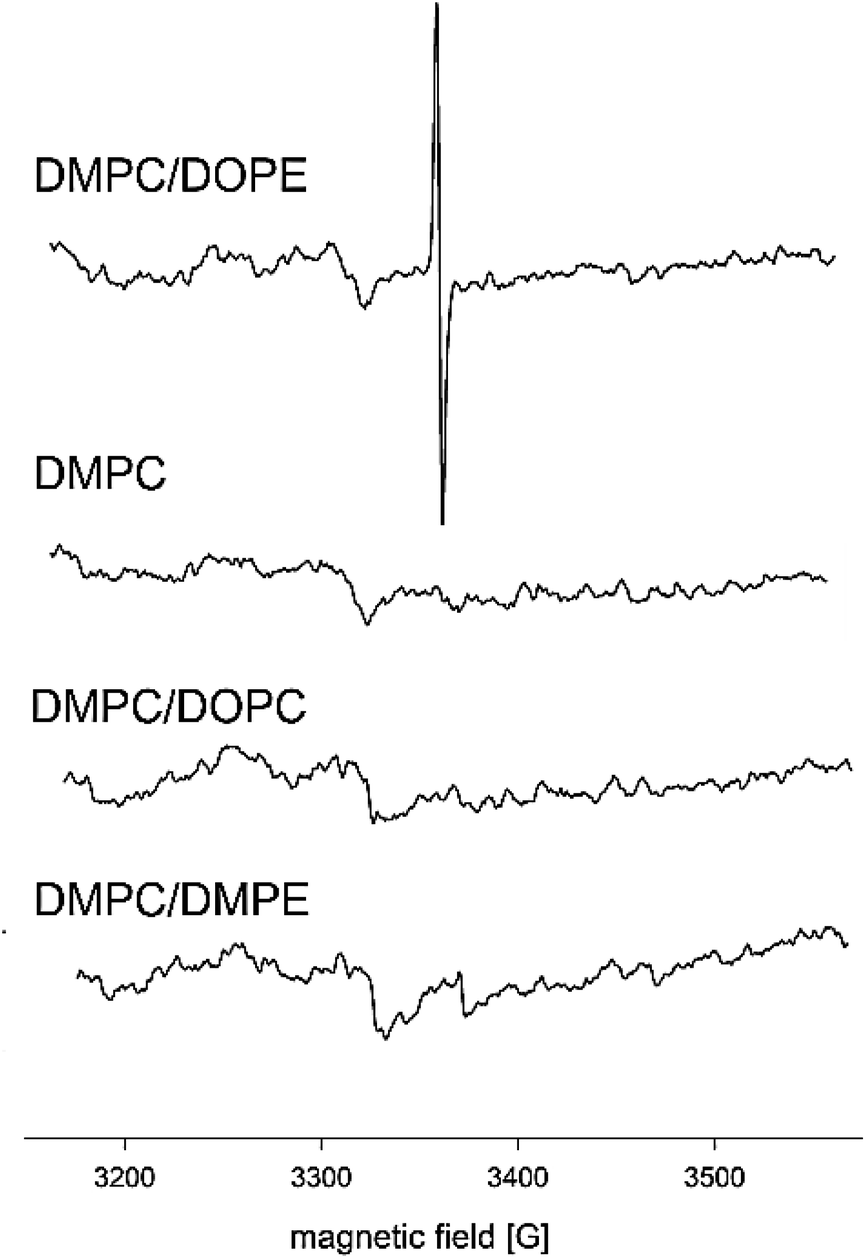 | ||
| Fig. 5 EPR spectra of liposomes of different composition (pure DMPC, DMPC:DOPE 1:1, DMPC:DOPC 1:1, DMPC:DMPE 1:1) incubated with 0.075 mM solution of K2Cr2O7. The spectra were aquired at 37 °C. | ||
Therefore, we suggest that the reduction of Cr(VI) to Cr(V) in the presence of double CC bonds in our liposome system is made possible by the forming of HII phase by DOPE. During membrane reorganization, while forming the HII phase, membrane permeability and accessibility of different compounds into the alkyl chain region increase.24,28,52
The reduction of Cr(VI) to Cr(V) is a first step in the process of oxidative membrane damage. The radical character of the reduction process explains the possibility of Cr being permanently bonded to the lipid membranes. Moreover, the Cr content could be accumulated over time in tissues and released once the tissue cells are replaced. Since the main oxidative target is lipid membrane in HII phase, the mechanism is selective to processes that involve these structures: cell and organelles division. The malfunctioning cell division could lead to numerous pathologies including cell death, cancer promotion, fetal malfunctions and aging diseases.53–55
Experimental
Methods
To achieve the goal of this study, the liposomal suspensions based on phosphocholine and phosphoethanolamine derivatives were prepared. At first, a study of their phase transition temperature Tc was performed. Details are available in ESI Data, Section 1.† This temperature was used as a primary quality parameter of the obtained liposomes. Then the liposomes were treated with the K2Cr2O7, and a remaining unbound Cr was removed by dialysis at a temperature high above the Tc (25 °C). Next, samples were dried at 55 °C and pressed into pellets. Afterward, the X-ray absorption (XAS), X-ray fluorescence (XRF), and XRD (X-ray diffraction) experiments were conducted on dried liposomes to determine the residual Cr concentration, local structure, and oxidation states of Cr in adducts as well as to study the condition of a whole membrane.Preparation of liposomal suspensions
Liposomal suspensions were prepared in the same way as reported by Pietralik et al.56 Mixtures of phospholipids: 1,2-dimyristoyl-sn-glycero-3-phosphocholine (DMPC, Avanti Polar Lipids cat. no. 850345P) and 1,2-dioleoyl-sn-glycero-3-phosphoethanolamine (DOPE, Avanti Polar Lipids cat. no. 850725P) were diluted in the 99% deuterium dioxide (D2O, Sigma-Aldrich cat. no. 435767) to a final concentration of liposomes equal to 0.15 M. Following mixtures were prepared: DMPC, DMPC:DOPE 100:1, DMPC:DOPE 10:1, DMPC:DOPE 5:1 and DMPC:DOPE 1:1. After diluting them in a D2O, the mixtures were sonicated in an ultrasonic bath for 30 minutes at 55 °C and then cooled down at 4 °C for 30 min. This sequence of sonication and cooling cycles was repeated 6 times.
K2Cr2O7 treatment and final sample preparation
Liposomal suspensions were soaked with the 0.15 mM solution of K2Cr2O7 (Sigma-Aldrich cat. no. 483044) to receive a final dichromate concentration of 0.075 mM and distilled water as a reference. The Cr(VI) concentration was selected to be similar to cytotoxicity studies performed on living cells, for example.4,57 After 15 min of incubation at 21 °C, both mixtures were dialyzed to remove any unbonded chromium ions content. Dialysis was performed at 52 °C with a continuous stirring applied using Spectra/Por 7 (SpectrumLabs, cat. no. 132103) regenerated cellulose dialysis tubing. The precipitate (double-distilled H2O) was removed after 15 min, 45 minutes, and 19 h and samples were slowly dried in air for 24 h at 55 °C in the Eppendorf Tubes. Two sets of samples were produced. One was left as a liquid suspension, and the other was dried at 55 °C and pressed into pellets 10 mm in diameter.Reference samples containing K2Cr2O7, CrCl3·5H2O, Cr2O3, and (C6H6)3Cr(CO)3 (all Sigma-Aldrich cat. no. 483044, 27096, 769533, and 119318, respectively) in 7.5% concentration mixed with cellulose (Sigma Aldrich, cat. no. 310697) were prepared in the form of pellets with 10 mm in diameter. For spectroscopic measurements, all samples were mounted on a holder using 0.06 mm thick Kapton tape (GoodFellow, cat. no. IM301202).
XRF experiment
X-ray fluorescence analysis was conducted with the use of a laboratory setup. For all samples, measurements were performed using the Hamamatsu Open Type Microfocus X-ray source, composed of the X-ray tube unit L9191 and the X-ray control unit C9193 (Hamamatsu Photonics K. K. Electron Tube Center). The tube voltage was set up to 30 kV, and the current was set to c.a. 22 μA. This model of an X-ray tube has a large X-ray emission angle (120°, according to the manufacturer's declaration); hence a simple lead collimator was added to reduce a spectral background contribution from an environment. X-ray fluorescence was collected using the XR-100CR Si X-ray detector with the PX2T/CR power supply & amplifier and the pocket multichannel analyzer MCA 8000A (all from AmpTek). The detector was shielded with an Al–Pb shielding and set at a 45° angle, 10 cm away from the sample. The samples were mounted on a holder using 0.06 mm thick Kapton tape (GoodFellow, cat. no. IM301202).XAS measurements
The Cr K-edge X-ray absorption experiment (XAS) was conducted at the BM25-A “SpLine” beamline at the European Synchrotron Radiation Facility. An energy selection was made using the Si(111) DCM in a range from a 5800 eV to 6830 eV with 20 eV, a step size far from the edge (E0 = 5989 eV) in a range of 5800–5981 eV, the 0.5 eV step size in a near-edge range from a 5981 eV to 6034 eV and k-dependent step size for an EXAFS region: the 0.05 A−1 step size from a 6035 eV up to 6066 eV and the 0.1 A−1 step size from a 6067 eV to 6830 eV. Spectra were taken in a total fluorescence mode using a 13-element HPGe Sirius detector (SGX Sensortech), with an acquisition time of 1 s per energy point, which resulted in a total 30 min acquisition time per spectrum. The experiment was conducted at room temperature (RT) and 10 K using a closed-flow liquid helium cryostat to examine radiation damage effects. A beam spot size was also defocused (1 × 3 mm) to minimize radiation damage. Samples were mounted on a holder using a 0.06 mm thick Kapton tape (GoodFellow, cat. no. IM301202). The RT-experiment was performed on liquid samples only in a short XANES energy range (5950–6160 eV) to avoid radiation damage. During the CRIO experiment, samples were cut to fit into a cryostat sample holder. However, due to a much smaller beam spot size (0.3 × 0.3 mm), a liquid helium flow, and additional beryllium window presence on a fluorescence optic path, a signal obtained from the 10 K measurements was much weaker. The liposomal samples had a different amount of Cr content inside. This was reflected in the XAS signal quality, starting from 15 kcts s−1 × point for the DMPC + Cr and finishing at 0.5 kcts s−1 × point for the DMPC:DOPE 1:1 Cr. Thus, different statistics of measurements were applied for each liposomal sample to increase the S/N ratio effectively.
Raw data from detectors were processed using SplineConverter 1.6 – the software available on site. Normalization and background reduction were made in the Athena software.58 The E0 value was defined by a point on the absorption edge, where the signal equals 0 in the 2nd derivative of an absorption spectrum. Linear combination fitting was done in Athena software, assuming that the K2Cr2O7 and DMPC:DOPE 1:1 samples were used as references. The E0 values were fixed, weight values were set to >0, and their summation to 1 condition was enforced. Fitting was done on an Ist derivative spectrum from 5974.8 eV to 6064.8 eV. The broader range was selected to include the possible effect of different oxidation states of Cr.
EPR measurements
For EPR measurements, liposomes were prepared according to the procedure described in ref. 59. Briefly, chloroform solutions of DMPC, DOPE, DOPC, and DMPE were mixed to achieve the desired compound molar ratio. The following lipid mixtures were prepared: DMPC alone, DMPC:DOPE 1:1, DMPC:DOPC 1:1, and DMPC:DMPE 1:1. The total amount of lipids in every sample was 3 μmol. Then, chloroform was evaporated with a stream of nitrogen, and the lipid films were additionally dried under a vacuum for 12 h. The dried lipid films were hydrated with 1 mL of 0.075 mM solution of K2Cr2O7, vortexed vigorously, and multilayer liposomes were formed spontaneously. Then, the liposome suspensions were centrifuged at 14000×g for 15 min at 4 °C, and the resulting pellet was used for EPR measurements. The measurements were performed with Bruker EMX AA 1579 EPR spectrometer (Bruker BioSpin, Germany) operating at 9 GHz equipped with a temperature control unit (EMX ER 4141 VT). The suspension of liposomes was placed in a gas permeable capillary (i.d. 0.7 mm) made of TPX and located inside the EPR dewar insert in the resonant cavity of the spectrometer. EPR measurements were performed using the following instrument parameters: microwave power 5.3 mW, modulation amplitude 3.05 G, scan width 400 G, and scan time 83.9 s.
Conclusions
Due to growing industry and technology development, chromium is increasingly present in the environment. Hexavalent chromium is a highly oxidative and toxic factor with a high permeability rate throughout the lipid membrane. It undergoes rapid reduction from Cr(VI) to a lower oxidation state either in a cellular environment or while interacting with biological membranes.The presented article shows that Cr(VI) interacts differently on lamellar and non-lamellar lipid membranes. In both cases, Cr is permanently bonded to the lipid membrane. In liposomes, chromium passes membranes via passive transport mechanisms and remains trapped inside. Additionally, for relatively low fluid membranes, it can associate on the surface of the liposomes. In the inverted hexagonal phase, –HCCH– bonds are exposed to the solution, and Cr(VI) can directly oxidize them. The internal order of lipid structures decreases after they are subjected to Cr(VI) interaction, which is reflected in the shape of XRD spectra. During the reduction of Cr(VI), an EPR active Cr(V) compound was created, which is highly reactive and can be an initiator of the radical chain reactions and further lead to membrane damage. In the biological context, the presented data suggest relatively high resistance of lipid membranes to the Cr(VI) species, which is modulated by unsaturation level. On the other hand, the non-lamellar phase is a good target for oxidation. Since the HII phase is involved in cell division, the Cr(VI) can stop the process by changing HII to the lamellar phase via oxidation damage.
Obtained results are promising in understanding Cr(VI) poisoning as they propose a direct mechanism of Cr(VI) binding to the lipid membrane. Additionally, Cr binding process is vital in the context of long-scale Cr poisoning. Further research is needed to confirm and uncover more details of this process and apply obtained results to cure and prevent Cr(VI) poisoning.
Author contributions
Conceptualization: MN, AWB; data curation: MN, AWB, AB; formal analysis: MN, AWB; funding acquisition: MN, WMK; investigation: MN, AWB, JCM, JS, AB, WMK; methodology: MN, JCM, ZK; project administration: MN, WMK; resources: WMK, ZK; supervision: WMK, JCM; validation: MN, AWB, JCM; visualization: MN, AWB; writing – original draft: MN; writing – review & editing: MN, AWB, WMK, JCM, JS, AB.Conflicts of interest
There are no conflicts to declare.Acknowledgements
The authors would like to thank for funding from the Marian Smoluchowski Kraków Scientific Consortium “Mater- Energy- Future” under the KNOW grant. The research was funded by the Polish National Science Center grant “Preludium” no. 2016/23/N/ST4/01601. The authors would like to acknowledge the European Synchrotron Radiation Facility (ESRF) and BM25-A beamline staff for granting beamtime and assistance with XAS experiments. In addition, the access to ESRF was financed by the Polish Ministry of Science and Higher Education – decision number DIR/WK/2016/19.Notes and references
- H. S. Kim, Y. J. Kim and Y. R. Seo, J. Cancer Prev., 2015, 20, 232–240 CrossRef PubMed.
- I. Mulyani, A. Levina and P. A. Lay, Angew. Chem., Int. Ed., 2004, 43, 4504–4507 CrossRef CAS PubMed.
- A. Levina and P. A. Lay, The Nutritional Biochemistry of Chromium (III), Elsevier, 2019, pp. 281–321 Search PubMed.
- J. K. Speetjens, R. A. Collins, J. B. Vincent and S. A. Woski, Chem. Res. Toxicol., 1999, 12, 483–487 Search PubMed.
- N. Farkas, M. Pesti and J. Belagyi, Biochim. Biophys. Acta, Biomembr., 2003, 1611, 217–222 CrossRef CAS PubMed.
- Z. Huang, X. Kuang, Z. Chen, Z. Fang, S. Wang and P. Shi, Curr. Microbiol., 2014, 68, 448–456 CrossRef CAS PubMed.
- V. Pandey, V. Dixit and R. Shyam, Protoplasma, 2009, 235, 49–55 CrossRef CAS.
- J. Alexander and J. Aaseth, Analyst, 1995, 120, 931–933 RSC.
- J. Das, A. Sarkar and P. C. Sil, Toxicol. Rep., 2015, 2, 600–608 CrossRef CAS PubMed.
- C. T. Dillon, P. A. Lay, A. M. Bonin, M. Cholewa and G. J. F. Legge, Chem. Res. Toxicol., 1998, 13, 742–748 Search PubMed.
- R. Saha, R. Nandi and B. Saha, J. Coord. Chem., 2011, 64, 1782–1806 CrossRef CAS.
- D. D. D. Hepburn, J. M. Burney, S. A. Woski and J. B. Vincent, Polyhedron, 2003, 22(3), 455–463 CrossRef CAS.
- K. R. Manygoats, M. Yazzie and D. M. Stearns, J. Biol. Inorg. Chem., 2002, 7, 791–798 CrossRef CAS PubMed.
- S. Chaudhary, J. Pinkston, M. M. Rabile and J. D. van Horn, J. Inorg. Biochem., 2005, 99, 787–794 CrossRef CAS PubMed.
- H. Espenson, Acc. Chem. Res., 1992, 25(5), 222–227 CrossRef.
- L. A. Barnes, B. Liu and R. Lindh, J. Chem. Phys., 1993, 98, 3978–3989 CrossRef CAS.
- J. Belagyi, M. Pas, P. Raspor, M. Pesti and T. P. Li, Biochim. Biophys. Acta, Biomembr., 1999, 1421, 175–182 CrossRef CAS PubMed.
- N. S. Raja, K. Sankaranarayanan, A. Dhathathreyan and B. U. Nair, Biochim. Biophys. Acta, Biomembr., 2011, 1808, 332–340 CrossRef CAS PubMed.
- A. Akbarzadeh, R. Rezaei-sadabady, S. Davaran, S. W. Joo and N. Zarghami, Nanoscale Res. Lett., 2013, 8, 1 CrossRef.
- A. Laouini, C. Jaafar-Maalej, I. Limayem-Blouza, S. Sfar, C. Charcosset and H. Fessi, J. Colloid Sci. Biotechnol., 2012, 1, 147–168 CrossRef CAS.
- V. L. C. Peetla and A. Stine, Mol. Pharm., 2009, 6, 1264–1276 CrossRef PubMed.
- J. M. Seddon, Biochim. Biophys. Acta, Rev. Biomembr., 1990, 1031, 1–69 CrossRef CAS PubMed.
- J. R. Silvius, Lipid-Protein Interactions, John Wiley & Sons, Inc., New York, 1982 Search PubMed.
- A. Raudino, M. Sarpietro and M. Pannuzzo, J. Pharm. BioAllied Sci., 2011, 3, 15–38 CrossRef CAS PubMed.
- D. C. Litzinger and L. Huang, Biochim. Biophys. Acta, Rev. Biomembr., 1992, 1113, 201–227 CrossRef CAS PubMed.
- J. H. Felgner, R. Kumar, C. N. Sridhar, C. J. Wheeler, Y. J. Tsai, R. Border, P. Ramsey, M. Martin and P. L. Felgner, J. Biol. Chem., 1994, 269, 2550–2561 CrossRef CAS.
- L. Ding, T. M. Weiss, G. Fragneto, W. Liu, L. Yang and H. W. Huang, Langmuir, 2005, 21, 203–210 CrossRef CAS PubMed.
- O. Dlouhý, I. Kurasová, V. Karlický, U. Javornik, P. Šket, N. Z. Petrova, S. B. Krumova, J. Plavec, B. Ughy, V. Špunda and G. Garab, Sci. Rep., 2020, 10, 1–13 CrossRef.
- M. F. Brown, Biochemistry, 2012, 51, 9782–9795 CrossRef CAS PubMed.
- C. C. Colpitts, A. V. Ustinov, R. F. Epand, R. M. Epand, V. A. Korshun and L. M. Schang, J. Virol., 2013, 87, 3640–3654 CrossRef CAS PubMed.
- H. Chakraborty, P. K. Tarafdar, M. J. Bruno, T. Sengupta and B. R. Lentz, Biophys. J., 2012, 102, 2751–2760 CrossRef CAS PubMed.
- R. Blumenthal, Curr. Top. Membr. Transp., 1987, 29, 203–254 CAS.
- J. M. Seddon, Biochim. Biophys. Acta, Rev. Biomembr., 1990, 1031, 1–69 CrossRef CAS PubMed.
- P. V. Escribá, A. Ozaita, C. Ribas, A. Miralles, E. Fodor, T. Farkas and J. A. García-Sevilla, Proc. Natl. Acad. Sci. U. S. A., 1997, 94, 11375–11380 CrossRef PubMed.
- K. Emoto and M. Umeda, Cell Struct. Funct., 2001, 26, 659–665 CrossRef CAS PubMed.
- J. Jouhet, Front. Plant Sci., 2013, 4, 494 Search PubMed.
- M. Vítová, V. Lanta, M. Čížková, M. Jakubec, F. Rise, Ø. Halskau, K. Bišová and S. Furse, Biochim. Biophys. Acta, Mol. Cell Biol. Lipids, 2021, 1866, 158965 CrossRef.
- B. Ughy, V. Karlický, O. Dlouhý, U. Javornik, Z. Materová, O. Zsiros, P. Šket, J. Plavec, V. Špunda and G. Garab, Physiol. Plant., 2019, 166, 278–287 CrossRef CAS PubMed.
- A. Jutila and P. K. J. Kinnunen, J. Phys. Chem. B, 1997, 101, 7635–7640 CrossRef CAS.
- P. Meleard, C. Gerbeaud, T. Pott, L. Fernandez-Puente, I. Bivas, M. D. Mitov, J. Dufourcq and P. Bothorel, Biophys. J., 1997, 72, 2616–2629 CrossRef CAS PubMed.
- S. J. Marrink and A. E. Mark, Biophys. J., 2004, 87, 3894–3900 CrossRef CAS PubMed.
- S. Tristram-Nagle, T. Moore, H. I. Petrache and J. F. Nagle, Biochim. Biophys. Acta, Biomembr., 1998, 1369, 19–33 CrossRef CAS PubMed.
- M. P. K. Frewein, M. Rumetshofer and G. Pabst, J. Appl. Crystallogr., 2019, 52, 403–414 CrossRef CAS.
- D. Long, L. Zou, M. Z. Hashmi, K. Cai, X. Tang, G. Chen and J. Shi, Chem. Eng. J., 2015, 280, 763–770 CrossRef CAS.
- N. G. Howlett and S. V Avery, Appl. Environ. Microbiol., 1997, 63, 2971–2976 CrossRef CAS.
- F. Henkler, J. Brinkmann and A. Luch, Cancers, 2010, 2, 376–396 CrossRef PubMed.
- S. Paula, A. G. Volkov, A. N. Van Hoek, T. H. Haines and D. W. Deamer, Biophys. J., 1996, 70, 339–348 CrossRef CAS PubMed.
- A. A. Gurtovenko and I. Vattulainen, J. Am. Chem. Soc., 2005, 127(50), 17570–17571 CrossRef CAS PubMed.
- F. Bordi, C. Cametti and A. Naglieri, Biophys. J., 1998, 74, 1358–1370 CrossRef CAS PubMed.
- P. Vanýsek, CRC Handbook of Chemistry and Physics, ed. J. Rumble, CRC Press, 98th edn, 2017, pp. 8-20–8-29 Search PubMed.
- J. Chappell, B. Chiswell and A. Canning, Talanta, 1998, 46, 23–38 CrossRef CAS PubMed.
- S. I. Dikalov, I. a Kirilyuk, M. Voinov and I. a Grigor’ev, Free Radical Res., 2011, 45, 417–430 CrossRef CAS PubMed.
- J. Y. Ong and J. Z. Torres, J. Biol. Chem., 2019, 294, 11382 CrossRef CAS PubMed.
- D. J. Tomkins and J. E. Sisken, Am. J. Hum. Genet., 1984, 36, 1332 CAS.
- D. Hanahan and R. A. Weinberg, Cell, 2011, 144, 646–674 CrossRef CAS PubMed.
- Z. Pietralik, R. Krzysztoń, W. Kida, W. Andrzejewska and M. Kozak, Int. J. Mol. Sci., 2013, 14(4), 7642–7659 CrossRef PubMed.
- H. Y. Shrivastava, T. Ravikumar, N. Shanmugasundaram, M. Babu and B. Unni Nair, Free Radical Biol. Med., 2005, 38, 58–69 CrossRef CAS.
- B. Ravel and M. Newville, J. Synchrotron Radiat., 2005, 12, 537–541 CrossRef CAS PubMed.
- A. Wisniewska and W. K. Subczynski, Biochim. Biophys. Acta, Biomembr., 1998, 1368, 235–246 CrossRef CAS PubMed.
Footnote |
| † Electronic supplementary information (ESI) available. See DOI: https://doi.org/10.1039/d2ra07851a |
| This journal is © The Royal Society of Chemistry 2023 |