
 Open Access Article
 This Open Access Article is licensed under a Creative Commons Attribution-Non Commercial 3.0 Unported Licence
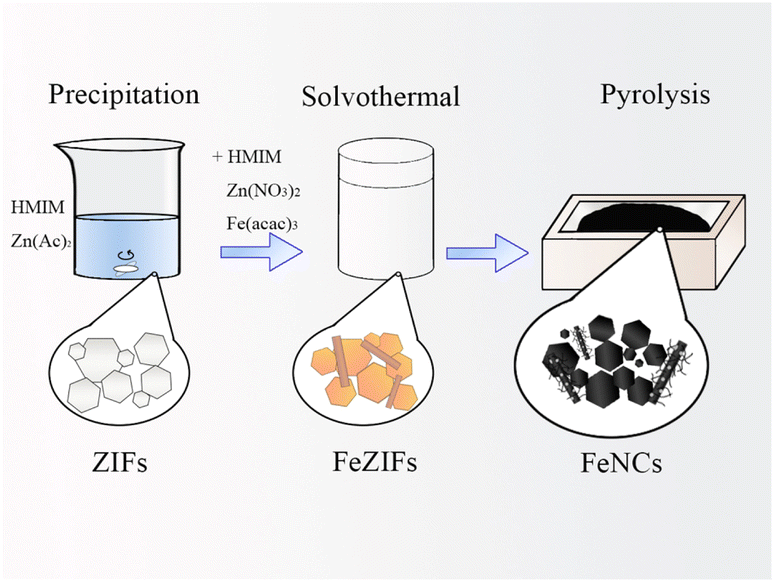
Synthesis of hierarchically structured Fe3C/CNTs composites in a FeNC matrix for use as efficient ORR electrocatalysts†
Tanlun Wanga,
Lincheng Xua,
Chenxiang Suna,
Xiyuan Lia,
Yong Yanb and
Fan Li *a
*a
aBeijing Key Laboratory for Catalysis and Separation, Department of Environment and Chemical Engineering, Beijing University of Technology, Beijing 100124, China. E-mail: vanadiumli@bjut.edu.cn
bBeijing Key Laboratory for Catalysis and Separation, Faculty of Environment and Life, Beijing University of Technology, Beijing 100124, China
First published on 26th January 2023
Abstract
Fe–N–C has a high number of FeNx active sites and has thus been regarded as a high-performance oxygen reduction reaction (ORR) catalyst, and combining Fe3C with Fe–N–C typically boosts ORR activity. However, the catalytic mechanism remains unknown, limiting further research and development. In this study, a precipitation-solvothermal process was used in conjunction with pyrolysis to produce a series of Fe–N–C catalysts derived from a zeolitic imidazolate framework (ZIF) that was composited with Fe3C. The prepared catalysts had a multiscale structure of ZIF-like carbon particles and rod-like structures, as well as bamboo-like carbon nanotubes (CNTs) and carbon layers wrapped with Fe3C particles while a series of studies revealed the origin of the rod-like structures and Fe3C phase. The hierarchical structure was beneficial to the enhanced electrocatalytic performance of catalysts for ORR. The optimal sample had the highest half-wave potential of 0.878 V vs. RHE, which was higher than that of commercial Pt/C (0.861 V vs. RHE). The ECSA of the optimal sample was 1.08 cm2 μg−1, with an electron transfer number close to 4, and functioning kinetics. The optimal sample exhibited high durability and methanol tolerance for the ORR. Finally, blocking different Fe active sites with coordination ions demonstrated that Fe(II) was the main active site, indicating that Fe3C primarily served as a cocatalyst to optimize the electron structure of Fe–N–C, thereby synergistically improving the ORR activity.
Introduction
The slow kinetics of the oxygen reduction reaction (ORR) in the cathodes of fuel cells (FCs) limits their applications.1,2 The most commonly used noble-metal-based catalyst exhibits the disadvantages of high cost, restricted storage, and methanol intolerance.3 Therefore, novel catalysts of nonprecious metals must be developed. The MNx site of a transition metal coordinated with N is considered a suitable active site for ORR catalysis, and nonprecious metals, which are inexpensive and offer the advantages of high activity and strong methanol tolerance, are usually selected as the active centres. Thus, MNx sites doped into a carbon framework to form a M–N–C structure have been extensively investigated and exploited as ORR catalysts while FeNx was regarded as having the most active sites in the literature.4–6One of the most common synthesis methods for Fe–N–C-based catalysts with FeNx sites is the carbonisation of metal organic framework (MOF)-based materials. This method can be used to not only synthesise M–N–C with abundant MNx sites originating from the coordinated structures of the metal and N of MOFs but also to obtain catalysts with high conductivities and different morphologies.7 And it is generally believed that inevitable sintering of active sites during pyrolysis can reduce the number of MNx sites and leads to the formation of metal particles.8,9 A decrease in the number of active sites has been reported to deteriorate catalyst performance.10,11 However, some other research discovered that metal particles, such as Fe particles, can react with carbon to produce Fe3C structures wrapped in carbon layers under heating; these particles have been considered as the ORR active sites and synergetically improve the activity of FeNx sites.12–14 Some researchers have employed chemical corrosion to remove and destroy particles containing Fe3C. A decrease in the half-wave potential was measured in these studies, indicating that the Fe3C particles generated through sintering promote the ORR activity of catalysts.15,16 Moreover, sintered transition metal particles can catalyse the synthesis of carbon nanotubes (CNTs), a conductive material that can enhance the performance of electrocatalysts.17–19 Thus, it is worthy to prepare and research a kind of catalyst by pyrolysis method with hierarchical structure of carbon, carbon wrapped Fe3C (maybe with CNTs or other structures).
Zeolitic imidazolate frameworks (ZIFs) are MOFs that are commonly used as pyrolysis precursors because of facile synthesis, abundant pores, a high nitrogen content, a simple design, tuneable morphology, and suitable components.20,21 ZIFs have been synthesised with various morphologies, such as sheets,22 core shells,23 pores,24 and spheres,25 and composited with other materials,26,27 indicating the potential for synthesizing diverse ZIF-derived catalysts with MNx sites, which is considered as a promising choice to investigate the above hierarchical structure. On the other hand, the morphology of one-dimensional (1D) rod- and fibre-like carbon materials affords a short mass transfer distance and intrinsic conductive network structures, providing a continuous transfer route for electrons and reaction precursors during electrocatalysis.28,29 The introduction of 1D structure to the hierarchical catalyst can reduce the negative effect of sintering and improve the performance. A research combined ZIFs on polyacrylonitrile (PAN) fibres by electrostatic spinning to produce a catalyst with 1D morphology after pyrolysis.30 However, the catalyst exhibited low ORR activity. The PAN binder changed the pore structure of the ZIFs, which may have caused this low activity, indicating electrostatic spinning synthesize 1D carbon materials had negative effect to the hierarchical structure and innovative synthesis methods should be considered. Therefore, a multilevel structure based on 1D materials and ZIF derivatives with an optimal composition can be synthesized that combines the advantages of the individual components, resulting in enhanced ORR activity.
In this study, a precipitation-solvothermal method was combined with pyrolysis to synthesise ZIF-derived Fe–N–C-based catalysts with hierarchical structure, and the synthesis conditions were subsequently screened and optimised to prepare high-performing catalysts. An analysis of the catalysts morphology indicated the presence of an Fe3C phase, and a 1D rod-like structure was synthesised using ZIFs. A comparative analysis of the phases and morphologies of the catalysts was performed to elucidate the formation mechanism for the phase and morphology of the optimised samples. The optimised samples exhibited high durability, methanol tolerance, fast kinetics and a higher half-wave potential than commercial Pt/C. An inhibition method was designed to identify the active Fe species. Fe(CN)63− and SCN− were added to block Fe(II) and Fe(III) sites, respectively. The decrease in the half-wave potential upon addition of the blocking ions demonstrated that Fe(II) was the main active site. The excellent performance of catalysts might be attribute to the specific structure and synergetic effect of Fe3C combined with Fe(II).
Experimental section
Chemicals
Fe(acac)3 (98%, Shanghai Aladdin), Zn(NO3)2·6H2O (99%, YiLi Fine Chemicals), Zn(Ac)2·2H2O (99%, YiLi Fine Chemicals), 2-methylimidazole (98%, Shanghai Aladdin), methanol (>99.5%, Tianjin DaMao), N,N-dimethylformamide (>99.5%, Tianjin DaMao), KOH (95%, Macklin), KSCN (98%, Heowns), K3Fe(CN)6 (>99.5%, Sinopharm Chemical Regents), Nafion (5%, Sigma).All the chemicals were of AR grade and used as received without further purification. And commercial 20 wt% Pt/C electrocatalyst was supplied by Sigma Aldrich.
Synthesis of catalyst
 | ||
| Scheme 1 Synthesis of the FeNC sample. | ||
FeZIF-2-xFe (200 mg) was annealed by being heated to 900 °C at a heating rate of 5 °C min−1 and maintained at 900 °C for 3 h under an argon gas flow. The resulting sample was labelled FeNC-2-xFe.
Characterization methods
The phase identification of the prepared samples was performed with X-ray diffraction (XRD, SmartLab 3) at the scan rate of 10° per min from 5° to 80° and confocal laser microscopy Raman spectroscopy (Raman, Renishaw) from 900 cm−1 to 2000 cm−1. The morphology of samples were investigated by scanning electron microscopy (SEM, JSM-7900) and transmission electron microscopy (TEM, JEM-2100F). And valence states were analysed by X-ray photoelectron spectroscopy (XPS, ESCALAB 250Xi) with an Al Kα radiation source. The composition of elements was analysed by an inductively coupled plasma optical emission spectrometer (ICP-OES, Optima8300).Electrochemical methods
Electrochemical measurements were performed using a three-electrode system consisting of working, counter, and reference electrodes. The working electrode was a glassy carbon rotating disk electrode (RDE, Pine AFMSRCE); the counter electrode was a graphite carbon rod; the reference electrode was a Hg/HgO electrode in 0.1 M KOH; and the test system was immersed in a 0.1 M KOH electrolyte. Cyclic voltammetry (CV), linear sweep voltammetry (LSV), and chronoamperometry (CA) experiments were performed.The slurry was typically prepared by dissolving 6 mg of the FeNC powder sample (or 2 mg of commercial Pt/C) in 1 mL of ethanol and 0.5 mL of 0.2% Nafion dissolved in ethanol under ultrasonic dispersion for 10 min. A microsyringe was used to deposit 20 μL of the slurry on the glassy carbon electrode, and the slurry was allowed to dry.
A chronoamperometry (CA) test was performed using a 10 × 10 mm piece of glassy carbon as the working electrode. A volume of 200 μL of the aforementioned slurry was added dropwise to both sides of the working electrode.
All data in this work were given without iR-correction and all potentials were calibrated with reference to reversible hydrogen electrode (RHE).
Results and discussion
Phase and morphology analysis
Fig. 1 shows SEM images of FeZIF-2-0.5Fe and FeNC-2-0.5Fe. FeZIF-2-0.5Fe consisted of generally uniform ZIF particles (Fig. 1(a)). This morphology was almost unchanged upon subjecting the FeNC-2-0.5Fe sample to heat treatment (Fig. 1(b)). The statistics of the particle size distribution of these samples are shown in Fig. S1.† The average particle size was 2.04 ± 0.01 μm for FeZIF-2-0.5Fe and 1.44 ± 0.01 μm for FeNC-2-0.5Fe, which indicated that these samples had a uniform particle size distribution. The average particle size of FeNC-2-0.5Fe was slightly smaller than that of FeZIF-2-0.5Fe. This phenomenon was also observed in our previous study31 and was attributed to decomposition and oxidation of particles during pyrolysis, which resulted in a loss of mass and volume. A few rod-like structures were also observed in the FeZIF-2-0.5Fe sample (Fig. 1(c)). The EDS-mapping result demonstrated that the main elements in the rod-like structure were Fe and O, which would be consistent with the presence of iron oxide (Fig. 1(e)). However, the XRD pattern of FeZIF-2-0.5Fe exhibited similar peaks to those of the XRD pattern of ZIF-8, which did not contain any additional components (Fig. S2†). Thus, the rod-like structure was suggested to correspond to amorphous iron oxide. The morphology of the rod-like structure after pyrolysis was shown in Fig. 1(d). Pyrolysis resulted in a roughening of the rod surfaces. Particles were observed on the rod surface, indicating that the heat treatment caused sample sintering. CNTs were also observed, which may have been synthesized by the catalysis of sintered particles.18,32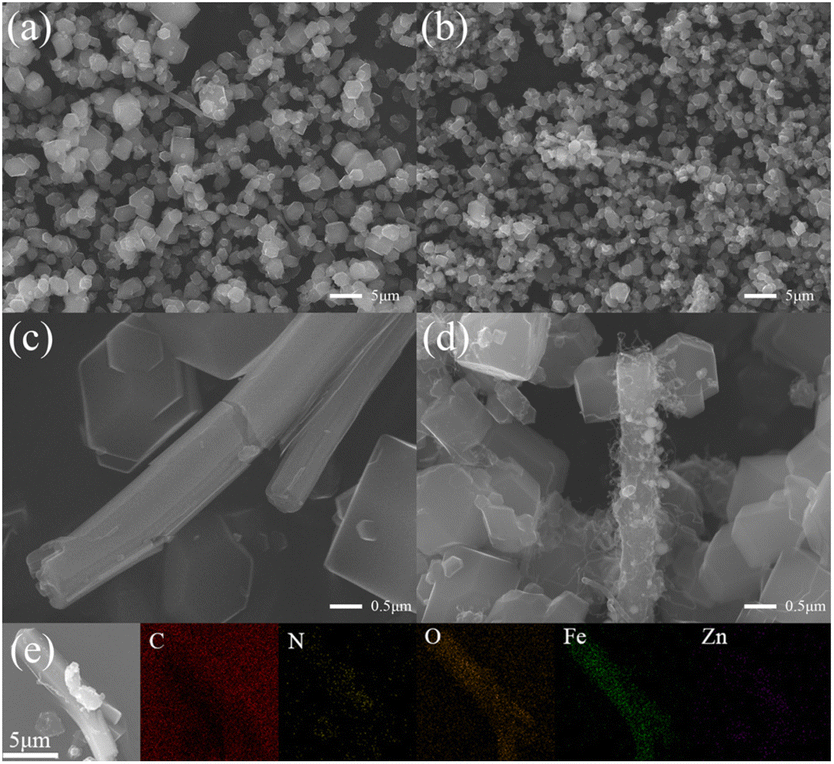 | ||
| Fig. 1 SEM images of FeZIF-2-0.5Fe (a, c) and FeNC-2-0.5Fe (b, d) and (e) EDS-mapping images of FeZIF-2-0.5Fe. | ||
Characterization experiments were performed to investigate the synthesis process of the FeNC-2-0.5Fe sample. The morphology of the intermediators of FeZIF/NC-2-NO3, FeZIF/NC-2-Ac and FeZIF/NC-1-Ac were characterized by SEM (Fig. S3†). Fig. S3(a)† shows that a few ZIF-like structures were observed in the FeZIF-2-NO3 sample (which was prepared using only Zn(NO3)2), and a similar morphology was observed for FeNC-2-NO3 (Fig. S3(d)†) with no rod-like structures. FeZIF-2-Ac consisted of both ZIFs and rods. Unlike FeZIF-2-0.5Fe, large ZIF particles and a large number of rods were observed for FeNC-2-Ac (Fig. S3(e)†). By comparison, FeZIF-1-Ac consisted of both rods and ZIFs (Fig. S3(c)†), and sintering was more noticeable in the sample (Fig. S3(f)†). Combining the results presented above shows that the rod-like structure only formed under addition of zinc acetate, because this structure was not observed in FeZIF/NC-2-NO3; the ZIF morphology was not discernible in FeZIF/NC-2-NO3, which may have resulted from unfavourable synthesis conditions based on using only zinc nitrate as a precursor and led to the low crystallinity of the obtained samples, indicating that zinc acetate facilitates the formation of ZIF. Therefore, the morphology of FeZIF/NC-2-0.5Fe can be tuned by varying the type of zinc salt added.
Fig. S4† shows the XRD patterns of the samples. Except the graphitic carbon peaks at the 2theta of 25°, FeNC-2-0.4Fe and FeNC-2-0.45Fe clearly consisted of Fe and Fe3C phases with a small quantity of Fe2O3 (Fig. S4(a)†), which indicated that some Fe3C also formed during the pyrolysis process, along with the sintering of Fe particles. The Fe2O3 phase may have been generated during the cooling stage. Eqn (1) shows that ΔfGθm decreases as the temperature decreases, showing that this reaction should occur based on thermodynamics. Thus, the Fe particles that were not in contact with carbon tended to be oxidized to Fe2O3 by the O2 formed by the residual O species from the organic or metal salt precursors.33
2Fe(s) + 3/2O2(g) ⇌ Fe2O3(s) ΔfGθm = −815![[thin space (1/6-em)]](https://www.rsc.org/images/entities/char_2009.gif) 023 + 251.12T 023 + 251.12T
| (1) |
Although the XRD patterns of FeNC-2-0.5Fe and FeNC-2-0.55Fe did not exhibit discernible peaks of Fe and Fe3C, considering the results for the entire series of samples led to the speculation that Fe and Fe3C phases may have been present in the samples. The low peak intensity may have resulted from the low crystallinity or limited Fe3C content of the samples. The XRD patterns of FeNC-2-NO3, FeNC-2-Ac, and FeNC-1-Ac are compared in Fig. S4(b).† There was no discernible crystalline phase for FeNC-2-NO3, which was typical for the FeNC samples synthesized only with Zn(NO3)2.10,31 This result indicated that it was not easy to synthesize the mixed phase of Fe, Fe3C and Fe2O3 using only Zn(NO3)2 as the zinc-containing precursor. Fe and Fe3C peaks were clearly observed in the XRD pattern of FeNC-2-Ac, indicating a higher content for these phases in FeNC-2-Ac than FeNC-2-xFe. However, the main phases in FeNC-1-Ac were Fe and Fe2O3, with a small quantity of Fe3C, which indicated that an FeNC catalyst containing a Fe3C phase could not be synthesised by the direct solvothermal-pyrolysis method. Some studies have shown that a considerably higher temperature is required to synthesize Fe3C by solid-phase reactions than by gas-phase reactions typically occurring on the surface of materials,34–37 which suggests that the two-step synthesis method was more effective for surface enrichment of the Fe species than the direct solvothermal-pyrolysis method, which resulted in the Fe species being randomly distributed between the bulk and surface. The surface Fe species promoted the formation of the Fe3C phase in the gas-phase reaction along with the generation of CO or CO2 at high temperatures, which was the main reason why the Fe3C phase formed in FeNC-2-xFe and FeNC-2-Ac and not in FeNC-1-Ac. Thus, a two-step synthesis method was necessary to synthesize the highly active Fe3C species for ORR electrocatalysis.
Fig. S5† shows the Raman spectra of FeNC-2-0.45Fe, 0.5Fe, 0.55Fe, and NC-2. The two broad peaks at approximately 1340 cm−1 and 1580 cm−1 were assigned to the D- and G-bands of the C component, which were attributed to disordered carbon with many defects and ordered sp2 graphitic carbon, respectively. The intensity ratios of the D- and G-bands were used to characterise the defects in these materials. The ID/IG ratio was 1.15 in NC-2, 1.12 in FeNC-2-0.45Fe, 1.16 in FeNC-2-0.5Fe and 1.18 in FeNC-2-0.55Fe. The ID/IG ratio ratios were higher for FeNC-2-0.5Fe and FeNC-2-0.55Fe than NC-2, indicating that Fe doping might increase the number of defects that formed in the sample, whereas N dopants changed the local structure of the carbon skeleton, which enhanced the ORR activity.38,39 By contrast, the low ID/IG ratio for FeNC-2-0.45Fe may have been caused by the heterogeneity of the pyrolyzed FeNC samples.
The microstructure of FeNC-2-0.5Fe was further investigated by TEM. Fig. 2(a) shows FeNC-2-0.5Fe had a rod-like structure. Many CNTs grew on the rods, some particles formed inside the rods, and some broken CNTs were observed in the red area shown in the figure. The presence of CNTs may have enhanced the conductivity of these samples. An enlarged image of a CNT is shown in Fig. 2(b). The CNTs were multiwalled with a wall thickness was 2–5 nm, where each wall was made of sections. This phenomenon has also been reported for bamboo-like carbon nanotubes (b-CNTs)40 prepared by the catalysis of Fe particles during heating treatment. The interplanar spacing for the particles wrapped in multiple layers of graphitic carbon (Fig. 2(c) and (d)) matched the Fe3C lattice distance of the (2 2 1) plane, indicating the presence of the Fe3C component. The EDS-mapping results (Fig. 2(e)) show that the main elements in the rod-like structure were C and Fe with small quantities of N, O and Zn. The C distribution was homogeneous, whereas that of Fe was concentrated in spherical regions, in agreement with the presence of particles inside the rod-like structures and indicating that Fe was the main element in the sintered particles. Combined with SEM results, the morphology of the catalyst was a hierarchical structure of carbon particles, rod-like carbon, b-CNTs and carbon layers wrapped with Fe3C particles.
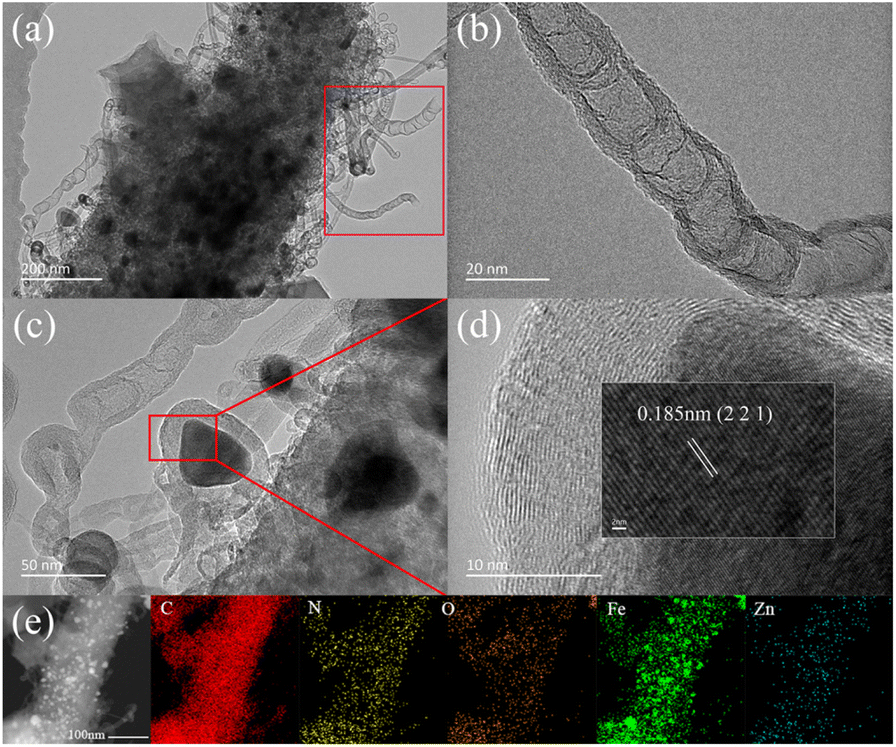 | ||
| Fig. 2 TEM images of FeNC-2-0.5Fe (a–c); HR-TEM image of FeNC-2-0.5Fe, where the lattice distance corresponds to that in PDF#35-0772; (d) HAADF-STEM and (e) EDS-mapping images of FeNC-2-0.5Fe. | ||
The XPS results for FeNC-2-0.45Fe, 0.5Fe and 0.55Fe are shown in Fig. 3. The XPS spectrum for Fe 2p in Fig. 3(a–c) can be divided into Fe3C 2p3/2 (∼708.4 eV), Fe2+ 2p3/2 (∼710.4 eV), Fe3+ 2p3/2 (∼713.0 eV), Fe3C 2p1/2 (∼721.3 eV), Fe2+ 2p1/2 (∼723.4 eV), and Fe3+ 2p1/2 (∼726.0 eV). The Fe3C peaks were split, except for Fe in the +2 and +3 valence states. Peaks corresponding to the Fe–C bond were also observed in the C 1s spectrum (Fig. 3(g–i)) at ∼283.9 eV, which further confirmed the presence of Fe3C in the catalysts. Peaks corresponding to the M–N bond (M = Fe and Zn) were also observed in the N 1s spectrum at ∼398.5 eV (Fig. 3(d–f)), indicating covalent bonds between metal (Fe, Zn) and N atoms. Peaks for C–N bonds appeared in the spectrum of C 1s shown in Fig. 3(g–i), which suggested that the Fe–N–C structure derived from Fe ZIFs may have persisted in the catalyst. Graphitic N peaks were also observed in the N 1s spectrum (Fig. 3(d–f)), indicating that N atoms had been doped into the carbon skeleton, which may have promoted the ORR activity.41,42
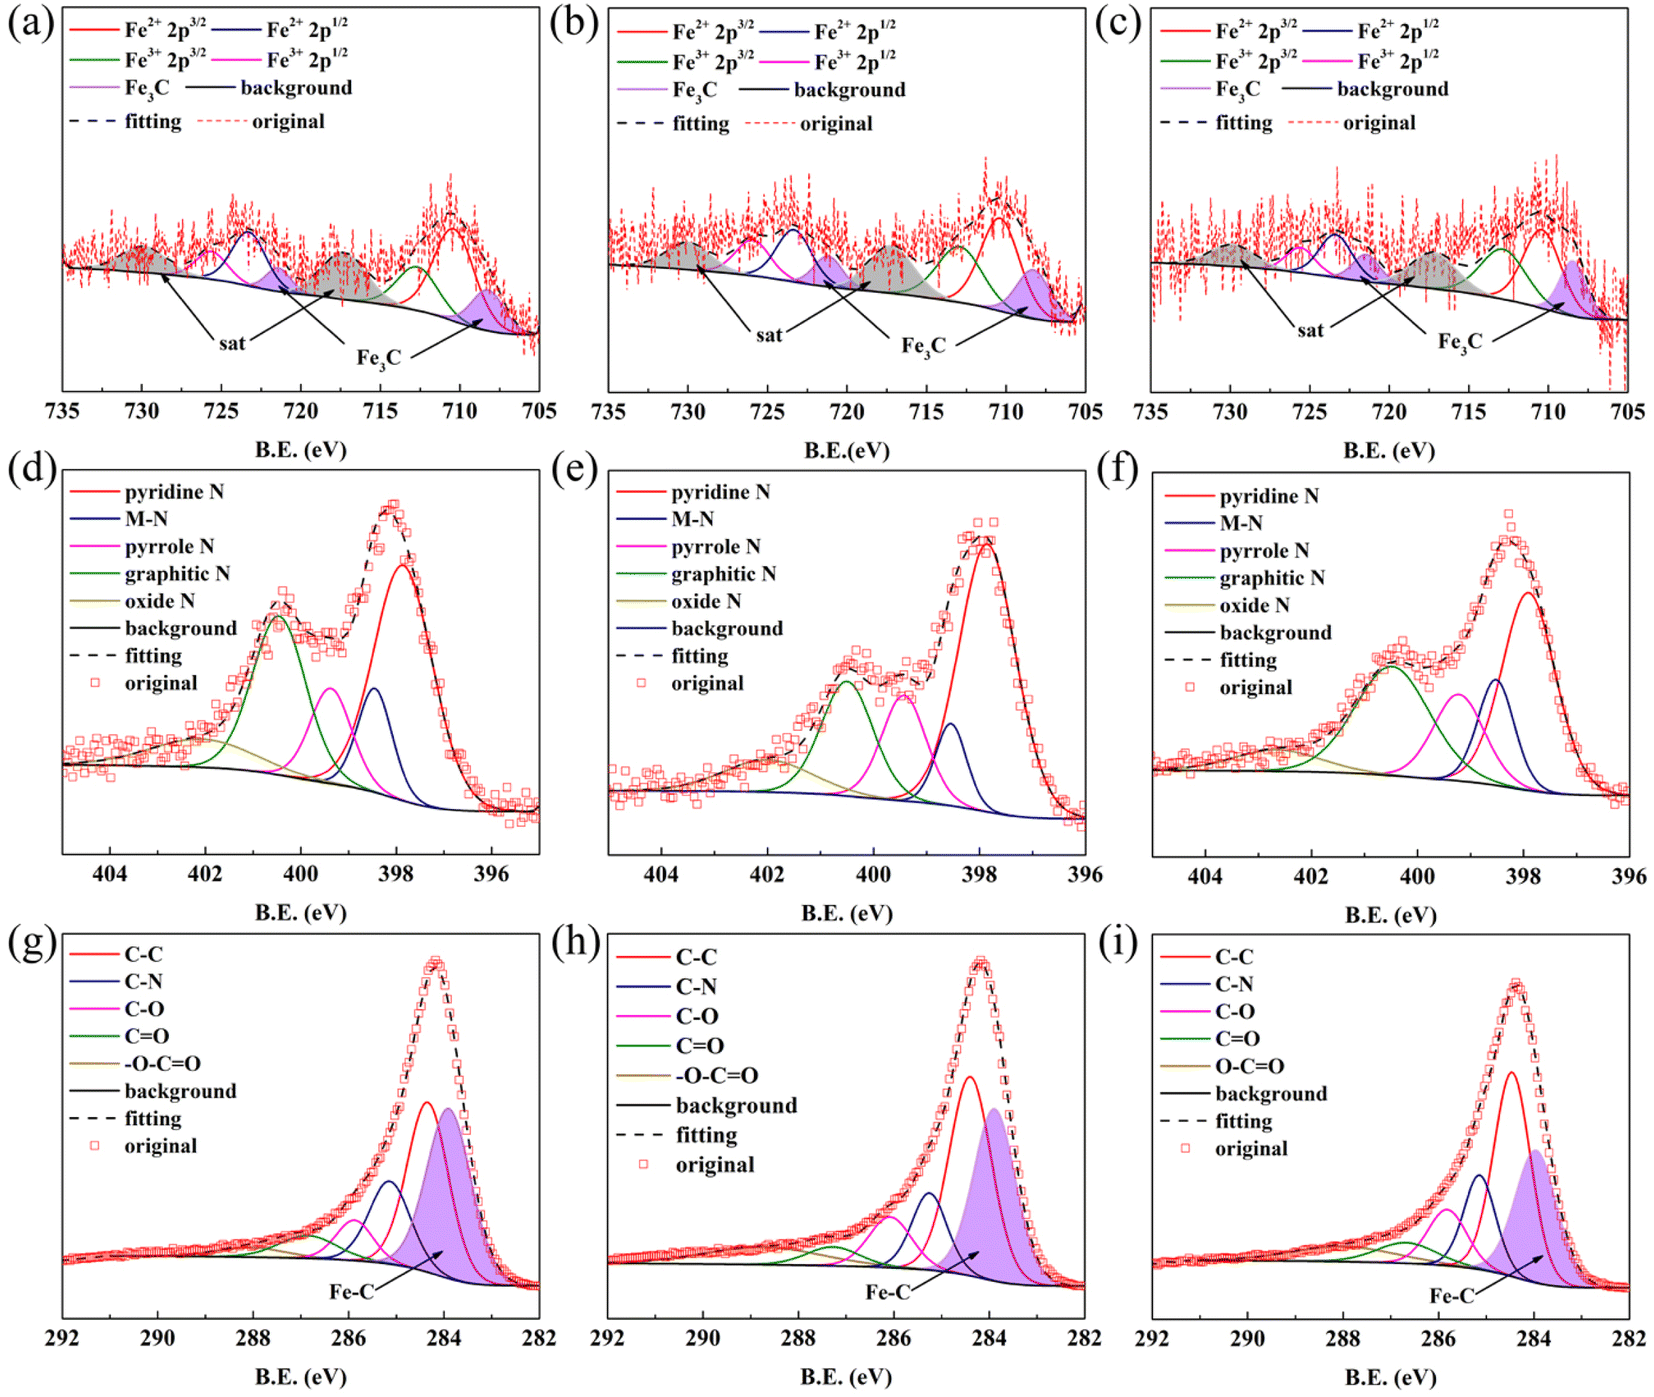 | ||
| Fig. 3 XPS patterns for FeNC-2-0.45Fe, 0.5Fe, 0.55Fe: (a–c) Fe 2p; (d–f) N 1s; and (g–i) C 1s. | ||
Thus, the XRD results indicated the presence of metallic Fe, which however was not detected in the XPS spectrum. It was proposed that Fe was formed in the bulk of the catalyst instead of on the surface. The Fe atomic ratios measured by XPS and ICP-OES are shown in Table S1.† A lower Fe atomic ratio was measured by XPS than by ICP-OES, which proved that most of the Fe particles were located in the bulk. As mentioned above, the formation temperature of Fe3C was lower in the gas-phase reaction than in the solid-phase reaction. The Fe that formed on the surface of the catalyst at high temperatures reacted more easily with carbon oxide to form Fe3C in the gas phase than in the solid phase, leading to a low content of the Fe phase on the surface. Combining this result with the XPS results suggests that the main Fe species was Fe3C on the surface but elemental Fe in the bulk.
Electrochemical properties and analysis
The screening result is shown in Fig. S6.† The overall optimal dosage considering both the half-wave potential and limiting current density was 4 mmol of Zn(Ac)2, 2 mmol of Zn(NO3)2, and 24 mmol/8 mmol of HMIM ratio (Fig. S6(a–c)†). FeNC-2-0.5Fe was selected as the optimal catalyst because the half-wave potential did not change upon increasing the Fe dosage from 0.45 mmol to 0.55 mmol, between which the 0.5 mmol dosage of Fe was an intermediate value (Fig. S6(d)†). The LSV curves of the different FeNC/NC samples and commercial Pt/C are shown in Fig. 4(a). FeNC-2-0.5Fe had the highest half-wave potential of 0.878 V vs. RHE, which was higher than that of Pt/C (0.861 V vs. RHE). By comparison, the half-wave potentials of FeNC-1-Ac, FeNC-2-NO3 and FeNC-2-Ac were lower, demonstrating limited activity for samples produced using a single zinc salt, due to the disadvantages of carbon particles with average sizes that were excessively large and small and the absence of the Fe3C phase.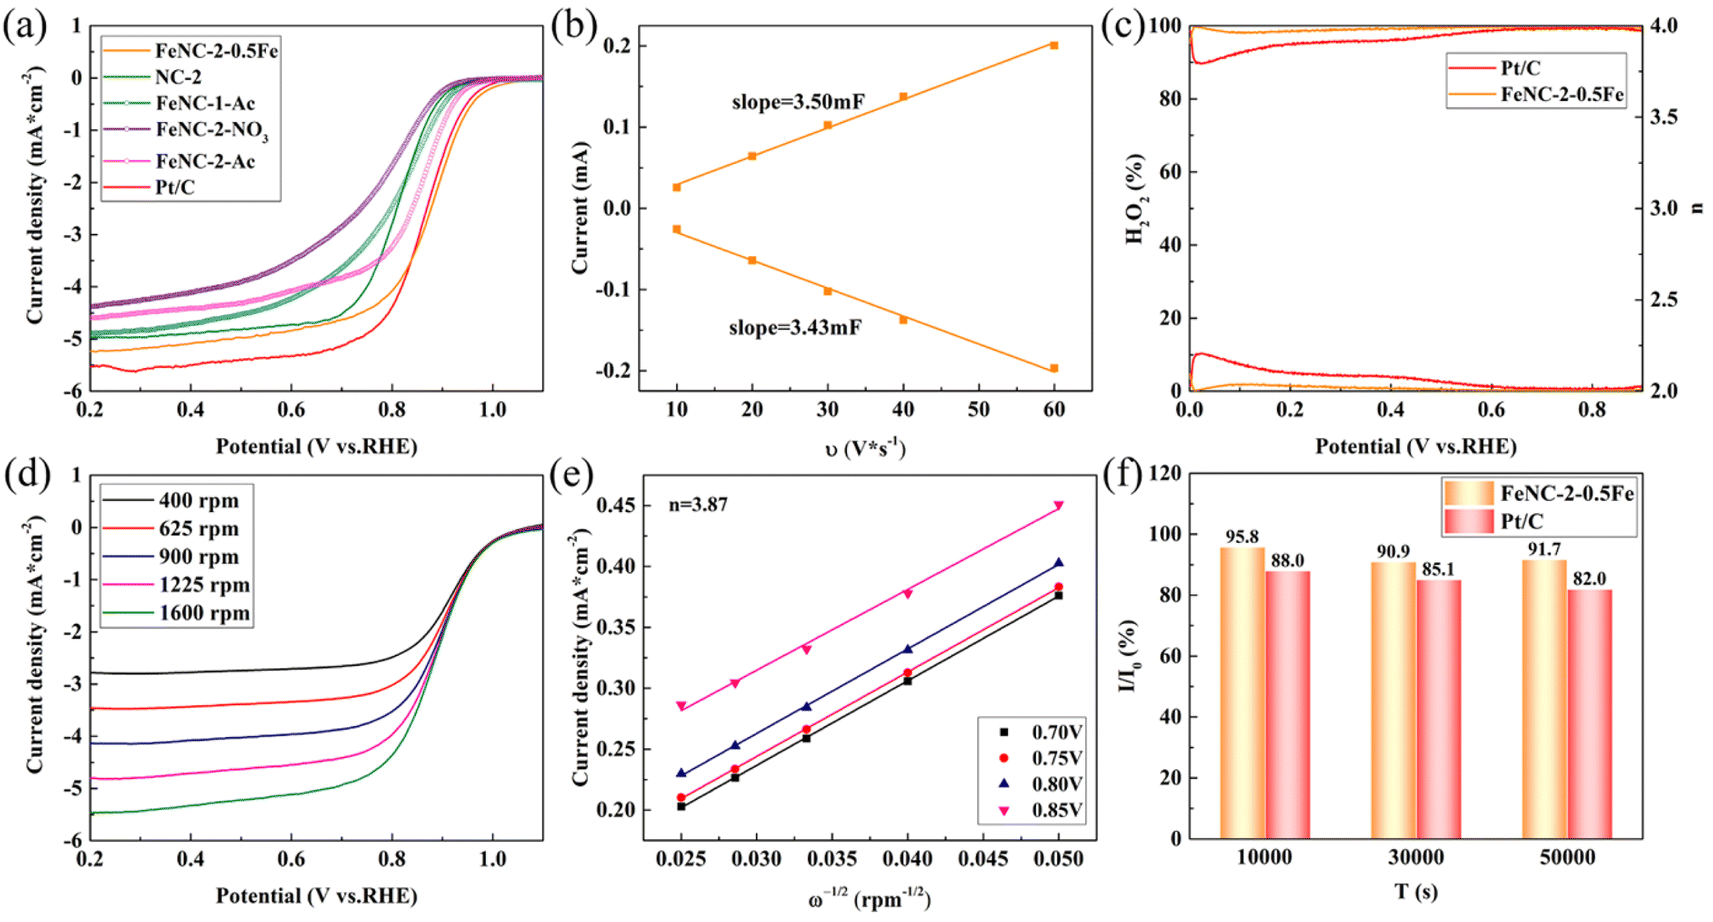 | ||
| Fig. 4 (a) LSV curves of different catalysts in a 0.1 M O2-saturated KOH solution at 1600 rpm. (b) The fitted ECSA for FeNC-2-0.5Fe. (c) Productivity of H2O2 and electron transfer numbers of FeNC-2-0.5Fe and Pt/C. (d) LSV curves of FeNC-2-0.5Fe at different rotating speeds. (e) FeNC-2-0.5Fe data fit with the K–L equation. (f) The histogram of the current attenuation rate for FeNC-2-0.5Fe and Pt/C during the CA test. | ||
The fitted ECSA for FeNC-2-0.5Fe is shown in Fig. 4(b) and S7.† The calculated ECSA of 1.08 cm2 μg−1 indicated the synthesized catalyst had a large area. The RRDE results of FeNC-2-0.5Fe and Pt/C are shown in Fig. 4(c). The yield of H2O2 was lower than that of Pt/C and less than 10%, whereas the electron transfer number was close to 4. Fig. 4(d and e) shows that fitting the FeNC-2-0.5Fe data using the K–L equation for resulted in a calculated average electron transfer number of 3.87, which proved that the electrocatalysis process mainly proceeded with 4 electrons. Tafel plots of FeNC-2-0.45Fe, 0.5Fe, 0.55Fe, NC-2 and Pt/C are shown in Fig. S8.† Unlike the results for NC-2, the Tafel slope of FeNC-2-0.55Fe was higher than that of Pt/C because the addition of Fe caused the Tafel slope to increase. The Tafel slope for FeNC-2-0.5Fe was 132.1 mV dec−1, which was slightly lower than that of Pt/C, indicating faster ORR kinetics. The increase in the Tafel slope with the Fe dosage indicated that the presence of excess Fe slowed the kinetics down, although the half-wave potential was not noticeably changed.
The CA curves of FeNC-2-0.5Fe and Pt/C are shown in Fig. S9(a),† and the histograms of the current attenuation rates at 10000 s, 30000 s, and 50000 s are shown in Fig. 4(f). The current density ratios for FeNc-2-0.5Fe were 95.8%, 90.9%, and 91.7% for 10000 s, 30000 s and 50000 s, respectively. The current at 50000 s was slightly higher than that at 30000 s, and the histogram of selected 100 points within ±3000 s (Fig. S9(b–d)†) also support this result, indicating some reconstruction ability for FeNc-2-0.5Fe, which helped preserve the activity. The current density ratio for Pt/C at 50000 s was 82.0%, which was considerably lower than that of FeNC-2-0.5Fe, indicating FeNC-2-0.5Fe was more durable than Pt/C. Fig. S10† shows TEM images of FeNC-2-0.5Fe obtained after the CA test. There was no noticeable change in the morphology of the rod-like structures and carbon particles (Fig. S10(a and b)†), which proved that the basic structures of the catalyst were not affected by the long-term CA test. The EDS map of the rod-like structures of FeNC-2-0.5Fe is shown in Fig. S11.† Compared with the corresponding EDS map before the CA test (Fig. 2(e)), the distribution of O was more concentrated, indicating partial oxidation of the catalyst after the long-term ORR test. The distribution of Fe was more concentrated, and the particles were larger, indicating Ostwald ripening occurred during the CA test. Although there were no noticeable structural differences before and after the test, there were changes in the elemental distributions.
The tolerance of the catalysts to typical reagents was investigated. The effect of methanol on the ORR activity of FeNC-2-0.5Fe is shown in Fig. 5(a). The half-wave potential decreased to 30 mV upon addition of 3 M methanol (Fig. 5(d)). Whereas Pt/C was completely poisoned (Fig. S12†), there was a negligible decrease in the half-wave potential for FeNC-2-0.5Fe, indicating a high methanol tolerance.
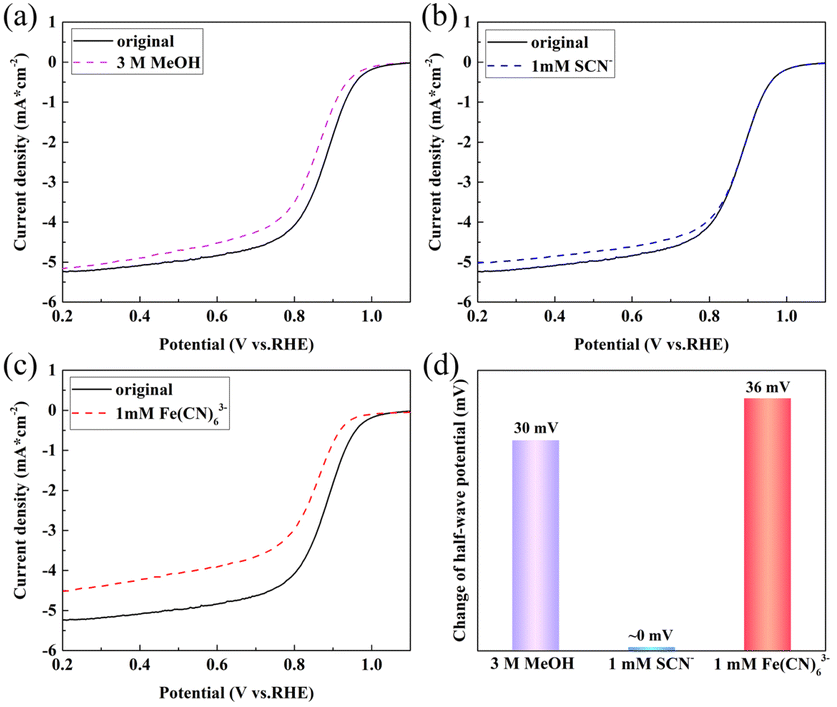 | ||
| Fig. 5 LSV curves for FeNC-24 in a 0.1 M O2-saturated KOH solution at 1600 rpm with (a) 3 M methanol, (b) 1 mM SCN−, and (c) 1 mM Fe(CN)63−; (d) histogram of the change in the half-wave potential. | ||
In a previous study, we added coordination ions as inhibiting reagents to identify the active Fe species of the FeNC catalyst for the ORR.31 The typical coordination ion SCN− was used to block Fe(III) species, and Fe(CN)63− was selected to block Fe(II). The XPS spectrum for Fe in FeNC-2-0.5Fe demonstrated the presence of Fe(II) and Fe(III); thus, the XPS and HR-TEM results proved that Fe3C was the catalyst component that was necessary for ORR activity. Thus, this inhibition method was employed in this study to identify the active Fe species. The results are shown in Fig. 5(b and c), and the change in half-wave potential is shown in Fig. 5(d). The decrease in the half-wave potential was almost zero upon addition of SCN− and 36 mV upon addition of Fe(CN)63−. The disparity proved that Fe(II) was the active Fe species. In addition, the Fe3C particles wrapped in carbon layers enhanced the electronic structure and activity of the active site, which promoted the activity at the Fe(II) sites and resulted in a high ORR activity.15,43–45
Conclusions
In this study, a two-step precipitation-solvothermal method was designed to synthesize FeZIF precursors, which were then pyrolysed to synthesize FeNC catalysts. The morphology of the synthesized FeZIF consisted of carbon particles with rod-like structures. The FeNC samples retained these morphologies, and bamboo-like CNTs were generated by the catalysis of sintered Fe particles during heat treatment. A comparative analysis of SEM images of the prepared samples showed that the formation of the rod-like structures resulted from the addition of zinc acetate and ferric acetylacetonate. The presence of Fe3C was identified from the lattice spacing determined by XRD, XPS and HR-TEM. Fe3C was generated by the addition of Fe salt during the solvothermal step. Electrochemical measurements demonstrated that the FeNC sample FeNC-2-0.5Fe had the highest half-wave potential of 0.878 V vs. RHE, which was higher than that of commercial Pt/C (0.861 V vs. RHE). The ECSA was 1.08 cm2 μg−1, and the electron transfer number approached 4. A CA test demonstrated that FeNC-2-0.5Fe was more durable than Pt/C, and there were no discernible differences in the basic morphology before and after the CA test; FeNC-2-0.5Fe also exhibited higher tolerance to methanol than Pt/C. An inhibition test using coordination ions proved that the active species was Fe(II), indicating that Fe3C acted as a cocatalyst that enhanced the electron structure of FeNx-doped carbon. Thus, the high ORR activity resulted from the hierarchical structure and synergistic action of Fe3C and Fe(II) of catalysts.Conflicts of interest
There are no conflicts to declare.Acknowledgements
This work was financially supported by the National Natural Science Foundation of China (NSFC 52074016).References
- R. Raza, N. Akram, M. S. Javed, A. Rafique, K. Ullah, A. Ali, M. Slaeem and R. Ahmed, Renewable Sustainable Energy Rev., 2016, 53, 450–461 CrossRef.
- K. Jiao, J. Xuan, Q. Du, Z. Bao, B. Xie, B. Wang, Y. Zhao, L. Fan, H. Wang, Z. Hou, S. Hu, N. P. Brandon, Y. Yin and M. D. Guiver, Nature, 2021, 595, 361–369 CrossRef CAS PubMed.
- R. Vinodh, R. Atchudan, H. J. Kim and M. Yi, Polymers, 2022, 14, 300 CrossRef CAS PubMed.
- X. Zhang, S. Zhang, Y. Yang, L. Wang, Z. Mu, H. Zhu, X. Zhu, H. Xia, B. Huang, J. Li, S. Guo and E. Wang, Adv. Mater., 2020, 32, 1906905 CrossRef CAS PubMed.
- S. Stariha, K. Artyushkova, M. J. Workman, A. Serov, S. Mckinney, B. Halevi and P. Atanassov, J. Power Sources, 2016, 326, 43–49 CrossRef CAS.
- X. Wang, Y. Jia, X. Mao, D. Liu, W. He, J. Li, J. Liu, X. Yan, J. Chen, L. Song, A. Du and X. Yao, Adv. Mater., 2020, 32, 2000966 CrossRef CAS PubMed.
- J. Han, J. Bian and C. Sun, Research, 2020, 2020, 9512763 CAS.
- C. Zhao, J. Liu, J. Wang, C. Wang, X. Guo, X. Li, X. Chen, L. Song, B. Li and Q. Zhang, Sci. Adv., 2022, 8, eabn5091 CrossRef CAS PubMed.
- P. Peng, L. Shi, F. Huo, C. Mi, X. Wu, S. Zhang and Z. Xiang, Sci. Adv., 2019, 5, eaaw2322 CrossRef CAS PubMed.
- Y. Chen, S. Ji, Y. Wang, J. Dong, W. Chen, Z. Li, R. Shen, L. Zheng, Z. Zhaung, D. Wang and Y. Li, Angew. Chem., 2017, 129, 7041–7045 CrossRef.
- J. Xie, B. Li, H. Peng, Y. Song, J. Li, Z. Zhang and Q. Zhang, Angew. Chem., 2019, 131, 5017–5021 CrossRef.
- W. She, Q. Xie, Y. Huang, C. Xie, X. Zhang, M. Sun, F. Wang and J. Xiao, ACS Appl. Mater. Interfaces, 2020, 12, 28065–28074 CrossRef CAS PubMed.
- M. Xiao, J. Zhu, L. Feng, C. Liu and W. Xing, Adv. Mater., 2015, 27, 2521–2527 CrossRef CAS PubMed.
- G. Li, J. Zhang, W. Li, K. Fan and C. Xu, Nanoscale, 2018, 10, 9252–9260 RSC.
- W. Jiang, L. Gu, L. Li, Y. Zhang, X. Zhang, L. Zhang, J. Wang, J. Hu, Z. Wei and L. Wan, J. Am. Chem. Soc., 2016, 138, 3570–3578 CrossRef CAS PubMed.
- L. Luo, Y. Xu, D. Wang, W. Feng and X. Qiu, Inorg. Chem., 2022, 61, 3166–3175 CrossRef CAS PubMed.
- J. Ren, L. Chen, Y. Wang, W. Tian, L. Gao and Z. Yuan, ACS Sustainable Chem. Eng., 2019, 8, 223–237 CrossRef.
- K. Sheng, Q. Yi, A. Chen, Y. Wang, Y. Yan, H. Nie and X. Zhou, ACS Appl. Mater. Interfaces, 2021, 13, 45394–45405 CrossRef CAS PubMed.
- X. Chen, N. Wang, K. Shen, Y. Xie, Y. Tan and Y. Li, ACS Appl. Mater. Interfaces, 2019, 11, 25976–25985 CrossRef CAS PubMed.
- A. Radwan, H. Jin, D. He and S. Mu, Nano-Micro Lett., 2021, 13, 1–32 Search PubMed.
- H. Wang, L. Chen, H. Pang, S. Kaskel and Q. Xu, Chem. Soc. Rev., 2020, 49, 1414–1448 RSC.
- H. Park, S. Oh, S. Lee, S. Choi and M. Oh, Appl. Catal., B, 2019, 246, 322–329 CrossRef CAS.
- J. Tang, R. Salunkhe, J. Liu, N. Torad, M. Imura, S. Furukawa and Y. Yamauchi, J. Am. Chem. Soc., 2015, 137, 1572–1580 CrossRef CAS PubMed.
- Z. Zhu, H. Yin, Y. Wang, C. Chuang, L. Xing, M. Dong, Y. Lu, G. Casillas-Garcia, Y. Zheng, S. Chen, Y. Dou, P. Liu, Q. Cheng and H. Zhao, Adv. Mater., 2020, 32, 2004670 CrossRef CAS PubMed.
- P. Li, X. Qi, L. Zhao, J. Wang, M. Wang, M. Shao, J. Chen, R. Wu and Z. Wei, J. Mater. Chem. A, 2022, 10, 5925–5929 RSC.
- X. Chen, L. Ma, W. Su, L. Ding, H. Zhu and H. Yang, Electrochim. Acta, 2020, 331, 135273 CrossRef CAS.
- W. Zhu, Y. Pei, J. C. Douglin, J. Zhang, H. Zhao, J. Xue, Q. Wang, R. Li, Y. Qin, Y. Yin, D. R. Dekel and M. D. Guiver, Appl. Catal., B, 2021, 299, 120656 CrossRef CAS.
- M. Kim, D. H. Nam, H. Y. Park, C. Kwon, K. Eom, S. Yoo, J. Jang, H. Kim, E. Cho and H. Kwon, J. Mater. Chem. A, 2015, 3, 14284–14290 RSC.
- C. Li, M. Wu and R. Liu, Appl. Catal., B, 2019, 244, 150–158 CrossRef CAS.
- Q. Li, J. Zhao, M. Wu, C. Li, L. Han and R. Liu, ChemistrySelect, 2019, 4, 722–728 CrossRef CAS.
- T. Wang, C. Sun, Y. Yan and F. Li, RSC Adv., 2022, 12, 9543–9549 RSC.
- H. Gong, X. Zheng, K. Zeng, B. Yang, X. Liang, L. Li, Y. Tao and R. Yang, Carbon, 2021, 174, 475–483 CrossRef CAS.
- Y. Rao, Stoichiometry and thermodynamics of metallurgical processes, CUP Archive, 1985 Search PubMed.
- P. Duwez and S. Lin, J. Appl. Phys., 1967, 38, 4096–4097 CrossRef CAS.
- A. Tsuzuki, S. Sago, S. Hirano and S. Naka, J. Mater. Sci., 1984, 19, 2513–2518 CrossRef CAS.
- G. Yi, X. Zhang, F. Liu, J. Cheng, Y. Mi and H. Zhang, in 2006 1st IEEE International Conference on Nano/Micro Engineered and Molecular Systems, 2006, pp. 649–652 Search PubMed.
- H. Ni, D. Cang and J. Jiang, Acta Metall. Sin., 2001, 280–284 CAS.
- Z. Liu, Y. Zhu, K. Xiao, Y. Xu, Y. Peng, J. Liu and X. Chen, ACS Appl. Mater. Interfaces, 2021, 13, 24710–24722 CrossRef CAS PubMed.
- J. Huo, L. Lu, Z. Shen, Y. Liu, J. Guo, Q. Liu, Y. Wang, H. Liu, M. Wu and G. Wang, J. Mater. Chem. A, 2020, 8, 16271–16282 RSC.
- W. Yang, X. Liu, X. Yue, J. Jia and S. Guo, J. Am. Chem. Soc., 2015, 137, 1436–1439 CrossRef CAS PubMed.
- J. Han, X. Meng, L. Lu, J. Bian, Z. Li and C. Sun, Adv. Funct. Mater., 2019, 29, 1808872 CrossRef CAS.
- J. Zhu, H. Zhou, C. Zhang, J. Zhang and S. Mu, Nanoscale, 2017, 9, 13257–13263 RSC.
- Z. Liu, F. Guo, L. Han, J. Xiao, X. Zeng, C. Zhang, P. Dong, M. Li and Y. Zhang, ACS Appl. Mater. Interfaces, 2022, 14, 13280–13294 CrossRef CAS PubMed.
- G. Li, J. Zhang, W. Li, K. Fan and C. Xu, Nanoscale, 2018, 10, 9252–9260 RSC.
- M. Xiao, J. Zhu, L. Feng, C. Liu and W. Xing, Adv. Mater., 2015, 27, 2521–2527 CrossRef CAS PubMed.
Footnote |
| † Electronic supplementary information (ESI) available. See DOI: https://doi.org/10.1039/d2ra07848a |
| This journal is © The Royal Society of Chemistry 2023 |