DOI:
10.1039/D2RA07701A
(Paper)
RSC Adv., 2023,
13, 3377-3393
Summerfield scaling model and electrical conductivity study for understanding transport mechanisms of a Cr3+ substituted ZnAl2O4 ceramic
Received
2nd December 2022
, Accepted 17th January 2023
First published on 23rd January 2023
Abstract
Solid-state and sol–gel procedures were used to prepare ZnAl1.95Cr0.05O4 nanocrystal spinels. From the results obtained by X-ray diffraction (XRD) and transmission electron microscopy (TEM), it can be concluded that the samples prepared by sol–gel synthesis are better crystallized than the ones resulting from the solid-state method. Studies by spectroscopy of impedance were done in function of frequency (40–107 Hz) and temperature (540–680 K) in the sample prepared by sol–gel synthesis. The electrical conductivity spectra obey Jonscher's law and two models were observed studying the variation of the exponent ‘s’ as a function of temperature, Correlated Barrier Hopping (CBH) and Non-overlapping Small Polaron Tunnelling (NSPT). The predominant conduction mechanism is bipolaron hopping. The scaling behavior of conductivity spectra was checked by Summerfield scaling laws. The time–temperature superposition principle (TTSP) points to a common transport mechanism working for the low and middle frequency ranges. The scaling mechanism fails in the high-frequency ranges suggesting that conduction dynamics, and the usual hopping distance of mobile species, have changed. The values obtained for the activation energy from the hopping frequency, conductivity σdc, bulk resistance Rgb, and relaxation (fmax), in the temperature range of 540–680 K, are very close. A higher and negative temperature coefficient of resistivity (TCR coefficient) equal to −2.7% K−1 is found at 560 K. This result shows that our compound is suitable for uncooled infrared bolometric applications and infrared detectors.
1. Introduction
The aluminum-based spinels, such as ZnAl2O4, are fascinating oxide ceramics with considerable technological uses. They can be employed as transparent conductors, electric and optical materials due to their large bandgap semiconductor properties (3.8 eV).1,2 Zinc aluminate spinels ZnAl2O4, having the formula AB2O4 (where A is a metal cation occupying a Td site and B is an Al occupying an Oh site), crystallize in the cubic crystal structure with the space group Fd![[3 with combining macron]](https://www.rsc.org/images/entities/char_0033_0304.gif) m. They have fascinating characteristics due to their wide bandgap and cationic inversions.3 The anions (oxygens) are placed in the cubic sites, while the Al and Zn cations occupy octahedral (AlO6) and tetrahedral (ZnO4) sites, respectively.4,5 The transition ions of the first series with 3dn electron arrangement (n = 1 to 10) have been successfully incorporated into these spinels where they improve the quality of the physical properties. The rational synthesis of ZnAl2O4 nanocrystals doped with transition ions (Cr3+, Co2+, …) with sizes ranging from 1 to 100 nm has received a lot of interest in recent decades. These novel properties, as well as the applications that derive from them, are related to the geometric parameters of size and shape.6 Scientists have proposed numerous synthetic routes to prepare ZnAl2O4 spinels so far, including the following routes: solid-state,7–9 sol–gel,10 combustion,11 ceramic,12 and solution-phase.13,14 The physical properties of these substances are heavily influenced by particle size and preparation methods. It has been discovered that ZnAl2O4 nanoparticles have a large specific surface area, which has a substantial impact on their high performance.15,16 Many studies deal with the physical and structural properties of ZnAl2O4 spinel doped with Cr3+ and synthesized by different methods.17,18 The insertion of trivalent Cr3+ on Al3+ sites result in a large range of forbidden energy bands and dielectric parameters. In a variety of materials, the low-cost transition metal ion Cr3+ is commonly utilized as a luminous activator or sensitizer. On this account, it has been the subject of numerous optical spectroscopy and luminescence studies.19,20 Recently, several research teams have made significant efforts in the synthesis and characterization of various spinel materials incorporating Cr3+ activating ions.21–23 The insertion of small quantities of Cr3+ has a significant impact on the electrical properties of compounds. We have highlighted the important role of Cr3+ incorporation in decreasing activation energy, increasing charge carrier density, and decreasing cation separation distance justified by the analysis of conductivity, XRD and impedance measurements. Therefore, the incorporation of Cr3+ into the material leads to a reduction in the lattice parameters. As a result, the distance between the cations was reduced, causing a reduction in the barrier inhibiting the transport process, and then a decrease in the activation energy of the material.24 Spinel aluminate doped with Cr3+ could be a potential candidate for optoelectronic devices such as spin and ultraviolet photonic devices, light-emitting diodes, photodetectors and magneto-optical devices thanks to its transparency and electrically conductive properties. ZnAl2O4 can be used as a host lattice for Cr3+ ions due to its many benefits, including superior chemical, thermal, and quantum yields. In the literature, Lahouli et al.25 and Devan et al.26 have shown that the grain boundaries of nanostructured materials play an important role in their transport and their dielectric properties. The microstructure is formed of conductive grains separated by resistive grain boundaries. Undoubtedly, such behavior will affect the dielectric and conductivity properties of the system. In the present work, the solid-state preparation method, which requires higher annealing temperatures, induces changes in various parameters such as number, intra-grain distance and grain size. The increase in the annealing temperature leads to an increase in grain size and consequently a decrease in the grain boundary, which improves the electrical conductivity of the system studied. Increasing the annealing temperature reduces the phenomenon of resistivity which is due to the increase in the mobility of charge carriers or the decrease in the average energy of the barriers of potential.25 The benefits of the sol–gel method do not require high temperatures, so there are many smaller grain sizes with better resistivity and higher activation energy.
m. They have fascinating characteristics due to their wide bandgap and cationic inversions.3 The anions (oxygens) are placed in the cubic sites, while the Al and Zn cations occupy octahedral (AlO6) and tetrahedral (ZnO4) sites, respectively.4,5 The transition ions of the first series with 3dn electron arrangement (n = 1 to 10) have been successfully incorporated into these spinels where they improve the quality of the physical properties. The rational synthesis of ZnAl2O4 nanocrystals doped with transition ions (Cr3+, Co2+, …) with sizes ranging from 1 to 100 nm has received a lot of interest in recent decades. These novel properties, as well as the applications that derive from them, are related to the geometric parameters of size and shape.6 Scientists have proposed numerous synthetic routes to prepare ZnAl2O4 spinels so far, including the following routes: solid-state,7–9 sol–gel,10 combustion,11 ceramic,12 and solution-phase.13,14 The physical properties of these substances are heavily influenced by particle size and preparation methods. It has been discovered that ZnAl2O4 nanoparticles have a large specific surface area, which has a substantial impact on their high performance.15,16 Many studies deal with the physical and structural properties of ZnAl2O4 spinel doped with Cr3+ and synthesized by different methods.17,18 The insertion of trivalent Cr3+ on Al3+ sites result in a large range of forbidden energy bands and dielectric parameters. In a variety of materials, the low-cost transition metal ion Cr3+ is commonly utilized as a luminous activator or sensitizer. On this account, it has been the subject of numerous optical spectroscopy and luminescence studies.19,20 Recently, several research teams have made significant efforts in the synthesis and characterization of various spinel materials incorporating Cr3+ activating ions.21–23 The insertion of small quantities of Cr3+ has a significant impact on the electrical properties of compounds. We have highlighted the important role of Cr3+ incorporation in decreasing activation energy, increasing charge carrier density, and decreasing cation separation distance justified by the analysis of conductivity, XRD and impedance measurements. Therefore, the incorporation of Cr3+ into the material leads to a reduction in the lattice parameters. As a result, the distance between the cations was reduced, causing a reduction in the barrier inhibiting the transport process, and then a decrease in the activation energy of the material.24 Spinel aluminate doped with Cr3+ could be a potential candidate for optoelectronic devices such as spin and ultraviolet photonic devices, light-emitting diodes, photodetectors and magneto-optical devices thanks to its transparency and electrically conductive properties. ZnAl2O4 can be used as a host lattice for Cr3+ ions due to its many benefits, including superior chemical, thermal, and quantum yields. In the literature, Lahouli et al.25 and Devan et al.26 have shown that the grain boundaries of nanostructured materials play an important role in their transport and their dielectric properties. The microstructure is formed of conductive grains separated by resistive grain boundaries. Undoubtedly, such behavior will affect the dielectric and conductivity properties of the system. In the present work, the solid-state preparation method, which requires higher annealing temperatures, induces changes in various parameters such as number, intra-grain distance and grain size. The increase in the annealing temperature leads to an increase in grain size and consequently a decrease in the grain boundary, which improves the electrical conductivity of the system studied. Increasing the annealing temperature reduces the phenomenon of resistivity which is due to the increase in the mobility of charge carriers or the decrease in the average energy of the barriers of potential.25 The benefits of the sol–gel method do not require high temperatures, so there are many smaller grain sizes with better resistivity and higher activation energy.
The unique properties of the zinc aluminate ZnAl2O4 spinel makes it a microwave dielectric ceramic. Because of its low tangent loss, low dielectric permittivity, and high conductivity, zinc aluminate-based silicon nanomaterial is excellent for microwave applications.18 The undoped ZnAl2O4 spinel ceramics, produced by solid-state reaction, were examined in the frequency range of 1 Hz to 1 MHz and at temperatures ranging from 300 °C to 700 °C for dielectric study by spectroscopy of complex impedance.18 Aiming to better understand the role of divalent cations (Zn and Mg) affecting the structure and the electrical and optical properties of Mg-doped ZnAl2O4, Y. Li et al. prepared those compounds by the microwave-assisted sol–gel combustion method.27 These kinds of optoelectronic studies will persuade scientists and engineers in maturing the development of miniaturized devices.
The objective of this investigation is to study the effect of nanoparticles on the dielectric properties of the ZnAl2O4 compound doped with a small percentage of Cr3+. Indeed, the effects of grain size on electrical conductivity have been experimentally evaluated by R. N. Aljawfi et al.28
This work initially aims to study the effect of the preparation method on the structure and morphology of ZnAl1.95Cr0.05O4. The two methods used are the well-known sol–gel and the solid-state methods. Secondly, the electrical properties of the nanocrystalline ZnAl1.95Cr0.05O4 prepared by sol–gel were studied. The analysis of the conductivity in the frequency range of 40–107 Hz and the temperature range of 540–680 K, made it possible to determine the models governing the electrical behavior of our material. This study also reports the evolution of the complex impedance (Z′, Z′′) and of the modulus with temperature and frequency. To our knowledge, this is the first study concerned with the determination of electrical properties of such spinel.
2. Experimental
The ZnAl1.95Cr0.05O4 nanoparticles were produced using the sol–gel and solid-state methods. First, various precursors were weighed in stoichiometric proportions to obtain the desired composition. All the chemical reactants in this work were purchased from Sigma-Aldrich. For the sol–gel procedure, Zn(NO3)2·6H2O (zinc nitrate, ≥98% pure), Al(NO3)3·9H2O (aluminum nitrate, ≥98% pure), Cr(NO3)3·6H2O (chromium nitrate, ≥99% pure), ethylene glycol and citric acid formed a solution in distilled water. It was then continually agitated at 80 °C to remove surplus water and to produce a gel. The gel was heated to 300 °C. Finally, the powder samples were grounded and pressed into pellets with 1 to 2 mm of thickness and a diameter of 8 mm, and then annealed at 700 °C for 30 min (Fig. 1a).
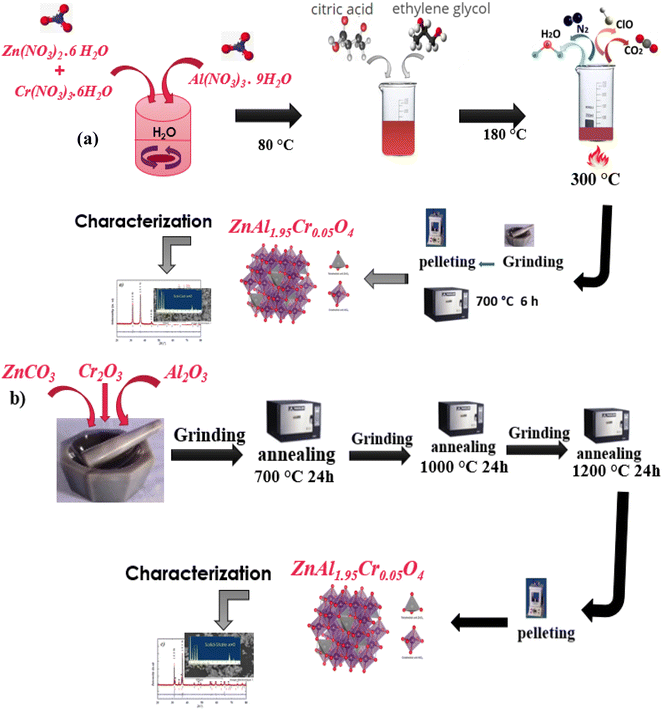 |
| | Fig. 1 (a) Sol–gel procedure schema, (b) solid–solid procedure schema. | |
For the solid-state preparation, zinc carbonate [ZnCO3, ≥99%], chromium(III) oxide [Cr2O3, ≥98%] and aluminum oxide [Al2O3, ≥98%] were used. The mixture was continuously grounded and annealed, first at 700 °C for 24 h, and then at 1000 °C for 24 h. The powders, pressed in the form of pellets with a thickness of the order of 1 to 2 mm and a diameter of 8 mm, were annealed for 24 hours at 1200 °C (Fig. 1b).
The obtained samples were studied by several techniques. The X-ray Powder Diffractometer (Bruker D8 Advance) was used to determine the crystal structure using CuKα radiation (λ = 1.5406 Å) in the 2θ range of 20–80°. The XRD patterns were used to calculate the unit cell parameters through the Fullprof program and Rietveld refinement. The TEM images were taken using a high-resolution transmission electron microscope FEI Tecnai G2 with an accelerating voltage of 200 kV. To obtain ohmic contact for the electric measurements, two thin coatings of silver were applied on both sides of the developed pellets. The measurements were done using an impedance analyzer approach (determination of permittivity and capacity from 100 Hz to 1 MHz) in the frequency range 40–107 Hz and in the temperature range of 540 to 680 K. The samples were placed in a cryostat (Janis VPF 800) to change the temperature. Conductance and capacitance measurements were performed using an Agilent 4294 A module.
3. Results and discussion
3.1. Structural and morphological studies
The registered X-Ray Diffraction (XRD) patterns of the ZnAl1.95Cr0.05O4 spinel are illustrated in Fig. 2a and b. The diffraction peaks located at 2θ values, for the samples obtained by sol–gel and solid-state routes, were indexed as 31.288° (220), 36.859° (311), 44.818° (400), 49.111° (331), 55.67° (422), 59.368 (511) and 65.251° (440) diffraction lines. The XRD peaks have been indexed using the standard JCPDS data file [JCPDS file COD 96-154-2145] for the cubic ZnAl2O4![[thin space (1/6-em)]](https://www.rsc.org/images/entities/char_2009.gif) :5% Cr3+. The analysis of the XRD pattern of ZnAl1.95Cr0.05O4 confirms the cubic spinel structure, with a small amount of ZnO impurity, being <5% and >14% in the case of the sol–gel and the solid-state preparation, respectively. The same impurity is also found in previous studies.15,29,30 The XRD data was refined with Fullprof software, revealing that the samples crystallize in a cubic structure with the Fdm space group. As illustrated in Fig. 2c, the anions (oxygen) construct the cubic framework, whereas the cations (Zn and Al) reside in octahedral (O) and tetrahedral (R) coordinated sites. Half of the octahedral sites and one-eighth of the tetrahedral sites are filled, giving a total of 8 units per cube cell [(Zn)8(Al)16O32]. The positions of ions in relation to the origin can be described in the following way using Wyckoff notation: [T at 8a], [R at 16d], and [O at 32e]. Natural spinels (called order/normal spinels) have divalent cations (Zn2+) in tetrahedral sites and trivalent cations (Al3+) in octahedral sites, respectively.31 The incorporated Cr3+ in the crystal structure, substitutes either Zn2+ or Al3+ sites. The transition ion Cr3+ is known by a high octahedral site preference energy32–35, indicating that the Cr3+ (ionic radius = 0.61 Å) ion replaces the Al3+ (ionic radius = 0.53 Å) ion occupying a site of Oh symmetry. The CrO6 octahedra are slightly distorted and have D3d trigonal symmetry. This slight distortion does not affect the physical properties and can be neglected.4,36,37
:5% Cr3+. The analysis of the XRD pattern of ZnAl1.95Cr0.05O4 confirms the cubic spinel structure, with a small amount of ZnO impurity, being <5% and >14% in the case of the sol–gel and the solid-state preparation, respectively. The same impurity is also found in previous studies.15,29,30 The XRD data was refined with Fullprof software, revealing that the samples crystallize in a cubic structure with the Fdm space group. As illustrated in Fig. 2c, the anions (oxygen) construct the cubic framework, whereas the cations (Zn and Al) reside in octahedral (O) and tetrahedral (R) coordinated sites. Half of the octahedral sites and one-eighth of the tetrahedral sites are filled, giving a total of 8 units per cube cell [(Zn)8(Al)16O32]. The positions of ions in relation to the origin can be described in the following way using Wyckoff notation: [T at 8a], [R at 16d], and [O at 32e]. Natural spinels (called order/normal spinels) have divalent cations (Zn2+) in tetrahedral sites and trivalent cations (Al3+) in octahedral sites, respectively.31 The incorporated Cr3+ in the crystal structure, substitutes either Zn2+ or Al3+ sites. The transition ion Cr3+ is known by a high octahedral site preference energy32–35, indicating that the Cr3+ (ionic radius = 0.61 Å) ion replaces the Al3+ (ionic radius = 0.53 Å) ion occupying a site of Oh symmetry. The CrO6 octahedra are slightly distorted and have D3d trigonal symmetry. This slight distortion does not affect the physical properties and can be neglected.4,36,37
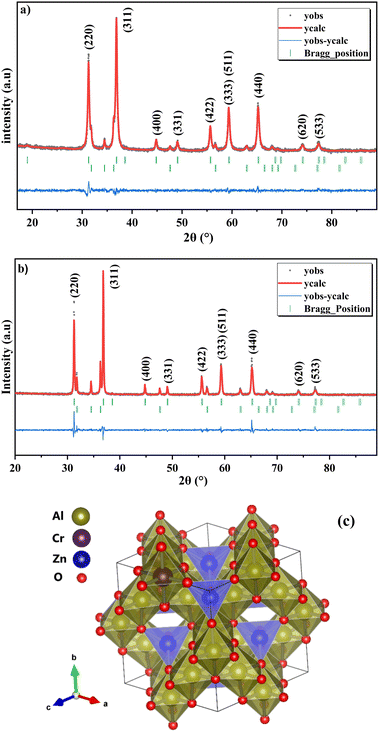 |
| | Fig. 2 Rietveld refinement for the ZnAl1.95Cr0.05O4 sample (a) prepared with sol–gel method (b) prepared with the solid-state method and (c) structural illustration with Vesta software, of the ZnAl1.95Cr0.05O4 spinel composed of ZnO tetrahedra (green) and AlO6 octahedra (blue). | |
The reliability factors Rwp, Rp and the goodness-of-fit factor χ2 is shown in Table 1. The results found for (χ2) shows the good quality of fit and indicates that the obtained sample is of high quality specifically in the case of the sol–gel preparation method.
Table 1 Structural parameters obtained from the analysis of XRD data for ZnAl1.95Cr0.05O4 spinels prepared by both methods
| Sample ZnAl1.95Cr0.05O4 |
Sol–gel method |
Solid-state method |
| Space group |
Fdm |
|
| Crystal system |
Cubic |
|
| aR (Å) |
8.087(5) |
8.091(4) |
| Cell volume (Å3) |
528.981 |
529.757 |
| a (Å) |
8.087(6) |
8.091(6) |
| a0 (Å) |
8.087(7) |
8.091(7) |
| Vexp (Å3) |
529.010(8) |
529.801(9) |
| dhkl (Å) |
2.44 |
2.438(4) |
| χ2 |
1.07 |
2.28 |
| Rp |
2.85 |
4.00 |
| Rwp |
3.64 |
5.39 |
| Fract (%) (ZnAl2O4) |
95.01 |
86.61 |
| Fract (%) (ZnO) |
4.99 |
13.39 |
| LA (nm) |
3.501(9) |
3.503(7) |
| LB (nm) |
2.859(3) |
2.860(7) |
| ρth (g cm−3) |
4.637(3) |
4.630(5) |
| ρexp (g cm−3) |
2.739(2) |
3.129(6) |
| P (%) |
40.931(1) |
32.413(3) |
| Crystallite size DW–H (nm) |
21 |
60 |
| S (m2 g−1) |
61.612(2) |
21.961(9) |
| δ (10−4 nm−2) |
22.675(7) |
2.872(7) |
We estimated several structural parameters in order to better understand the structural qualities.
The inter-reticular distance values, determined from Bragg's law, for the two preparation methods are shown in Table 1 for the most intense peak corresponding to (311). The incorporation of Cr in this spinel causes the distortion of the CrO6 octahedron. This distortion is induced by the divergence of angles and bond lengths between atoms and causes the lattice strain.
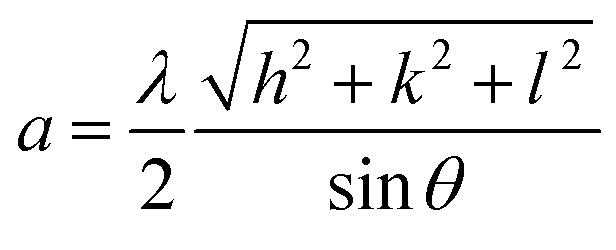
The experimental lattice parameter a is calculated from the following equation38:
| |
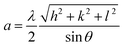 | (1) |
with (
hkl) being the Miller indices.
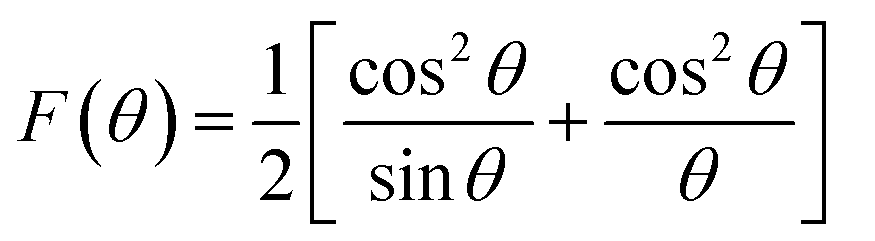
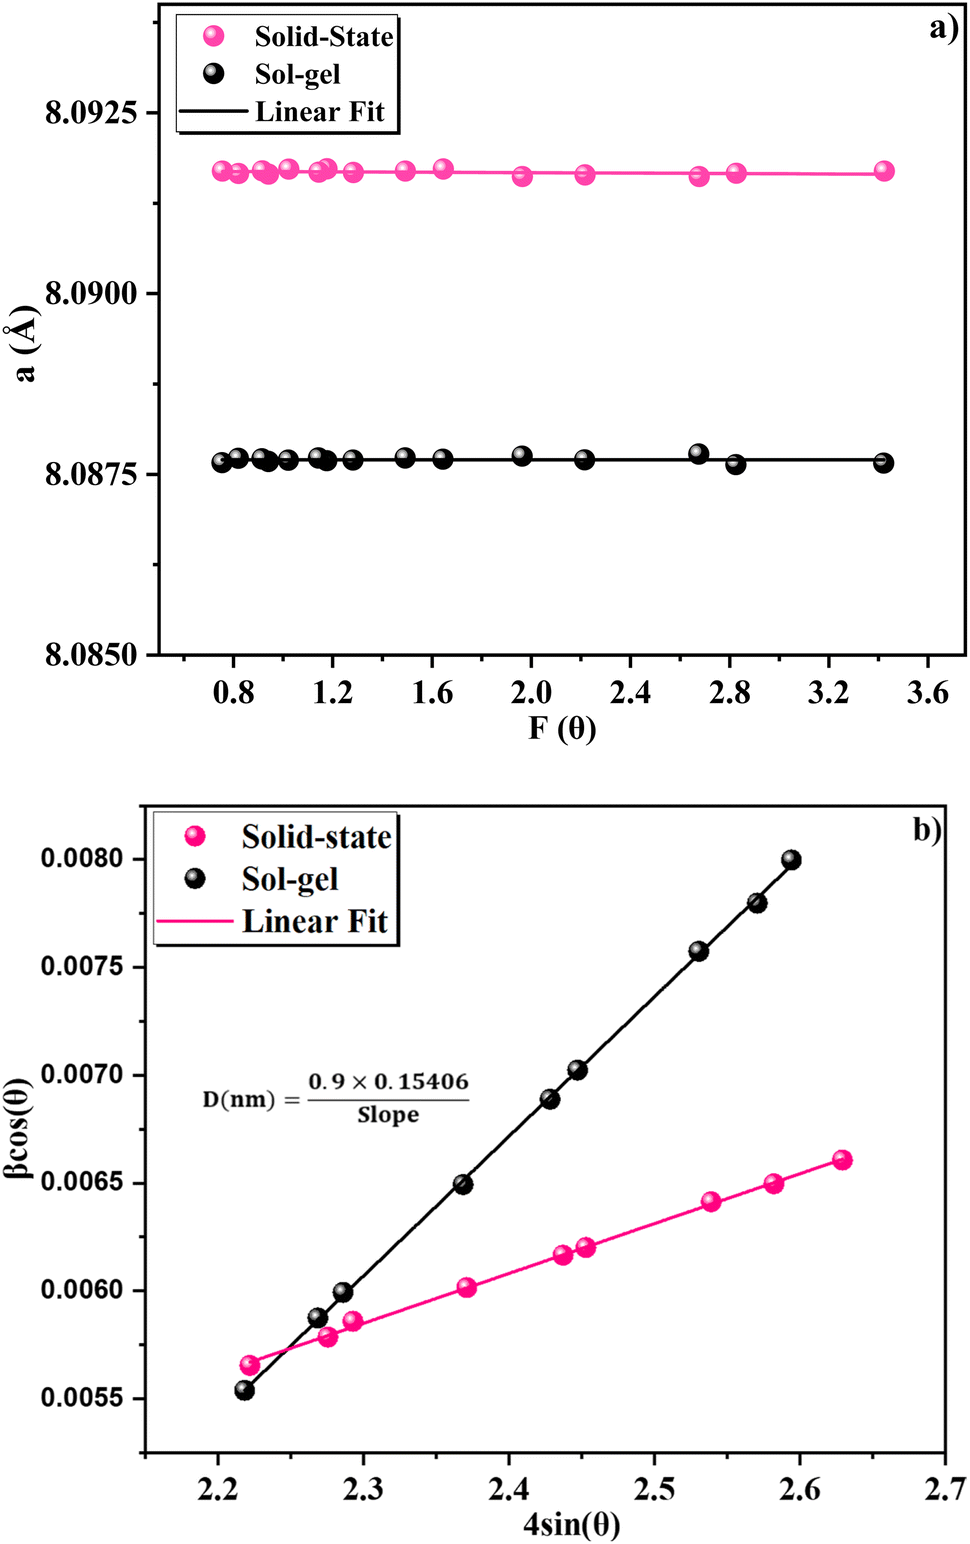
Using the extrapolation function F(θ), the true value of the lattice parameter (a0) was obtained by plotting the a experimental values of each diffraction peak as a function of the Nelson–Riley function to minimize systematic and random errors:39
| |
 | (2) |
The real value of the lattice constant a0 is obtained from the intercept as shown in Fig. 3a. We can see that a0 is slightly higher than the experimental value a and the value of the Rietveld refinement aR, for the samples obtained by the two methods.
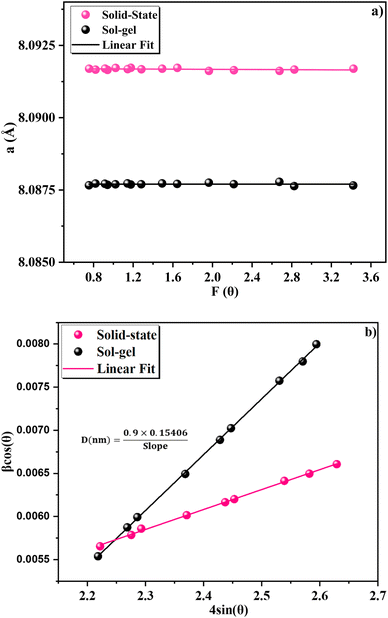 |
| | Fig. 3 (a) Variation of the experimental parameter a as a function of the Nelson–Riley function F(θ), (b) Williamson–Hall plot for the ZnAl1.95Cr0.05O4 samples prepared with the sol–gel and solid-state methods. | |
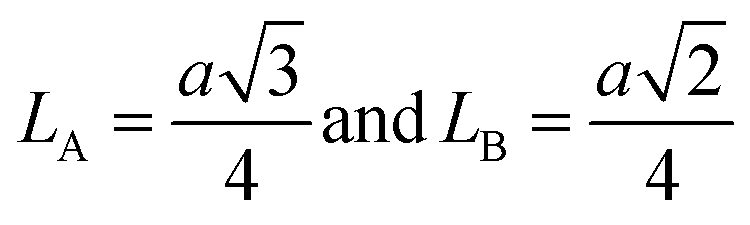
The distance between the ions at site A (LA) and site B (LB) can be evaluated by:40
| |
 | (3) |
where
a is the experimental unit cell parameter.
Assuming that each cell of the cubic spinel structure contains 8 units, the theoretical density of the material was determined using:41
| |
 | (4) |
being
NA: Avogadro number,
M: molar mass of the compound and
Z represents the number of unit in the cell of the cubic spinel structure, where
Z = 8 for a cubic structure.
The experimental density of the material was calculated from the samples in the form of pellets.
To assign the idea of porosity, the difference between the experimental and theoretical density was computed using the following equation:42
| |
 | (5) |
Table 1 lists the different calculated parameters, such as the distance between the ions at A site (LA) and B site (LB), bulk density (ρexp), the density deduced from the X-ray data (ρth), and porosity (P) values. The porosity (P) and the X-ray density ρth increase when Cr is inserted into the sample by the two synthesis methods.
The Williamson–Hall (W–H) relation was used to calculate the average crystallite size (DW–H):43
| |
 | (6) |
where
θ is the Bragg angle of the most intense peak,
λ is the applied wavelength, and
β is defined as
β2 =
βm2 −
βs2, where
βs is the FWHM of a standard sample and
βm is the full width at half maximum (FWHM). The W–H plots of the two compounds are presented in
Fig. 3b. They show a linear correlation between
βcos(
θ) as a function of 4
sin(
θ), and the induced strain (
ε) is represented by the slop. From the intercept of the line with the
y-axis, the size of the crystallites is calculated. We can see that the straight line intersects all the spots, implying that the crystallites have a uniform particle size distribution and small deformation. The Williamson–Hall equation accounts for all diffraction peaks and assumes widening due to crystallite size and lattice strain. The crystallite size obtained with the solid-state method is larger than that obtained by the sol–gel method.
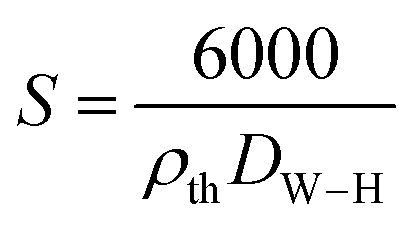
The specific surface was determined, assuming that the particles are spherical, using the following relation:44
| |
 | (7) |
where
DW–H is the crystallite size in meters (m), computed from the Williamson–Hall model,
ρth is the theoretical density in g m
−3 and 6000 is the form factor for the assumed spherical particles.
The dislocation density, which is defined as the length of the dislocation lines per unit volume of the crystal, was used to determine the number of defaults.45
| |
 | (8) |
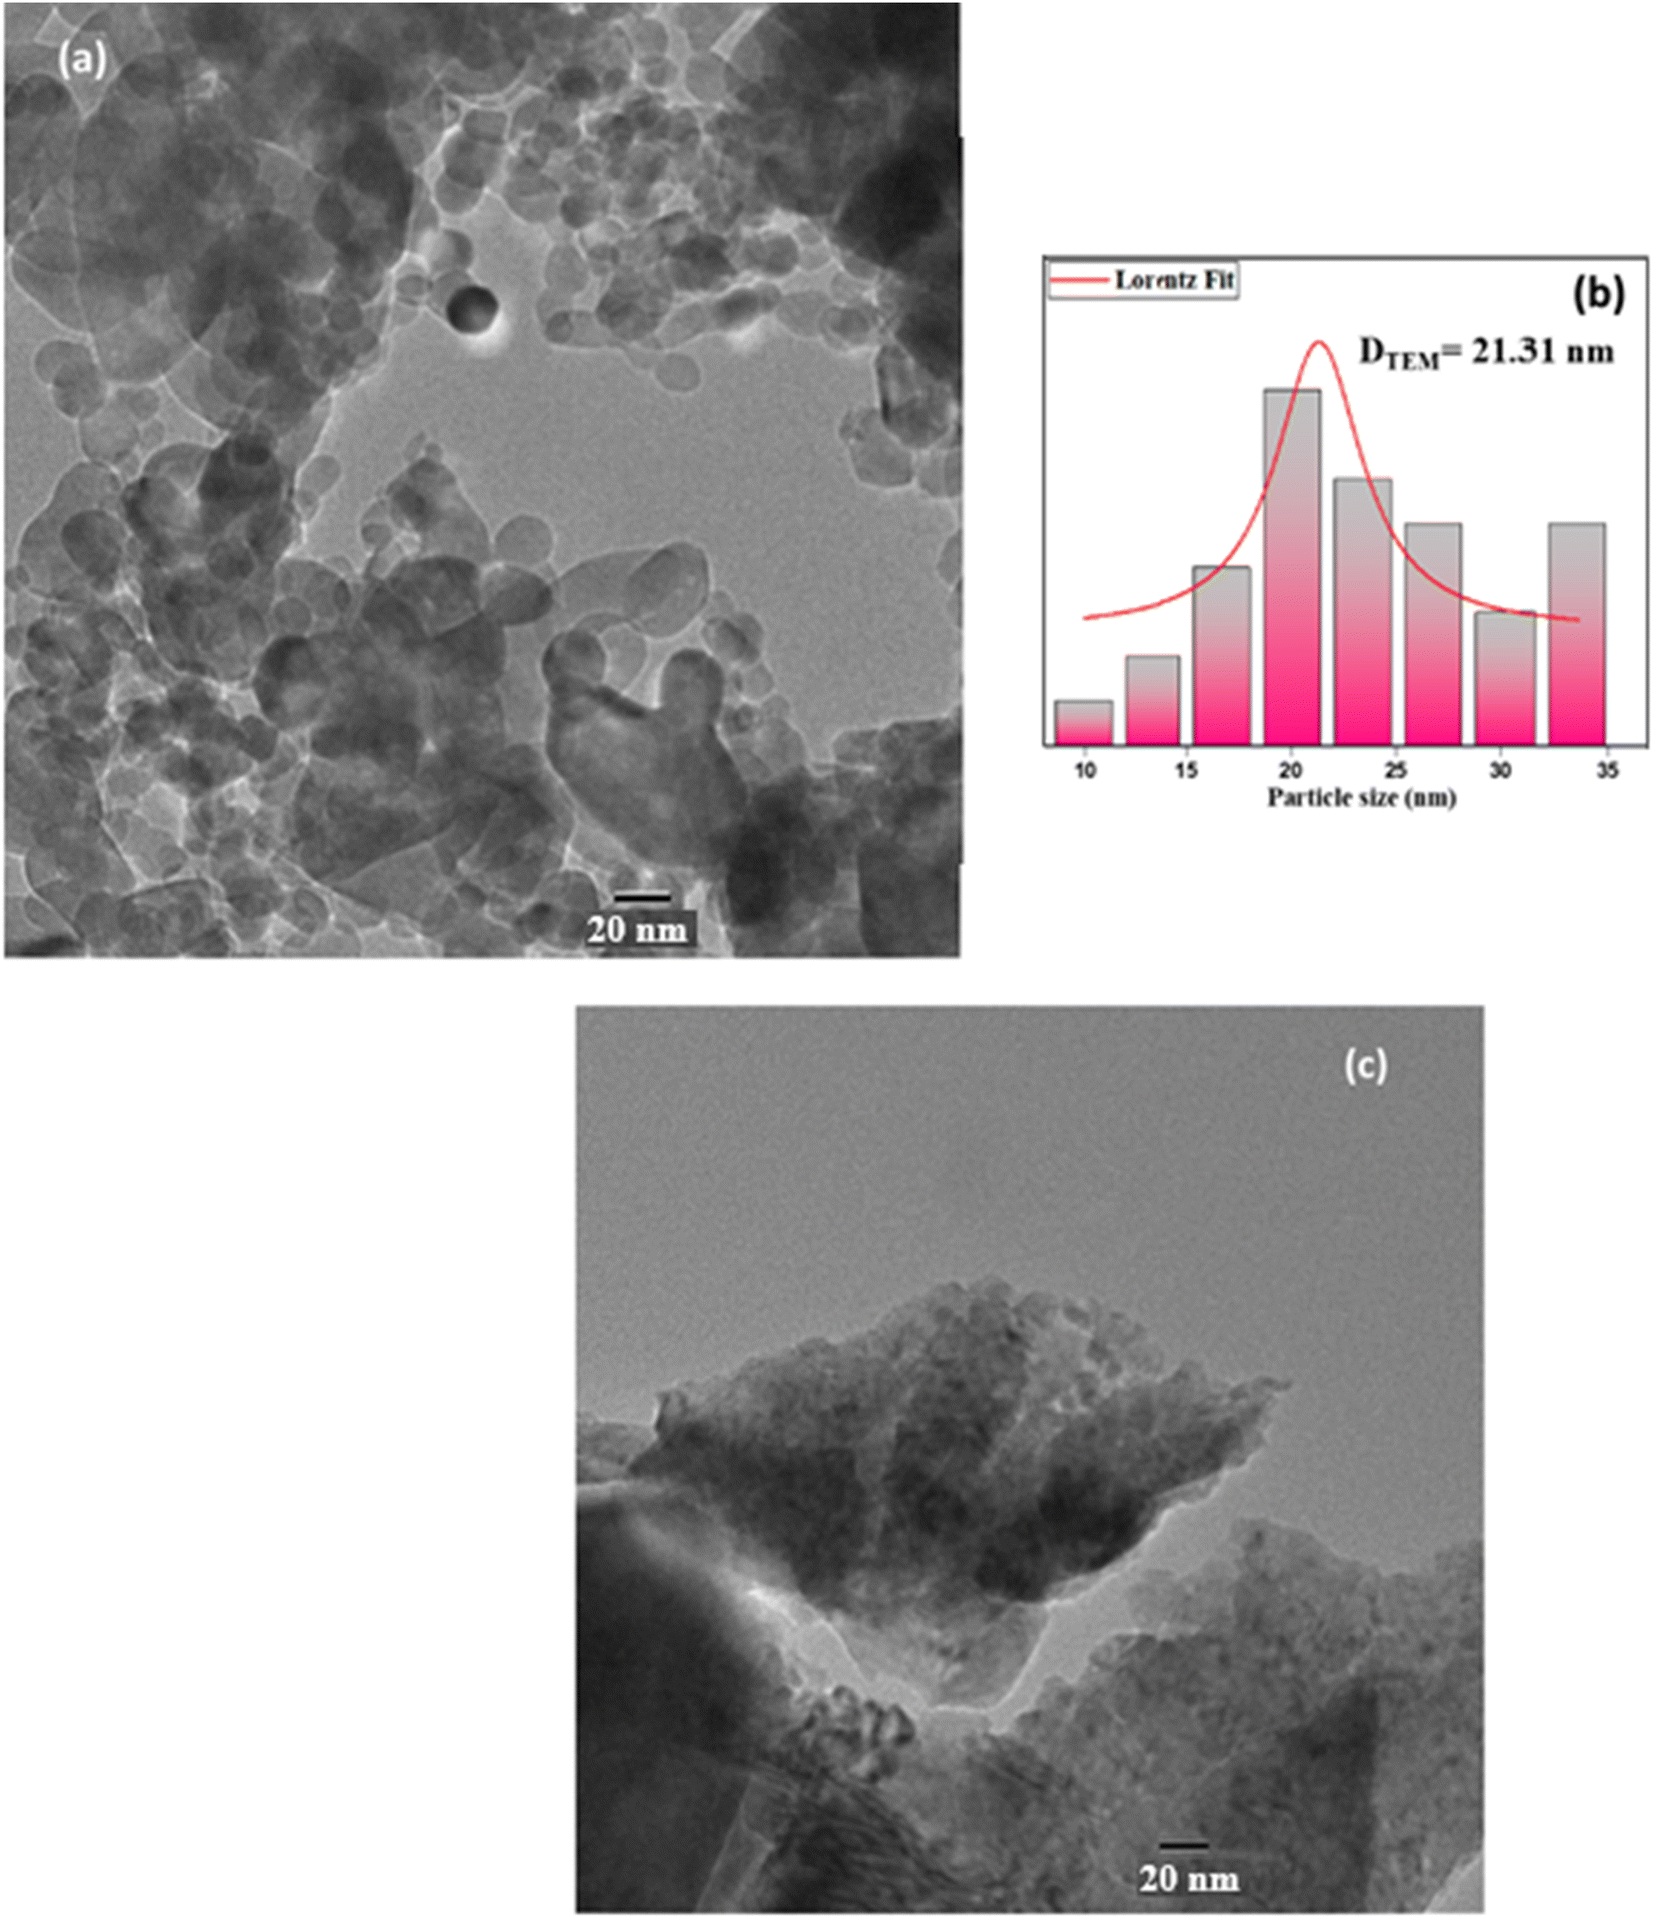
The distribution is virtually homogenous, and the grains are agglomerated throughout the sample, as evidenced by the specific surface area and porosity of the cell units. For the use of gas sensors, the huge surface area of spinel nanoparticles may be necessary. Table 1 summarizes the values of (DW–H), S and δ. With the sol–gel process, small spherical particles are well spread and not agglomerated, as seen in Fig. 4a, which is a transmission electron microscopy (TEM) image of these samples. The histogram depicts the size distribution of the particles for ZnAl1.95Cr0.05O4 sample obtained by sol–gel, which clearly show that the distribution of particles is Lorentzian in nature and that the most likely size value is 21.31 nm, in good accordance with the mean value of crystallites size. The size of the particles is larger for the sample elaborated by the solid-state method since the annealing temperature is higher than that elaborated by sol–gel, causing the growth of crystallites Fig. 4b. Also, as observed in the figure, the particles are very agglomerated. The method of preparation influences the crystallite size. When the temperature increases, the crystal size increases with the increase in conductivity. The sol–gel method does not require high temperatures so there are many smaller grain sizes with better resistivity.
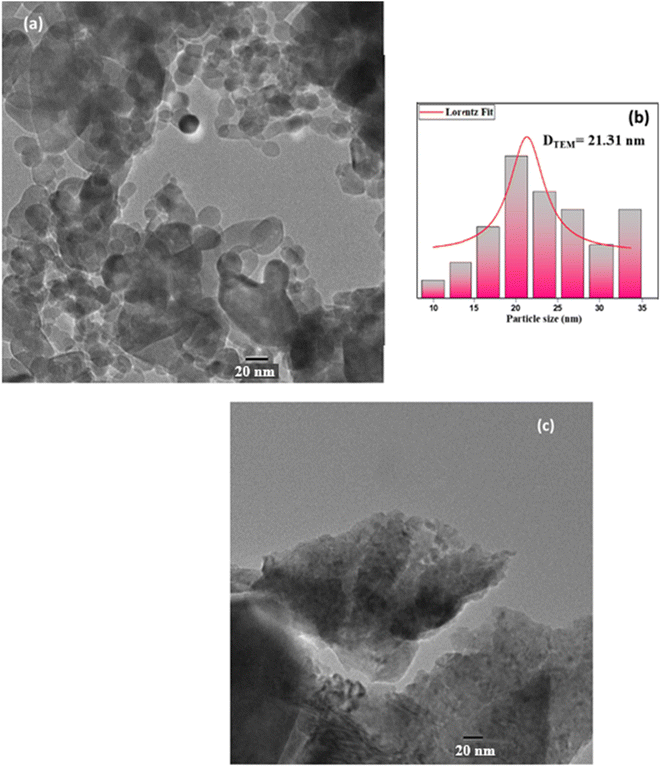 |
| | Fig. 4 TEM images for the ZnAl1.95Cr0.05O4 samples, (a) prepared with the sol–gel method (being the particles size distribution represented in (b)), (c) prepared with solid-state method. | |
3.2. Transport properties and conduction mechanisms
Electrical conductivity in the sol–gel ZnAl1.95Cr0.05O4 sample was studied to determine the nature of carriers (holes or cations, electrons, and anions) during conduction, as a function of temperature and frequency, and how charges move under an applied electric field. For better understanding the conduction behavior, the conductivity changes as a function of frequency at operating temperatures ranging from 540 to 680 K, is shown in Fig. 5a. This figure shows that the conductivity (σac) rises as the temperature increases, implying that the conduction process of ZnAl1.95Cr0.05O4 nanoparticles is thermally activated. The study of the conductivity (σac) as a function of frequency can be subdivided into two types. The low frequency range, which is extended to about 104 Hz, corresponds to a plateau region (uniform behavior). In this range, the conductivity is unaffected by frequency variations and increase with increasing temperature, describing the direct current conductivity (σdc) related to the charge carrier's random motion. The high frequency region above 104 Hz presents a dispersive behavior, being the dominant conductivity, the alternative current one (σac). The conductivity increases and becomes sensitive to the frequency. The increase in σac shows that we have more charge carriers becoming active and more mechanisms for hopping charge carriers between subsequent sites. The electrical conductivity follows Jonscher's law:46where A is a constant depending on temperature and ω = 2πf is the angular frequency. s is a dimensionless parameter exponent (0 < s< 1) describing the interaction between charge carriers and their surroundings. To determine the values of A, σdc, and s, we used eqn (9) to fit the curves displayed in Fig. 5b. The conduction mechanism in the sol–gel ZnAl1.95Cr0.05O4 samples was studied by analyzing the temperature dependence of the s constant. From Fig. 5b, the behavior of “s” changes as the temperature increases. Various models exist to validate the proposed models to explain the conductivity behavior of the samples such as:
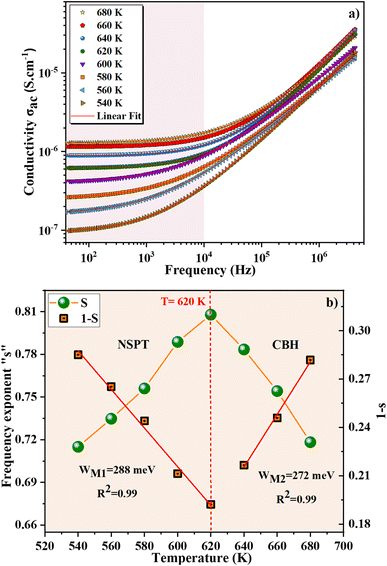 |
| | Fig. 5 (a) Frequency dependency of conductivity, (b) temperature dependence of the exponent “s” of ZnAl1.95Cr0.05O4 sample prepared with the sol–gel method. | |
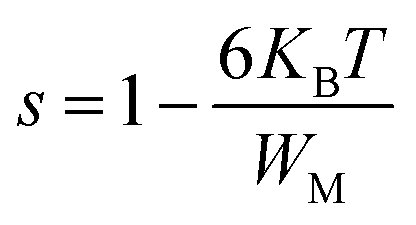
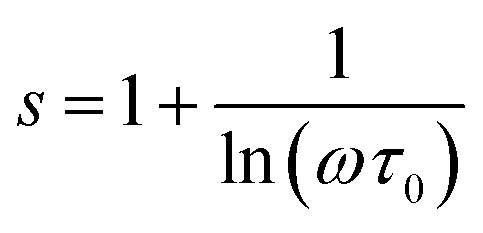
* NSPT (Non-overlapping Small Polaron Tunneling) model, the parameter s increases as the temperature increases and can be expressed by:47
| |
 | (10) |
with
KB the Boltzmann constant,
ω the angular frequency,
WM denoting the activation energy of the polarons,
T the absolute temperature and the relaxation time related to the polaron generation process is denoted by
τ0. The expression of “s” is simplified in the case of large values of
WM/
KBT:
| |
 | (11) |
According to NSPT model, the transport mechanism is realized by single or bipolaron hopping through the Coulomb barrier between two trap centers.
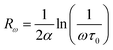
* CBH (Correlated Barrier Hopping) model, the parameter “s” decreases when the temperature increases, as shown in the following formula:48
| |
 | (12) |
The characteristic relaxation time, with a value compared to that of the atomic vibrational period, is designed by τ0 (τ0 = 10−12 s).
The eqn (12) can be written in the fairly high values of WM/KBT as follows:
| |
 | (13) |
Eqn (13) permits to evaluate the maximum value of the potential barrier's height WM, related to the jump distance Rmin between the two neighboring wells. Rmin is given by the equation:
| |
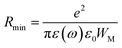 | (14) |
where
ε(
ω) and
ε0 are the dielectric permittivity of the material and of the vacuum, respectively.
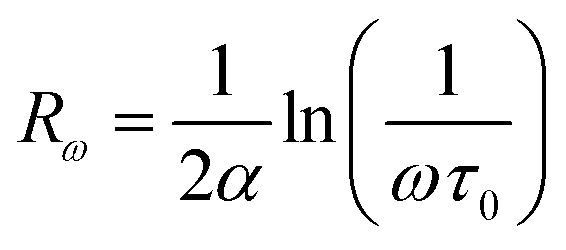
* QMT (Quantum Mechanical Tunneling) model,49 the exponent s is almost equal to 0.8 and slightly increases with or without temperature. The conductivity σac(ω) is given by the following expression:
| | |
σac(ω) = Ce2aKBT[N(EF)2]ωRω4
| (15) |
where
e is the electronic charge,
KB is the Boltzmann constant,
T is the absolute temperature,
N(
EF) is the states' density at the Fermi level,
C is a constant and
Rω is the jump length at the angular frequency
ω (which is the tunneling distance):
| |
 | (16) |
where
τ0 is the characteristic relaxation time and
α is the inverse localization length.
The exponent s can be calculated using the following formula:
| |
 | (17) |
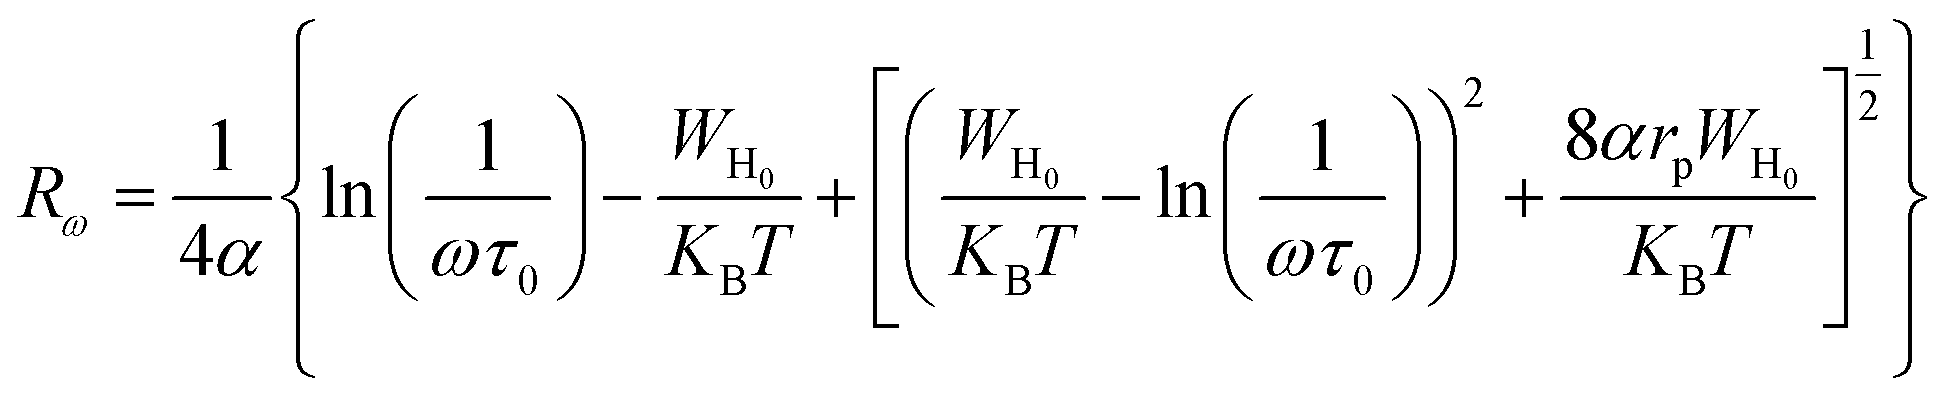
* OLPT (Overlapping Large Polaron Tunneling) model,50 the conductivity is given by the following expression:
| |
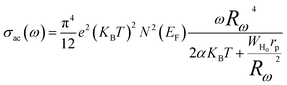 | (18) |
where
rp is the radius of the large polaron and
WH0 is the activation energy associated with the transfer load between the overlapping sites.
The jump length Rω was determined using the following equation:
| |
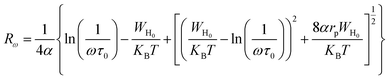 | (19) |
According to this model, the exponent s is expressed by the following relation:
| |
 | (20) |
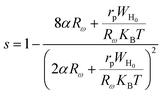
In the OLPT model, the exponent s decreases with increasing temperature, until a minimum at a certain temperature and then increases again.
The parameter “s” initially increases proportionally to the temperature until reaching a value of 0.8 at T = 620 K (Fig. 5b). The activation of the NSPT conduction mechanism was attributed to this observed variance. Then “s” decreases rapidly beyond T = 620 K (Fig. 5b) so that the CBH is the best model to describe carrier's transport. From Fig. 5b, the slope “1 − s” in function of temperature can be used, by linear fitting with eqn (10), to calculate the energy WM for the ZnAl1.95Cr0.05O4 compounds. The value of WM1 is found to be equal to 288 meV. Fig. 5b also illustrates the plot of “1 − s” as a function of temperature and makes it possible, by linear fitting with eqn (13), to calculate the average binding energy value WM2 which turns out to be 272 meV. The bipolaron hopping takes over the conduction mechanism when the maximum barrier height is WM = Ea/2 whereas the single polaron dominates when WM = Ea/4.
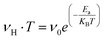
To better study the charge transport properties of the studied spinel, we have taken an interest in the application of Summerfield scaling model51 in the temperature range 540–680 K, of the conductivity spectra. Fig. 6a shows the temperature evolution of the dc conductivity (σdc) and the hopping frequency (νH). In general, the hopping frequency can be expressed as follows:
| |
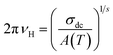 | (21) |
where
νH is the frequency at which the conductance relaxation starts to appear, and
A(
T) is constant conductance. To correlate the dc and ac conductance, the dependence in temperature of the hopping frequency,
νH, and
σdc are employed. In the inset of
Fig. 6a, the logarithmic plot between dc conductance (
σdc) and hopping frequency (
νH) is presented to explore the correlation between these two parameters. The slope value of the relationship between log(
σdc) and log(
νH) is close to one, showing that the dc and ac conductivities are correlated.
52
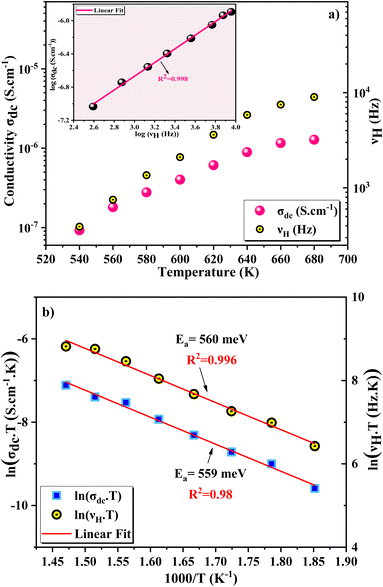 |
| | Fig. 6 (a) The dc conductance σdc and hopping frequency νH vs. temperature, in inset log(σdc) versus log(νH) (b) Arrhenius fits of σdc and the hopping frequency νH vs. reverse temperature. | |
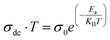
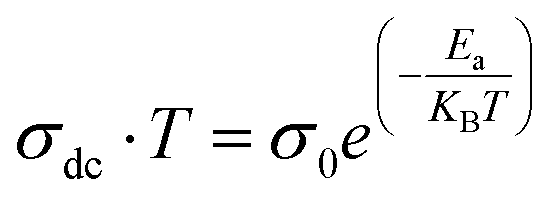
Fig. 6b illustrates the evolutions of the ln(σdc·T) and ln(νH·T) as a function of 1000/T. The same temperature dependence is noted for the two curves with an increase in conductance as temperature rises. The small polaron hopping SPH model explains the temperature dependence of νH and σdc curves for this case using the following equations:53
| |
 | (22) |
| |
 | (23) |
where
ν0 and
σ0 are two pre-exponential constants. The linear fit of the ln(
σdc·
T) and ln(
νH·
T) curves (
Fig. 6b) with
eqn (22) and
(23), gives rise to the activation energy for both cases. The obtained values are 559 meV for ln(
σdc·
T) and 560 meV for ln(
νH·
T). One can note that the value of the conductance activation energy (559 meV) is quite near to the value of the hopping activation energy (560 meV), proving that charge carriers, while conducting and relaxing, must overcome the same energy barriers. From literature, other oxide systems have similar characteristics.
54 Amghar
et al. showed that the conductivity of ZnAl
2O
4 doped with 5% silver Ag is less than 10
−7 S cm
−1.
55 Zheng
et al. reported that ZnAl
2O
4 presented a high-quality factor and a low relative permittivity.
56 Wang
et al. showed that ZnAl
2O
4 exhibits a low conductivity, a low dielectric constant and low dielectric loss.
57 Such linearity in the examined spinel confirms the substantial link between direct and alternate current conductions. According to the above given results and from
Fig. 5b, the dominant conduction mechanism for this compound is bipolaron hopping, because the maximum barrier height
WM (288 meV from NSPT and 272 meV from CBH (
Fig. 5b)) is almost half of the activation energy (
Ea = 560 meV values were derived from the
σdc fits using the small polaron hopping (SPH) model) (
Fig. 6b). This confirms that the conduction mechanism is dominated by the jumping process and confirms the thermal activation of the compounds.
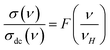
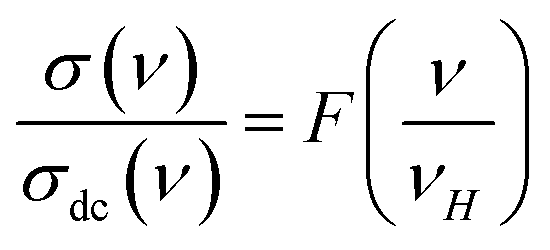
Frequency-dependent conductance scaling analysis was investigated to get an idea of the dependence of temperature on the conduction mechanism and to understand the dynamics of charge carriers in the ZnAl1.95Cr0.05O4 compound. A common temperature-independent physical conduction model explains the superposition of all data points into a single curve after conductance scaling.58 The universal curve is an important characteristic in data analysis, since it simplifies the conduction process and allows for a better comprehension. Useful information about the main factors that influence the charge carriers' dynamics in the studied material, is provided by the validity (or invalidity) of the applied scaling approach. To overlay the individual temperature conductance spectrum, various models have been presented. The use of these models implies that frequency-dependent conductance profiles are identical at different temperatures. For disordered solids, this scaling characteristic is the time–temperature superposition principle (TTSP).59,60 The scaling mechanism of experimental conductance isotherms is presented by a general formula:61,62
| |
 | (24) |
where
σdc is the dc conductance,
νH is the hopping frequency and
F is the temperature-independent function. The scaled conductance spectra for the synthesized compound at different temperatures are shown in
Fig. 7a.
61 From this figure, two key points may be deduced. First, we can observe that for the low and middle frequency values, the data collapse almost perfectly into a single curve (I and II regions). This reveals the TTSP character of the relaxation process, which is temperature independent. As a result, the excellent TTSP points to a similar transport mechanism working in both regions. The scaling mechanism illustrates a collapse in the high-frequency range (region III) which is another important result obtained from the
Fig. 7a. This variation at high frequencies implies that
σ(
ν,
T) is not totally independent of temperature and suggests that conduction dynamics, as well as the usual hopping distance of mobile carriers have changed. As previously stated, the
σ(
ν,
T)/
σdc vs. ν(Hz)/
νH(Hz) reveals a linear relationship with a slope close to one. The Summerfield scaling process points down to this.
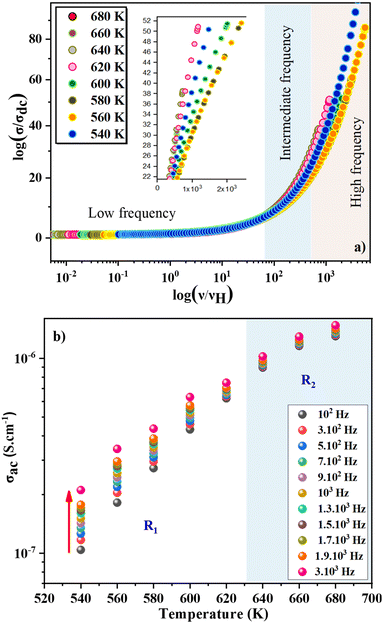 |
| | Fig. 7 (a) The ac conductivity and frequency axes are scaled by dc conductivity and hopping frequency, respectively, in the temperature range (540–680 K), (b) temperature dependence of the σac with various frequency. | |
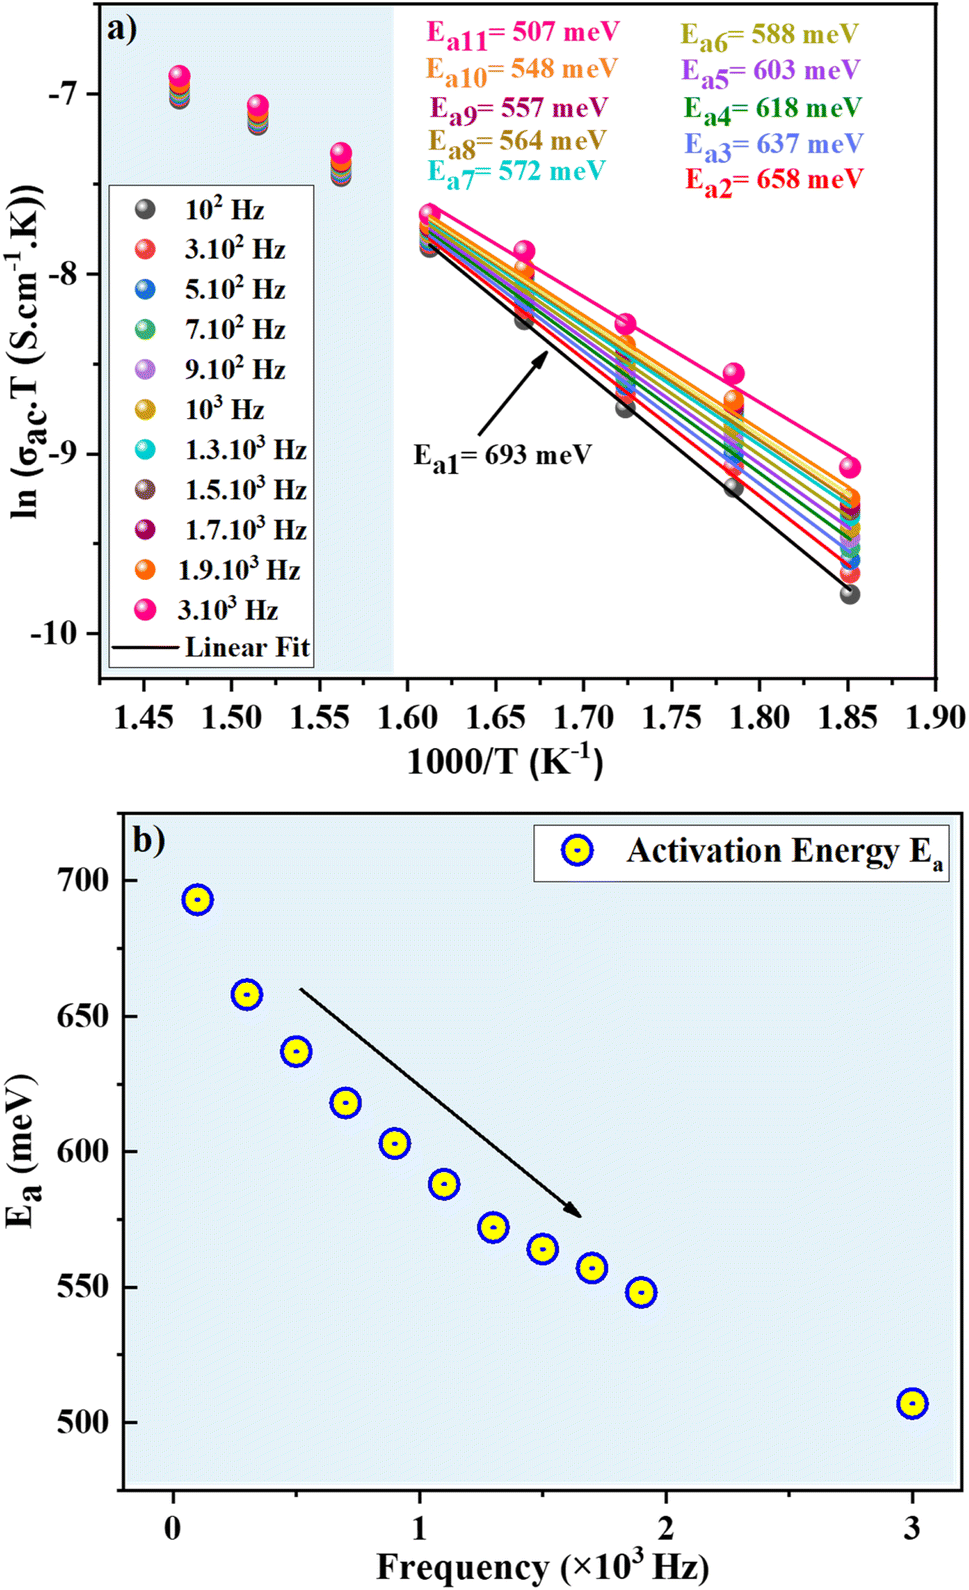
The evolution of AC conductivity σac as a function of temperature is observed in Fig. 7b. The conductivity at each frequency increases regularly with increasing temperature, confirming the semiconductor nature of the compound. The SPH conduction mechanism can then be assumed to be thermally activated at high temperatures. In the temperature range 540–620 K (R1 region), the conductivity increases proportionally with the frequency. Beyond 630 K, the conductivity becomes almost independent of frequency and the SPH conduction mechanism can then be assumed to be thermally activated in the R2 region. Finally, we notice that the thermally activated Arrhenius conduction mechanism is unaffected by frequencies below ν = 3 × 10⁴ Hz. Nonetheless, this parameter has an effect on the static disorder energy and helps to improve conductivity. The evolution of ln(σac·T) as a function of the inverse of temperature is seen in Fig. 8a. These curves were used to corroborate the role of the Arrhenius conduction mechanism in the transport of polarons and to calculate the activation energy for each frequency at various temperatures. It is worth noting that the curves slope change depending on the frequency and the temperature. The fit ln(σac·T) vs. 1000/T show that the thermally activated Arrhenius process energy decreases from Ea1 = 693 meV at ν = 102 Hz to reach Ea11 = 507 meV at ν = 3 × 10⁴ Hz in the low temperature region. In Fig. 8b, it is represented the decrease of the activation energy (Ea) with increasing frequency.
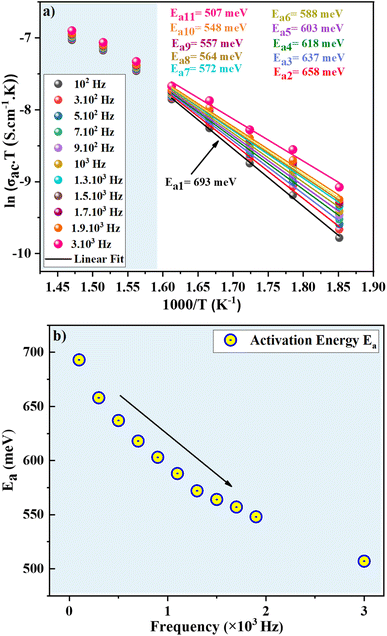 |
| | Fig. 8 (a) Evolution of ln(σacT) as a function of (1000/T) with deduced activation energies, (b) evolution of the activation energies with frequency. | |
3.3 Complex impedance analysis
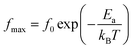
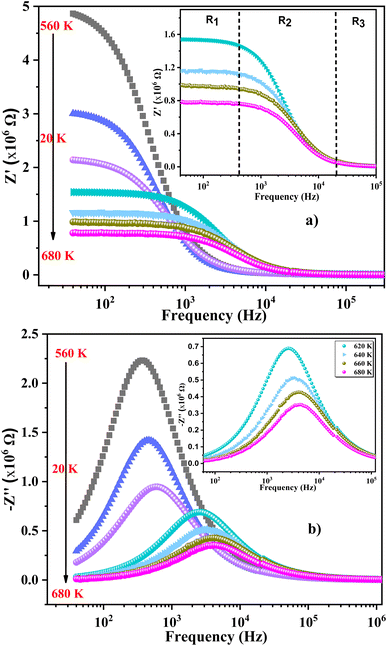
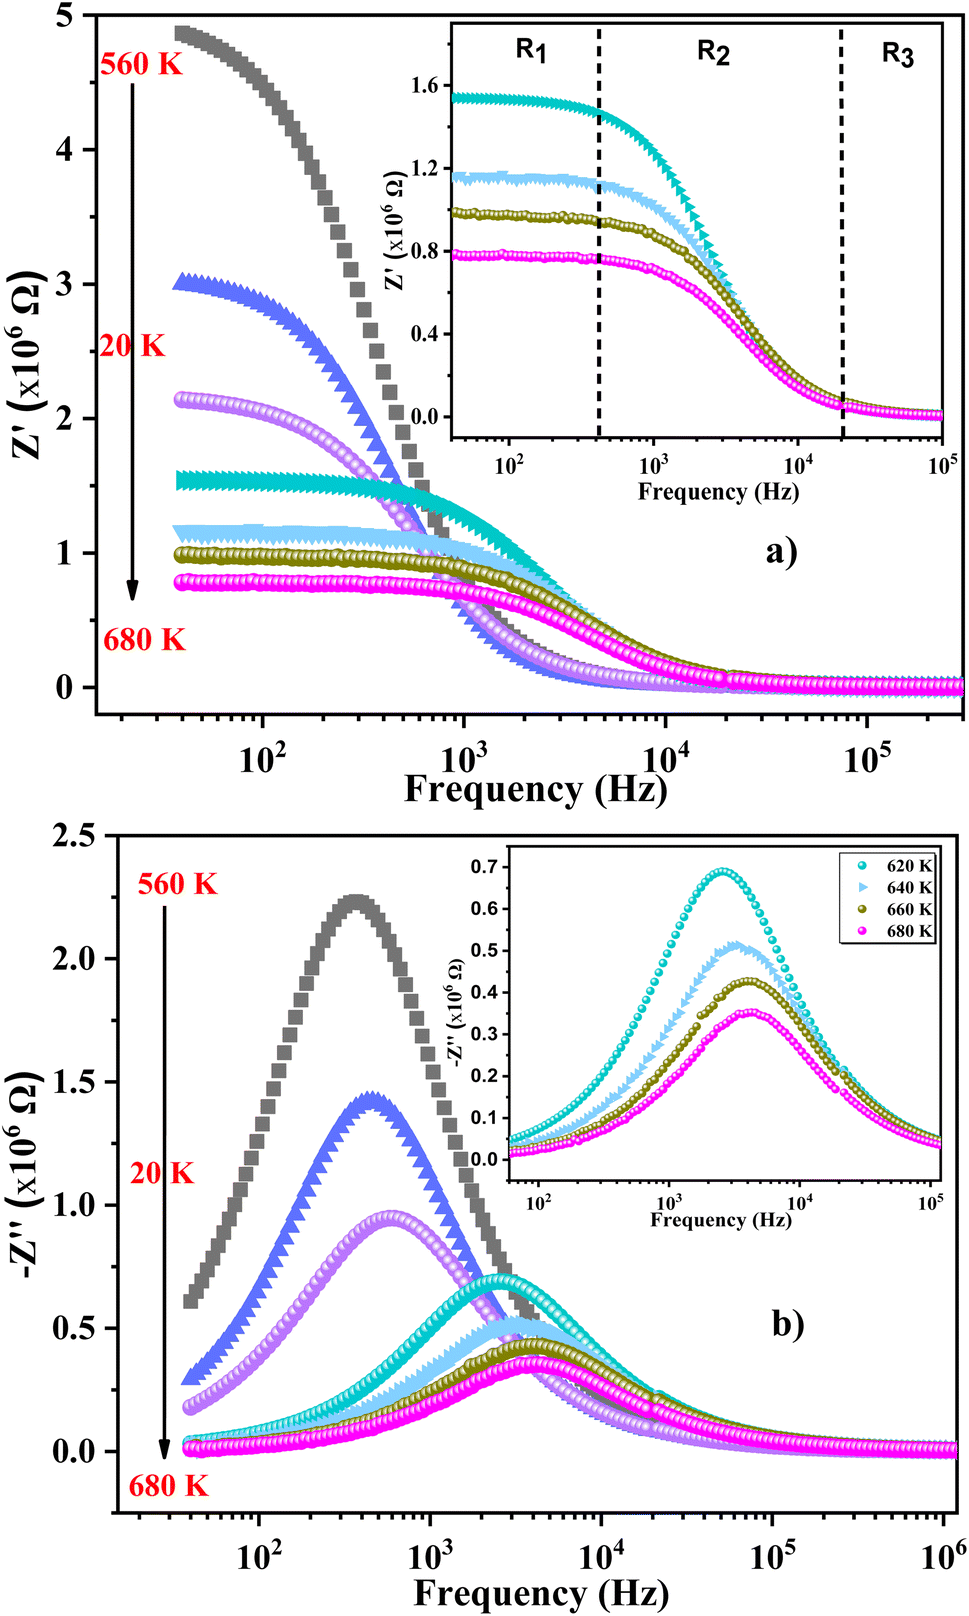
We used impedance spectroscopy to evaluate the influence of Cr doping on the electrical characteristics of the ZnAl1.95Cr0.05O4 material. Fig. 9a shows the evolution of the real impedance (Z′) in function of frequency. Three distinct behaviors can be seen in the fluctuation of Z′ of ZnAl1.95Cr0.05O4 versus temperature and frequency. At low frequencies in the first region (R1), the values of Z′ decrease with increasing temperature independently of the frequency. This behavior can be due to an accumulation of charge carriers at the grain boundaries.63 As the temperature and frequency rise in the second region (R2) (103–104 Hz), the high mobility of charge carriers causes a steady drop in the amplitude of Z′, resulting in an increase in AC conductivity. In this region, we find that the impedance Z′ for the temperature range 620–680 K, becomes higher than that for the temperature range 560–620 K (which was lower in the low frequency region and at temperature below 620 K). This can only be explained by the transition of the conduction mechanism from the NSPT model to the CBH model at the temperature 620 K (Fig. 5b). The activation energy WM2 (272 meV; 620–680 K) for the CBH mechanism is lower than WM1 (288 meV; 560–620 K) for the NSPT mechanism (Fig. 5b), which proves that the bipolaron hopping is weaker for the CBH mechanism, and subsequently one gets a larger value for Z′ compared to the NSPT mechanism. At high frequencies (>104 Hz) (R3 region), the values of Z′ merge regardless of temperature. This phenomenon can be linked to the release of space charges. However, under the influence of temperature, the conduction barrier may gradually decrease,64,65 resulting in a significant reduction in AC current resistance and, as a result, an improvement in conduction. In Fig. 9b, the imaginary component of the impedance (Z′′) as a function of frequency is displayed, for several temperatures. It is worth noting that the curves have a maximum value,  , that lowers as temperature rises, indicating a single relaxation peak at a certain frequency (fmax). The decrease in the peak of the relaxation frequency leads to a decrease in relaxation time,66 implying that the charge species are thermally activated and accumulate at the grain boundaries. The values of fmax are almost equal to the frequency values of inflexion points in Z′ curves (Fig. 10a). As a result, the Arrhenius behavior in the investigated compound is confirmed.67 Furthermore, we see that Z′′ plots merge at higher frequencies, which can be related to a space charge accumulation in the material, as the space charge polarization decreases with frequency.68 The activation energy was determined from the logarithmic variation of fmax as a function of 1000/T (shown in Fig. 10b), corresponding to the following Arrhenius law:69
| |
 | (25) |
where f0 is a pre-exponential factor, Ea represents the activation energy, and kB represents the Boltzmann constant.
 |
| | Fig. 9 (a) Real part of the complex electrical impedance vs. frequency and (b) imaginary part (Z′′) of the impedance plots vs. frequency at several temperatures. | |
 |
| | Fig. 10 (a) Variation of imaginary part and real part of the impedance as a function of frequency for 680 K, (b) variation of ln(fmax) as a function of 1000/T for ZnAl1.95Cr0.05O4 sample prepared with the sol–gel method. | |
The complex electric modulus M* can be used to characterize the electrical properties of our compound:
| | |
M* = M′ + iM′′ = iw0C0Z*
| (26) |
where
M′ and
M′′ are respectively the real and the imaginary part of the complex electrical modulus and
C0 is the vacuum capacitance of the studied cell.
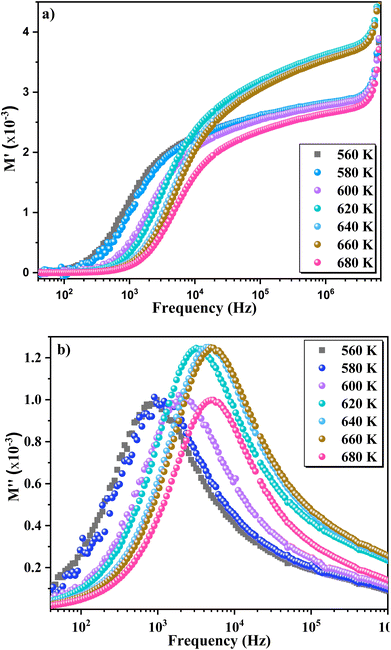
Fig. 11a and b illustrate the frequency dependence of
M′ and
M′′ of ZnAl
1.95Cr
0.05O
4 in the temperature range 560–680 K. Electric modulus formulation was used to investigate the relaxing process in more detail. By determining the relaxation time of the conduction process, the modulus representation provides information on the material's “electric stiffness”, making it more significant in electrical characterization. According to
Fig. 11a, we notice that at low frequencies (<10
2 Hz) and for all temperatures, the values of the real part of the modulus
M′ are close to zero indicating that electronic polarization in these compounds is negligible.
70 When the frequency increase, the modulus
M′ increases rapidly with the increase in temperature until it reaches a maximum value which shifts towards high frequencies. Such behavior is a characteristic of the short-range conduction phenomena.
71 This confirms that the phenomenon of electrode polarization does not contribute to the relaxation process and can be ignored when the electric field is evaluated in this form.
72 For all temperatures, the modulus spectra
M′′ have a single electrical relaxation peak centered at the dispersion region of
M′, which is attributed to the grain boundary effect (
Fig. 11b). This relaxation peak shifts to higher frequencies with increasing temperature.
73 One can see that the relaxation mechanism depends on the temperature.
74 A pure conduction process, whose charge carriers drift over long distances, is associated with the region of low frequencies and below the maximum peak
 75
75 In contrast, carriers move freely within their potential wells in short distances
76 in the high frequency region, above the maximum peak

. Combining the plots of the imaginary part of impedance (
Z′′) and modulus (
M′′)
vs. frequency, it is observed at 620 K the presence of low frequency relaxation (
Fig. 12). In the process of conduction, the impacts of high resistance grain boundaries are illustrated by the variation of the imaginary electrical impedance (
Z′′), while the impacts of low capacitance grains can be evaluated by plotting the imaginary modulus (
M′′) in function of frequency. The curves of
M′′ (
Fig. 11b) show high frequency relaxation peaks, which correspond to the higher frequency peaks of the variation of
Z′′ related to the relaxation frequency of mobile charge species. A peak relaxation at about 2500 Hz (
Fig. 12) corresponds to the low frequency peak of
Z′′ related to grain boundaries.
 |
| | Fig. 11 (a) Real part of the electrical modulus plot (M′) and (b) imaginary part of the modulus (M′′) as a function of frequency at different temperatures. | |
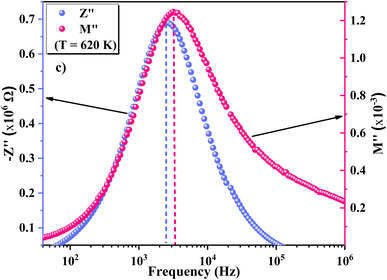 |
| | Fig. 12 Z′′ & M′′ variation with frequency at 620 K. | |
Generally, the long-range motion of charge carriers in the relaxation mechanism is dominant when the peaks of the Z′′ and M′′ curves coincide at the same frequency. So, we can determine, from the plots in Fig. 12, which one of the short- or long-range charge motion would be dominant in the relaxation mechanism. The slight match of the peaks of Z′′ and M′′ for the ZnAl1.95Cr0.05O4 compound supports the dominance of the long-range motion of charge species with higher mobility and confirms the results already obtained by alternative conductivity σac studies.77–80
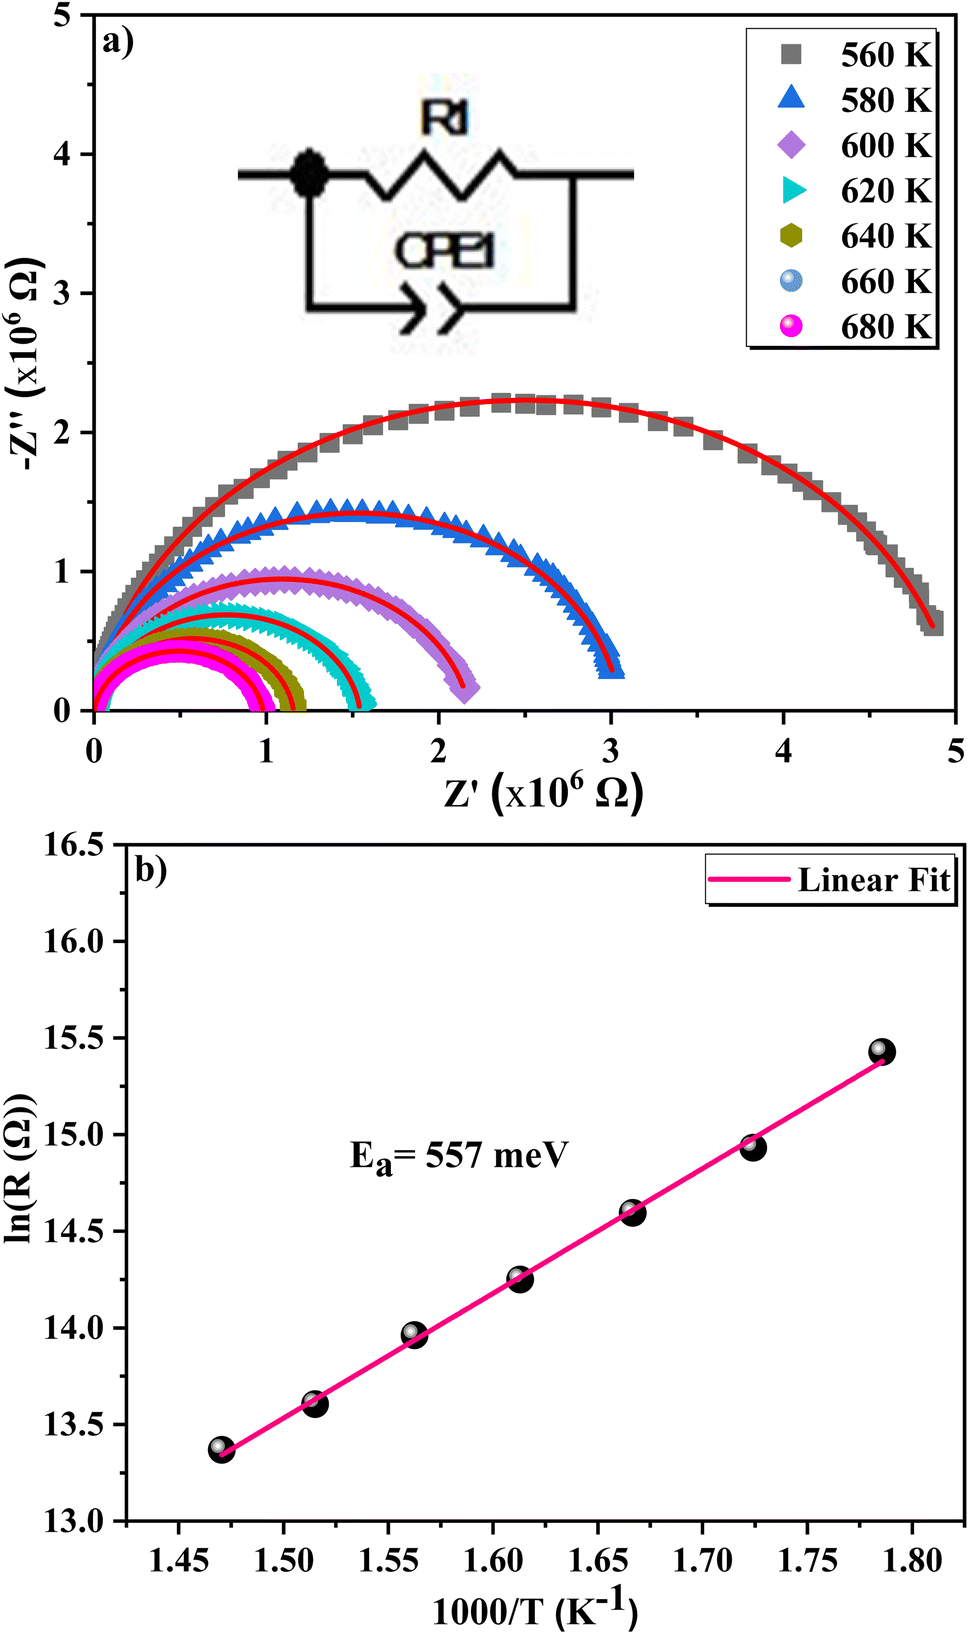
The study of Nyquist impedance plots proves the contribution of multiple relaxation processes such as grains, grain boundaries and electrode conduction. Nyquist plots of the ZnAl1.95Cr0.05O4 compound are shown in Fig. 13a. As can be seen, all curves take the shape of semicircles, with diameters decreasing as temperature rises, showing that the conduction mechanism is thermally activated81 being the sample a semiconductor. The presence of a single semicircle means a single relaxation phenomenon. A non-Debye-type relaxing process is indicated by the observed semicircle decentralization.82 Z-view software was used to adjust Cole–Cole plots. The best fit was achieved by using an equivalent circuit, consisting in a resistor R in parallel with a constant phase element CPE. A Debye peak is linked with each RC component whose frequency fmax and amplitude  are indicated by 2πfmax in the imaginary impedance (Z′′) plots.
  and RC = 1, respectively. Using these equations, the values of R and C for the analogous electrical circuit may be calculated from
  . The single semicircle appearance is attributed to a grain boundary effect.83 The CPE impedance is provided by the equation:84
| |
 | (27) |
where
Q is the capacitance of the CPE element, and
α denotes the deviation degree from the value of the pure capacitor.
Table 2 summarizes the theoretical parameters collected from the equivalent circuit fit at various temperatures, for the ZnAl
1.95Cr
0.05O
4 compound. The bulk resistance
Rgb follows the Arrhenius relation
63 formulated as:
| |
 | (28) |
where
Ea is the activation energy and the parameter
R0 is the pre-exponential term. The linear fitting, which was done using
eqn (28), is depicted as a straight line in
Fig. 13b. The values of activation energy observed from the Arrhenius plot of resistance
Rgb (grain boundary resistivity), dc conductance
σdc, relaxation (
fmax) and hopping frequency
νH, are very close, as shown in
Table 3. It's important to note that the activation energy values obtained from the hopping frequency, conductivity
σdc, bulk resistance
Rgb, and relaxation (
fmax), in the same temperature range (540–680 K), are very close. As a result, we can attest to the goodness of the adjustment of the relaxation and the Nyquist plots, so that charge carriers of the same sort may be responsible for the conduction mechanism.
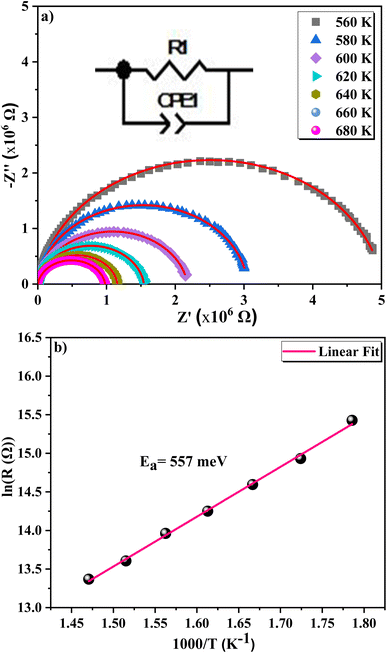 |
| | Fig. 13 (a) Cole–Cole plot with fitted line and equivalent circuit and (b) variation of grain boundary resistance ln(Rgb) as a function of 1000/T for ZnAl1.95Cr0.05O4 spinel ceramics prepared by sol–gel. | |
Table 2 Theoretical parameters obtained from the fitted data with the equivalent circuit for x = 0.05
| T (K) |
R (MΩ) (±0.01) |
C (10−11 F) (±0.01) |
α (±0.01) |
| 560 |
5.01 |
15.25 |
0.93 |
| 580 |
3.06 |
16.61 |
0.95 |
| 600 |
2.18 |
25.59 |
0.91 |
| 620 |
1.55 |
8.01 |
0.93 |
| 640 |
1.16 |
7.99 |
0.93 |
| 660 |
0.98 |
9.99 |
0.91 |
| 680 |
0.78 |
9.94 |
0.94 |
Table 3 Values of activation energy inferred from different parameters
| T (K) |
σdc |
Rg |
νH |
fmax |
| 540–680 K |
Ea = 559 meV |
Ea = 557 meV |
Ea = 560 meV |
Ea = 564 meV |
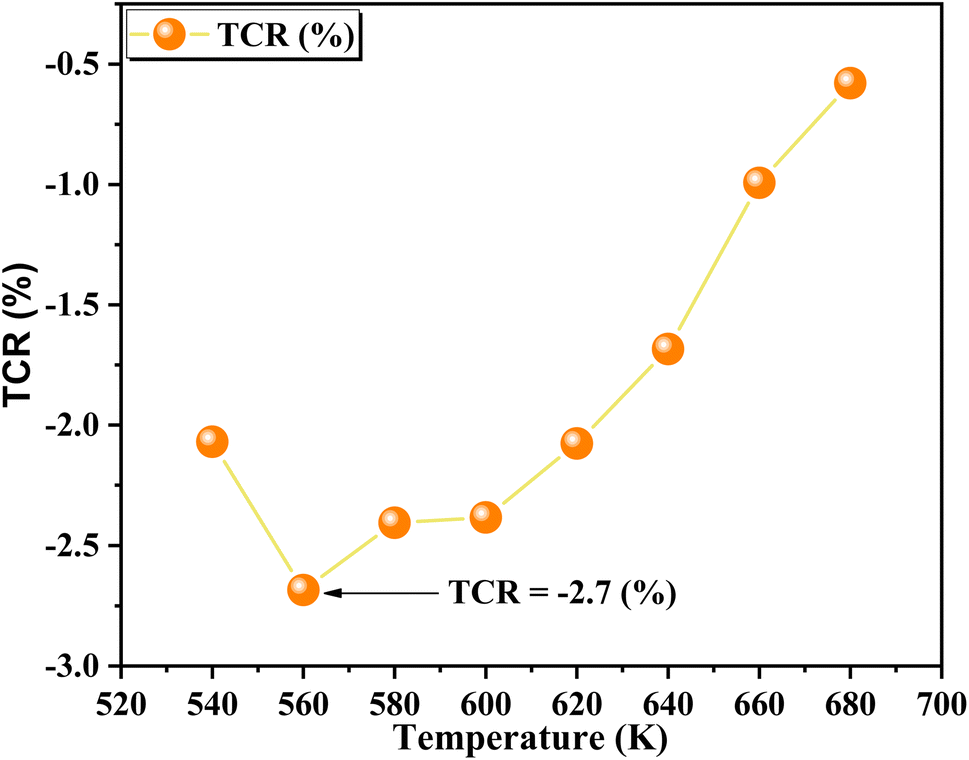
The temperature coefficient of resistivity (TCR) is defined by:
| |
 | (29) |
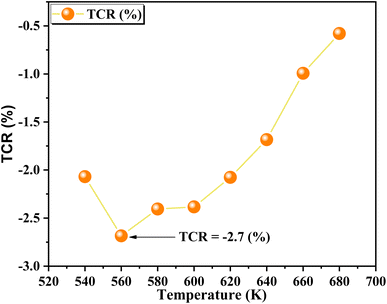
The resistivity is given by  . The temperature-dependent resistivity coefficient for ZnAl1.95Cr0.05O4 compound plotted in Fig. 14 is used to determine the TCR factor. A negative TCR value −2.7% K−1 is found at 560 K. ZnAl1.95Cr0.05O4 compound has a higher TCR value compared to other values published in other works.85 This result shows that our compound is a good candidate for uncooled infrared bolometric applications and infrared detectors.
 |
| | Fig. 14 The variation of TCR for ZnAl1.95Cr0.05O4 nanoparticles prepared by sol–gel, as a function of temperature. | |
4. Conclusion
The XRD examination of the prepared samples ZnAl1.95Cr0.05O4 with solid-state and sol–gel methods, proved a Fdm cubic structure. The crystallite size, determined from the Williamson–Hall (W–H) relation, is about 21 nm for the samples prepared by the sol–gel method, whereas is 60 nm for the samples synthesized by the solid-state route. TEM revealed almost spherical particles, with diameters of 21 nm in average, for the sol–gel samples, while the particles by the solid-state method are agglomerated. The σac conductivity of ZnAl1.95Cr0.05O4 sample prepared by sol–gel method, is studied in the frequency range of 40–107 Hz and temperature region of 540–680 K. At low frequencies, the DC conductivity exhibits a semiconductor behavior, whereas, at high frequencies, the conductivity spectra show a dispersive area. NSPT and CBH models were used to explain the origin of the high-frequency dispersion zone. The maximum barrier height WM (288 meV from NSPT and 272 meV from CBH) is nearly half the activation energy (Ea = 560 meV); for this reason, bipolaron hopping is the predominant conduction process for this compound. The study of the electrical properties exhibits an Arrhenius behavior confirmed, as the temperature rises. The contribution of grain boundaries to the relaxation process has been established by electric modulus and impedance measurements. When the temperature increases, the relaxation shifts to higher frequencies. Activation energy values were obtained from AC conduction, imaginary part of impedance (Z′′), Resistance Rgb (grain boundary) and hopping frequency. The results suggest that during electrical conductivity and relaxation mechanisms, the charge carriers must overcome the same energy barrier. The ZnAl1.95Cr0.05O4 compound prepared by sol–gel, is a good candidate for uncooled infrared bolometric applications and infrared detectors.
Data availability
All data obtained or analyzed in this study is included in this paper. Furthermore, the data analyzed during the study is available on reasonable request to the corresponding author.
Conflicts of interest
There is no conflict of interest.
Acknowledgements
The support of the Tunisian Ministry of Higher Education and Scientific Research within the framework of the Tunisian-Portuguese cooperation (Project of University of Sfax-University of Aveiro) is gratefully acknowledged. This work was also supported by FCT – Fundação para a Ciência e a Tecnologia, I.P., (projects UIDB/04564/2020 and UIDP/04564/2020). The authors also acknowledge the TAIL-UC facility funded under QREN-Mais Centro Project No. ICT_2009_02_012_1890.
References
- N. J. van der Laag, M. D. Snel, P. C. M. M. Magusin and G. de With, Structural, elastic, thermophysical and dielectric properties of zinc aluminate (ZnAl2O4), J. Eur. Ceram. Soc., 2004, 24(8), 2417–2424 CrossRef CAS.
- A. R. Phani, M. Passacantando and S. Santucci, Synthesis and characterization of zinc aluminum oxide thin films by sol–gel technique, Mater. Chem. Phys., 2001, 68(1), 66–71 CrossRef CAS.
- J. Park, J. Joo, S. G. Kwon, Y. Jang and T. Hyeon, Synthesis of Monodisperse Spherical Nanocrystals, Angew. Chem., Int. Ed., 2007, 46, 4630–4660 CrossRef CAS PubMed.
- M. G. Brik, J. Papan, D. J. Jovanović and M. D. Dramićanin, Luminescence of Cr3+ ions in ZnAl2O4 and MgAl2O4 spinels: correlation between experimental spectroscopic studies and crystal field calculations, J. Lumin., 2016, 177, 145–151 CrossRef CAS.
- D. Dwibedi, C. Murugesan, M. Leskes and P. Barpanda, Role of annealing temperature on cation ordering in hydrothermally prepared zinc aluminate (ZnAl2O4) spinel, Mater. Res. Bull., 2018, 98, 219–224 CrossRef CAS.
- Y. Jun, J. Choi and J. Cheon, Shape Control of Semiconductor and Metal Oxide Nanocrystals through Nonhydrolytic Colloidal Routes, Angew. Chem., Int. Ed., 2006, 45(21), 3414–3439 CrossRef CAS PubMed.
- X. Y. Chen, C. Ma, Z. J. Zhang and B. N. Wang, Ultrafine gahnite (ZnAl2O4) nanocrystals: hydrothermal synthesis and photoluminescent properties, Mater. Sci. Eng., B, 2008, 151(3), 224–230 CrossRef CAS.
- R. Madar, V. Ghetta, E. Dhahri, P. Chaudouet and J. P. Senateur, Analyse cristallochimique des mecanismes de formation des phases ternaires Ln M X (terre rare-métal de transition-non métal) de formule (, Ln, M)2X, J. Solid State Chem., 1987, 66(1), 73–85 CrossRef CAS.
- A. Dhahri, F. I. H. Rhouma, J. Dhahri, E. Dhahri and M. A. Valente, Structural and electrical characteristics of rare earth simple perovskite oxide La0.57Nd0.1Pb0.33Mn0.8Ti0.2O3, Solid State Commun., 2011, 151(9), 738–742 CrossRef CAS.
- S. Mathur, M. Veith, M. Haas, H. Shen, N. Lecerf and V. Huch, Single-Source Sol–Gel Synthesis of Nanocrystalline ZnAl2O4: Structural and Optical Properties, J. Am. Ceram. Soc., 2001, 84(9), 1921–1928 CrossRef CAS.
- S. V. Kuznetsov, V. V. Osiko, E. A. Tkatchenko and P. P. Fedorov, Inorganic nanofluorides and related nanocomposites, Russ. Chem. Rev., 2006, 75(12), 1065 CrossRef CAS.
- M. A. Ahmed, E. Dhahri, S. I. El-Dek and M. S. Ayoub, Size confinement and magnetization improvement by La3+ doping in BiFeO3 quantum dots, Solid State Sci., 2013, 20, 23–28 CrossRef CAS.
- Z. Chen, E. Shi, Y. Zheng, W. Li, N. Wu and W. Zhong, Synthesis of mono-dispersed ZnAl2O4 powders under hydrothermal conditions, Mater. Lett., 2002, 56(4), 601–605 CrossRef CAS.
- S. C. Shen, K. Hidajat, L. E. Yu and S. Kawi, Simple Hydrothermal Synthesis of Nanostructured and Nanorod Zn–Al Complex Oxides as Novel Nanocatalysts, Adv. Mater., 2004, 16(6), 541–545 CrossRef CAS.
- S.-F. Wang, G.-Z. Sun, L.-M. Fang, L. Lei, X. Xiang and X.-T. Zu, A comparative study of ZnAl2O4 nanoparticles synthesized from different aluminum salts for use as fluorescence materials, Sci. Rep., 2015, 5(1), 12849 CrossRef CAS PubMed.
- Z. Q. Yu, C. Li and N. Zhang, Size dependence of the luminescence spectra of nanocrystal alumina, J. Lumin., 2002, 99(1), 29–34 CrossRef CAS.
- S. V. Motloung, F. B. Dejene, H. C. Swart and O. M. Ntwaeaborwa, Effects of Cr3+ mol% on the structure and optical properties of the ZnAl2O4:Cr3+ nanocrystals synthesized using sol–gel process, Ceram. Int., 2015, 41(5), 6776–6783 CrossRef CAS.
- S. Narang and S. Bahel, Low loss dielectric ceramics for microwave applications: A review, J. Ceram. Process. Res., 2010, 11, 316–321 Search PubMed.
- M. T. Tran, D. Q. Trung, N. Tu, D. D. Anha, L. T. H. Thu, N. V. Du, N. V. Quang, N. T. Huyen, N. D. T. Kien, D. X. Viet, N. D. Hung and P. T. Huy, Single-phase far-red emitting ZnAl2O4:Cr3+ phosphor for application in plant growth LEDs, J. Alloys Compd., 2021, 884, 161077 CrossRef CAS.
- S. K. Sharma, D. Gourier, B. Viana, T. Maldiney, E. Teston, D. Scherman and C. Richard, Persistent luminescence of AB2O4:Cr3+ (A = Zn, Mg, B = Ga, Al) spinels: New biomarkers for in vivo imaging, Opt. Mater., 2014, 36, 1901–1906 CrossRef CAS.
- I. Broussell, E. Fortin, L. Kulyuk, S. Popov, A. Anedda and R. Corpino, Optical properties of α-ZnAl2S4:Cr single crystals, J. Appl. Phys., 1998, 84, 533–540 CrossRef CAS.
- S. M. Kaczmarek, W. Chen and G. Boulon, Recharging processes of Cr ions in Mg2SiO4 and Y3Al5O12 crystals under influence of annealing and γ-irradiation, Cryst. Res. Technol., 2006, 41, 41 CrossRef CAS.
- T.-L. Phan, M.-H. Phan and S.-C. Yu, A new band in Cr3+-doped MgAl2O4 natural spinel at room temperature, Phys. Status Solidi B, 2004, 241, 434–438 CrossRef CAS.
- Ah. Dhahri, A. Bougoffa, A. Zaouali, A. Benali, M. P. F. Graça, M. A. Valente, B. F. O. Costa, N. Abdelmoula and J. F. M. L. Mariano, Investigation of Cr substitution effect on the evolution of La0.67Ca0.2Ba0.13Fe1−xCrxO3 (x = 0 and 0.03) electrical properties under frequency and temperature variation, Eur. Phys. J. Plus, 2021, 136, 829 CrossRef CAS.
- R. Lahouli, J. Massoudi, M. Smari, H. Rahmouni, K. Khirouni, E. Dhahri and L. Bessais, Investigation of annealing effects on the physical properties of Ni0.6Zn0.4Fe1.5Al0.5O4 ferrite, RSC Adv., 2019, 9(35), 19949–19964 RSC.
- R. S. Devan, Y. D. Kolekar and B. K. Chougule, Effect of cobalt substitution on the properties of nickel–copper ferrite, J. Phys.: Condens. Matter, 2006, 18(43), 9809 CrossRef CAS.
- Y. Li, W. Hong, Z. Xie, Z. Shen and Z. Wang, Synthesis and Microwave Dielectric Properties of Cu-Doped ZnAl2O4, Int. J. Appl. Ceram. Technol., 2016, 13(5), 884–888 CrossRef CAS.
- R. N. Aljawfi, F. Rahman and K. M. Batoo, Effect of grain size and grain boundary defects on electrical and magnetic properties of Cr doped ZnO nanoparticles, J. Mol. Struct., 2014, 1065–1066, 199–204 CrossRef CAS.
- N. G. Kostova, Al. Eliyas, M. Fabián, M. Achimovičová and P. Baláž, Photocatalytic Properties of Mechanochemically Synthesized Nanocrystalline ZnAl2O4 and CdSe, Acta Phys. Pol., A, 2014, 126(4), 967–970 CrossRef CAS.
- S. V. Motloung, P. Kumari, L. F. Koao, T. E. Motaung, T. T. Hlatshwayo and M. J. Mochane, Effects of annealing time on the structure and optical properties of ZnAl2O4/ZnO prepared via citrate sol-gel process, Mater. Today Commun., 2018, 14, 294–301 CrossRef CAS.
- D. Dwibedi, C. Murugesan, M. Leskes and P. Barpanda, Role of annealing temperature on cation ordering in hydrothermally prepared zinc aluminate (ZnAl2O4) spinel, Mater. Res. Bull., 2018, 98, 219–224 CrossRef CAS.
- H. Souissi, O. Taktak and S. Kammoun, Theoretical study by analytical equations of optical properties of the phosphors Zn2SnO4 codoped with Cr3+ and (Al3+ or Eu3+) via the crystal field control, Opt. Mater., 2021, 121, 111529 CrossRef CAS.
- O. Taktak, H. Souissi and S. Kammoun, Optical properties of the phosphors Zn2SnO4:Cr3+ with near-infrared long-persistence phosphorescence for bio-imaging applications, J. Lumin., 2020, 228, 117563 CrossRef CAS.
- H. Souissi, O. Taktak and S. Kammoun, Crystal field study of Chromium(III) ions doped antimony phosphate glass: Fano's antiresonance and Neuhauser models, Indian J. Phys., 2018, 92, 1153–1160 CrossRef CAS.
- O. Taktak, H. Souissi and S. Kammoun, Optical absorption properties of ZnF2–RO–TeO2 (R = Pb, Cd and Zn) glasses doped with chromium(III): Neuhauser model and crystal field study, Opt. Mater., 2021, 113, 110682 CrossRef CAS.
- O. Taktak, H. Souissi and S. Kammoun, Electronic structure and Fano antiresonance of chromium Cr(III) ions in alkali silicate glasses, J. Lumin., 2015, 161, 368–373 CrossRef CAS.
- O. Taktak, H. Souissi, O. Maalej, B. Boulard and S. Kammoun, Fanós antiresonance and crystal-field study of Cr3+ in metaphosphate glasses, J. Lumin., 2016, 180, 183–189 CrossRef CAS.
- I. Elhamdi, H. Souissi, O. Taktak, J. Elghoul, S. Kammoun, E. Dhahri and B. F. O. Costa, Experimental and modeling study of ZnO:Ni nanoparticles for near-infrared light emitting diodes, RSC Adv., 2022, 12(21), 13074–13086 RSC.
- M. Verma, M. B. Newmai and P. S. Kumar, Synergistic effect of Au–Ag nano-alloying: intense SEIRA and enhanced catalysis, Dalton Trans., 2017, 46(29), 9664–9677 RSC.
- G. Kumar, R. K. Kotnala, J. Shah, V. Kumar, A. Kumar, P. Dhiman and M. Singh, Cation distribution: a key to ascertain the magnetic interactions in a cobalt substituted Mg–Mn nanoferrite matrix, Phys. Chem. Chem. Phys., 2017, 19(25), 16669–16680 RSC.
- J. Smit and H. P. J. Wijn, Ferrites, John Wiley & Sons, Pub Co N. Y., 1959, vol. 143 Search PubMed.
- S. G. Kakade, R. C. Kambale, C. V. Ramanna and Y. D. Kolekar, Crystal strain, chemical bonding, magnetic and magnetostrictive properties of erbium (Er3+) ion substituted cobalt-rich ferrite (Co1.1Fe1.9−xErxO4), RSC Adv., 2016, 6(40), 33308–33317 RSC.
- G. K. Williamson and W. H. Hall, Discussion of the theories of line broadening, Acta Metall., 1953, 1(22), 90006 Search PubMed.
- M. George, A. Mary John, S. S. Nair, P. A. Joy and M. R. Anantharaman, Finite size effects on the structural and magnetic properties of sol–gel synthesized NiFe2O4 powders, J. Magn. Magn. Mater., 2006, 302(1), 190–195 CrossRef CAS.
- L. Aswaghosh, D. Manoharan and N. V. Jaya, Defect structure and optical phonon confinement in ultrananocrystalline BixSn1−xO2 (x = 0, 0.03, 0.05, and 0.08) synthesized by a sonochemical method, Phys. Chem. Chem. Phys., 2016, 18(8), 5995–6004 RSC.
- A. Hadded, J. Massoudi, E. Dhahri, K. Khirouni and B. F. O. Costa, Structural, optical and dielectric properties of Cu1.5Mn1.5O4 spinel nanoparticles, RSC Adv., 2020, 10(69), 42542–42556 RSC.
- N. Chihaoui, R. Dhahri, M. Bejar, E. Dharhi, L. C. Costa and M. P. F. Graça, Electrical and dielectric properties of the Ca2MnO4−δ system, Solid State Commun., 2011, 151(19), 1331–1335 CrossRef CAS.
- G. E. Pike, ac Conductivity of Scandium Oxide and a New Hopping Model for Conductivity, Phys. Rev. B, 1972, 6(4), 1572–1580 CrossRef CAS.
- W. Hizi, H. Rahmouni, M. Gassoumi, K. Khirouni and S. Dhahri, Transport properties of La0.9Sr0.1MnO3 manganite, Eur. Phys. J. Plus, 2020, 135, 456 CrossRef CAS.
- M. F. Kotkata, F. A. Abdel-Wahab and H. M. Maksoud, Investigations of the conduction mechanism and relaxation properties of semiconductor Sm doped a-Se films, J. Phys. D: Appl. Phys., 2006, 39, 2059–2066 CrossRef CAS.
- S. Summerfield, Universal low-frequency behavior in the a.c. hopping conductivity of disordered systems, Philos. Mag. B, 1985, 52(1), 9–22 Search PubMed.
- O. N. Verma, P. K. Jha and P. Singh, A structural–electrical property correlation in A-site double substituted lanthanum aluminate, J. Appl. Phys., 2017, 122(22), 225106 CrossRef.
- N. Sivakumar, A. Narayanasamy, J.-M. Greneche, R. Murugaraj and Y. S. Lee, Electrical and magnetic behavior of nanostructured MgFe2O4 spinel ferrite, J. Alloys Compd., 2010, 504(2), 395–402 CrossRef CAS.
- M. M. Ahmad, K. Yamada and T. Okuda, Conductivity spectra and comparative scaling studies of polycrystalline PbSnF4, Solid State Ionics, 2004, 167(3), 285–292 CrossRef CAS.
- M. Amghar, A. Bougoffa, A. Trabelsi, A. Oueslati and E. Dhahri, Structural, morphological, and electrical properties of silver-substituted ZnAl2O4 nanoparticles, RSC Adv., 2022, 12, 15848–15860 RSC.
- C. W. Zheng, X. C. Fan and X. M. Chen, Analysis of Infrared Reflection Spectra of (Mg1−xZnx)Al2O4 Microwave Dielectric Ceramics, J. Am. Ceram. Soc., 2008, 91, 490–493 CrossRef CAS.
- Q. Wang, K. Xue, P. Fu, F. Du, Z. Lin, Z. Chen, S. Wang and G. Wang, Tunable dielectric properties of porous ZnAl2O4 ceramics for wave-transmitting devices, J. Mater. Sci.: Mater. Electron., 2019, 30, 6475–6481 CrossRef CAS.
- P. Singh, O. Parkash and D. Kumar, Scaling of low-temperature conductivity spectra of BaSn1−xNbxO3 (x ≤ 0.100): Temperature and compositional-independent conductivity, Phys. Rev. B, 2011, 84(17), 174306 CrossRef.
- B. Roling, A. Happe, K. Funke and M. D. Ingram, Carrier Concentrations and Relaxation Spectroscopy: New Information from Scaling Properties of Conductivity Spectra in Ionically Conducting Glasses, Phys. Rev. Lett., 1997, 78(11), 2160–2163 CrossRef CAS.
- J. C. Dyre and T. B. Schrøder, Universality of ac conduction in disordered solids, Rev. Mod. Phys., 2000, 72(3), 873–892 CrossRef.
- A. Ghosh and A. Pan, Scaling of the Conductivity Spectra in Ionic Glasses: Dependence on the Structure, Phys. Rev. Lett., 2000, 84(10), 2188–2190 CrossRef CAS PubMed.
- S. Halder, A. Dutta and T. P. Sinha, Time–temperature superposition in the grain and grain boundary response regime of A2HoRuO6 (A = Ba, Sr, Ca) double perovskite ceramics: a conductivity spectroscopic analysis, RSC Adv., 2017, 7, 43812–43825 RSC.
- F. Abdallah, A. Benali, M. Triki, E. Dhahri, M. P. F. Graça and M. A. Valente, Effect of annealing temperature on structural, morphology and dielectric properties of La0.75Ba0.25FeO3 perovskite, Superlattices Microstruct., 2018, 117, 260–270 CrossRef CAS.
- H. Rahmouni, M. Smari, B. Cherif, E. Dhahri and K. Khirouni, Conduction mechanism, impedance spectroscopic investigation and dielectric behavior of La0.5Ca0.5−xAgxMnO3 manganites with compositions below the concentration limit of silver solubility in perovskites (0 ≤ x ≤ 0.2), Dalton Trans., 2015, 44(22), 10457–10466 RSC.
- R. N. P. Choudhary and A. K. Thakur, AC impedance analysis of LaLiMo2O8 electroceramics, Phys. B, 2005, 355(1–4), 188–201 Search PubMed.
- C. Bharti and T. P. Sinha, Structural and ac electrical properties of a newly synthesized single phase rare earth double perovskite oxide: Ba2CeNbO6, Phys. B, 2011, 406(9), 1827–1832 CrossRef CAS.
- A. Dutta, C. Bharti and T. P. Sinha, Dielectric relaxation in Sr(Mg1/3Nb2/3)O3, Phys. B, 2008, 403(19), 3389–3393 CrossRef CAS.
- K. S. Cole and R. H. Cole, Dispersion and absorption in dielectrics I. Alternating current characteristics, J. Chem. Phys., 1941, 9(4), 341–351 CrossRef CAS.
- T. A. Abdel-Baset and A. Hassen, Dielectric relaxation analysis and Ac conductivity of polyvinyl alcohol/polyacrylonitrile film, Phys. B, 2016, 499, 24–28 CrossRef CAS.
- K. Padmasree, D. Kanchan and A. Kulkarni, Impedance and Modulus studies of the solid electrolyte system 20CdI2–80[xAg2O–y(0.7V2O5–0.3B2O3)], where 1 ≤ x/y ≤ 3, Solid State Ionics, 2006, 177, 475–482 CrossRef CAS.
- T. Badapanda, S. Sarangi, S. Parida, B. Behera, B. Ojha and S. Anwar, Frequency and temperature dependence dielectric study of strontium modified Barium Zirconium Titanate ceramics obtained by mechanochemical synthesis, J. Mater. Sci.: Mater. Electron., 2015, 26, 3069–3082 CrossRef CAS.
- H. Lin, R. P. Hania, R. Bloem, O. Mirzov, D. Thomsson and I. G. Scheblykin, Phys. Chem. Chem. Phys., 2010, 12, 11770–11777 RSC.
- A. Dutta, T. P. Sinha and S. Shannigrahi, Dielectric relaxation and electronic structure of Ca(Fe1/2Sb1/2)O3, Phys. Rev. B: Condens. Matter Mater. Phys., 2007, 76(15), 155113 CrossRef.
- J. S. Kim, Electric Modulus Spectroscopy of Lithium Tetraborate (Li2B4O7) Single Crystal, J. Phys. Soc. Jpn., 2001, 70(10), 3129–3133 CrossRef CAS.
- C. Bharti and T. P. Sinha, Dielectric properties of rare earth double perovskite oxide Sr2CeSbO6, Solid State Sci., 2010, 12(4), 498–502 CrossRef CAS.
- K. H. Natkaniec, M. O. M. Sghaier, P. Ławniczak, M. Z. Frączek, A. W. Braszak and S. Chaabouni, Electric properties and internal dynamics of the [C6H18N2] SbCl5 [C6H18N2] Cl2 in intermediate temperature phase (part II), Polyhedron, 2015, 85, 131–136 CrossRef.
- M. Atif, M. H. Alvi, S. Ullah, A. U. Rehman, M. Nadeem, W. Khalid, Z. Ali and H. Guo, Impact of strontium substitution on the structural, magnetic, dielectric and ferroelectric properties of Ba1−xSrxFe11Cr1O19 (x = 0.0–0.8) hexaferrites, J. Magn. Magn. Mater., 2020, 500, 166414 CrossRef.
- P. Behera and S. Ravi, Effect of Ni doping on structural, magnetic and dielectric properties of M-type barium hexaferrite, Solid State Sci., 2019, 89, 139–149 CrossRef CAS.
- A. Hooda, S. Sanghi, A. Agarwal and R. Dahiya, Crystal structure refinement, dielectric and magnetic properties of Ca/Pb substituted SrFe12O19 hexaferrite, J. Magn. Magn. Mater., 2015, 387, 46–52 CrossRef CAS.
- S. R. Elliott, Frequency-dependent conductivity in ionically and electronically conducting amorphous solids, Solid State Ionics, 1994, 70–71, 27–40 CrossRef CAS.
- A. Bougoffa, A. Benali, M. Bejar, E. Dhahri, M. P. F. Graça, M. A. Valente, L. Bessais and B. O. F. Costa, Mg-substitution effect on microstructure, dielectric relaxation and conduction phenomenon of Fe based perovskite nanomaterials, J. Alloys Compd., 2021, 856, 157425 CrossRef CAS.
- F. Elleuch, M. Triki, M. Bekri, E. Dhahri and E. K. Hlil, A-site-deficiency-dependent structural, magnetic and magnetoresistance properties in the Pr0.6Sr0.4MnO3 manganites, J. Alloys Compd., 2015, 620, 249–255 CrossRef CAS.
- R. Lahouli, J. Massoudi, M. Smari, H. Rahmouni, K. Khirouni, E. Dhahri and L. Bessais, Investigation of annealing effects on the physical properties of Ni0.6Zn0.4Fe1.5Al0.5O4 ferrite, RSC Adv., 2019, 9(35), 19949–19964 RSC.
- M. A. Dar, K. Majid, K. M. Batoo and R. K. Kotnala, Dielectric and impedance study of polycrystalline Li0.35−0.5XCd0.3NiXFe2.35−0.5XO4 ferrites synthesized via a citrate-gel auto combustion method, J. Alloys Compd., 2015, 632, 307–320 CrossRef.
- G. Abbas, A. U. Rehman, W. Gull, M. Afzaal, N. Amin, L. B. Farhat, M. Amami, N. A. Morley, M. Akhtar, M. I. Arshad, A. Ghuffar, A. Mahmood and M. Ibrahim, Impact of Co2+ on the spectral, optoelectrical, and dielectric properties of Mg0.25Ni0.25Cu0.5−xCoxFe1.97La0.03O4 ferrites prepared via sol–gel auto-combustion route, J. Sol-Gel Sci. Technol., 2022, 101(2), 428–442 CrossRef CAS.
|
| This journal is © The Royal Society of Chemistry 2023 |
Click here to see how this site uses Cookies. View our privacy policy here. 
 Open Access Article
 This Open Access Article is licensed under a Creative Commons Attribution-Non Commercial 3.0 Unported Licence
 a,
F. Mselmia,
H. Souissia,
S. Kammouna,
E. Dhahri
a,
F. Mselmia,
H. Souissia,
S. Kammouna,
E. Dhahri


 , that lowers as temperature rises, indicating a single relaxation peak at a certain frequency (fmax). The decrease in the peak of the relaxation frequency leads to a decrease in relaxation time,66 implying that the charge species are thermally activated and accumulate at the grain boundaries. The values of fmax are almost equal to the frequency values of inflexion points in Z′ curves (Fig. 10a). As a result, the Arrhenius behavior in the investigated compound is confirmed.67 Furthermore, we see that Z′′ plots merge at higher frequencies, which can be related to a space charge accumulation in the material, as the space charge polarization decreases with frequency.68 The activation energy was determined from the logarithmic variation of fmax as a function of 1000/T (shown in Fig. 10b), corresponding to the following Arrhenius law:69

 75 In contrast, carriers move freely within their potential wells in short distances76 in the high frequency region, above the maximum peak
  . Combining the plots of the imaginary part of impedance (Z′′) and modulus (M′′) vs. frequency, it is observed at 620 K the presence of low frequency relaxation (Fig. 12). In the process of conduction, the impacts of high resistance grain boundaries are illustrated by the variation of the imaginary electrical impedance (Z′′), while the impacts of low capacitance grains can be evaluated by plotting the imaginary modulus (M′′) in function of frequency. The curves of M′′ (Fig. 11b) show high frequency relaxation peaks, which correspond to the higher frequency peaks of the variation of Z′′ related to the relaxation frequency of mobile charge species. A peak relaxation at about 2500 Hz (Fig. 12) corresponds to the low frequency peak of Z′′ related to grain boundaries.


 are indicated by 2πfmax in the imaginary impedance (Z′′) plots.
 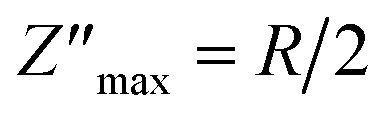 and RC = 1, respectively. Using these equations, the values of R and C for the analogous electrical circuit may be calculated from
  . The single semicircle appearance is attributed to a grain boundary effect.83 The CPE impedance is provided by the equation:84

 . The temperature-dependent resistivity coefficient for ZnAl1.95Cr0.05O4 compound plotted in Fig. 14 is used to determine the TCR factor. A negative TCR value −2.7% K−1 is found at 560 K. ZnAl1.95Cr0.05O4 compound has a higher TCR value compared to other values published in other works.85 This result shows that our compound is a good candidate for uncooled infrared bolometric applications and infrared detectors.