
 Open Access Article
 This Open Access Article is licensed under a Creative Commons Attribution-Non Commercial 3.0 Unported Licence
Degradation of hybrid material L,D-PLA![[thin space (1/6-em)]](https://www.rsc.org/images/entities/h2_char_2009.gif) :5CB:SWCN under the influence of neutral, acidic, and alkaline environments
:5CB:SWCN under the influence of neutral, acidic, and alkaline environments
Patryk Fryńa,
Sebastian Lalika,
Krzysztof A. Bogdanowicz b,
Natalia Górskac,
Agnieszka Iwan*d and
Monika Marzec*a
b,
Natalia Górskac,
Agnieszka Iwan*d and
Monika Marzec*a
aInstitute of Physics, Jagiellonian University, Łojasiewicza 11, 30-348 Kraków, Poland. E-mail: patryk.fryn@doctoral.uj.edu.pl; sebastian.lalik@doctoral.uj.edu.pl; monika.marzec@uj.edu.pl
bMilitary Institute of Engineer Technology, Obornicka 136, 50-961 Wrocław, Poland. E-mail: bogdanowicz@witi.wroc.pl
cFaculty of Chemistry, Jagiellonian University, Gronostajowa 2, 30-387 Kraków, Poland. E-mail: gorska@chemia.uj.edu.pl
dFaculty of Security and Safety Research, General Tadeusz Kościuszko Military University of Land Forces, Czajkowskiego 109, 51-147 Wrocław, Poland. E-mail: agnieszka.iwan@awl.edu.pl
First published on 26th January 2023
Abstract
The aim of the study was to investigate the influence of the environment's pH on the degradation of the layers of the ternary composite L,D-PLA![[thin space (1/6-em)]](https://www.rsc.org/images/entities/char_2009.gif) :5CB:SWCN (10:1:0.5, w/w/w), where L,D-PLA (poly(lactic acid)) is a biodegradable polymer, 5CB is a well-known liquid crystal (4′-pentyl-4-biphenylcarbonitrile), and SWCN are single-walled carbon nanotubes. For this purpose, the samples were stored in air, distilled water, and solutions of 0.1 M NaOH and 0.1 M HCl, for up to 62 days. Using differential scanning calorimetry, atomic force microscopy, and infra-red spectroscopy methods it was observed that for both neat L,D-PLA and composite layers there was a poor degradation process after the storage under standard air conditions, distilled water, and 0.1 M HCl solution, while the erosion of the surface layer kept in 0.1 M NaOH solution was revealed just after 6 days. The longer storage in 0.1 M NaOH solution resulted in complete degradation of the L,D-PLA polymer layer, while the composite layer survived for up to 62 days. The solubilization of the polymeric L,D-PLA matrix in the composite after 62 days was so severe that it resulted in the vanishing of thermal effects on the DSC curve except for one that was probably connected with the glass transition of the residual quantity of the polymer that remained in the layer or the isotropisation of 5CB. As a result, we have shown that admixtures of 5CB and SWCN accelerate the degradation of L,D-PLA in the composite layer due to the hydrophilic/hydrophobic interface in the layer and act as plasticizers. The mechanism of the degradation process is also discussed.
:5CB:SWCN (10:1:0.5, w/w/w), where L,D-PLA (poly(lactic acid)) is a biodegradable polymer, 5CB is a well-known liquid crystal (4′-pentyl-4-biphenylcarbonitrile), and SWCN are single-walled carbon nanotubes. For this purpose, the samples were stored in air, distilled water, and solutions of 0.1 M NaOH and 0.1 M HCl, for up to 62 days. Using differential scanning calorimetry, atomic force microscopy, and infra-red spectroscopy methods it was observed that for both neat L,D-PLA and composite layers there was a poor degradation process after the storage under standard air conditions, distilled water, and 0.1 M HCl solution, while the erosion of the surface layer kept in 0.1 M NaOH solution was revealed just after 6 days. The longer storage in 0.1 M NaOH solution resulted in complete degradation of the L,D-PLA polymer layer, while the composite layer survived for up to 62 days. The solubilization of the polymeric L,D-PLA matrix in the composite after 62 days was so severe that it resulted in the vanishing of thermal effects on the DSC curve except for one that was probably connected with the glass transition of the residual quantity of the polymer that remained in the layer or the isotropisation of 5CB. As a result, we have shown that admixtures of 5CB and SWCN accelerate the degradation of L,D-PLA in the composite layer due to the hydrophilic/hydrophobic interface in the layer and act as plasticizers. The mechanism of the degradation process is also discussed.
1. Introduction
With constant globalization, concerns about environmental issues are becoming an important factor to consider in relation to energy production and environmental pollution. Therefore, for 20 years, considerable emphasis has been placed on biodegradable materials based on polymer matrices, providing ecological solutions, and being a renewable source of materials.1 The specific recycling conditions for biodegradable materials are crucial.2In recent years, poly(lactic acid) (PLA), the most commercially used bioplastic in the world,3 is of great interest as a material for the production of biomedical materials and devices, such as implantable scaffolds, saturated threads,4,5 micro- and nanoparticles,6,7 and due to its hydrolytic degradation (compost degradation) also to remove non-toxic by-products in costly and multi-step industrial processes.8–10
It is important to understand the degradation process of biodegradable polymers when designing new materials and compositions that would retain their properties for a desired period of time and could be recycled quickly and efficiently.11–13 Poly(lactic acid) (PLA) has been considered a promising biodegradable polymer material due to easy processability, high strength, and biodegradability, which are required when used as a blend component with other materials, to solve the shortcomings. Therefore, the strategy of creating blends or mixtures of different polymers and/or nanomaterials showing good compatibility, which increases the adhesion between the phases or mixture components, seems a reason for the preparation of new biodegradable materials possessing tailored properties suitable for numerous applications.14,15 PLA, as a polymer component of various products, has been thoroughly studied. Life cycle assessment leads to a conclusion that this material is sustainable, renewable, and intended to be a low-carbon material in the future. Therefore, this material can make an important input into ecological safety by reducing the negative impact of anthropogenic factors on the environment by optimizing the recycling of the polymer blends containing more and more bio-friendly materials.3
Karamanlioglu et al. observed that PLA degrades slowly below its glass transition temperature. The studies on PLA films at room temperature and 40% relative humidity and at 55 °C under dry conditions revealed deterioration in mechanical properties by 68% or 34% and a decrease of crystallinity by 5% and 3%, respectively. Additionally, the degradation influenced the melting temperature by decreasing its value by 4 °C and caused the deformation of CH signals observed in FTIR spectra.16
Liu et al. investigated the degradation process for poly(L,D-lactic acid) depending on the temperature, both under air and nitrogen conditions, and observed that the degradation process occurs in two or three stages. In the first step, oligomers containing carboxyl groups are formed (self-hydrolysis) and are not affected by the atmosphere. In the second stage, after the oligomers have evaporated, the thermo-oxidation process occurs, which reduces the activation energy. The third thermal stage was observed in the nitrogen atmosphere for samples above 200 °C and was assigned to the presence of carboxylic groups, as acidic catalysts, coming from degradation products (monomers).17
The effect of pH on the degradation of PLA oligomers was investigated and it was noticed that the degradation process occurred as an acid-, base- or non-catalyzed process. The acid catalysed process was observed at a pH of 1 to approx. 4, followed by a non-catalytic process, which depended on the oligomer length, and base catalysis above pH 5 for oligomers with n > 4. The longest non-catalytic stage was observed for dimers.18
Luo et al. studied the biodegradation of the samples based on poly(lactic acid) with and without the addition of titanium dioxide in the form of anatase filler. The studies were carried out for 90 days on samples under controlled conditions. It was found that the addition of the inorganic filler did not affect the degradation mechanism, which was identified as heterogeneous, as indicated by an increase in the crystallinity of the polymer. The high content of TiO2 accelerates the degradation rate, most likely due to the easier access of water to the blend structure.19
In turn, Marra et al. compared the effect of TiO2 and ZnO additions on the PLA degradation process in various media. The polymer matrix was admixed with nanoparticles in the range of 2–5 wt% and under isothermal conditions subjected to UV radiation and of 1 M NaOH solution and solution of proteinase K. They found that the addition of both types of nanoparticles accelerated the degradation of the polymer. Under basic conditions, ZnO accelerated the process, while TiO2 acted rather as an inhibitor. The enzymatic hydrolysis occurred faster for the PLA:TiO2 and slower for the PLA:ZnO composition.20
Czarnecka-Komorowska et al. studied the PLA composites with a content of 1, 2.5, or 5 wt% halloysite nanotubes, in order to evaluate the mechanical properties of the new composite materials over time (composting process). They observed that the composite material, especially with a content of 5 wt% showed a loss of mass and a decrease of viscosity, increased fragility and cracks, and even delamination after 30 days.21
The degradation process of the PLA:carbon nanotube composites, as a potential biomedical material, has been investigated only in an aqueous environment. During the incubation of the composite material, swelling and partial degradation were noted due to the penetration of water into the polymer matrix. The changes in the mechanical properties of the composite in the form of mats were also greater compared with the mats of neat PLA. The 14 day incubation reduced the strength of the sample from 47 to 78% of the initial value. The authors did not provide any important data regarding the crystallinity, wettability, and porosity of the samples and their influence on the degradation process.22
To summarize, nowadays the use of biopolymers in blends is becoming a necessity in order to improve ecological safety. It is well known that poly(lactic acid) (PLA) is a biodegradable material with lower greenhouse gas emissions. In our previous article23 we described the properties of the three-component composites L,D-PLA:5CB:SWCN with different proportions of components. We have shown that the addition of 5CB to the L,D-PLA matrix in the proportion of 1:10 (w/w) results in an increase of flexibility, and in combination with the conductive nature of single-walled carbon nanotubes the L,D-PLA:5CB:SWCN composite with a ratio of 10:1:0.5 (w/w/w) exhibits the lowest resistance (41.0 Ω) and thermal stability in air condition up to a temperature of 160 °C.
In this study, knowing how L,D-PLA degrades under alkaline conditions,24 we focused on how the addition of SWCN and 5CB influences this degradation. We have evaluated the influence of the environment at different pH values on the layer containing the biodegradable polymer L,D-PLA in the form of a ternary composition L,D-PLA:5CB:SWCN (10:1:0.5 w/w/w). To this end, changes in mass, thermal properties, infrared spectra, and the surface topography of the layers were studied in detail. The samples were stored for up to 62 days under various conditions including, air conditions in a fume cupboard, distilled water, 0.1 M NaOH, and 0.1 M HCl solutions. To our knowledge, this is the first work studying the influence of both 5CB and SWCN on the degradation of the L,D-PLA layer. We have shown that the composite layer still degrades similarly to a neat L,D-PLA layer in three environments (water, air, and acidic) but after 62 days, the L,D-PLA layer in alkaline environments completely degrades while the composite layer remains continuous (Proikakis et al. also observed a weight loss of approx. 70% after 45 days in an alkaline environment24). We have also demonstrated that the nature of additives, in this case, hydrophobic 5CB and SWCN, has a significant impact on the degradation rate, which is an important finding not described in the literature.
2. Materials and methods
2.1. Materials
L,D-Poly(lactic acid) (L,D-PLA) was used as received from Galactic. 4′-Pentyl-4-biphenylcarbonitrile (5CB), and single-walled carbon nanotubes (SWCN) were used as received from Sigma-Aldrich (Saint Louis, Missouri, USA). The SWCN used had an average diameter of 0.84 nm, a median length of 1 μm, and ≥95% carbon basis (≥99% as carbon nanotubes). Chloroform (98.5%) was used as received from POCH. Hydrochloric acid and sodium hydroxide were used as received from STANLAB.L,D-PLA: FT-IR [cm−1]: 2995 m νas(CH3), 2965 sh ν(CH3), 2944 m νs(CH3), 2879 w, 2861 w, 1748 s ν(C![[double bond, length as m-dash]](https://www.rsc.org/images/entities/char_e001.gif) O), 1722 sh, 1453 m δas(CH3), 1382 m δs(CH3), 1360 m δs(CH3), 1302 w, br δ(CH), 1268 m ν(C–O), 1209 sh, 1180 s νs(C–O–C), 1127 s ν(C–O), 1081 s νas(C–O–C), 1043 s ν(C–O), 1020 sh, 956 w, 919 w, 896 w, 869 m ν(C–C), 847 sh, 754 m ν(C–C), 735 sh, 706 br, 669, (s – strong, m – medium, w – weak, br – broad, sh – shoulder).25
O), 1722 sh, 1453 m δas(CH3), 1382 m δs(CH3), 1360 m δs(CH3), 1302 w, br δ(CH), 1268 m ν(C–O), 1209 sh, 1180 s νs(C–O–C), 1127 s ν(C–O), 1081 s νas(C–O–C), 1043 s ν(C–O), 1020 sh, 956 w, 919 w, 896 w, 869 m ν(C–C), 847 sh, 754 m ν(C–C), 735 sh, 706 br, 669, (s – strong, m – medium, w – weak, br – broad, sh – shoulder).25
2.2. Experimental methods
The thermal properties of L,D-PLA, and the composite layers were studied using the differential scanning calorimetry (DSC) method. DSC curves were registered using the PerkinElmer Diamond 8000 calorimeter (PerkinElmer, Waltham, MA, USA) to study changes in the transition temperatures depending on the environment and time. The samples, ca. 5 mg, were sealed using a press in 30 μL aluminium vessels. The measurements were performed both by heating and cooling at 10 °C min−1 rate. At least three cycles of heating and cooling were performed for each sample to ensure the repeatability of the results.The surface topography of L,D-PLA and composite layers was studied sing atomic force microscopy (AFM) Agilent 5500 (Agilent Technologies, Santa Clara, CA, USA) working in the non-contact mode. Parameters such as setpoint, proportional gain, integral gain, and speed were adjusted during each measurement to obtain the best possible images. Images were collected at several randomly chosen areas for each sample and image processing was performed using the Gwyddion.26
Infra-red spectra of the layers kept under various environments were recorded at room temperature using a Thermo Scientific™ Nicolet™ iS5 spectrometer equipped with an iD5 ATR accessory (Thermo Fisher Scientific, Waltham, MA, USA) in the range of 550–4000 cm−1, with a spectral resolution of 2 cm−1 and at 32 scans per spectrum (FT-IR). The spectra were collected using the OMNIC 8.3 software while full spectrum processing was performed using Bruker Opus 7.0.
The samples were weighed using a Sartorius Cubis MSA125P-1CE-DU analytical balance (Sartorius Weighing Technology GmbH, Goettingen, Germany) with an accuracy of 0.01 mg.
2.3. Preparation of layers
Layers of L,D-PLA, and composite were prepared by the drop-casting method in a five-step procedure: in the first step, the appropriate amount of polymer (ca. 2 g per layer) was added to 30 mL of chloroform. Next, the admixture of SWCN (ca. 100 mg) and 5CB (ca. 200 mg) was added in the case of the hybrid layer. The solutions of L,D-PLA and composite were mixed with a magnetic stirrer for at least 2 hours and followed by sonication (Ultrasonic Processors—VCX500, tip 6 mm) for 30 min. The created mixture was poured onto a Petri dish with a diameter of 16 cm and left in a fume cupboard for evaporating the chloroform. Finally, ready layers were cut into smaller pieces (ca. 1 cm × 1 cm). Small pieces of neat L,D-PLA, and the composite were placed under different conditions:• 12 pieces under standard air conditioning in the fume cupboard.
• 15 pieces in distilled water (pH = 6.93 ± 0.12).
• 15 pieces in 0.1 molar NaOH aqueous solution (pH = 12.63 ± 0.07).
• 15 pieces in 0.1 molar HCl aqueous solution (pH = 1.19 ± 0.06).
Then, after a set time (1, 6, 13, 29, and 62 days), 3 samples of neat L,D-PLA and 3 samples of the composite were taken from each environment (distilled water, acidic and alkaline solutions). After gently wiping, the samples were weighed and studied by AFM, DSC, and FT-IR. At the same time, samples left in the fume cupboard were also studied. The scheme of the sample preparation for measurements is presented in Fig. 1, while the mean masses of the samples determined at the beginning of the experiment are shown in Table 1.
 | ||
| Fig. 1 The scheme of sample preparation for measurements. | ||
| Environment |
|
|
|---|---|---|
| L,D-PLA | Composite | |
| Air | 36.60 ± 16.07 | 40.81 ± 7.55 |
| H2O | 23.43 ± 17.77 | 24.96 ± 13.52 |
| 0.1 M NaOH | 29.72 ± 19.03 | 27.63 ± 12.18 |
| 0.1 M HCl | 21.55 ± 18.72 | 24.08 ± 12.44 |
3. Results and discussion
Photos of the polymer L,D-PLA, and the composite layers after exposure to various environmental conditions for 62 days are presented in Fig. 2. Only in the case of the L,D-PLA layer stored in 0.1 M NaOH solution, the last surviving layer is shown, i.e., after 29 days (Fig. 2c). Regardless of the environment, all L,D-PLA layers became partially tarnished, (the most was the layer kept in 0.1 M NaOH solution, Fig. 2b–d). On the other hand, the composite layers kept in distilled water and 0.1 M HCl solution did not differ much from each other and from the reference layer deposited in the fume cupboard (Fig. 2e–g). The composite layer became very brittle and cloudy after 62 days in 0.1 M NaOH solution (Fig. 2h). | ||
| Fig. 2 The layers of L,D-PLA (a–c), and composite (e–h) after 62 days in various environments and the L,D-PLA layer after 29 days in an alkaline environment (d). | ||
3.1. Mass loss
During the degradation studies, the changes in the mass of the samples exposed to environments with different pH changes with time were studied. For this purpose, the average mass loss and the average relative mass loss of the studied samples are presented as a function of time (Fig. 3 and 4). Since the mass loss is proportional to the initial mass, the mean relative mass loss over time is shown. The layers kept in the air in a fume cupboard were taken as a reference. The average mass loss and the average relative mass loss as a function of time for the L,D-PLA, and composite layers kept in the air are presented in Fig. 3a and b, respectively. It was seen that the L,D-PLA, and composite layers poorly degrade in the same way in the air within the limits of uncertainty and there were no significant differences between them. | ||
| Fig. 3 Mean absolute (a) and relative (b) mass loss of L,D-PLA, and composite layers kept in the air. | ||
 | ||
| Fig. 4 Mean absolute (a and c) and relative (b and d) mass loss of L,D-PLA, and composite, respectively, in various environments. The legend in (c) is the same for all graphs. | ||
A comparison of the mass losses of the L,D-PLA, and composite layers for environments with different pH is presented in Fig. 4. There is a slight change in the mass in the aquatic environment in relation to the reference sample kept in the air, while the largest change is for the 0.1 M aqueous NaOH solution. All L,D-PLA layers placed in 0.1 M NaOH for longer than 30 days completely degrade. Thus, the alkaline environment strongly degrades the L,D-PLA polymer layers. Similarly, for the composite, the mass loss in the alkaline medium was the fastest of all environments (Fig. 4c and d) but no complete degradation of the layer was observed after 62 days, as it was for the undoped L,D-PLA polymer layer. However, the rate of mass loss over time was faster for the composite than for the L,D-PLA polymer in an alkaline environment (see Fig. 3d and 4b). On the other hand, within the uncertainty, the loss of mass of the composite layers in time, both in distilled water, acid solution, and in the air, was the same.
These phenomena can be explained by the specific composition of the ternary composite, namely, the presence of two hydrophobic components 5CB and SWCN. We suppose that the structure of L,D-PLA in the ternary composition differs from that of the neat polymer because 5CB and SWCN affect the rearrangement of the polymer chains in the layer. Taking into account the affinity of the methyl group in the polymer repetitive unit to hydrophobic additives, it is very likely that formed dispersion causes the exposition of ester groups to the surface and is probably due to the formation of ester domains. This rearrangement probably results in the formation of looser structures than in a neat polymer, making the composite structure more susceptible to water penetration and washout. In the presence of an alkali environment, the greatest loss of mass was found because degradation in an alkali solution promotes the formation of carboxylic salts, more soluble than carboxylic compounds.27 Therefore, in this case, both surface and in-bulk degradation of the layer occurs. The degradation rate strongly depends on the environment and solubility/dispersity of degradation by-products demonstrating the tendency of alkali ⋙ water ≥ acidic. It seems that the acidic environment reduces the solubility/dispersion of products containing carboxyl end groups.
Finally, we should stress here that the studied samples were in the form of layers with an area of 1 × 1 cm2 and were studied at a temperature below Tg, as such, we deal here mainly with the mechanism of surface degradation, but it is possible that swelling could have a marginal influence on this degradation (however, we did not observe any increase in mass, characteristic of swelling).
3.2. DSC study
The DSC curves for the L,D-PLA, and composite layers kept in the aqueous, alkaline, acidic, and air environments recorded after 62 days are presented in Fig. 5. An exception is the DSC curve recorded for the L,D-PLA polymer layer kept in an alkaline environment, which was recorded after 30 days, since, as previously shown, these layers degrade completely over a period of more than 30 days. As is seen, all DSC curves are very similar for the L,D-PLA, regardless of the environment (Fig. 5a and b), with only a slight shift of the onset (Tonset) and end (Tend) temperatures, corresponding to the melting of the polymer, is visible.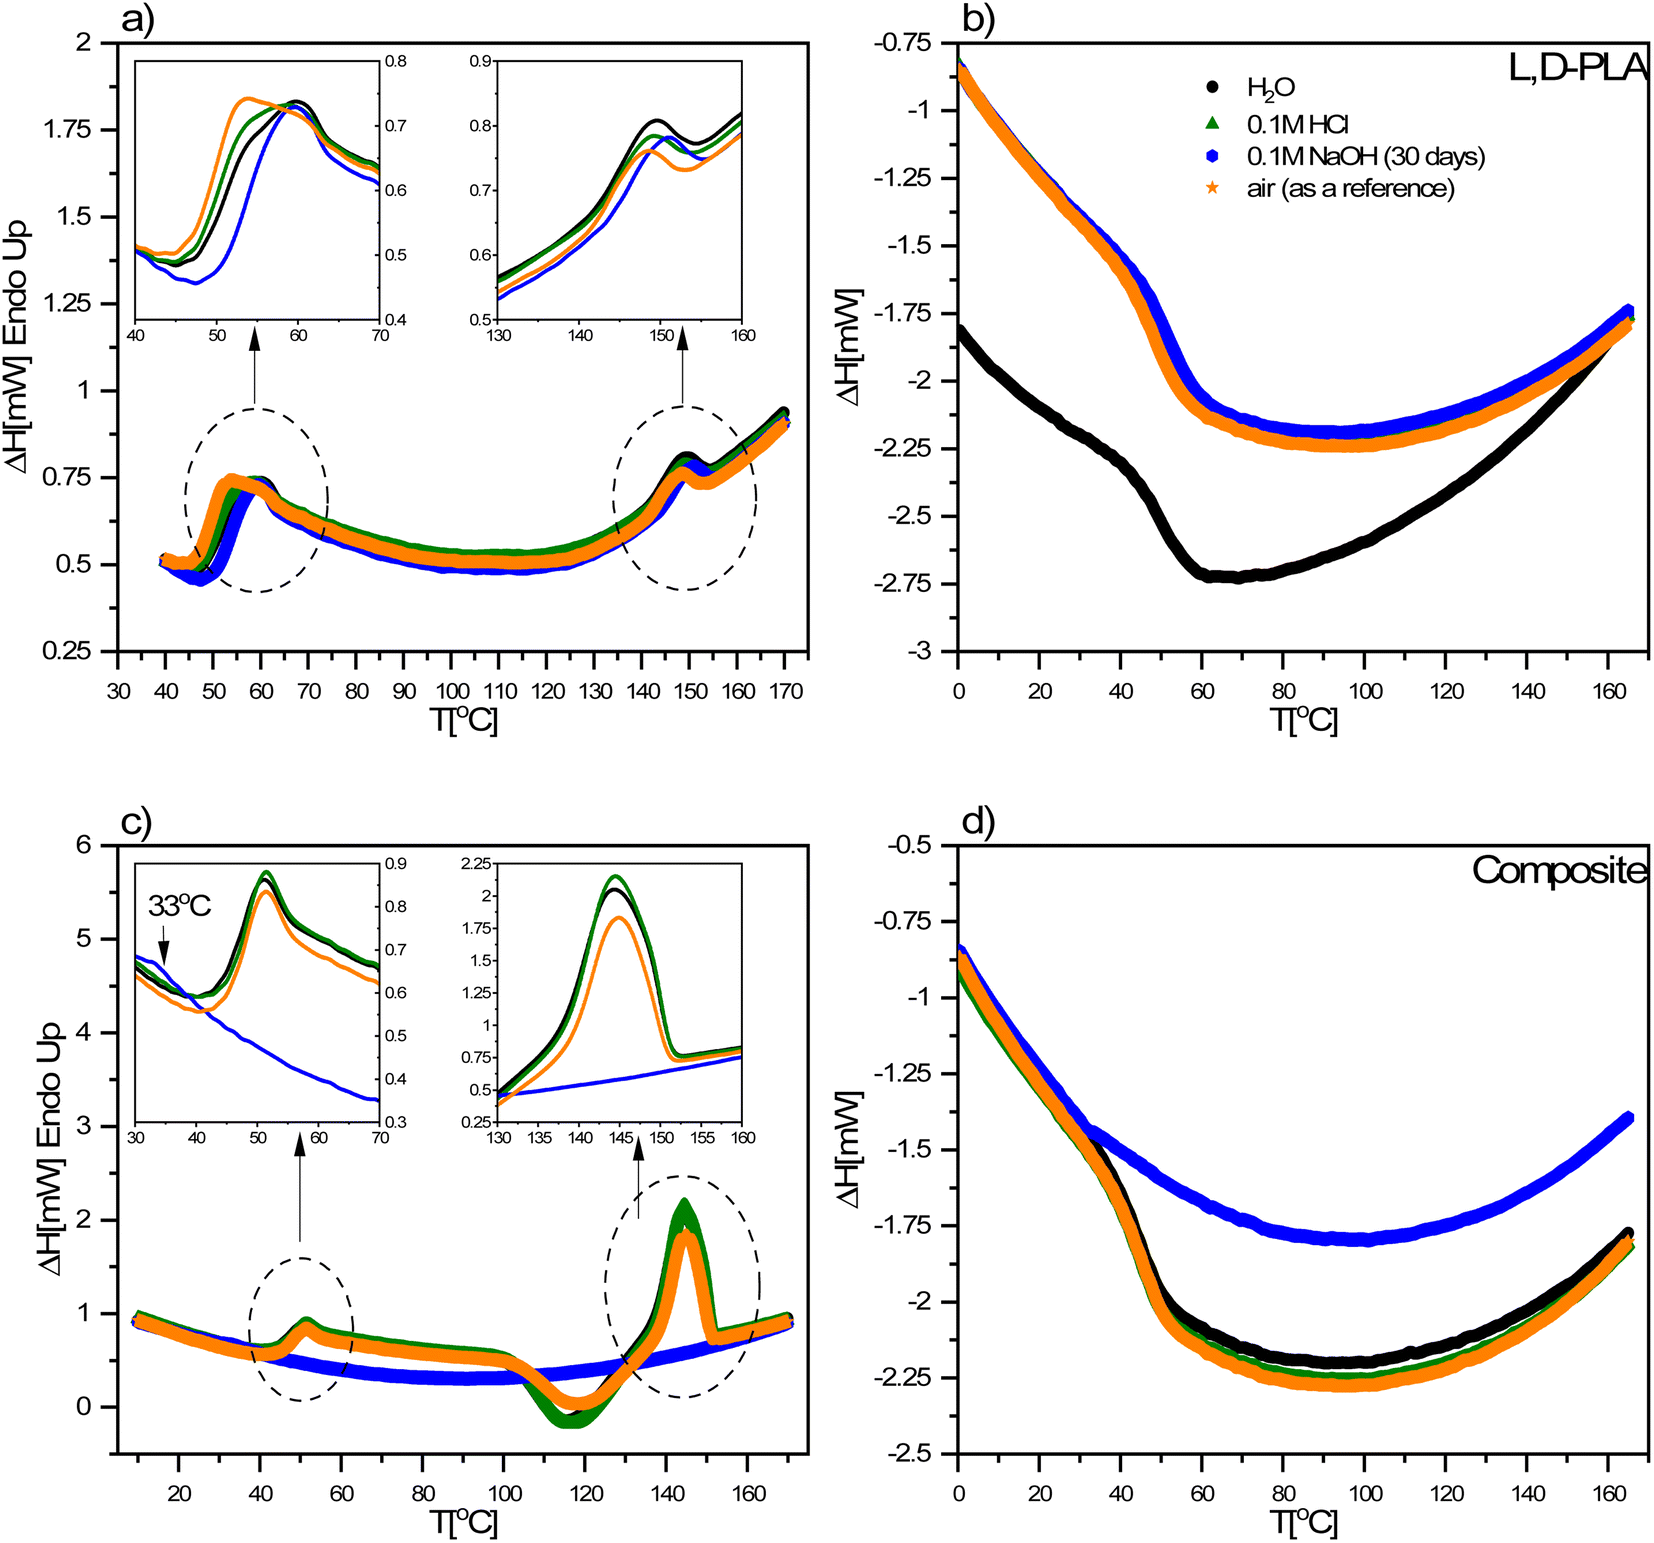 | ||
| Fig. 5 DSC curves registered during heating (a and c) and cooling (b and d) for L,D-PLA, and composite, respectively after 60 days under different conditions. The legend in (b) is the same for all graphs. | ||
For the layer kept in the 0.1 M NaOH aqueous solution, this shift in temperatures is the greatest. All the determined thermal parameters for L,D-PLA (regardless of the environment) are consistent with the literature data for the neat L,D-PLA, which suggests that degradation does not reduce the polymer molar mass Mw (which could be manifest by a significant shift in the melting point and broadening transitions).28 Considering the possibility of solubilizing L,D-PLA in these environments, it can be assumed that the described mass loss is mainly related to polymer solubilization and, therefore, the thermal properties of the remaining polymer are almost like in the pristine form.
The discrepancy between the Tg temperature for the neat PLA determined by us and Jia et al.29 (49 °C and 62 °C) may result from many factors, e.g., different polydispersity and chemical purity of the PLA used, the use of the solvent for the preparation of layers and a long time of sonification, being kept in the air for 60 days or high-pressure treatment (of ca. 5 MPa) as well as higher temperatures than 170 °C and vacuum drying at 60 °C for 8 h.
An unexpected behaviour was noted for the composite layer exposed to a 0.1 M NaOH aqueous solution. All thermal effects coming from the polymer are not visible on DSC curves (Fig. 5c and d), which may indicate a significant degradation of the L,D-PLA polymer chain into smaller fragments (oligomers) and their elution from the layer into the solution. In turn, the small anomaly visible at ca. 33 °C (left inset in Fig. 5c) may be the result of the glass transition of the residual quantity of the polymer that remained in the layer or of the liquid crystalline dopant (5CB). Given the mass loss of the sample after 29 days in an alkaline environment and assuming that it was due to the solubilization of the polymer matrix (polymer chains are broken: ester bonds break, oligomers are formed and dissolve), the remainder of the layer would have a different component ratio, roughly 0.8:1.0:0.5 (L,D-PLA:5CB:SWCN). This explains why the thermal effects from the polymer are not visible in the DSC curve (the ratio between the polymer matrix and the plasticizers has changed drastically and too small polymer content does not produce thermal effects). Considering the above aspects into account, the DSC curve shows the behaviour characteristics of a mixture in which the main component is the liquid crystal 5CB, which is in line with the literature report for the mixture of 5CB with carbon nanotubes.30 In the case of composite layers kept in other environments, a slight shift in the phase transition temperatures was observed (Table 2). A decrease in the Tg temperature in the composite is also observed in relation to the neat L,D-PLA, therefore, 5CB and SWCN act as plasticizers and plasticize the polymer.31 These results confirmed the above-mentioned degradation mechanism of the ternary composite.
| Environment | Tg [°C] | ΔCp [J (g °C)−1] | Tonset [°C] | Tend [°C] | ΔH [J g−1] | Xc [%] | ||
|---|---|---|---|---|---|---|---|---|
| L,D-PLA | Heating | H2O | 50.8 | 0.465 | 141.8 | 153.8 | 0.807 | 0.861 |
| HCl | 50.3 | 0.380 | 142.0 | 153.6 | 0.681 | 0.727 | ||
| NaOH (30 days) | 53.0 | 0.435 | 143.4 | 155.0 | 0.774 | 0.826 | ||
| Air | 48.9 | 0.440 | 141.5 | 152.8 | 0.701 | 0.748 | ||
| Cooling | H2O | 51.7 | 0.393 | — | — | — | — | |
| HCl | 51.3 | 0.519 | — | — | — | — | ||
| NaOH (30 days) | 53.3 | 0.378 | — | — | — | — | ||
| Air | 50.5 | 0.421 | — | — | — | — | ||
| Composite | Heating | H2O | 45.9 | 0.388 | 136.7 | 151.3 | 17.465 | 21.434 |
| HCl | 46.7 | 0.370 | 137.3 | 151.4 | 18.069 | 22.176 | ||
| NaOH | — | — | — | — | — | — | ||
| Air | 46.4 | 0.404 | 137.9 | 151.0 | 13.677 | 16.785 | ||
| Cooling | H2O | 45.7 | 0.378 | — | — | — | — | |
| HCl | 46.4 | 0.384 | — | — | — | — | ||
| NaOH | — | — | — | — | — | — | ||
| Air | 46.7 | 0.399 | — | — | — | — | ||
It should be noted here that on the DSC curves registered during heating for all L,D-PLA layers, only the glass transition and melting point are visible, while the cold crystallization is not (Fig. 5a). In turn, the glass transition and melting point, as well as cold crystallization, were registered for composite layers kept in all environments except the alkaline solution (Fig. 5c). This lack of cold crystallization in neat L,D-PLA and its presence in the composite are not fully understood by us yet, but were also observed by other researchers.32 However, there are also reports of a twofold situation, i.e., the existence of cold crystallization on the DSC curve for neat PLA, and its disappearance with increasing admixture.32,33 Additionally, crystallization is not visible in the cooling curves for both L,D-PLA, and the composite, which may indicate a much lower crystallinity of the L,D-PLA polymer used by us than that used by other researchers.32,33 Therefore, based on the DSC results, we calculated the crystallinity Xc of the L,D-PLA polymer both in neat polymer and composite layers kept in various environments:34
 | (1) |
3.3. AFM study
Images of the surface topography of the L,D-PLA, and composite layers after 29 days in the air, distilled water, and 0.1 M HCl aqueous solution are shown in Fig. 6, while the influence of 0.1 M NaOH aqueous solution on the surface topography is shown in Fig. 7 and 8.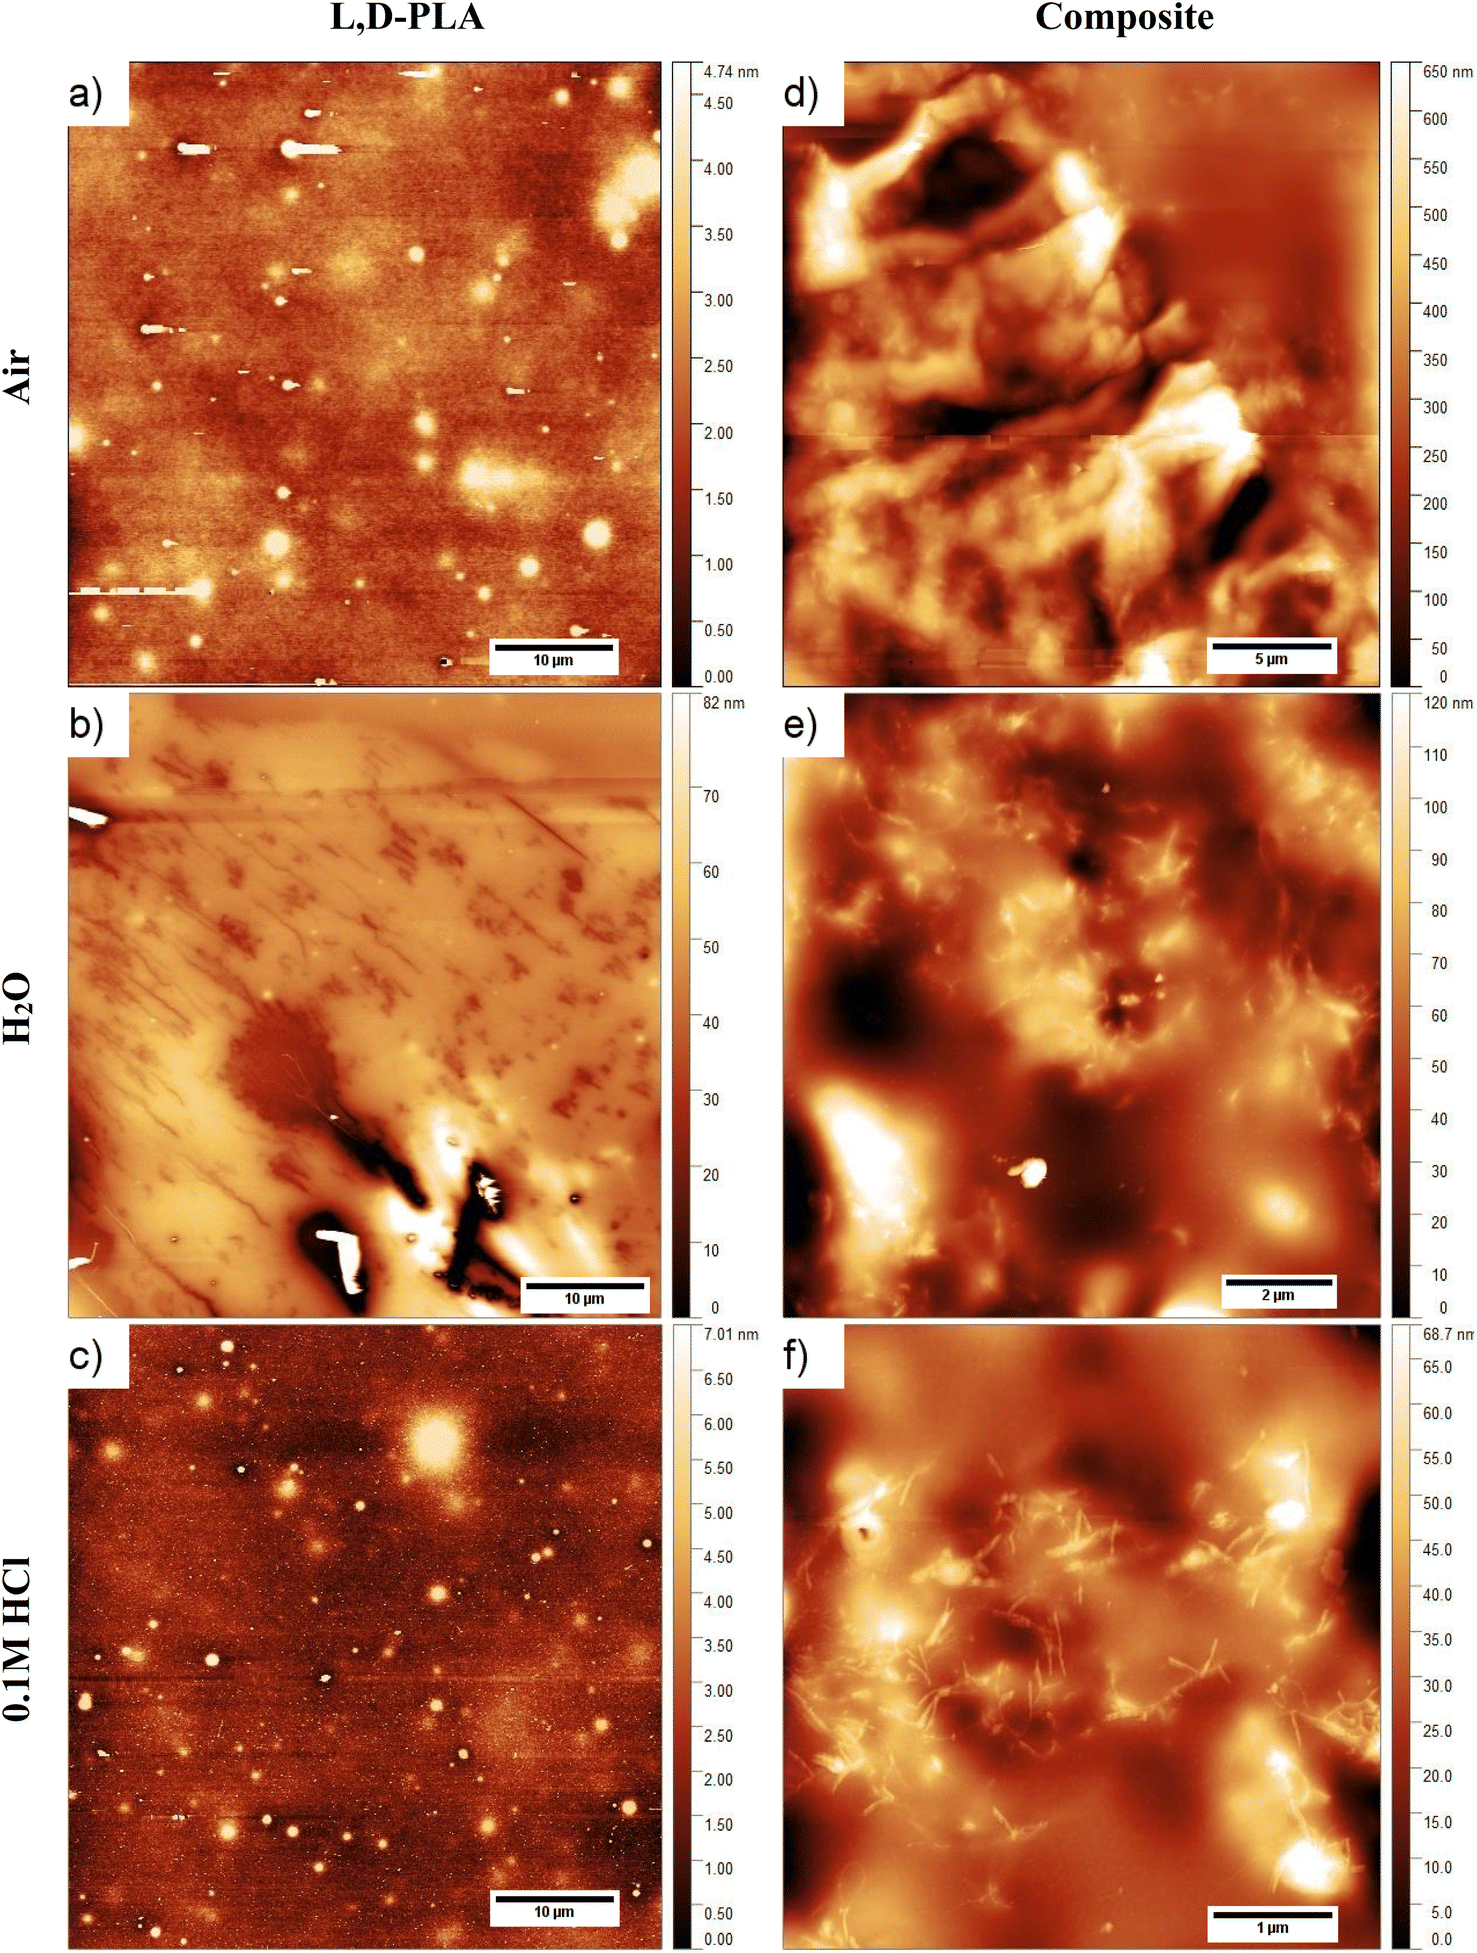 | ||
| Fig. 6 Surface topography of the L,D-PLA (a), and composite (d) layers just after layer formation, and of L,D-PLA (b and c) and composite (e and f) layers after 29 days in various environments. | ||
 | ||
| Fig. 7 Surface topography of the L,D-PLA layers after 1 (a), 6 (b), 13 (c), and 29 (d) days in 0.1 M NaOH solution. | ||
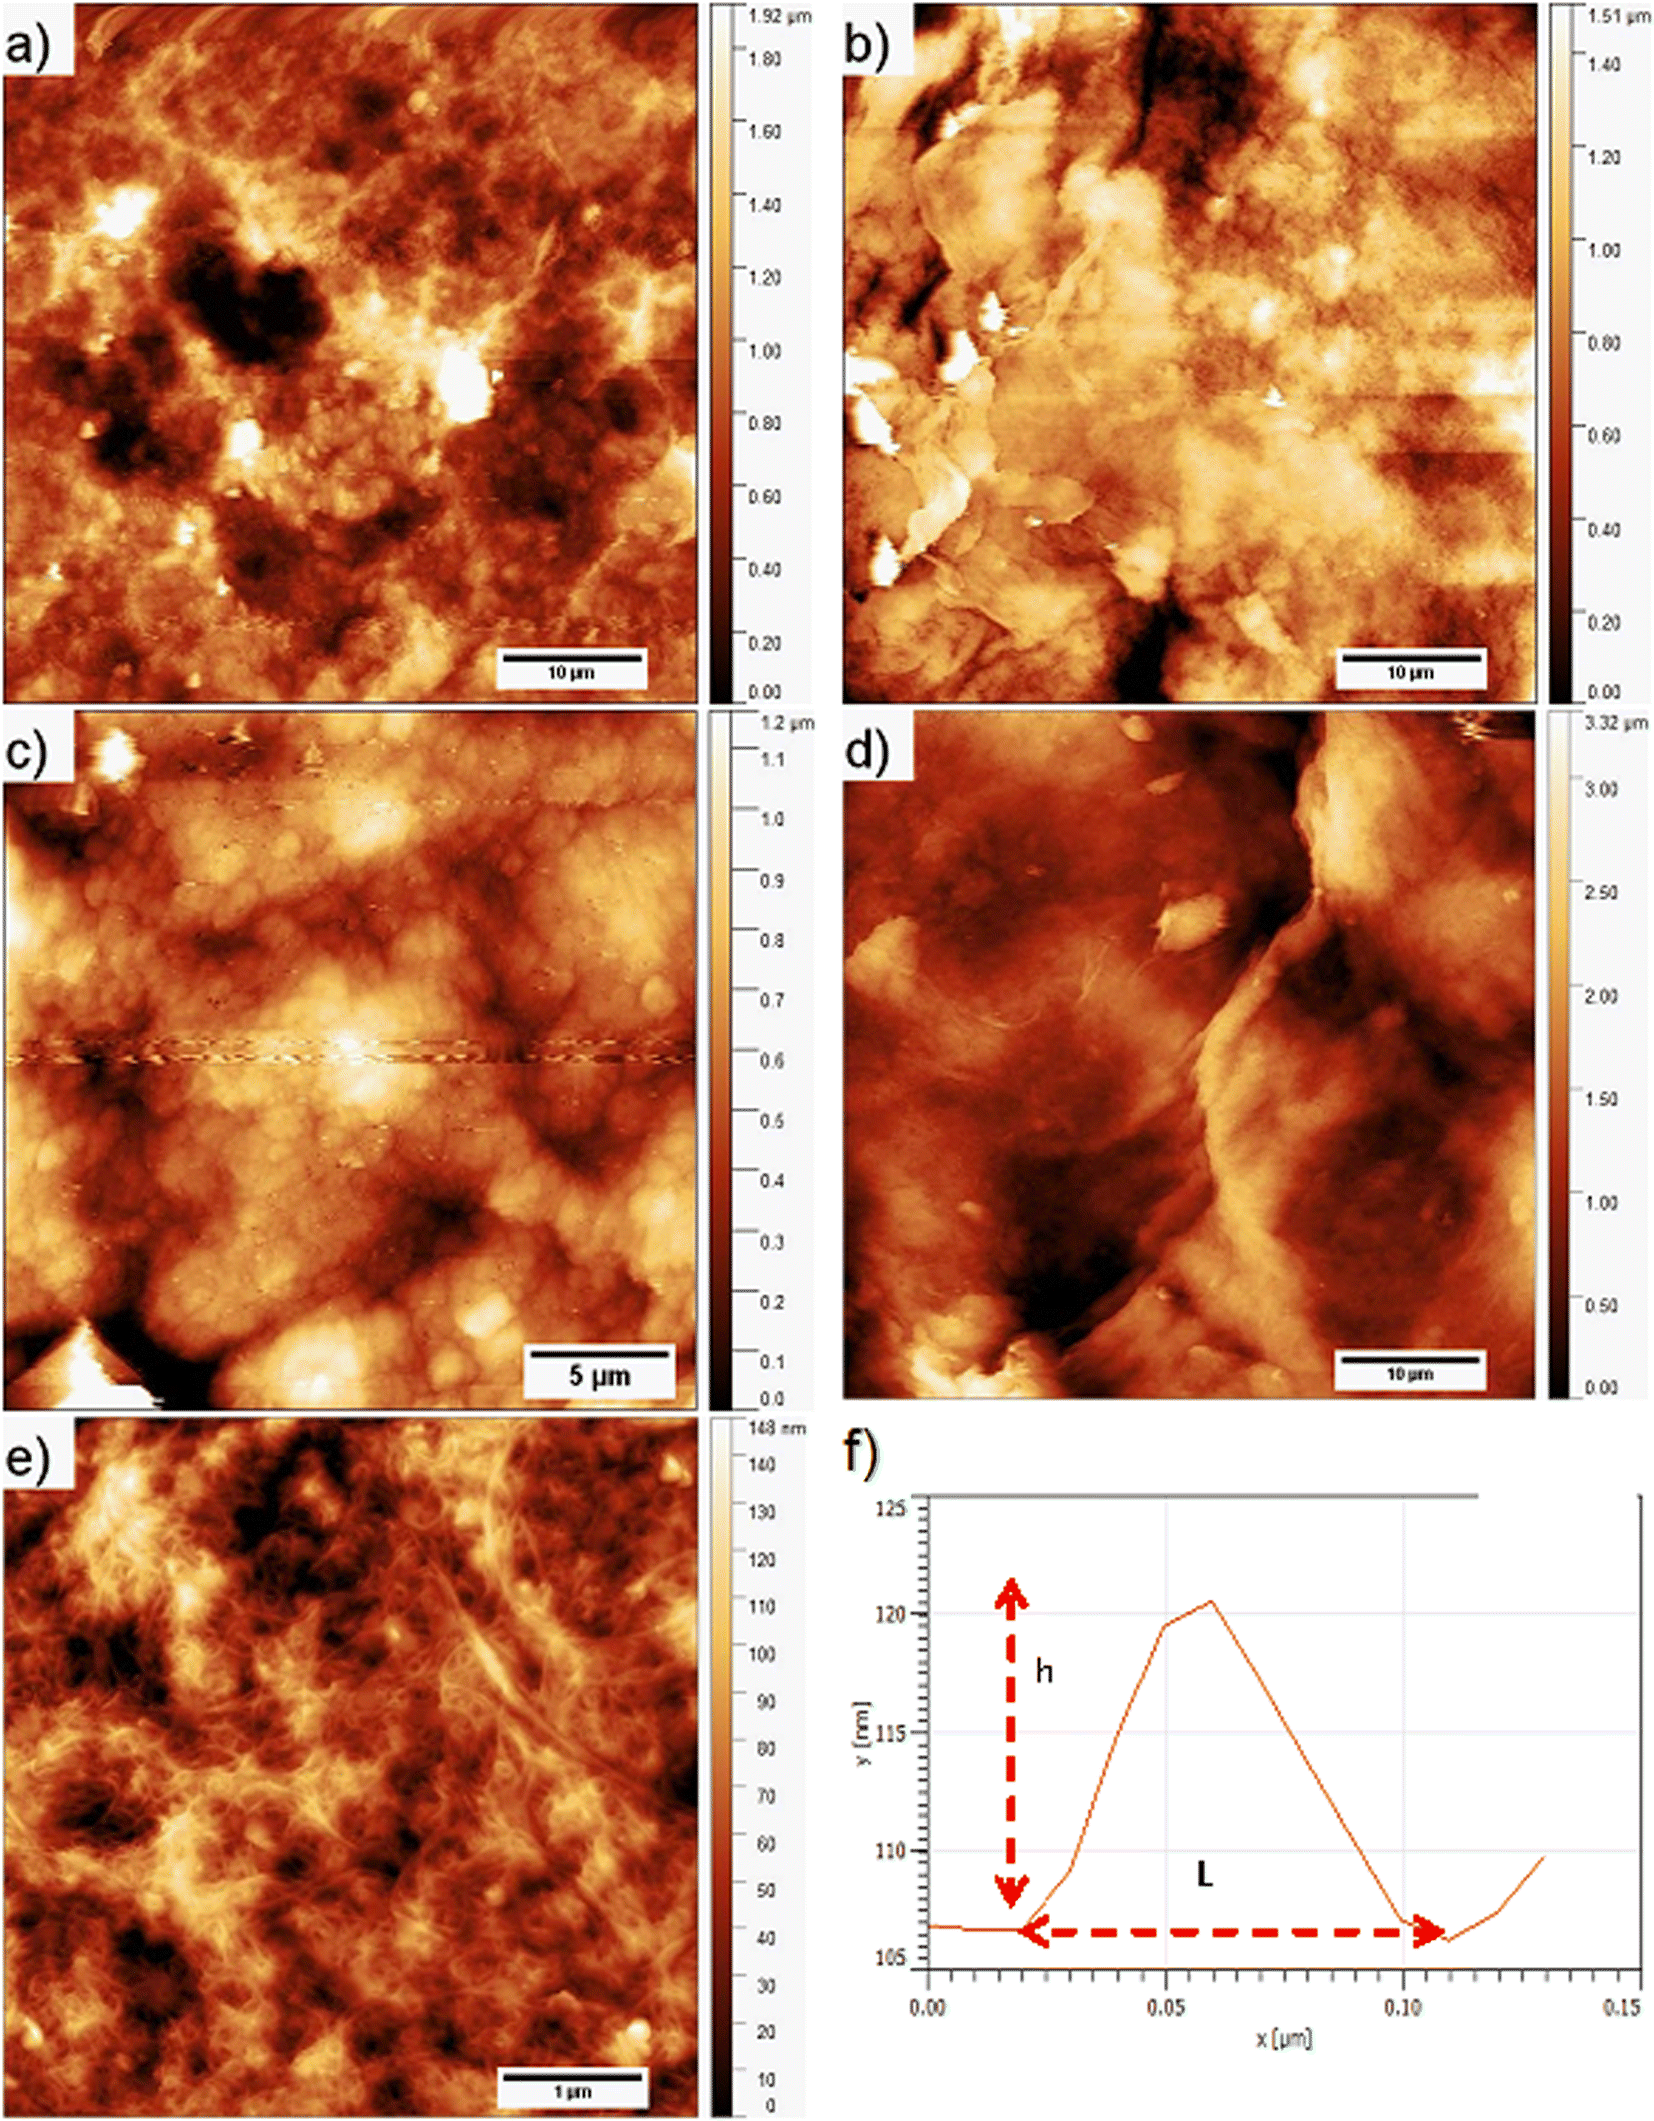 | ||
| Fig. 8 Surface topography of the composite layer after 1 (a), 6 (b), 13 (c), and 29 (d and e) days in 0.1 M NaOH aqueous solution together with an example of the determination of h and L from the AFM profile (f). | ||
In the case of the layers kept in the air, the L,D-PLA polymer layer has a continuous and smooth surface (low roughness coefficients, see Table 3, Fig. 6a), while on the surface of the composite layer randomly dispersed objects in a form of the bundle are clearly visible (Fig. 6d). The effect of distilled water after 29 days on the L,D-PLA layer results in the appearance of fine cracks (Fig. 6b), the roughness parameters also increased by an order of magnitude (Table 3), which suggests significant changes on the surface. The degradation in water may be related to the self-catalyzed hydrolysis of L,D-PLA (the presence of carboxylic acid end groups catalyses the breaking of the ester bonds). The released proton ions break the chain, allowing the oligomers formed to be solubilized.11 The AFM observation of the composite layers did not reveal any surface changes after exposure to distilled water (Fig. 6e). Most likely, the use of additives such as 5CB allows the formation of a more stable structure, restricting the access to the carboxylic end groups.
| Environment | Day | Sq [nm] | Sa [nm] | Surface [μm2] | |
|---|---|---|---|---|---|
| L,D-PLA | Air | 0 | 0.89 | 0.69 | 2500 |
| H2O | 29 | 11.16 | 7.61 | 2500 | |
| 0.1 M HCl | 29 | 0.69 | 0.51 | 2500 | |
| 0.1 M NaOH | 1 | 58.37 | 38.57 | 2500 | |
| 6 | 429.50 | 338.84 | 2500 | ||
| 13 | 419.74 | 337.37 | 2500 | ||
| 29 | 935.63 | 733.96 | 9676 | ||
| Composite | Air | 0 | 122.89 | 93.12 | 625 |
| H2O | 29 | 20.95 | 17.16 | 126 | |
| 0.1 M HCl | 29 | 10.55 | 8.14 | 25 | |
| 0.1 M NaOH | 1 | 327.17 | 248.82 | 2500 | |
| 6 | 286.63 | 222.07 | 2500 | ||
| 13 | 210.46 | 162.28 | 625 | ||
| 29 (Fig. 8d) | 523.68 | 413.46 | 2500 | ||
| 29 (Fig. 8e) | 21.72 | 17.00 | 25 |
The surface of the L,D-PLA layer after exposure to an aqueous 0.1 M HCl solution (Fig. 6c) practically did not change, as also seen in the Sa and Sq parameters (they are of the same order as for the layer kept in the air). In contrast, the surface of the composite layer changes significantly (Fig. 6f), which is also evidenced by the change in roughness parameters (Table 3). Moreover, the topography image of the composite kept in acid revealed the presence of different sizes of objects compared to the image of the same sample stored in air or water (Table 4). Summarizing, this might suggest that a very small amount of L,D-PLA did undergo solubilization during the storage in acidic conditions, as was observed by Lazzari et al. for the kinetic degradation of PLA oligomers.18
| Environment | h [nm] | L [nm] |
|---|---|---|
| Air | 20.80 ± 9.62 | 330.88 ± 116.64 |
| H2O | 8.67 ± 6.37 | 200.16 ± 63.74 |
| 0.1 M HCl | 6.81 ± 2.29 | 67.76 ± 12.76 |
| 0.1 M NaOH | 9.18 ± 4.28 | 63.89 ± 18.22 |
The influence of the 0.1 M NaOH aqueous solution on the surface topography of the L,D-PLA layers is presented in Fig. 7, where the images of the layer surface after 1, 6, 13, and 29 days are presented. From the first day, numerous holes in the layer are clearly visible, which become larger in the following days. The surface roughness parameters also significantly increase with the degradation of the layer in an alkaline environment (Table 3). These findings are in good agreement with the literature, indicating that the degradation kinetics changes from 10−2 at pH = 2 to 102 at pH = 10.18
The surface topography of the composite layer after 1, 6, 13, and 29 days kept in 0.1 M NaOH aqueous solution is presented in Fig. 8. As is seen, the surface of the layers does not change significantly with longer exposure to an alkaline environment. However, it seems that some objects on the surface of the layer kept for 29 days in an alkaline environment are visible in the higher resolution image (Fig. 8e). We performed the analysis of the surface layers based on AFM images to determine both the width L and height above the surface h of the observed objects. For this purpose, 83 profiles were selected for the layer kept in 0.1 M NaOH solution and 20 for the other environments. The method of their determination is presented in Fig. 8f. As calculated, the objects visible on the surface of the layers have a height of ca. 7–21 nm, i.e., about 10 times larger than the diameter of carbon nanotubes (average 0.84 nm). These objects can be formed by aggregates of SWCN, by carbon nanotubes, or their aggregates coated with the L,D-PLA polymer, and/or liquid crystal 5CB. Additionally, the width of the objects is in the range of ca. 64–331 nm and it is the smallest for the layer kept in an alkaline solution. Moreover, the observed dense network of these objects on the surface of the composite kept in 0.1 M NaOH may indicate degradation of the polymer on the surface of the layer, leaving only carbon nanotubes on the surface and probably 5CB. This result confirmed the earlier assumptions from DSC studies that solubilization of the degraded polymer causes erosion of its surface.
3.4. FT-IR study
The degradation processes of the L,D-PLA, and composite layers in environments with different pH were also analysed using the FT-IR method (Fig. 9). For both the polymer and the composite layers, no changes in FT-IR spectra were observed over time, suggesting no chemical degradation in the air (Fig. 9a and d). Only in the case of composite, the FT-IR spectra recorded after 6 days of exposure to air showed more intense bands derived from the 5CB liquid crystal, which suggests a greater amount of 5CB liquid crystal in the studied fragment of the sample. As in the case of the samples kept in the air, no changes in the FT-IR spectra were observed for the samples stored in both distilled water (Fig. 9b and e) and 0.1 M HCl aqueous solution (Fig. 9c and f). The only difference was observed for the composite layer after 6 days in 0.1 M HCl aqueous solution, where intense bands appeared from the 5CB liquid crystal, which again suggested a higher concentration of liquid crystals in the studied fragment of the sample.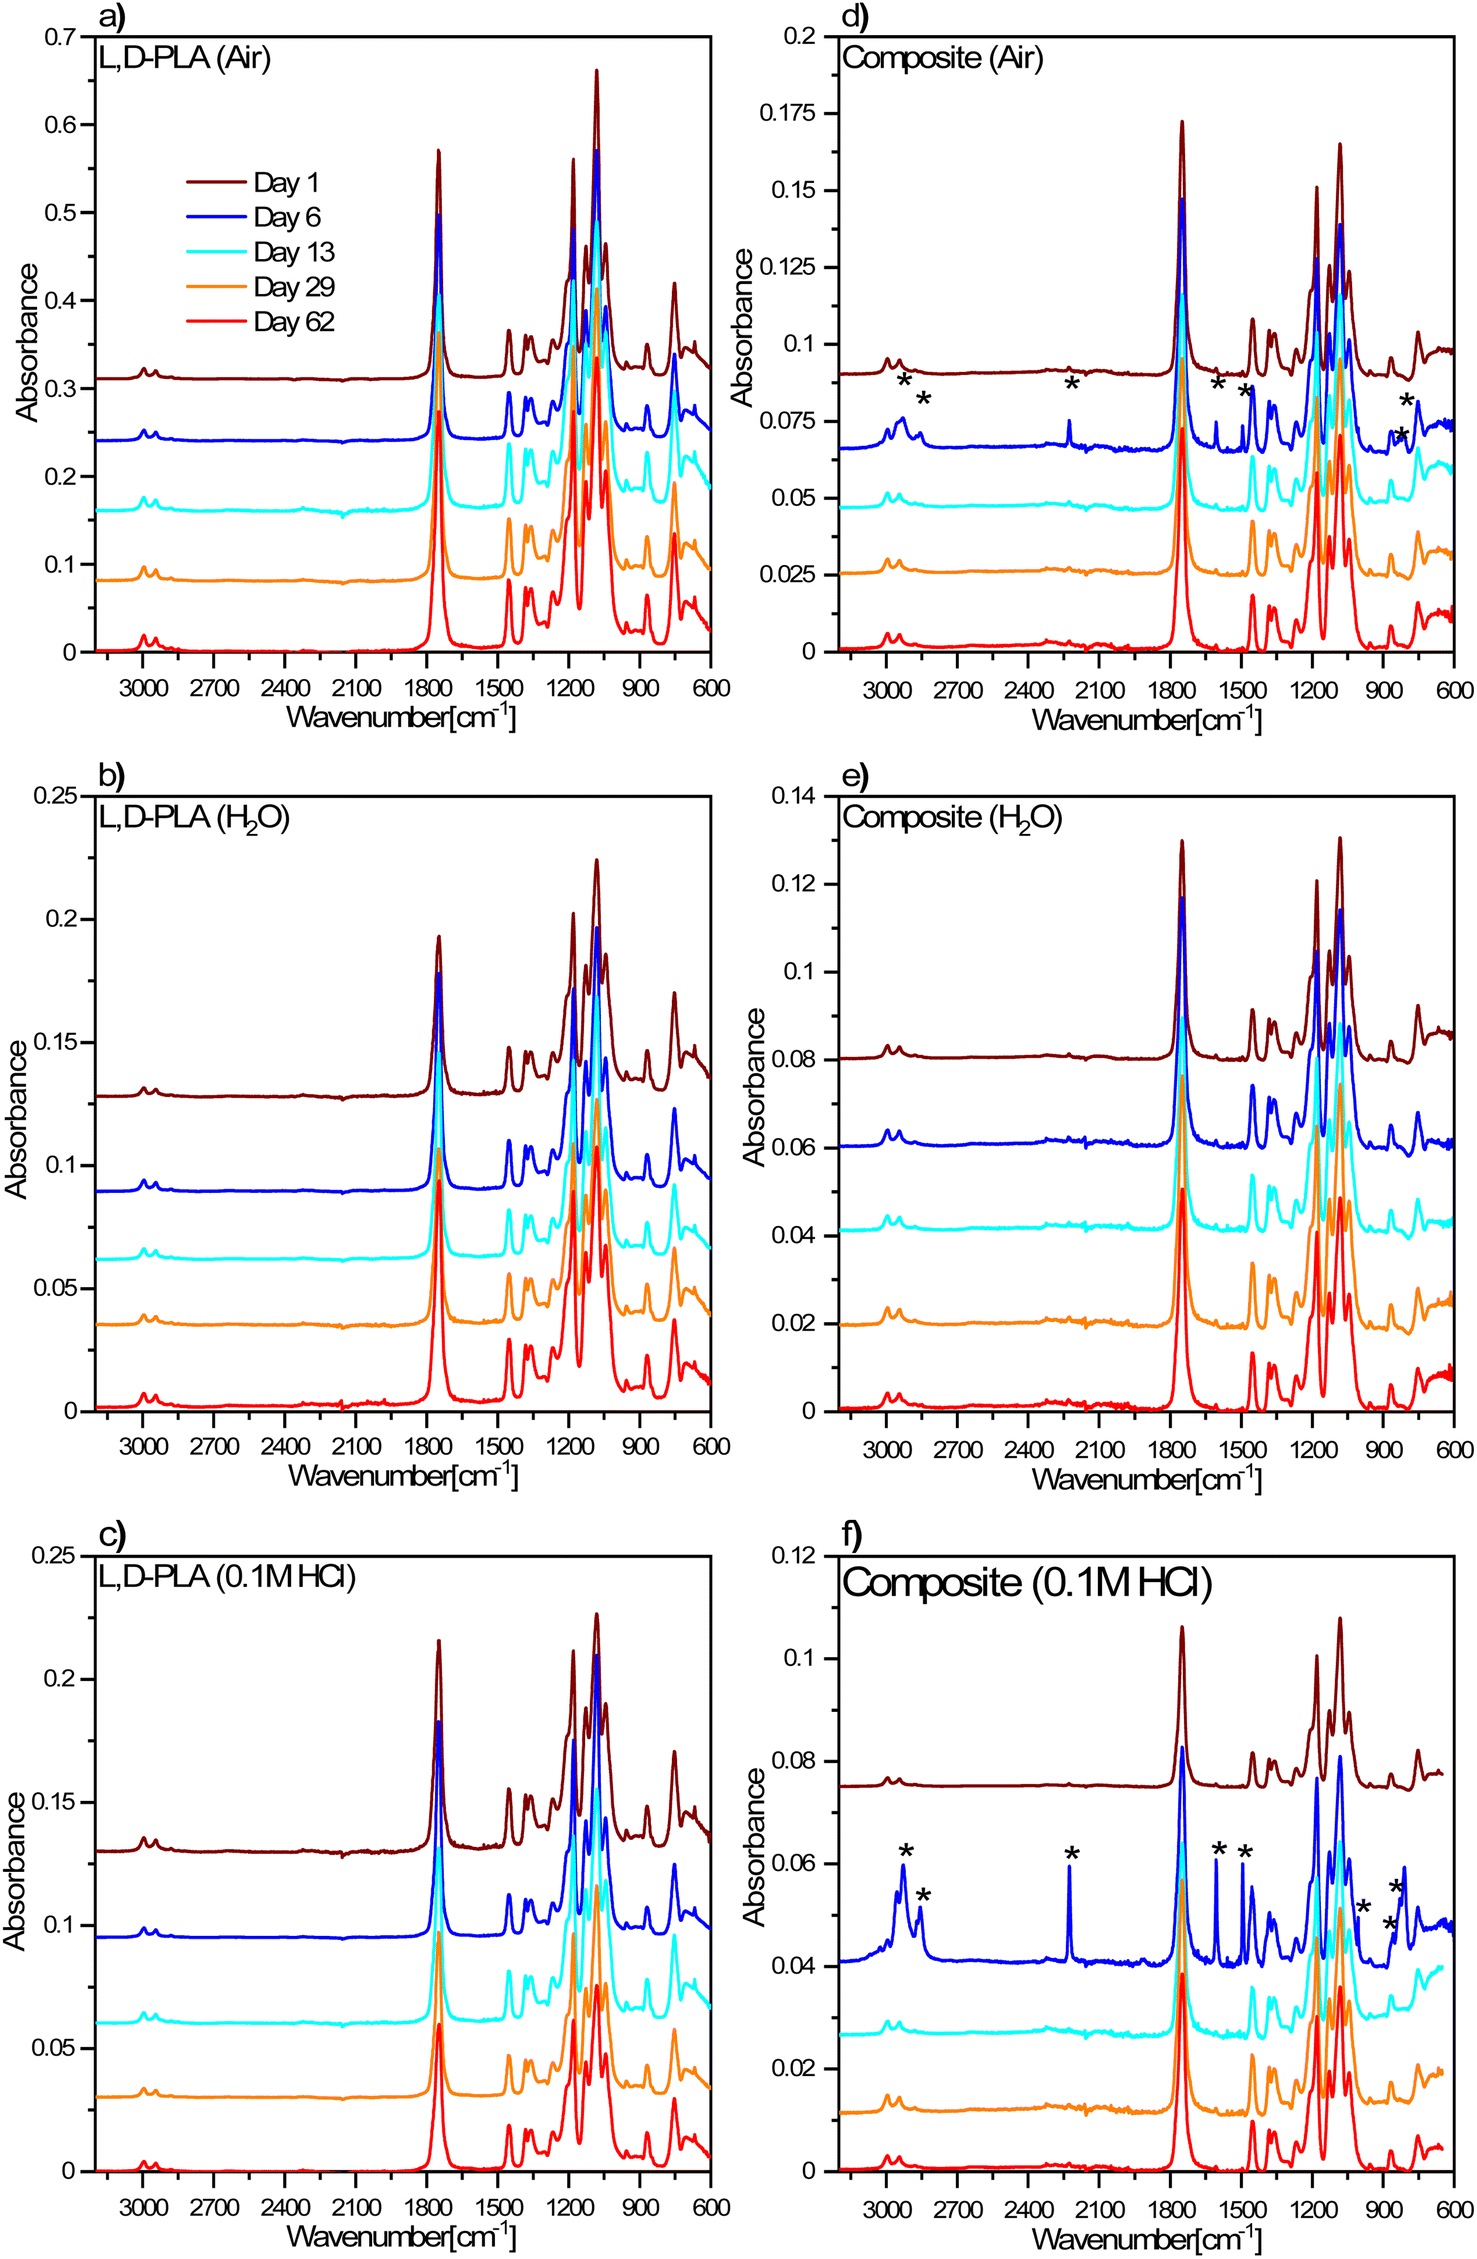 | ||
| Fig. 9 FT-IR spectra for L,D-PLA (a–c), and composite (d–f) layers in different environmental conditions. The legend in (a) is the same for all graphs. | ||
On the other hand, the FT-IR spectra for the L,D-PLA layers placed in 0.1 M NaOH aqueous solution did not change with time, however, for the layers after 13 and 29 days of keeping in the solution, additional bands at approx. 2920 cm−1 appear, related to ν(CH) or ν(CH3) stretching vibrations (Fig. 10a).
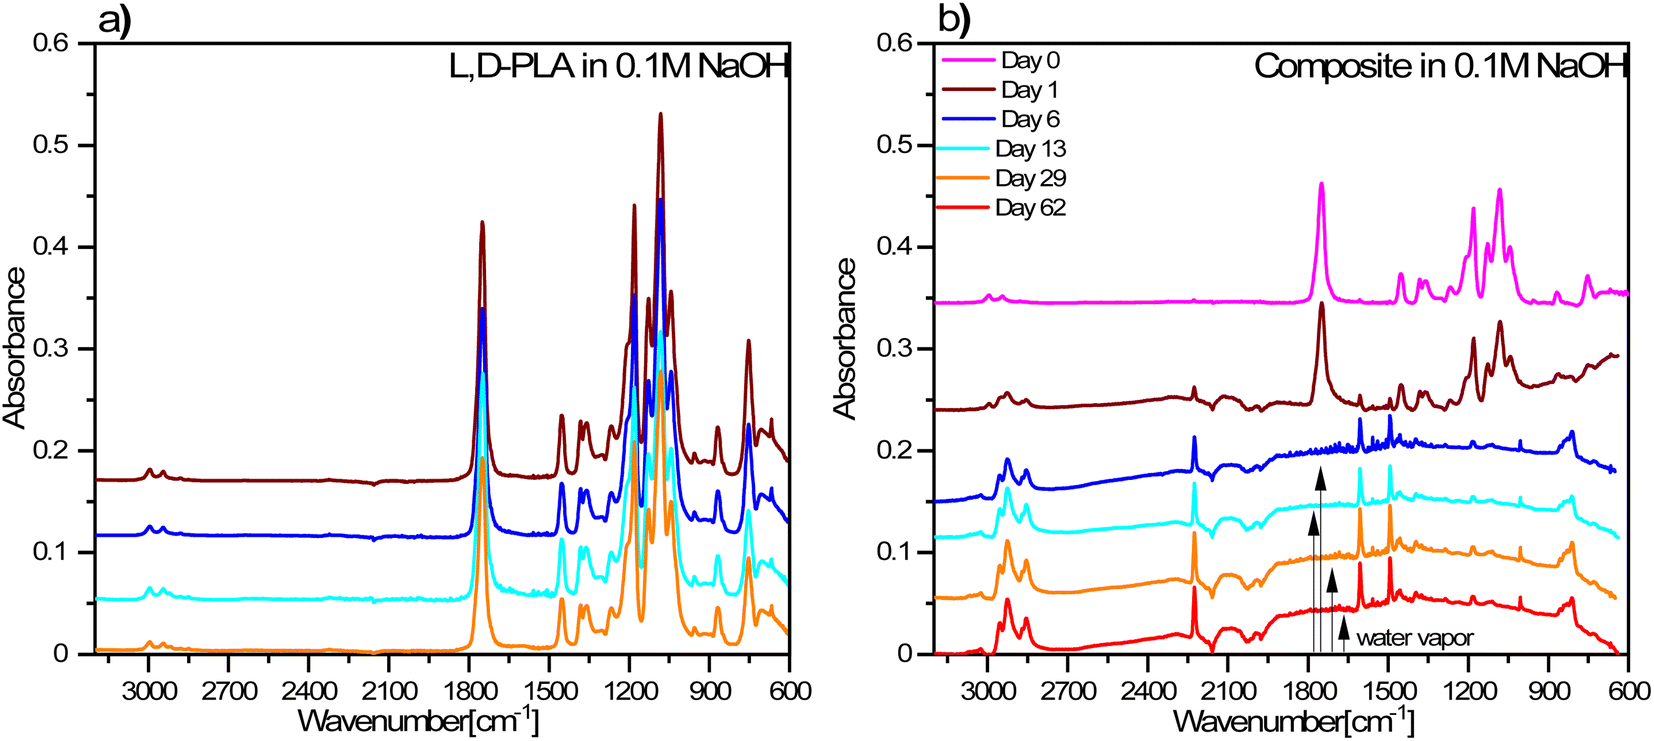 | ||
| Fig. 10 FT-IR spectra of L,D-PLA (a), and composite (b) layers exposed to 0.1 M NaOH aqueous solution. The legend in (b) is the same as for (a). | ||
However, in the case of composite layers, after one day of exposure to an aqueous solution of NaOH, the difference is visible in the spectrum in comparison to the sample not treated with NaOH (Fig. 10b). Namely, we observed a greater manifestation of the bands connected to vibrations of 5CB liquid crystal in the spectrum in addition to the bands of the L,D-PLA polymer. This means that 0.1 M NaOH aqueous solution causes chemical degradation of the L,D-PLA polymer but has no effect on 5CB. The FT-IR spectrum of the composite obtained after 6 days shows an even more distinct increase in the intensities of the bands of 5CB, which dominated the spectrum. This is proof that further degradation of the polymer matrix in the composite had occurred.
The spectra obtained after 6 and more days did not differ from each other, which suggests that further degradation in the sample is not progressing. However, as shown above, the loss of mass still occurs, so the changes observed in the FT-IR spectra mainly concerned the layer surface (the ATR FT-IR method used is sensitive mainly to changes on the sample's surface). The FT-IR spectra obtained after 6 or more days also showed rotational components from water vapor, which could have remained in the crater-like cavities visible in the AFM images (Fig. 8). Additionally, a comparison of the FT-IR spectra of pure 5CB and the composite kept in 0.1 M NaOH solution for 62 days is presented in Fig. 11. This shows that the bands visible in the spectrum of the composite indeed originate from the 5CB liquid crystal additive.
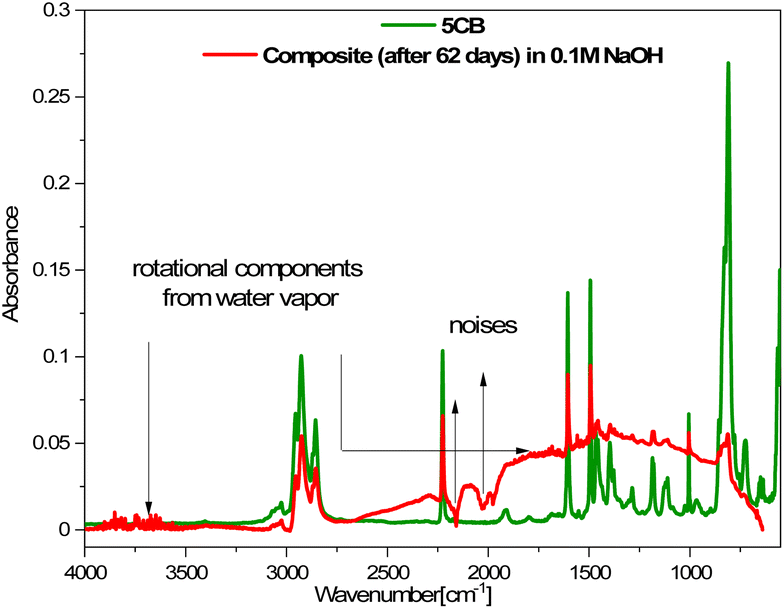 | ||
| Fig. 11 Comparison of FT-IR spectra of the 5CB liquid crystal and composite after 62 days in 0.1 M NaOH aqueous solution. | ||
Taking into account the previously reported contact angle for L,D-PLA:SWCN (10:0.01 w/w) equal to 105.9 ± 0.2°,35 i.e., lower by 10° from the neat polymer, it is seen that the addition of SWCN reduces the hydrophobic nature of the composite. As a consequence of better wettability, the aqueous environment being in good contact with the surface of the layer causes acceleration of hydrolysis of the polymer. The composite layer erodes in an aqueous environment, reducing the amount of polymer in the solid form on the surface, as confirmed by mass evaluation and FT-IR studies.
4. Conclusions
We conducted extensive research on the properties of the neat biodegradable polymer layers and the ternary composition layer based on this polymer in various environments. We observed that additives play an important role in the polymer degradation process. Summarizing, the degradation of the L,D-PLA layer and composite (L,D-PLA:5CB:SWCN, 10:1:0.5, w/w/w) layers was similar within the uncertainty in the air, distilled water, and 0.1 M HCl solution. In the case of the layers kept in 0.1 M NaOH an aqueous solution, the degradation of the polymer L,D-PLA was faster in the composite. DSC measurements showed that the NaOH aqueous solution degraded the polymer L,D-PLA in the composite layer and shifted the softening point of the polymer by about 2 °C, which was not observed for the composite layer kept in other environments. AFM imaging showed that the acidic environment does not affect the surface of the layer, distilled water forms micro-grooves, and the alkaline environment degrades the layer, creating craters. The alkali-treated layers became brittle and cloudy. No changes were observed in the FT-IR spectra of the L,D-PLA, and composite in air, distilled water, and 0.1 M HCl aqueous solution. Only very slight changes at high energies were observed for the polymer treated with 0.1 M NaOH aqueous solution, but the spectra after 6 days and more did not differ from each other. On the other hand, a large influence of 0.1 M NaOH aqueous solution on the surface of the studied composite was observed. Chemical decomposition of L,D-PLA in the composite began after one day of exposure. After 6 days, the intensity of the 5CB bands increased and the intensity of the L,D-PLA bands decreased drastically in the FT-IR spectrum, which proves the degrading effect of the 0.1 M NaOH aqueous solution, mainly on the L,D-PLA polymer. We suppose that the degradation process occurs both at the surface and in the bulk as an effect of possible polymer chain rearrangement in the presence of hydrophobic additives. It should also be mentioned here that different applications of PLA (e.g. electronics, transportation, agriculture, packaging, biomedical industry, textile) result in different types of degradation processes (e.g. hydrolytic, photodegradative, microbial, or enzymatic). It is well known that microbial and enzymatic degradation of PLA is more rapid and is currently the focus of researchers.36 At present, PLA is one of the most promising biodegradable materials to be used in place of polyethylene terephthalate (PET) and polystyrene (PS) (well-known non-degradable materials). Depending on the application, PLA is enriched with admixtures to obtain the desired functional properties, e.g., the conductivity of biodegradable electrodes for application in solar cells.35 For this reason, the addition of a conductive compound such as SWCN (exhibiting excellent electron mobility and one-dimensional shape) is necessary to receive a biodegradable electrode. However, the optimization of the SWCN content is necessary and required for the creation of the semi-transparent electrode. On the other hand, SWCN exists in both metallic and semiconducting forms. However, only semiconducting SWCN eliminates recombination and can offer efficient electron diffusion pathways, which is important for solar cell applications. Additionally, SWCN exhibits a strong tendency to create contact between both forms and transfer electrons from semiconductors to metallic ones.37 For this reason, various additional compounds have been proposed to eliminate the negative effect of SWCN on photovoltaics. In our work, for the first time, according to our knowledge, we proposed the use of 5CB to stabilize SWCN in the PLA layer in order to obtain biodegradable materials with interesting thermal, mechanical, and structural properties.
Conflicts of interest
The authors declare no conflicts of interest.Acknowledgements
This publication was funded from the SciMat Priority Research Area budget under the Strategic Program Excellence Initiative at Jagiellonian University.References
- K. J. Jem and B. Tan, The development and challenges of poly (lactic acid) and poly (glycolic acid), Adv. Ind. Eng. Polym. Res., 2020, 3, 60–70, DOI:10.1016/j.aiepr.2020.01.002.
- S. Farah, D. G. Anderson and R. Langer, Physical and mechanical properties of PLA, and their functions in widespread applications—a comprehensive review, Adv. Drug Delivery Rev., 2016, 107, 367–392, DOI:10.1016/j.addr.2016.06.012.
- E. R. Ghomi, F. Khosravi, A. S. Ardahaei, Y. Dai, R. E. Neisiany, F. Foroughi, M. Wu, O. Das and S. Ramakrishna, The Life Cycle Assessment for Polylactic Acid (PLA) to Make It a Low-Carbon Material, Polymers, 2021, 13, 1854, DOI:10.3390/polym13111854.
- D. Komoto, R. Ikeda, T. Furuike and H. Tamura, Preparation of Chitosan-Coated Poly(L-Lactic Acid) Fibers for Suture Threads, Fibers, 2018, 6, 84, DOI:10.3390/fib6040084.
- J. Jóźwicka, K. Gzyra-Jagieła, A. Gutowska, K. Twarowska-Schmidt and M. Ciepliński, Chemical Purity of PLA Fibres for Medical Devices, Fibres Text. East. Eur., 2012, 20, 135–141 Search PubMed.
- K. Lee, Y. Yun and K. Park, PLA Micro- and Nano-Particles, Adv. Drug Delivery Rev., 2016, 107, 176–191, DOI:10.1016/j.addr.2016.05.020.
- A. Turek, J. Kasperczyk, K. Jelonek, A. Borecka, H. Janeczek, M. Libera, A. Gruchlik and P. Dobrzyński, Thermal properties and morphology changes in degradation process of poly(L-lactide-co-glycolide) matrices with risperidone, Acta Bioeng. Biomech., 2015, 17, 11–19, DOI:10.5277/ABB-00210-2014-02.
- V. DeStefano, S. Khan and A. Tabada, Application of PLA in modern medicine, Engineered Regeneration, 2020, 1, 76–87 CrossRef.
- R. P. Pawar, S. U. Tekale, S. U. Shisodia, J. T. Totre and A. J. Domb, Biomedical Applications of Poly(Lactic Acid), Recent Pat. Regen. Med., 2014, 4, 40–51 CAS.
- D. da Silva, M. Kaduri, M. Poley, O. Adir, N. Krinsky, J. Shainsky-Roitman and A. Schroeder, Biocompatibility, biodegradation and excretion of polylactic acid (PLA) in medical implants and theranostic systems, Chem. Eng. J., 2018, 340, 9–14, DOI:10.1016/j.cej.2018.01.010.
- N. F. Zaaba and M. Jaafar, A review on degradation mechanisms of polylactic acid: hydrolytic, photodegradative, microbial, and enzymatic degradation, Polym. Eng. Sci., 2020, 60, 2061–2075, DOI:10.1002/pen.25511.
- L. N. Woodard and M. A. Grunlan, Hydrolytic Degradation and Erosion of Polyester Biomaterials, ACS Macro Lett., 2018, 7(8), 976–982, DOI:10.1021/acsmacrolett.8b00424.
- Y. Li, Z. Chu, X. Li, X. Ding, M. Guo, H. Zhao, J. Yao, L. Wang, Q. Cai and Y. Fan, The effect of mechanical loads on the degradation of aliphatic biodegradable polyesters, Regener. Biomater., 2017, 179–190, DOI:10.1093/rb/rbx009.
- S. Teixeira, K. M. Eblagon, F. R. Miranda, M. F. Pereira and J. L. Figueiredo, Towards Controlled Degradation of Poly(lactic) Acid in Technical Applications, C, 2021, 7, 42, DOI:10.3390/c7020042.
- E. Moreno, F. R. Beltrán, M. P. Arrieta, G. Gaspar, L. M. Muneta, R. Carrasco-Gallego, S. Yáñez, D. Hidalgo-Carvajal, M. U. de la Orden and J. Martíne-Urreaga, Technical Evaluation of Mechanical Recycling of PLA 3D Printing Wastes, Proceedings, 2021, 69, 19, DOI:10.3390/CGPM2020-07187.
- M. Karamanlioglu and U. Alkan, Influence of Time and Room Temperature on Mechanical and thermal degradation of poly(lactic) acid, Therm. Sci., 2019, 23, S383–S390 CrossRef.
- X. Liu, Y. Zou, W. Li, G. Cao and W. Chen, Kinetics of thermos-oxidative and thermal degradation of poly (D,L-lactide) (PDLLA) at processing temperature, Polym. Degrad. Stab., 2006, 91, 3259–3265, DOI:10.1016/j.polymdegradstab.2006.07.004.
- S. Lazzari, F. Codari, G. Storti, M. Morbidelli and D. Moscatelli, Modelling the pH-dependent PLA oligomer degradation kinetics, Polym. Degrad. Stab., 2014, 110, 80–90, DOI:10.1016/j.polymdegradstab.2014.08.012.
- Y. Luo, Z. Lin and G. Guo, Biodegradation Assessment of Poly (Lactic Acid) Filled with Functionalized Titania Nanoparticles (PLA/TiO2) under Compost Conditions, Nanoscale Res. Lett., 2019, 14, 56, DOI:10.1186/s11671-019-2891-4.
- A. Marra, S. Cimmino and C. Silvestre, Effect of TiO2 and ZnO on PLA degradation in various media, Adv. Mater. Sci., 2017, 2, 1–8, DOI:10.15761/AMS.1000122.
- D. Czarnecka-Komorowska, K. Bryll, E. Kostecka, M. Tomasik, E. Piesowicz and K. Gawdzińska, The composting of PLA/HNT biodegradable composites as an eco-approach to the sustainability, Bull. Pol. Acad. Sci. Tech. Sci., 2021, 69, 136720, DOI:10.24425/bpasts.2021.136720.
- A. Magiera, J. Markowski, J. Pilch and S. Blazewicz, Degradation Behaviour of Electrospun PLA and PLA/CNT Nanofibres in Aqueous Environment, J. Nanomater., 2018, 2018, 15, DOI:10.1155/2018/8796583.
- P. Fryń, K. A. Bogdanowicz, P. Krysiak, M. Marzec, A. Iwan and A. Januszko, Dielectric, Thermal and Mechanical Properties of L,D-Poly(Lactic Acid) Modified by 4′-Pentyl-4-Biphenylcarbonitrile and Single Walled Carbon Nanotube, Polymers, 2019, 11, 1867, DOI:10.3390/polym11111867.
- C. S. Proikakis, N. J. Mamouzelos, P. A. Tarantili and A. G. Andreopoulos, Swelling and hydrolytic degradation of poly(d,l-lactic acid) in aqueous solutions, Polym. Degrad. Stab., 2006, 91(3), 614–619, DOI:10.1016/j.polymdegradstab.2005.01.060.
- P. Fryń, K. A. Bogdanowicz, N. Górska, J. Rysz, P. Krysiak, M. Mateusz, M. Marzec, A. Iwan and A. Januszko, Hybrid Materials Based on L,D-Poly(lactic acid) and Single-Walled Carbon Nanotubes as Flexible Substrate for Organic Devices, Polymers, 2018, 10, 1271, DOI:10.3390/polym10111271.
- D. Nečas and P. Klapetek, Gwyddion: An open-source software for SPM data analysis, Cent. Eur. J. Phys., 2012, 10, 181–188, DOI:10.2478/s11534-011-0096-2.
- H. Tsuji, Poly(lactic acid): Synthesis, Structures, Properties, Processing, and Applications, ed. R. Auras, L. T. Lim, S. E. M. Selke, and H. Tsuji, John Wiley & Sons, Inc., 2010, ch. 21: Hydrolytic Degradation, pp. 345–381 Search PubMed.
- Z. Oksiuta, M. Jalbrzykowski, J. Mystkowska, E. Romanczuk and T. Osiecki, Mechanical and Thermal Properties of Polylactide (PLA) Composites Modified with Mg, Fe, and Polyethylene (PE), Addit. Polym., 2020, 12, 2939, DOI:10.3390/polym12122939.
- S. Jia, D. Yu, Y. Zhu, Z. Wang, L. Chen and L. Fu, Morphology, Crystallization and Thermal Behaviours of PLA-Based Composites: Wonderful Effects of Hybrid GO/PEG via Dynamic Impregnating, Polymers, 2017, 9, 528, DOI:10.3390/polym9100528.
- P. Dhara and R. Mukherjee, Phase transition and dewetting of a 5CB liquid crystal thin film on a topographically patterned substrate, RSC Adv., 2019, 9, 21685 RSC.
- N. Burgos, D. Tolaguera, S. Fiori and A. Jimenez, Synthesis and Characterization of Lactic Acid Oligomers: Evaluation of Performance as Poly(Lactic Acid) Plasticizers, J. Polym. Environ., 2014, 22, 227–235, DOI:10.1007/s10924-013-0628-5.
- M. Li, S. Li, B. Liu, T. Jiang, D. Zhang, L. Cao, L. He and W. Gong, Rheological behaviour, crystallization properties, and foaming performance of chain-extended poly(lactic acid) by functionalized epoxy, RSC Adv., 2021, 11, 32799 RSC.
- Y. Ren, X. Sun, L. Chen, Y. Li, M. Sun, X. Duana and W. Liang, Structures and impact strength variation of chemically crosslinked high-density polyethylene: effect of crosslinking density, RSC Adv., 2021, 11, 6791–6797 RSC , https://pubs.rsc.org/en/content/articlelanding/2021/ra/d0ra10365a.
- E. Tarani, K. Pušnik Crešnar, L. F. Zemljic, K. Chrissafis, G. Z. Papageorgiou, D. Lambropoulou, A. Zamboulis, D. Bikiaris and Z. Terzopoulou, Cold Crystallization Kinetics and Thermal Degradation of PLA Composites with Metal Oxide Nanofillers, Appl. Sci., 2021, 11, 3004, DOI:10.3390/app11073004.
- P. Fryń, B. Jewłoszewicz, K. A. Bogdanowicz, W. Przybył, A. Gonciarz, R. Pich, M. Marzec and A. Iwan, Research of Binary and Ternary Composites Based on Selected Aliphatic or Aliphatic-Aromatic Polymers, 5CB or SWCN toward Biodegradable Electrodes, Materials, 2020, 13, 2480, DOI:10.3390/ma13112480.
- N. F. Zaaba and M. Jaafar, A review on degradation mechanisms of polylactic acid: hydrolytic, photodegradative, microbial, and enzymatic degradation, Polym. Eng. Sci., 2020, 1–15 Search PubMed.
- X. Dang, H. Yi, M.-H. Ham, J. Qi, D. Soo Yun, R. Ladewski, M. S. Strano, P. T. Hammond and A. M. Belcher, Virus-templated self-assembled single-walled carbon nanotubes for highly efficient electron collection in photovoltaic devices, Nat. Nanotechnol., 2011, 6, 377–384, DOI:10.1038/nnano.2011.50.
| This journal is © The Royal Society of Chemistry 2023 |