
 Open Access Article
 This Open Access Article is licensed under a Creative Commons Attribution-Non Commercial 3.0 Unported Licence
Anti-inflammatory constituents isolated from the flowers of Hosta plantaginea via suppression of the NF-κB signaling pathway in LPS-stimulated RAW 264.7 macrophages†
Jie-Wei He a,
Ping Guob,
Li Yang*a and
Jun-Wei He*a
a,
Ping Guob,
Li Yang*a and
Jun-Wei He*a
aJiangxi University of Chinese Medicine, Nanchang 330004, China. E-mail: hjwjn2008@163.com
bDepartment of Medical Laboratory, First Affiliated Hospital of Nanchang University, Nanchang 330006, China
First published on 3rd March 2023
Abstract
Hosta plantaginea (Lam.) Aschers flower is traditionally used in China as an important herbal medicine for the treatment of inflammatory disease. The present study isolated one new compound, namely (3R)-dihydrobonducellin (1), and five known ones, p-hydroxycinnamic acid (2), paprazine (3), thymidine (4), bis(2-ethylhexyl) phthalate (5), and dibutyl phthalate (6) from H. plantaginea flowers. These structures were elucidated from spectroscopic data. Among them, compounds 1–4 remarkably suppressed nitric oxide (NO) production in lipopolysaccharide (LPS)-induced RAW 264.7 cells with half maximal inhibitory concentration (IC50) values of 19.88 ± 1.81, 39.80 ± 0.85, 19.03 ± 2.35, and 34.63 ± 2.38 μM, respectively. Furthermore, compounds 1 and 3 (20 μM) significantly decreased levels of tumor necrosis factor α (TNF-α), prostaglandin E2 (PGE2), interleukin 1β (IL-1β), and IL-6. Additionally, compounds 1 and 3 (20 μM) prominently reduced the phosphorylation protein level of nuclear factor kappa-B (NF-κB) p65. The present findings indicated that compounds 1 and 3 may be new candidates against inflammation via blocking the NF-κB signaling pathway.
Introduction
Inflammation is an automatic defense response to protect normal functions in the host from diverse hazardous stimuli, such as infection, bacteria, injury, and irritation.1–3 Excessive inflammation response could erode normal tissue and result in the pathogenesis of many inflammatory diseases like rheumatoid arthritis and asthma.4–6 During this process, macrophage and other innate immune cells are activated, which can lead to the over expression of the NF-κB and other signaling pathways, causing the secretion of inflammatory mediators comprising NO, TNF-α, PGE2, IL-1β, and IL-6.4,7 RAW 264.7 macrophage was a common inflammatory cell widely used to evaluate the anti-inflammatory activity of compounds and/or extracts in preclinical study.1,2 Furthermore, LPS can stimulate RAW 264.7 macrophages and inflammatory response, to release a variety of inflammatory mediators.1,4,7 Therefore, RAW 264.7 macrophages stimulated by LPS are commonly used as an important tool or model to evaluate anti-inflammatory effects and their mechanisms of drugs. Besides, inhibiting these related signaling pathways and inflammatory mediators could consider as important targets for the prevention and treatment of many inflammatory diseases.Hosta plantaginea (Lam.) Aschers is a perennial herbaceous belonging to the Hostaceae family. This herbal medicine is locally known as Yu-zan ( ) in China, and its flower was widely used as a therapeutic remedy for the anti-inflammatory agent.8,9 The flowers of H. plantaginea possessed anti-inflammatory, analgesic, antioxidant and anti-tumor effects.8,9 Moreover, we previously isolated flavonoids, phenethyl alcohols, phenylpropanoids, and alkaloids from an ethanolic crude extract of H. plantaginea flowers.10–15 However, bio-active phytochemicals were responsible for the anti-inflammatory effect and their underlying mechanisms have been poorly clarified.
To systematically study the flowers of H. plantaginea against inflammation, in this study, we further extension of our previous work to isolate and identify six compounds (1–6, Fig. 1), including one new isoflavone (1), two phenylpropanoids (2 and 3), one alkaloid (4) and two benzoic acid derivatives (5 and 6). Additionally, we further evaluated these compounds with anti-inflammatory effects and their potential mechanisms in LPS-stimulated RAW 264.7 macrophages.
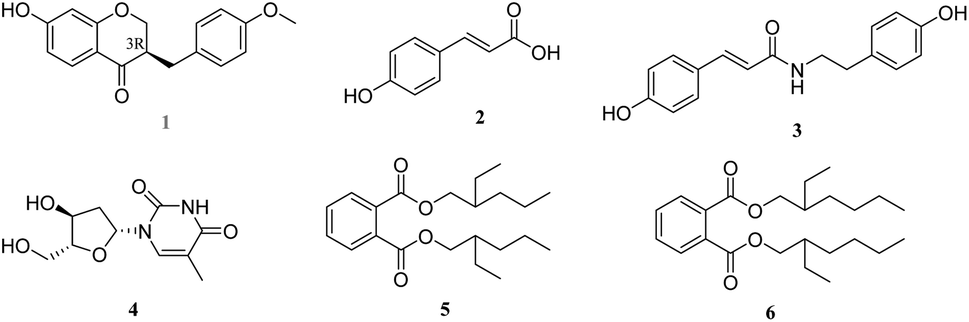 | ||
| Fig. 1 Chemical structures of compounds 1–6. | ||
Results and discussion
Identification of compounds 1–6 from the flowers of H. plantaginea
Compound 1 was obtained as a yellow amorphous powder, had a molecular formula C17H16O4 (10 degrees of unsaturation) on the basis of the HR-ESI-MS at m/z 285.11214 [M + H]+ (calcd for C17H17O4+, 285.11224, Fig. S1†). The planar structure of 1 was identified by comparison of 1H- (Fig. S2†) and 13C-NMR (Fig. S3†) data (Table 1) to those of dihydrobonducellin, which was isolated from Caesalpinia pulcherrima Swartz (Caesalpiniaceae family) cultured cells coincubated with cork tissue.16 The planar structure of 1 was confirmed by HSQC, 1H-1H COSY, and HMBC correlations in this study (Fig. 2A and S4–S6†). However, the stereochemistry of this structure was unexplored. In the present work, the stereochemistry at C-3 was determined by comparison of its circular dichroism (CD) spectrum with those of similar homoisoflavonoids, which exhibited a negative and positive Cotton effects in the range of 280–300 nm indicative of a 3R and 3S configurations, respectively.17–20 In addition, a positive Cotton effect in the 280–300 nm region of the CD curve of homoisoflavonoid with C-3 hydroxy group is indicative of a 3R configuration.17 Therefore, the absolute configuration at C-3 was R configuration based on the CD spectrum of 1 (Fig. 2B), which exhibited a negative Cotton effect at 282 nm (Δε = −1.1, the π → π* transition) and a positive Cotton effect at 318 nm (Δε = +0.91, the n → π* transition). Therefore, the structure of 1 was elucidated, namely (3R)-dihydrobonducellin. This is the first report on the isoflavone from the Hostaceae family. In addition, the structure of compound 1 was reported as a synthetic product, but only 1H- and 13C-NMR data were provided.21| No. | δC | δH | 1H-1H COSY | HMBC |
|---|---|---|---|---|
| a Measure at 600 MHz for 1H and 150 MHZ for 13C NMR. | ||||
| 2 | 69.4 | 4.28 (1H, dd, 11.4/4.5) | H-3 | C-3, 4, 8a, 9 |
| 4.08 (1H, dd, 11.4/9.0) | ||||
| 3 | 46.3 | 2.88 (1H, m) | H-2, H-9 | C-2, 4, 4a, 9, 1′ |
| 4 | 191.5 | |||
| 4a | 113.1 | |||
| 5 | 128.8 | 7.63 (1H, d, 8.7) | H-6 | C-4, 6, 7, 4a, 8a |
| 6 | 110.6 | 6.50 (1H, dd, 8.7/2.2) | H-5 | C-5, 7, 8, 4a |
| 7 | 164.4 | |||
| 8 | 102.3 | 6.30 (1H, d, 2.2) | C-6, 7, 4a, 8a | |
| 8a | 163.0 | |||
| 9 | 30.9 | 3.03 (1H, dd, 14.0/5.0) | H-3 | C-2, 3, 4, 1′, 2′, 6′ |
| 2.588 (1H, dd, 14.0/9.6) | ||||
| 1′ | 130.3 | |||
| 2′,6′ | 129.9 | 7.14 (2H, d, 8.6) | C-9, 1′, 3′, 4′, 5′ | |
| 3′,5′ | 113.8 | 6.86 (2H, d, 8.6) | C-1′, 3′, 4′, 5′ | |
| 4′ | 157.8 | |||
| 7-OH | 10.57 (1H, s) | C-6, 7, 8 | ||
| 4′-OCH3 | 55.0 | 3.72 (3H, s) | C-4′ | |
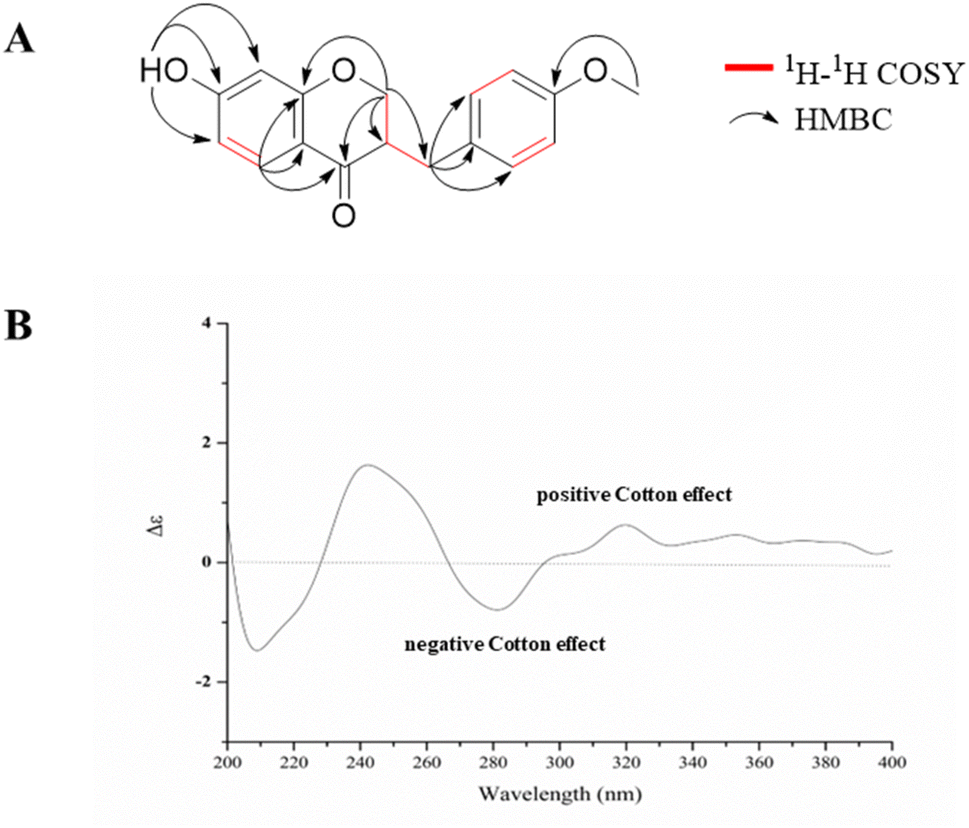 | ||
| Fig. 2 The 1H-1H COSY and selected HMBC correlations (A) along with CD spectrum (B, in CH3OH, 0.05 mg mL−1) of compound 1. | ||
Five other known compounds were identified as p-hydroxycinnamic acid (2),22 paprazine (3),23 thymidine (4),24 bis(2-ethylhexyl) phthalate (5),25 and dibutyl phthalate (6),26 by comparison with their spectroscopic data with previous literature (Fig. S7–S16†). Moreover, all isolated compounds are authentic phytochemicals in the extract of flowers of H. plantaginea using ultra-high-performance liquid chromatography coupled with quadrupole time-of-flight tandem mass spectrometry (UHPLC-Q-TOF-MS) analysis (Figs. S17–S24†). To the best of our knowledge, this is the first report on compounds 2–6 from the Hostaceae family. Based on this work and previous studies, a total of 34 phytochemicals, including 21 flavonoids, 3 phenethyl alcohols, 4 phenylpropanoids, 3 alkaloids, and 3 benzoic acids were isolated from ethyl acetate and n-butanol fractions that derived from an ethanolic extract of the flowers of H. plantaginea. The drawback is that the fractions of petroleum ether and water residue were not studied due to their polarities were too small and too large, respectively. Thus, our work has enriched phytochemicals of the flowers of H. plantaginea and provided more anti-inflammatory phytochemicals from natural materials.
Effects of compounds 1–6 on cell viability against RAW 264.7 macrophages
To determine the cytotoxicity, RAW 264.7 macrophages were treated with compounds 1–6 at a concentration of 40 μM for 24 h. As showed in Table 2, all compounds had no significant cytotoxicity to RAW 264.7 macrophages (p > 0.05). Therefore, subsequent experiments were carried out within non-cytotoxicity concentrations for all isolated compounds.| Compound | LPS-untreated cell viability (%) | LPS-treated cell viability (%) |
|---|---|---|
| a Data are represented as the mean ± SD of three experiments at a concentration of 40 μM. | ||
| Control | 100.00 ± 10.32 | 100.00 ± 8.76 |
| 1 | 94.29 ± 4.32 | 92.13 ± 3.88 |
| 2 | 91.93 ± 3.43 | 91.43 ± 3.93 |
| 3 | 93.49 ± 5.52 | 93.73 ± 4.32 |
| 4 | 91.61 ± 5.39 | 92.11 ± 4.69 |
| 5 | 96.18 ± 5.28 | 95.93 ± 3.19 |
| 6 | 97.46 ± 6.11 | 96.26 ± 4.72 |
Effects of compounds 1–6 on the production of NO in LPS-stimulated RAW 264.7 macrophages
NO, as the classic biomarker of inflammation and the most pivotal pro-inflammatory mediator, is massive production in the model of LPS-stimulated RAW 264.7 macrophages.1,2 Therefore, NO was massive produced in RAW 264.7 macrophages after treatment with LPS.To explore the anti-inflammatory effects of compounds 1–6 on LPS-activated NO production in RAW 264.7 macrophages, the level of NO in the culture media were determined by the Griess reaction. As presented in Fig. 3, LPS (1 μg mL−1) treatment caused remarkably increased of NO production compared to the control group (p < 0.01), and compounds 1–4 showed moderate inhibitory effects against NO production with NO inhibition rates of 65.15 ± 5.21, 52.55 ± 3.37, 67.83 ± 5.13 and 55.50 ± 4.37, respectively, while other compounds have weak inhibitory activities with NO inhibition rates less than 50%.
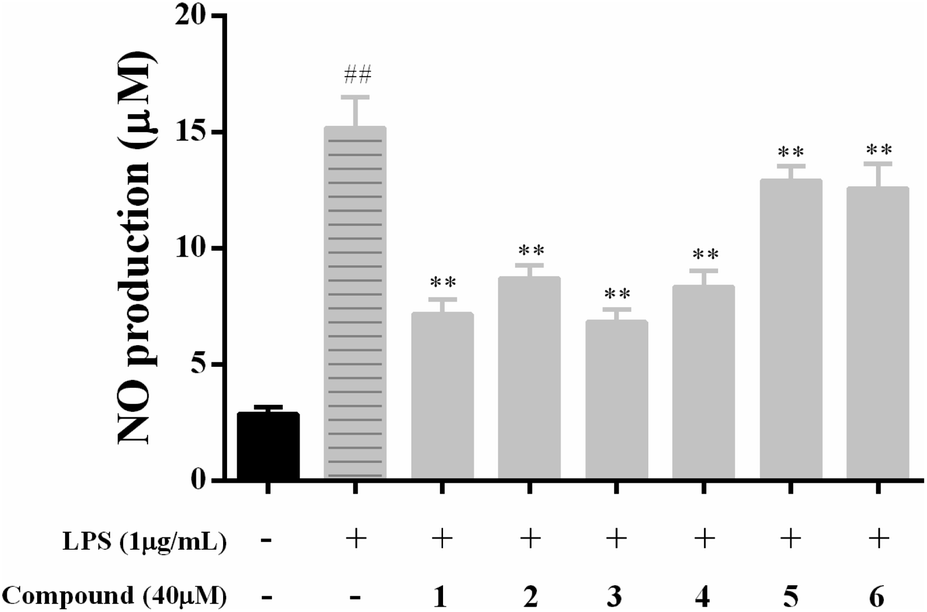 | ||
| Fig. 3 Effects of compounds 1–6 on NO inhibition production in LPS-stimulated RAW 264.7 macrophages. All data of three independent experiments are presents as means ± SD. ##p < 0.01 vs. the control group; **p < 0.01 vs. the LPS only model group. | ||
According to NO assay preliminary results, lower concentrations (<40 μM) of compounds 1–4 were further chosen evaluated for NO production experiments. As a result, compounds 1 and 3 showed strong NO production inhibitory activities in a concentration-dependent manner with IC50 values of 19.98 ± 1.81 and 19.03 ± 2.35 μM, respectively (Table 3). Meanwhile, compounds 2 and 4 showed moderate NO production inhibitory activities with IC50 values of 39.80 ± 0.85 and 34.63 ± 2.38 μM, respectively. It was reported that compound 2 exerted potential anti-inflammatory activity in previous work, which was consistent with our study.27
| Compound | IC50 (μM) | Compound | IC50 (μM) |
|---|---|---|---|
| a Data are represented as the mean ± SD of three experiments. | |||
| 1 | 19.98 ± 1.81 | 4 | 34.63 ± 2.38 |
| 2 | 39.80 ± 0.85 | 5 | >40 |
| 3 | 19.03 ± 2.35 | 6 | >40 |
Therefore, compounds 1 and 3 were may be the main effective anti-inflammatory phytochemicals in the flowers of H. plantaginea. In subsequent experiments, we thus revealed the underlying anti-inflammatory mechanisms of compounds 1 and 3 in LPS-stimulated RAW 264.7 macrophages.
Effects of compounds 1 and 3 on the levels of TNF-α, PGE2, IL-1β, and IL-6 in LPS-stimulated RAW 264.7 macrophages
As four important pro-inflammatory mediators comprising TNF-α, PGE2, IL-1β, and IL-6, were widely used to evaluate the anti-inflammatory effect.1,2To explore the potential mechanism of compounds 1 and 3, the pro-inflammatory cytokines of TNF-α, PGE2, IL-1β, and IL-6 were determined by ELISA kits. The results were summarized in Fig. 4, the level of TNF-α, PGE2, IL-1β, and IL-6 markedly elevated in the LPS model group compared with the blank control group, indicated that the immunomodulatory cell model was successfully established. Following the treatment of compounds 1 and 3 at a concentration of 20 μM, the level of TNF-α, PGE2, IL-1β, and IL-6 was significantly lower than those of in the model group (p < 0.01).
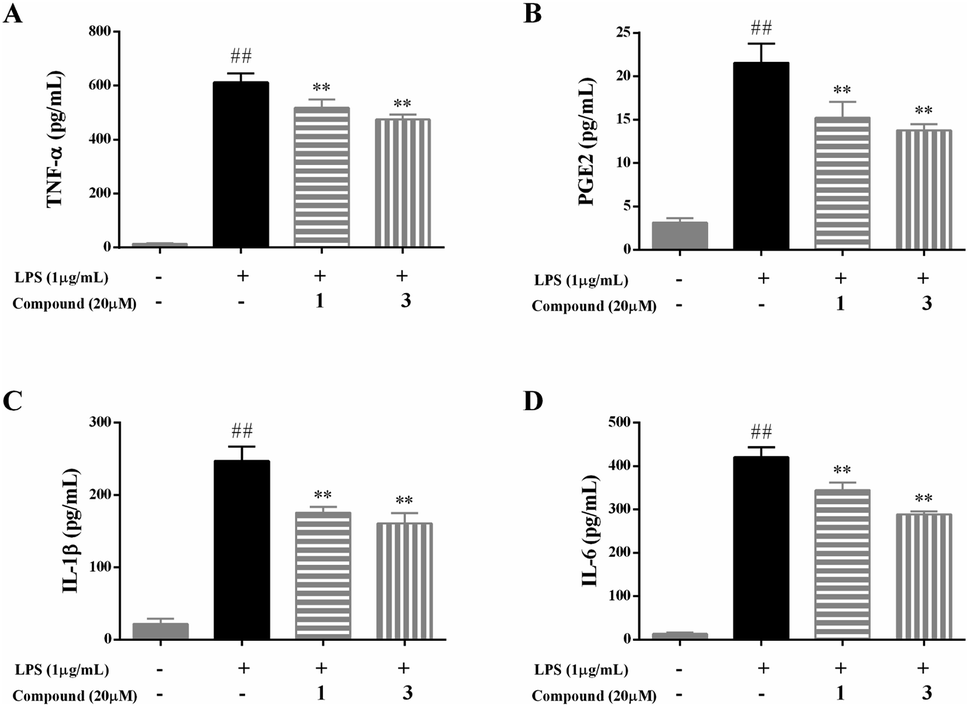 | ||
| Fig. 4 Effects of compounds 1 and 3 on the production of TNF-α (A), PGE2 (B), IL-1β (C), and IL-6 (D) in LPS-stimulated RAW 264.7 macrophages. Data were presented as the mean ± SD of three experiments. ##p < 0.01 vs. the control group; **p < 0.01 vs. the LPS only model group. | ||
The results suggested that compounds 1 and 3 at a concentration of 20 μM can effectively prevent large-scale abnormal inflammatory responses by inhibiting the production of TNF-α, PGE2, IL-1β, and IL-6 in LPS-stimulated RAW 264.7 macrophages.
Effects of compounds 1 and 3 on the LPS-stimulated NF-κB activation in RAW 264.7 macrophages
NF-κB is regarded as an important transcription factor in the pathogenesis of inflammatory diseases and its activation positively regulates the expression of inflammatory mediators, such as NO, TNF-α, PGE2, IL-1β, and IL-6.1,2 In normal, the NF-κB/IκB complex exists in the cytoplasm, but NF-κB translocates into the nucleus and activates inflammatory genes transcription after the cells stimulated by LPS, TNF-α, or others. Moreover, NF-κB p65 activated by phosphorylated IκB in response to inflammatory mediator stimuli.1,2 Thus, suppression of the NF-kB p65 translocation to the nucleus is considered as a pivotal target and an effective therapeutic strategy for the treatment of inflammatory diseases.To further investigate the underlying anti-inflammatory mechanism of action of compounds 1 and 3, the protein expression of the NF-κB signaling pathway was measured by western blot analysis. As summarized in Fig. 5, LPS (1 μg mL−1) significantly increased the phosphorylated NF-κB p65 in RAW 264.7 macrophage. Whereas, 20 μM of compounds 1 and 3 were markedly suppressed the phosphorylated NF-κB p65, as expected.
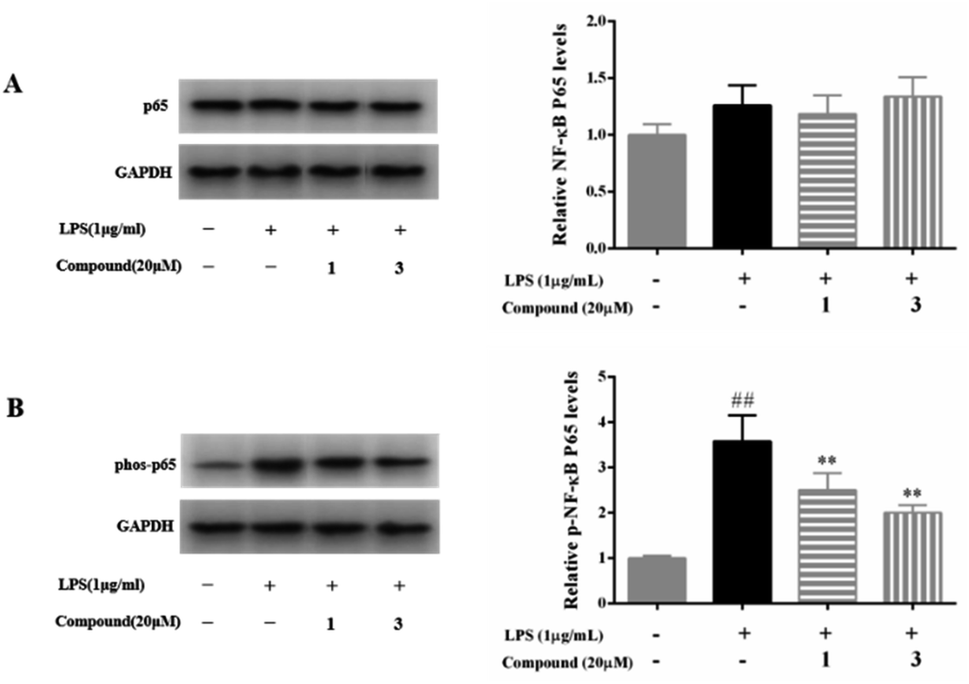 | ||
| Fig. 5 Effects of compounds 1 and 3 on NF-κB p65 (A) and phosphorylated NF-κB p65 (B) in LPS-stimulated RAW 264.7 macrophages. Data were presented as the mean ± SD of three experiments. ##p < 0.01 vs. the control group; **p < 0.01 vs. the LPS only model group. | ||
Based on the above evidence, the anti-inflammatory mechanism of compounds 1 and 3 via reduced the NF-kB signaling pathway, and inhibited the secretion level of TNF-α, PGE2, IL-1β, and IL-6 in LPS-stimulated RAW 264.7 macrophages. As a result, the present study has enriched our knowledge about the anti-inflammatory activity of the flowers of H. plantaginea.
Conclusions
In summary, one new compound, namely (3R)-dihydrobonducellin (1), and five known ones, p-hydroxycinnamic acid (2), paprazine (3), thymidine (4), bis(2-ethylhexyl) phthalate (5), and dibutyl phthalate (6) were isolated from H. plantaginea flowers. Among them, compound 1 was a new isoflavone, which was first report on this type of structure from the Hostaceae family. Furthermore, compounds 1 and 3 exhibited significant anti-inflammatory effects by reducing the secretion level of NO, TNF-α, PGE2, IL-1β, and IL-6 by suppressing the NF-kB signaling pathway in LPS-stimulated RAW 264.7 macrophages. This study provides the phytochemical diversity and pharmacological effect of H. plantaginea flowers against inflammation in clinical application. Importantly, compounds 1 and 3 may be promising candidates for anti-inflammatory agents.Experimental section
General experimental procedures
NMR data were obtained on a Bruker Avance-600 spectrometer (Bruker, Switzerland) using tetramethylsilane as an internal standard. CD spectrum was recorded in a JASCO J-815 spectrometer (JASCO, Japan) and the curve was carried out on an Origin Graph software (OriginLab, USA). HR-ESI-MS data was performed on a TOF 5600+ (AB SCIEX, USA).Chemicals and reagents
The murine macrophage cell line RAW 264.7 was acquired from American Tissue Culture Collection (BNCC337875, ATCC, Manassas, VA, USA). Fetal bovine serum (FBS) was obtained from Hyclone (Logan, UT, USA). Lipopolysaccharide (Escherichia coli serotype 0111: B4, L5293) was purchased from Sigma-Aldrich (St. Louis, MO, USA). Dulbecco's modified Eagle medium (DMEM) and trypsase were bought from GIBCO (Grand Island, NY, USA). Penicillin-streptomycin was procured from Sigma-Aldrich (St. Louis, MO, USA). CCK-8 assay kit and radioimmunoprecipitation assay (RIPA) lysis buffer were obtained from Beyotime Biotechnology (Shanghai, China). Murine ELISA kits for TNF-α, IL-1β, and IL-6 were acquired from R&D Systems (Minnesota, USA). The murine ELISA kit for PGE2 was obtained from Westang (Shanghai, China). Anti-phos-NF-κB p65 (Ser536) and anti-NF-κB p65 antibodies were purchased from Cell Signaling Technology (Boston, USA).Plant material
The flowers of H. plantaginea (voucher specimen: YZH201409) were collected from Chongqing, China, and authenticated by Prof. Guoyue Zhong (Jiangxi University of Chinese Medicine).10Extraction and isolation
Dried flowers of H. plantaginea were extracted with 80% ethanol (40 L × 3) at room temperature. The combined extract (6.6 kg) was suspended in water and extracted successively with petroleum, ethyl acetate, and n-BuOH.10 In our previous studies, 28 phytochemicals were isolated from ethyl acetate and n-butanol fractions of the flowers of H. plantaginea. In order to systematically study the flowers of H. plantaginea against inflammation, in this study, we further extension of our previous work to isolate and identify more chemical constituents with anti-inflammatory activities from the fraction of ethyl acetate.Ethyl acetate fraction (127 g) was subjected to a silica gel chromatographic column (CC) eluting with CH2Cl2/MeOH gradient elution (100![[thin space (1/6-em)]](https://www.rsc.org/images/entities/char_2009.gif) :0 → 0:100, v/v) to give 4 fractions (Fr. B1–B4), and the Fr. B1 was a pure compound (6, 8.0 g). Then, the Fr. B2 (43.2 g) was subjected to an octadecylsilyl (ODS) CC eluting with a gradient elution (CH3OH/H2O, 20:80 → 0:100, v/v) to obtain 6 sub-fractions (Fr. B22–B27). The Fr. B26 (4.6 g) was separated by an ODS CC (CH3OH/H2O = 45:55 → 0:100, v/v) and pre-HPLC with the mobile phase of CH3CN–H2O (45:55, v/v, 10 mL min−1, tR = 40.0 min) and RP-18 column (5 μm, 21.2 × 250 mm, Gemini, Phenomenex Inc.) to obtain 1 (145.4 mg). The Fr. B24 (3.2 g) was purified by an ODS CC eluting with CH3OH/H2O gradient elution (25:75 → 55:45, v/v) to yield 4 sub-fractions (Fr. B241–B244). Compounds 2 (27.3 mg) and 3 (2.7 mg) were obtained with semi-pre-HPLC with RP-18 column (5 μm, 10 × 250 mm, ODS-A, YMC Inc.) from the Fr. B243 (700 mg) and Fr. B244 (710 mg), respectively. The Fr. B22 (4.0 g) was subjected to an ODS CC eluting with CH3OH/H2O gradient elution (5:95 → 15:85, v/v) and semi-pre-HPLC with the mobile phase of CH3OH–H2O (5:95, v/v, 3 mL min−1, tR = 29.9 min) and RP-18 column (5 μm, 10 × 250 mm, ODS-A, YMC Inc.) to obtain 4 (3.6 mg). The Fr. B27 (15.2 g) was applied to silica gel CC eluting with petroleum ether/ethyl acetate (100:0 → 0:100, v/v) to afford 8 sub-fractions (B271–B278). Fr. B272 (121.2 mg) was purified by pre-TLC to afford compound 5 (27.8 mg), respectively.
:0 → 0:100, v/v) to give 4 fractions (Fr. B1–B4), and the Fr. B1 was a pure compound (6, 8.0 g). Then, the Fr. B2 (43.2 g) was subjected to an octadecylsilyl (ODS) CC eluting with a gradient elution (CH3OH/H2O, 20:80 → 0:100, v/v) to obtain 6 sub-fractions (Fr. B22–B27). The Fr. B26 (4.6 g) was separated by an ODS CC (CH3OH/H2O = 45:55 → 0:100, v/v) and pre-HPLC with the mobile phase of CH3CN–H2O (45:55, v/v, 10 mL min−1, tR = 40.0 min) and RP-18 column (5 μm, 21.2 × 250 mm, Gemini, Phenomenex Inc.) to obtain 1 (145.4 mg). The Fr. B24 (3.2 g) was purified by an ODS CC eluting with CH3OH/H2O gradient elution (25:75 → 55:45, v/v) to yield 4 sub-fractions (Fr. B241–B244). Compounds 2 (27.3 mg) and 3 (2.7 mg) were obtained with semi-pre-HPLC with RP-18 column (5 μm, 10 × 250 mm, ODS-A, YMC Inc.) from the Fr. B243 (700 mg) and Fr. B244 (710 mg), respectively. The Fr. B22 (4.0 g) was subjected to an ODS CC eluting with CH3OH/H2O gradient elution (5:95 → 15:85, v/v) and semi-pre-HPLC with the mobile phase of CH3OH–H2O (5:95, v/v, 3 mL min−1, tR = 29.9 min) and RP-18 column (5 μm, 10 × 250 mm, ODS-A, YMC Inc.) to obtain 4 (3.6 mg). The Fr. B27 (15.2 g) was applied to silica gel CC eluting with petroleum ether/ethyl acetate (100:0 → 0:100, v/v) to afford 8 sub-fractions (B271–B278). Fr. B272 (121.2 mg) was purified by pre-TLC to afford compound 5 (27.8 mg), respectively.
Until now, the fractions of petroleum ether and water residue were not studied with lack of effective separation techniques in the current stage for us that because of their polarities were too small and opposite, respectively.
Cell culture
RAW 264.7 macrophages were incubated in DMEM supplemented with 10% FBS, 100 U mL−1 penicillin and 100 μg mL−1 streptomycin in a humidified atmosphere of 5% carbon dioxide (CO2) at 37 °C.Cell viability assay
RAW 264.7 macrophages (5 × 10³ cells per well) were seeded in 96-well plates and incubated in humidified 5% CO2 at 37 °C for 24 h. After two PBS washes, the cells were incubated in DMEM, and co-treated with or without sample at a concentration of 40 μM at 37 °C for 24 h. Then, 10 μL of the CCK-8 reagent was added to each well and incubated at 37 °C for another 2 h. The absorbance at 450 nm of each well was determined using a microplate reader. The percentage of cell viability% = Asample/Acontrol × 100, while RAW 264.7 macrophages with DMEM as the control group that was considered as having 100% cell viability.Measurement of NO production
RAW 264.7 macrophages (5 × 10³ cells per well) were seeded in 96-well plates and incubated for 24 h. After two PBS washes, the cells were incubated in DMEM and co-treated with or without each compound at a concentration of 40 μM at 37 °C for 1 h. Then, incubated with or without LPS (1 μg mL−1) for 24 h. A total of 50 μl of each supernatant was collected and mixed with 100 μl of Griess Reagent (a mixture of equal amounts of Griess Reagent I and Griess Reagent II). The absorbance was measured at 540 nm after 10 min of incubation at room temperature. The NO inhibition rate% = (ALPS − ALPS+sample)/(ALPS − Acontrol) × 100, where, Acontrol, ALPS, and ALPS+sample were the absorbance of RAW 264.7 macrophages with DMEM group (the control group), LPS model group, and LPS + sample group, respectively.Measurement of cytokines production
The logarithmic growth phase of the RAW 264.7 macrophages, adjusted to 5 × 10³ cells, were pre-incubated in 96-well plates with or without compounds 1 (20 μM) or 3 (20 μM) for 1 h and then added with LPS (1 μg mL−1) for 24 h. Lastly, the concentrations of TNF-α, PGE2, IL-1β, and IL-6 in the cell culture supernatant were determined using the corresponding commercially available ELISA kits according to the manufacturer's instructions.Western blot analysis
RAW 264.7 macrophages were pre-incubated with or without compounds 1 (20 μM) or 3 (20 μM) for 1 h and then treated with LPS (1 μg mL−1) for 24 h. Subsequently, the harvested cells were lysed in RIPA lysis buffer to obtain the total protein. The supernatant was separated by centrifugation at 12000 rpm for 5 min at 4 °C. The protein concentration for each aliquot was determined using a BCA protein assay kit according to the manufacturer's instruction, and the sample was boiled for 10 min in SDS-PAGE loading buffer before use. Equal amounts of control, LPS and compound-treated samples (60 μg) were mixed with SDS sample buffer, and then were separated by 12% SDS-PAGE gels and electroblotted onto a PVDF membrane. The membrane was blocked with 5% skim milk for 1 h at room temperature in Tris-buffered saline-Tween (TBST). The membranes were washed with TBST for three times and then incubated overnight at 4 °C in diluted (all at 1:1000) primary antibody solutions (anti-NF-κB p65 or anti-phosphorylated-NF-κB p65). After washing with TBST for three times, the membranes were incubated with at 1:5000 dilution of HRP-conjugated secondary antibody for 1 h at room temperature. Finally, the immunoreactive bands were placed in a Bio-Rad auto-developer (Bio-Rad, California, USA). GAPDH was the reference protein.
Data processing
All data were performed in triplicate and expressed as mean ± standard deviation (SD). Multiple comparisons were performed using one-way analysis of variance (ANOVA) and Tukey's test using GraphPad Prism 6. A P value less than 0.05 was considered statistically significant.Conflicts of interest
The authors declare no conflict of interest.Author contributions
Conceptualization: Junwei He; methodology: Jiewei He and Junwei He; software and validation: Jiewei He and Ping Guo; formal analysis, investigation and resources: Jiewei He and Junwei He; data curation: Junwei He; writing and editing: Li Yang and Junwei He; supervision: Junwei He; Project administration and funding acquisition: Junwei He.Acknowledgements
This work was financially supported by grants from the National Natural Science Foundation of China (No. 81503357), and the China Postdoctoral Science Foundation (No. 2016M600514).Notes and references
- L. Yang, L. Cao, C. L. Li, X. B. Li, J. S. Wang, H. P. Chen and J. W. He, J. Ethnopharmacol., 2022, 282, 114605 CrossRef CAS PubMed.
- Y. W. Fang, H. L. Wang, X. Y. Xia, L. Yang and J. W. He, Biomed. Pharmacother., 2022, 153, 113295 CrossRef CAS PubMed.
- L. Yang, R. L. Liu, Y. W. Fang and J. W. He, Int. Immunopharmacol., 2021, 94, 107463 CrossRef CAS PubMed.
- X. J. Jia, C. Zhang, J. L. Bao, K. Wang, Y. B. Tu, J. B. Wan and C. W. He, Inflammopharmacology, 2020, 28, 289–297 CrossRef CAS PubMed.
- L. Yang, R. L. Liu, S. Ouyang, M. Zou, Y. L. Duan, L. M. Li, T. Guan, T. Zhang and J. W. He, Inflammation, 2021, 44, 1762–1770 CrossRef CAS PubMed.
- L. Yang, R. L. Liu, A. G. Fan, J. J. Zhao, Y. Zhang and J. W. He, Front. Pharmacol., 2020, 11, 584849 CrossRef CAS PubMed.
- Y. W. Fang, L. Yang and J. W. He, Biomed. Pharmacother., 2021, 143, 112104 CrossRef CAS PubMed.
- L. Yang and J. W. He, RSC Adv., 2019, 9, 35050–35058 RSC.
- L. Yang and J. W. He, J. Ethnopharmacol., 2021, 265, 113323 CrossRef CAS PubMed.
- J. W. He, L. Yang, Z. Q. Mu, Y. Y. Zhu, G. Y. Zhong, Z. Y. Liu, Q. G. Zhou and F. Cheng, RSC Adv., 2018, 8, 18175–18179 RSC.
- L. Yang, S. T. Jiang, Q. G. Zhou, G. Y. Zhong and J. W. He, Molecules, 2017, 22, 1825 CrossRef PubMed.
- J. W. He, X. Y. Huang, Y. Q. Wang, J. Liang, R. H. Liu, G. Y. Zhong and L. Yang, Nat. Prod. Res., 2019, 33, 1599–1604 CrossRef CAS PubMed.
- L. Yang, Y. M. Lin, Z. W. He, T. F. Zhang, Y. Li, X. T. Xie, Y. F. Wu and J. W. He, Med. Chem. Res., 2020, 29, 426–430 CrossRef CAS.
- L. Yang, Y. Y. Zhu, Z. W. He, T. F. Zhang, Z. X. Xiao, R. L. Xu and J. W. He, Nat. Prod. Res., 2021, 35, 4331–4337 CrossRef CAS PubMed.
- L. Yang and J. W. He, BMC Complementary Med. Ther., 2022, 22, 55 CrossRef CAS PubMed.
- P. Zhao, Y. Iwamoto, I. Kouno, Y. Egami and H. Yamamoto, Phytochemistry, 2004, 65, 2455–2461 CrossRef CAS PubMed.
- Y. M. Dai, L. Harinsntenaina, P. J. Brodie, M. Goetz, Y. C. Shen, K. TenDyke and D. G. Kingston, J. Nat. Prod., 2013, 76, 865–872 CrossRef CAS PubMed.
- F. Alali, T. Elimat, H. Albataineh, Q. Al-Balas, M. Al-Gharaibeh, J. O. Falkinham III, W. L. Chen, S. M. Swanson and N. H. Oberlies, J. Nat. Prod., 2015, 78, 1708–1715 CrossRef CAS PubMed.
- V. Nchiozem-Ngnitedem, L. K. Omosa, S. Derese, P. Tane, M. Heydenreich, M. Spiteller, E. Seo and T. Efferth, Phytochem. Lett., 2020, 36, 80–85 CrossRef CAS.
- T. El-Elimat, J. Rivera-Chávez, J. E. Burdette, A. Czarnecki, M. B. Alhawarri, M. Al-Gharaibeh, F. Alali and N. H. Oberlies, Fitoterapia, 2018, 127, 201–206 CrossRef CAS PubMed.
- Y. C. Yu, S. J. Zhu, X. W. Lu, Y. K. Wu and B. Liu, Eur. J. Org. Chem., 2015, 22, 4964–4972 CrossRef.
- N. Zhang, X. Q. Chu and J. Q. Jiang, Chin. Tradit. Herb. Drugs, 2015, 46, 1120–1124 CAS.
- R. M. Lu, G. F. Liao, J. H. Wei, B. Li and Z. M. Lin, Nat. Prod. R&D, 2015, 27, 2060–2063 Search PubMed.
- C. F. Yao, Y. Wang, L. Jiang, X. Ma, J. Pan, Y. T. Li and J. Y. Li, Chin. Med. J., 2018, 41, 1369–1371 Search PubMed.
- E. Abdel-Sattar and S. El-Mekkawy, Nat. Prod. Res., 2009, 23, 861–865 CrossRef CAS PubMed.
- X. Cao, C. J. Li, J. Z. Yang, B. X. Wei, Y. M. Luo and D. M. Zhang, Chin. J. Chin. Mater. Med., 2011, 36, 1028–1031 CAS.
- M. F. Abazari, N. Nasiri, S. Z. Karizi, F. Nejati, H. Haghi-Aminijan, S. Norouzi, P. Piri, L. Estakhr, D. R. Faradonbeh, M. Kohandani, K. Daliri, N. Sanadgol and H. Askari, Mini-Rev. Med. Chem., 2021, 21, 2187–2201 CrossRef CAS PubMed.
Footnote |
| † Electronic supplementary information (ESI) available. See DOI: https://doi.org/10.1039/d2ra07623c |
| This journal is © The Royal Society of Chemistry 2023 |