DOI:
10.1039/D2RA07601B
(Paper)
RSC Adv., 2023,
13, 2115-2122
Cationic styryl dyes for DNA labelling and selectivity toward cancer cells and Gram-negative bacteria†
Received
29th November 2022
, Accepted 16th December 2022
First published on 11th January 2023
Abstract
Fluorescence-based methods are important tools for the analysis of nucleic acids in vitro and in cells. In this study, two cationic cyanine–styryl derivatives were produced using a two-step synthesis. Their optical properties were evaluated in different solvents, and frontier molecular orbital theory was utilized to interpret the findings. The DNA binding of these molecules was investigated to show fluorescence intensification. The molecular docking of both dyes in DNA illustrated the relevance of the electrostatic interaction between the quaternary ammonium of both dyes and the phosphate of the DNA backbone. Last but not least, applications of the synthesized styryl dyes were demonstrated to be selective towards cancer cells and particular kinds of bacteria.
Introduction
For fluorescent bioanalysis and cell imaging of nucleic acids, the development of new dyes with intriguing optical properties is necessary. In terms of their structures, which consist of planar polycyclic conjugated aromatic heterocycles, most chemosensors can intercalate between two neighboring bases in duplex DNA through an optimal interaction.1–3 Positively charged heterocycles are the most advantageous family of compounds for such chemosensors. It is hypothesized that a significant part of the stability of the interactions is contributed by the electrostatic interaction between DNA and positively charged chemosensors. It is advantageous for the intercalation process as well as for binding to nucleic acids.4–6 As a result, several positively charged dyes, including derivatives of quinolizinium, benzooxazolinium, benzothiazolinium, and acridizinium, have been successfully created as potent fluorescent probes for DNA detection, as well as probes that specifically target quadruplexes.7,8
As potential biological staining agents, styryl dyes have recently grown in popularity due to their many appealing characteristics, such as their simple synthetic process, excellent photostability, tunable fluorescence, and high fluorescence quantum yield when paired with nucleic acid targets that exhibit weak background fluorescence signals.9,10 Based primarily on their recently discovered properties as brilliant noncovalent binders to RNA11 and DNA, the cyanine–styryl-type dyes stand out as promising candidates for nucleic acids.12–16
Asymmetric cyanine dyes, such as styrylindolium and styrylquinolinium dyes, typically have significant Stokes shifts (typically over 100 nm), which are crucial to minimizing background interference for live-cell imaging.17,18 However, due to the mobility around the etheno bridge connecting the dyes' electron-donating and electron-accepting moieties, they often display low quantum yield (typically <0.01) in aqueous solution.19,20
Although many studies on cyanine–styryl dyes have reported their applications in RNA/DNA binding, only a very small number of studies have revealed antiproliferative effects against cancer cells or bacteria.9,21–23 For example, the benzothiazole, benzoxazole, and benzothiazolopyrimidine moieties of cyanine derivatives were associated with the greatest antiproliferative effects, with half-maximal inhibitory concentration (IC50) values of 0.06 and 0.001 μM for solid tumour and leukemia cell lines being determined, respectively. Additionally, some of these dyes presented high selectivity toward cancer cells compared with normal ones.8 In addition, for selectivity testing, a monomethine cyanine dye derived from benzoxazole was the most promising compound among the cyanine derivatives in the series (IC50 for Caco-2 = 0.67 μM and a selectivity index of 20.9 toward Caco-2 versus normal human dermal fibroblasts (NHDF)).17
In this study, we would like to introduce small dyes with a facile synthesis that show enhanced fluorescence upon binding non-covalently to DNA. These might represent a viable option for nucleic acid quantification in biochemistry research, such as gel electrophoresis and cell imaging techniques. Moreover, we are interested in systematically studying the biological properties of the cationic cyanine–styryl dyes. Therefore, two derivatives were developed in a two-step synthesis. Their optical properties were evaluated in different solvents and explained using frontier molecular orbital theory. Their bindings to DNA were investigated to show fluorescence enhancement. The molecular docking of both dyes in DNA showed the importance of electrostatic interaction between the quaternary ammonium of both dyes and the phosphate of the DNA backbone. Lastly, applications of the synthesized styryl dyes have been demonstrated, with selectivity toward cancer cells and particular kinds of bacteria.
Results and discussion
Synthesis
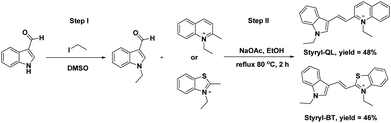
Two cationic styryl dyes were designed to contain a quaternary ammonium heteroaromatic core with a quinoline (for Styryl-QL) or benzothiazole (for Styryl-BT) moiety connected to an indole ring via a vinylene (–CH![[double bond, length as m-dash]](https://www.rsc.org/images/entities/char_e001.gif) CH–) bridge (Scheme 1). The N-ethylated heteroaromatic compounds (4-ethylquinoline, 2-ethylbenzothiazole, and 1-ethylindole-3-carbaldehyde) were prepared independently using simple heating conditions.15 The N-ethylated indole aldehyde was then condensed with quinolinium or benzothiazolium salt using an aldol-type reaction in refluxing ethanol. This method offered a straightforward synthetic process to produce the cationic styryl dyes (Styryl-QL and Styryl-BT) in modest yields.
CH–) bridge (Scheme 1). The N-ethylated heteroaromatic compounds (4-ethylquinoline, 2-ethylbenzothiazole, and 1-ethylindole-3-carbaldehyde) were prepared independently using simple heating conditions.15 The N-ethylated indole aldehyde was then condensed with quinolinium or benzothiazolium salt using an aldol-type reaction in refluxing ethanol. This method offered a straightforward synthetic process to produce the cationic styryl dyes (Styryl-QL and Styryl-BT) in modest yields.
 |
| | Scheme 1 Synthetic scheme of Styryl-QL and Styryl-BT. | |
Photophysical properties
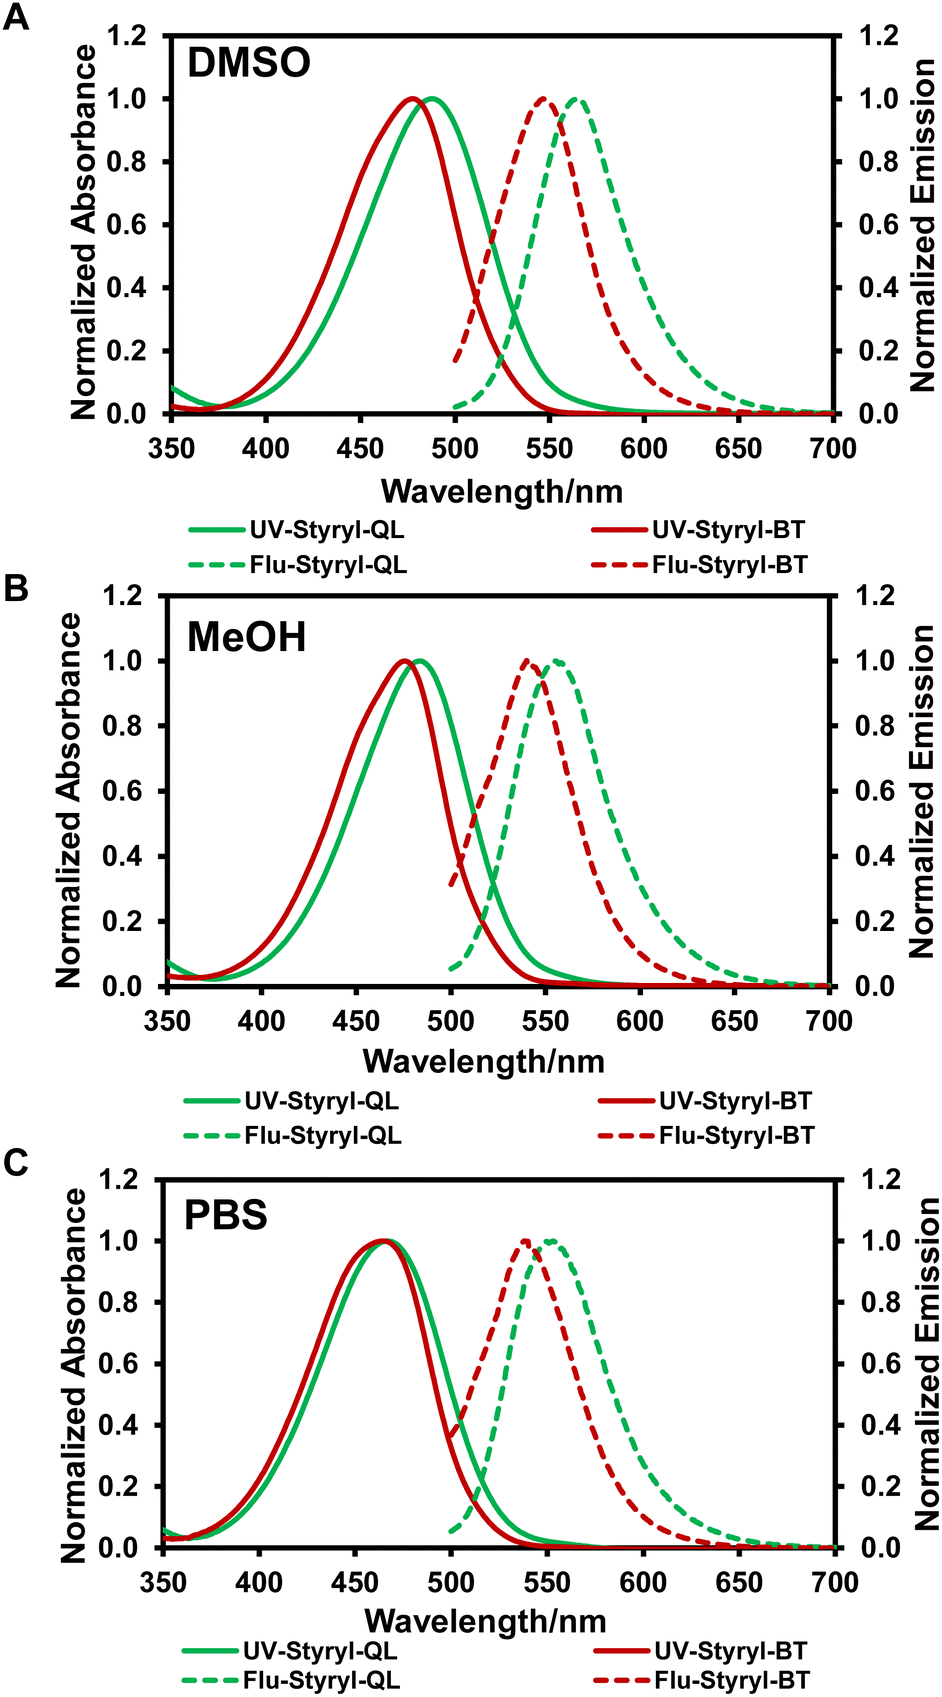
The cationic styryl dyes exhibit considerable visible absorption (400 to 550 nm) and emission (500 to 670 nm) in DMSO, MeOH, and PBS (Fig. 1), with Styryl-QL showing a slight red-shift compared to Styryl-BT. In PBS solution, both dyes' absorption and emission were slightly blue-shifted (Table 1). Considering that water has a better ability to solvate the dissolved charged species, solvatochromism may be the cause of the hypsochromic shift that was observed in donor–acceptor (D–A) systems with large dipole moments.24,25 In addition, both dyes exhibit Stokes shifts larger than 70 nm, and their fluorescence quantum yields are above 0.06 in aqueous solution, which is higher than other similar dyes.26–28 Therefore, their photophysical properties are beneficial for cell imaging (Table 1). Additionally, these dyes withstood light exposure for 30 minutes, as demonstrated by constant irradiation with blue light at 450 nm over this period (Fig. S1†).
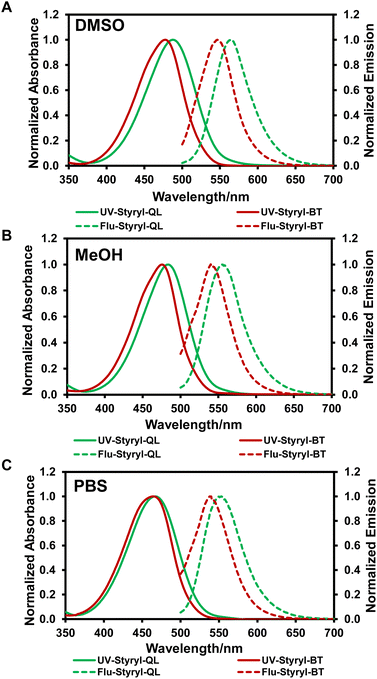 |
| | Fig. 1 UV-vis absorption and fluorescence (excited at 488 nm) spectra of the styryl dyes (10 μM) in (A) DMSO, (B) MeOH and (C) PBS. | |
Table 1 The photophysical properties of styryl dyes in various solvents
| Dye |
Solvent |
λmaxa (nm) |
λemissb (nm) |
Δλc (nm) |
Φfd |
εe (M−1 cm−1) |
| λabs = absorption maximum wavelength. λem = emission maximum wavelength (excitation wavelength = 488 nm). Δλ = Stokes shift (λem – λabs). Φf = fluorescence quantum yield calculated using fluorescein as a standard (Φ = 0.79 in DMSO). ε = molar absorptivity. |
| Styryl-QL |
DMSO |
488 |
565 |
77 |
0.006 |
2.55 × 10⁴ |
| MeOH |
483 |
555 |
72 |
0.037 |
2.88 × 10⁴ |
| PBS |
466 |
533 |
87 |
0.065 |
2.24 × 10⁴ |
| Styryl-BT |
DMSO |
478 |
547 |
69 |
0.009 |
4.97 × 10⁴ |
| MeOH |
475 |
540 |
65 |
0.033 |
5.77 × 10⁴ |
| PBS |
464 |
538 |
74 |
0.093 |
4.69 × 10⁴ |
Frontier molecular orbital (FMO) calculation
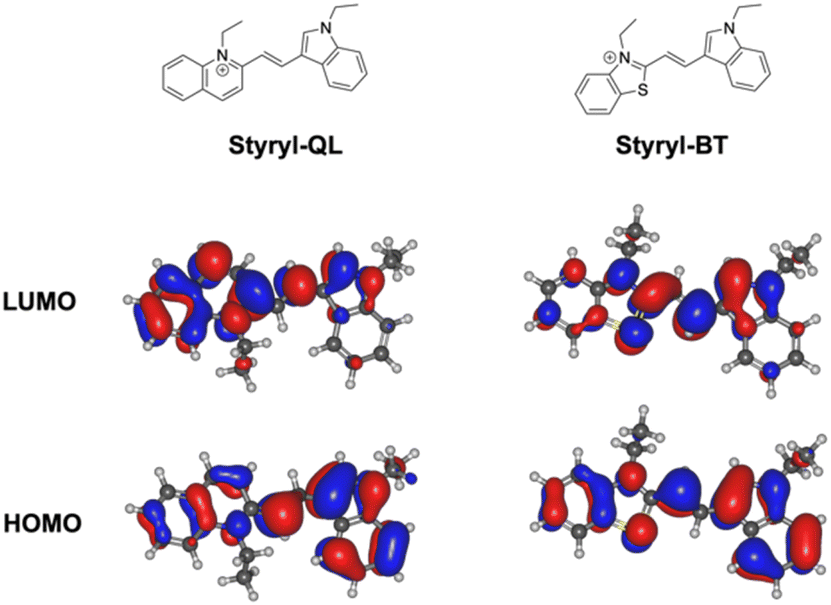
Molecular orbital calculations for Styryl-QL and Styryl-BT at the DFT (B3LYP/6-311G) level revealed that the frontier orbitals are centered at the fluorophores. The optimized geometries of the dyes are illustrated in Fig. 2 and S2,† in which the structures have efficient donor–acceptor (D–A) interaction. The HOMO and LUMO structures in Fig. 2 reveal that they are in the S0 state. The HOMO structures of Styryl-QL and Styryl-BT show the electron density distribution at the indolium residue (strong π character), whereas the LUMO structures show electron density redistribution taking place from the indolium residue to the acceptor through the ethylene bridge. Moreover, the FMOs suggested that Styryl-QL has stronger intramolecular charge transfer (ICT) than Styryl-BT, leading to a bathochromic shift of the absorption spectrum. The energy gap (Egap) between the HOMO and LUMO exhibits somewhat varied values but follows the same pattern for the photophysical characteristics of both fluorophores (Table 2). Presumably, solvation has little effect on the dyes' photophysical characteristics.
 |
| | Fig. 2 Frontier molecular orbital calculation obtained from DFT/B3-LYP/6-311G calculations in the COSMO phase using the dielectric environment of MeOH (32.6). | |
Table 2 Values of the HOMO and LUMO using DFT/B3-LYP/6-311G calculations for different dielectric environments: gas phase (1), DMSO (47.42), and MeOH (32.6)
| Name |
Condition |
HOMO (eV) |
LUMO (eV) |
Egap (eV) |
| Styryl-QL |
DFT (ε = 1) Gas phase |
−8.427 |
−5.602 |
+2.825 |
| DFT (ε = 32.6) MeOH |
−5.887 |
−2.899 |
+2.988 |
| DFT (ε = 47) DMSO |
−5.851 |
−2.858 |
+2.992 |
| Styryl-BT |
DFT (ε = 1) gas phase |
−8.543 |
−5.710 |
+2.833 |
| DFT (ε = 32.6) MeOH |
−5.950 |
−3.002 |
+2.947 |
| DFT (ε = 47) DMSO |
−5.912 |
−2.961 |
+2.950 |
DNA binding
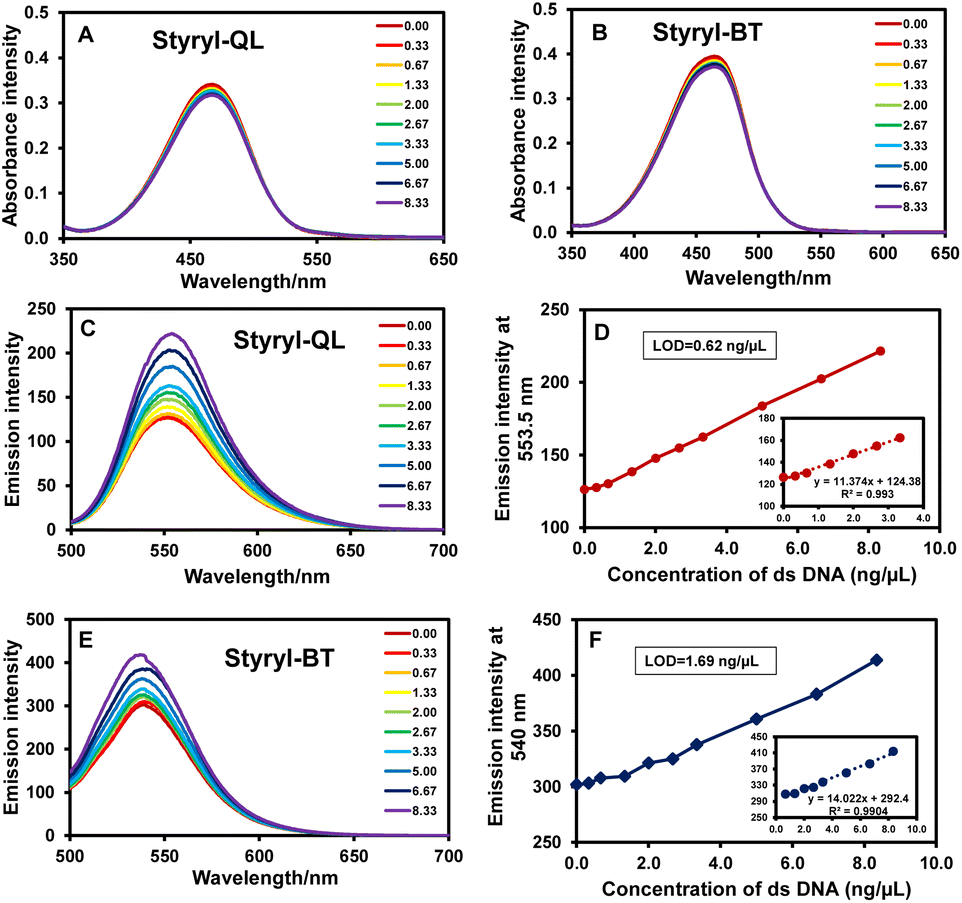
To investigate the DNA binding of both dyes, the genomic DNA of E. coli was isolated for the following tests. The absorbance of the cationic styryl dyes slightly decreased with the addition of DNA. This might be due to a change in the geometry (e.g., planarization) of the dye upon binding to DNA and/or the change of polarity in the DNA binding pocket.12,29,30 However, the absorbance changes are too small to be applied in practical analysis. Interestingly, the styryl dyes showed improved sensitivity in the detection of DNA in fluorescence mode, with LODs of 0.62 and 1.69 ng mL−1 for Styryl-QL and Styryl-BT, respectively (Fig. 3).
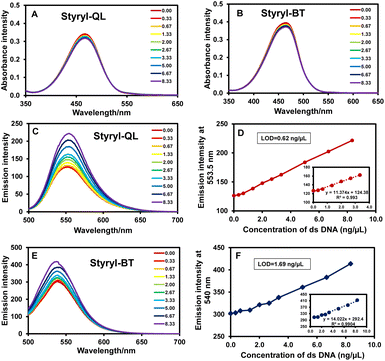 |
| | Fig. 3 Titration of Styryl-QL and Styryl-BT solutions with different amounts of dsDNA (10 μM dye, 10 mM NaPi buffer, 250 mM NaCl, 2% ethanol). UV-vis absorption of (A) Styryl-QL and (B) Styryl-BT upon dsDNA titration. Fluorescence (λex = 488 nm) changes of (C), (D) Styryl-QL and (E), (F) Styryl-BT upon dsDNA titration. | |
Selectivity
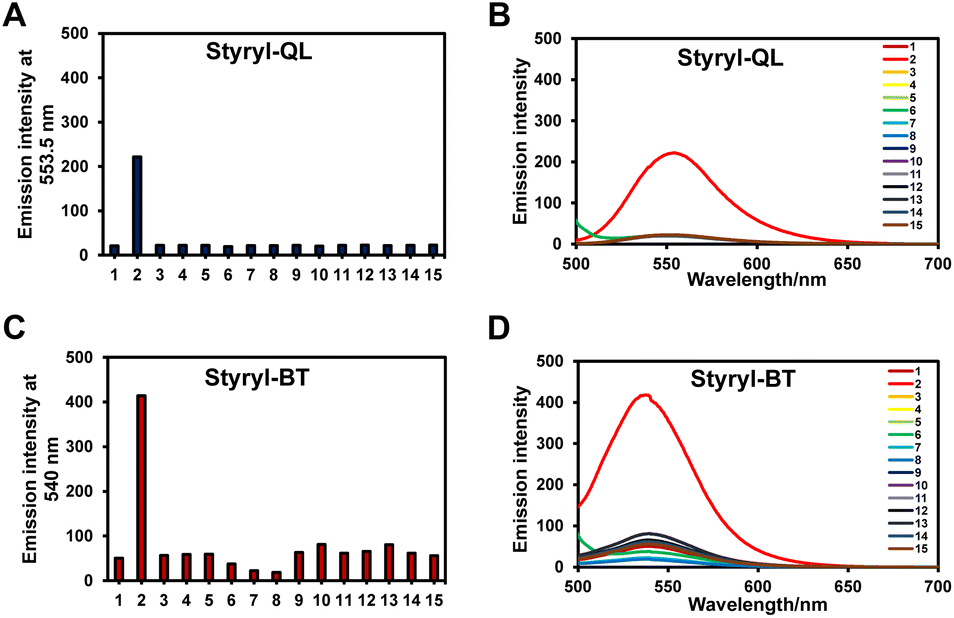
To confirm that the probes could specifically detect the DNA, the selectivities of Styryl-QL and Styryl-BT in the detection of DNA were then elucidated using fluorescence spectroscopy via comparison with various cations, anions, amino acids, reductants, and oxidants in phosphate buffered saline (2 mM, pH = 7.4). Upon the addition of 100 equivalents of Ni2+, Ba2+, Mg2+, Pb2+, SO32−, HSO3−, S2−, Cys, Gly, GSH, DTT, H2O2, HClO, and DNA (8 ng μL−1) into solutions of Styryl-QL and Styryl-BT (10 μM), only DNA immediately turned on the fluorescence signal when excited at 488 nm (Fig. 4). Thus, Styryl-QL and Styryl-BT can serve as selective fluorescent chemosensors for DNA detection.
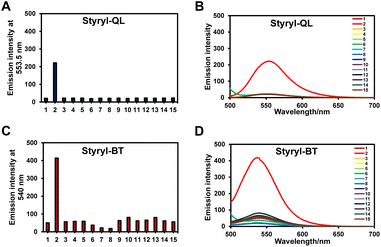 |
| | Fig. 4 Fluorescence analysis of styryl dyes (10 μM) in the detection of dsDNA. (A) Styryl-QL (at 553.5 nm) and (B) Styryl-BT (at 540 nm). Inset: histogram representing the fluorescence enhancement and quenching of styryl dyes in the presence of various anions, cations, biothiols, and oxidizing agents. 1: None; 2: dsDNA; 3: Ni2+; 4: Ba2+; 5: Mg2+; 6: Pb2+; 7: SO32−; 8: HSO3−; 9: S2−; 10: Cys; 11: Gly; 12: GSH; 13: DTT; 14: H2O2; 15: HClO (1 mM) in PBS buffer. λex = 488 nm. | |
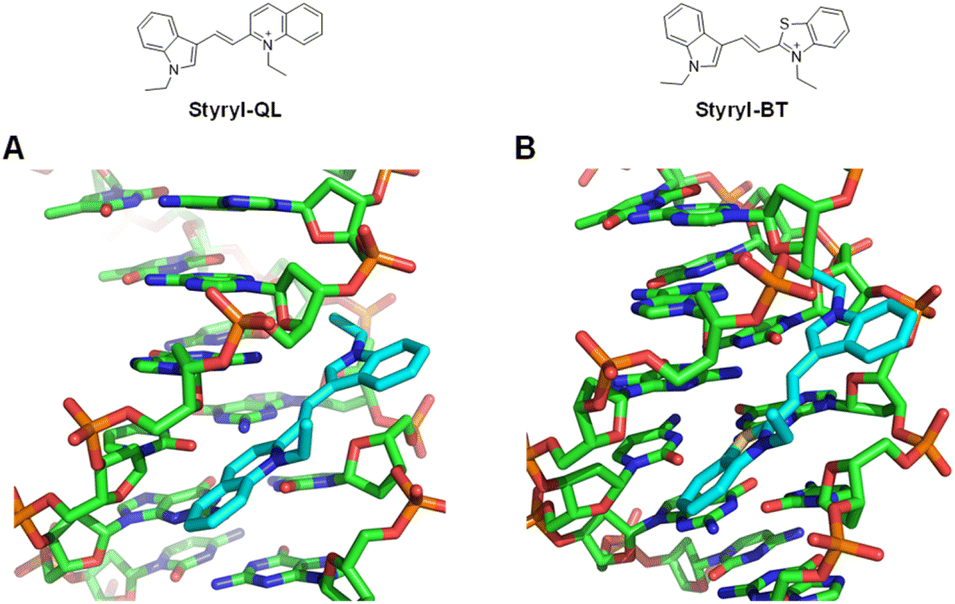
Docking
To further investigate the binding affinity improvement of cationic styryl dyes toward DNA and their mode of binding, molecular dockings of Styryl-QL and Styryl-BT were performed with a crystal structure of the Drew-Dickerson DNA duplex (PDB: 4C64) by AutoDock Vina. The calculated binding energies are −8.0 and −7.4 kcal mol−1, respectively. The molecular docking analysis showed that Styryl-QL and Styryl-BT bind to the minor groove of DNA. The major binding interaction of Styryl-QL and Styryl-BT to DNA is that the quaternary ammonium side chain has an important electrostatic interaction with the phosphate backbone of DNA. To rationalize the lower binding ability of Styryl-BT, it could be due to the resonance effect of the sulfur atom to decrease the quaternary ammonium charge. Due to the increase of fluorescence intensity upon binding on DNA, the dihedral angle between the electron-rich aromatic and heteroaromatic moieties was constrained to nearly 0° to maximize their ICT via donor–acceptor conjugation as shown in Fig. 5.
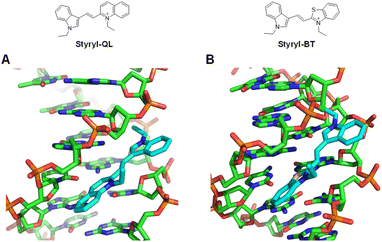 |
| | Fig. 5 Molecular docking of (A) Styryl-QL and (B) Styryl-BT on a minor-groove of DNA (PDB: 4C64). | |
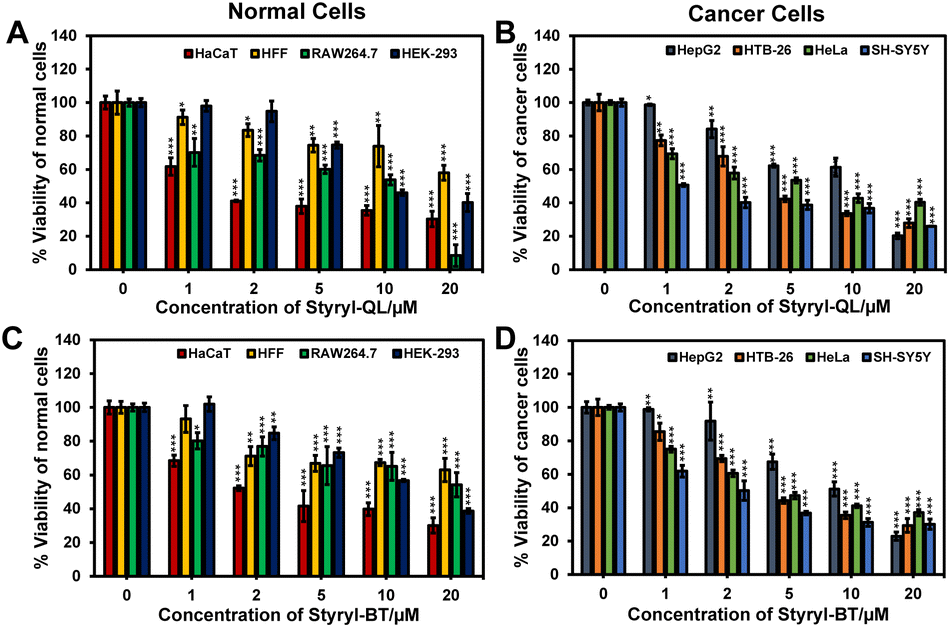
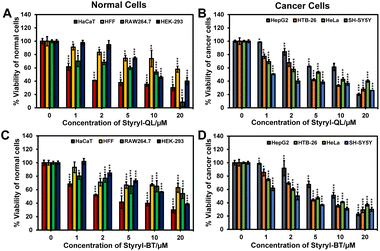
Cell toxicity
Styryl-QL and Styryl-BT were examined in terms of their cytotoxicity to a variety of cell types, including normal and cancer cells, to illustrate their cell imaging applications. The cancer cells were more sensitive to the styryl dyes, as seen in Fig. 6. However, keratinocyte cells (HaCaT) also responded sensitively to our dyes, as the viability of the cells decreased in a similar manner to that of cancer cells. Additionally, the half maximal inhibitory concentration (IC50) revealed that both Styryl-QL and Styryl-BT have stronger anti-tumor properties towards a neuroblastoma cell line (SH-SY5Y). In general, both substances have the ability to act as anti-cancer agents (Table 3 and Fig. S3†).
 |
| | Fig. 6 Cytotoxicity effect of styryl dyes incubated for 24 h. Relative viabilities of normal and cancer cells treated with Styryl-QL (A and B) and Styryl-BT (C and D). Statistical analysis is based on Student's t-test (*P < 0.05, **P < 0.01, ***P < 0.001). | |
Table 3 IC50 of styryl dyes incubated for 24 h with normal and cancer cells
| Cell line |
IC50 |
| Styryl-QL |
Styryl-BT |
| Cancer cells |
| HepG2 |
9.50 |
9.34 |
| HeLa |
6.12 |
5.41 |
| SH-SY5Y |
0.87 |
2.20 |
| HTB-26 |
4.45 |
5.18 |
![[thin space (1/6-em)]](https://www.rsc.org/images/entities/char_2009.gif) |
| Normal cells |
| HEK-293 |
11.59 |
12.80 |
| HFF |
>20 |
>20 |
| HaCaT |
1.74 |
3.31 |
| RAW264.7 |
5.18 |
>20 |
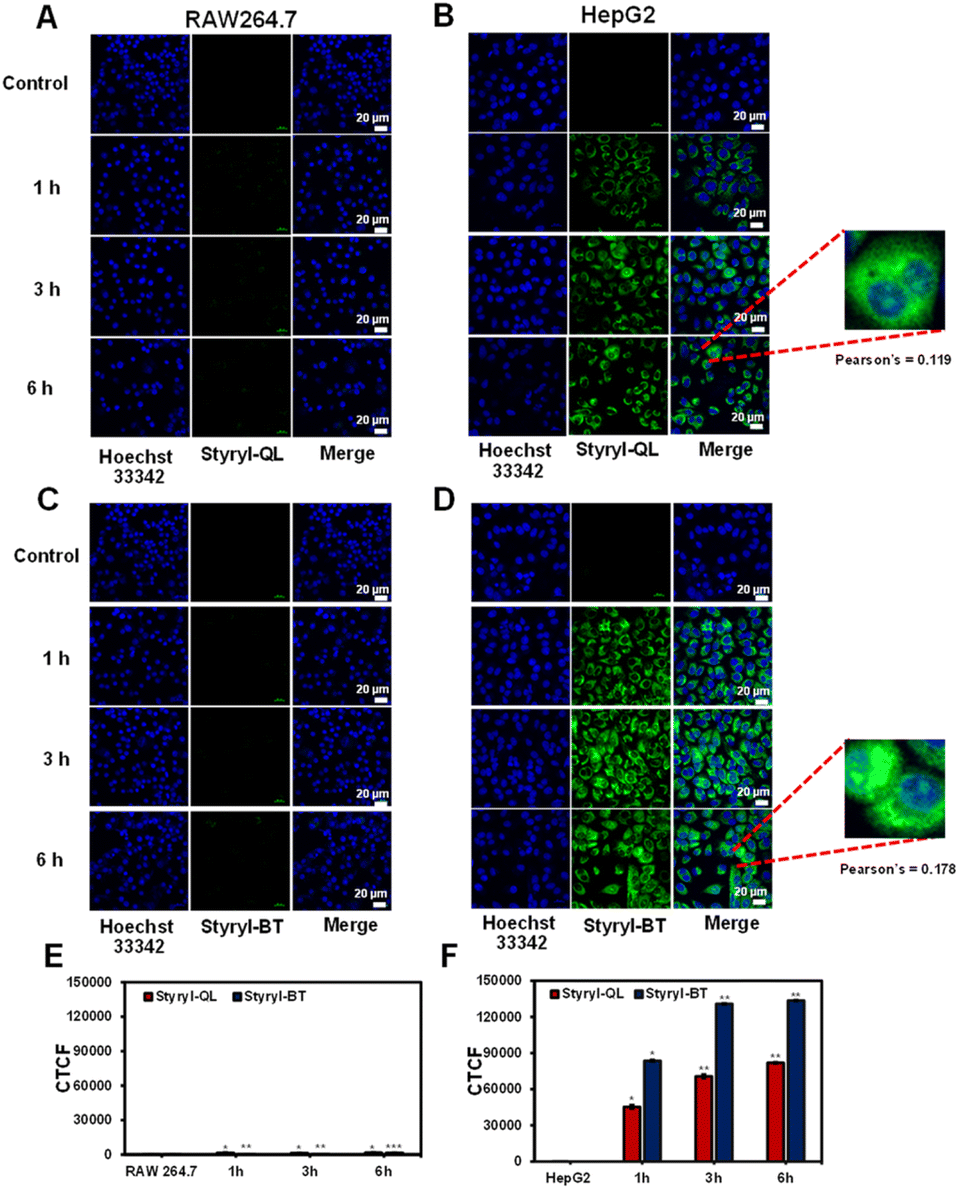
Cell imaging
Styryl-QL and Styryl-BT showed rapid cellular uptake within one hour because their positively charged structures favored cell membrane permeability (Fig. 7). In the comparison between normal cells (RAW264.7) and cancer cells (HepG2), the compounds were fast internalized to cancer cells and retained inside the cancer cells with a small number in the nucleus (Pearson's coefficient = 0.12 and 0.18 for Styryl-QL and Styryl-BT, respectively). No green fluorescence from either compound was observed from the normal cells for up to 6 h incubation. These results suggested the selectivity of both styryl cationic dyes towards cancer cells.
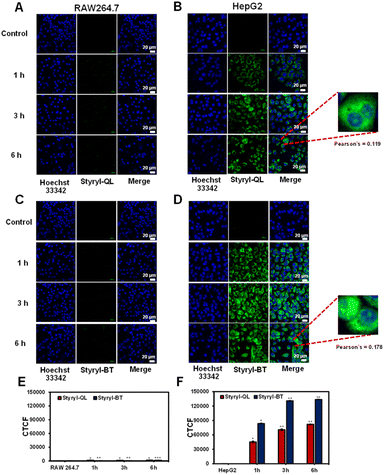 |
| | Fig. 7 Confocal images of time-dependent cell internalization. RAW 264.7 cells were treated with (A) Styryl-QL and (C) Styryl-BT. HepG2 cells were treated with (B) Styryl-QL and (D) Styryl-BT. Figure (E) and (F) are quantitative fluorescence intensities represented as corrected total cell fluorescence (CTCF), which were quantified using ImageJ and represent the mean ±SD (from three independent experiments, 30 cells/set). Statistical analysis is based on t-test (*P < 0.05, **P < 0.01, ***P < 0.001), where the comparison is between the control and different incubation durations (for each compound). Scale bar = 20 μm. | |
Anti-bacterial activity
To further explore their possible application, the antibacterial activities of Styryl-QL and Styryl-BT were evaluated in Gram-negative bacteria (Escherichia coli 780) and Gram-positive bacteria (Staphylococcus aureus 1466), which were available in our lab. The results showed that Styryl-QL and Styryl-BT can inhibit the growth of bacterial cells in MH broth. The minimum inhibitory concentration (MIC) values of Styryl-QL and Styryl-BT for E. coli 780 are 4 and 16 μg mL−1, respectively, and for S. aureus 1466 they are 4 and 1 μg mL−1, respectively (Fig. 8 and Table 4). The MBC values of Styryl-QL and Styryl-BT for E. coli 780 are 16 and 25 μg mL−1, respectively, and for S. aureus 1466 they are 4 μg mL−1 for both compounds. The MBCs of these compounds are very close to their MICs. In general, if the MBC value of an antimicrobial agent does not exceed four times the MIC, it is regarded as bactericidal. However, E. coli is more resistant to these compounds than S. aureus because the E. coli strain has an extra outer membrane containing lipopolysaccharides compared to the S. aureus strain; thus, Styryl-QL and Styryl-BT could not enter E. coli cells easily. Therefore, the MBC value for E. coli is higher than that for S. aureus. Additionally, our cationic dyes demonstrated comparable potency to commercial anti-bacterial agents (Table S1†).31
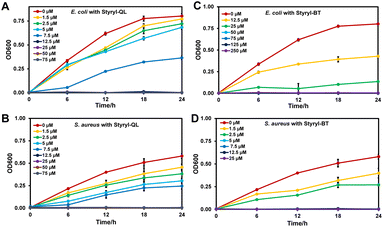 |
| | Fig. 8 Growth curves of E. coli 780 (A and C) and S. aureus 1466 (B and D) in response to Styryl-QL and Styryl-BT, over a time course of 24 h. | |
Table 4 Antibacterial activities of Styryl-QL and Styryl-BT
| Compound |
E. coli 780 |
S. aureus 1466 |
| MIC (μg mL−1) |
MBC (μg mL−1) |
MIC (μg mL−1) |
MBC (μg mL−1) |
| Styryl-QL |
4 ± 0.005 |
16 ± 0.001 |
4 ± 0.002 |
4 ± 0.002 |
| Styryl-BT |
16 ± 0.001 |
25 ± 0.002 |
1 ± 0.005 |
4 ± 0.005 |
Conclusions
In this study, two cationic cyanine–styryl derivatives, Styryl-QL and Styryl-BT, were proved to have favorable optical properties for bio-imaging, including acceptable fluorescence quantum yields in aqueous solvent (0.06–0.09) and Stokes shifts larger than 70 nm. In addition, frontier molecular orbital theory showed that Styryl-QL exhibits stronger ICT than Styryl-BT, thus explaining the red-shifted absorption spectra. Furthermore, the DNA binding of these dyes was investigated to show fluorescence enhancement only upon the addition of DNA, but not other possible interferents. The significance of the electrostatic interaction between the quaternary ammonium of Styryl-QL and Styryl-BT and the phosphate of the DNA backbone was demonstrated by the molecular docking of every dye in DNA. Applications of synthetic styryl dyes have also been shown with selective uptake by cancer cells. In addition, the dyes also displayed anti-bacterial and anti-cancer properties. Compared to earlier styryl-based DNA detection systems, our study provides expanded applications in antiproliferative action against bacteria and cancer cells (Table S2†). This might offer a new perspective for looking into the potential of styryl dyes.
Experimental
Materials and methods
All chemicals and reagents purchased from commercial sources (Sigma Aldrich, TCI, and Merck) were used without further purification. Analytical thin layer chromatography (TLC) was performed on TLC Silica gel 60 F254 (Merck) and visualized under a UV cabinet. Column chromatography purification was performed using silica gel (Carlo Erba) as a stationary phase for chromatography. UV-vis absorption and fluorescence spectra were recorded using a UV-vis spectrophotometer (Agilent Technologies Cary 300, CA, USA) and a fluorescence spectrophotometer (PerkinElmer LS55, Waltham, MA, USA), respectively. Nuclear magnetic resonance (NMR) spectroscopy (1H and 13C NMR) was recorded on a Bruker 500 MHz spectrometer at room temperature, with TMS as an internal reference. The chemical shifts of the 1H NMR spectra were recorded and reported in ppm using the solvent resonance (DMSO at 2.54 ppm). 13C NMR spectra were also recorded in ppm using the solvent resonance (DMSO at 40.45 ppm). High-resolution mass spectroscopy (HRMS) spectra were recorded on an ESI-MS spectrometer (MicrOTOF, Bruker, Rheinstetten, Germany). The genomic DNA of E. coli 789 was isolated using a bacterial DNA extraction kit (Vivantis) according to the manufacturer's instructions and used as dsDNA, whose concentration was determined using a NanoDrop 2000 spectrophotometer (Thermo Scientific), in the study.
General procedure for the synthesis of styryl dyes
(E)-1-ethyl-2-(2-(1-ethyl-1H-indol-3-yl)vinyl)quinolin-1-ium, Styryl-QL was synthesized from a mixture of 1-ethyl-1H-indole-3-carbaldehyde (100 mg, 0.58 mmol), 1-ethyl-2-methylquinolin-1-ium (172 mg, 0.58 mmol) and anhydrous sodium acetate (95 mg, 1.16 mmol) heated at 80 °C for 3 h in the presence of EtOH (4 mL). After that, the solvent was removed, and the crude product was then purified using silica gel column chromatography (5% v/v MeOH/CH2Cl2) to yield the pure product as an orange solid (90 mg, 48% yield); mp 244–246 °C. Characterization of Styryl-QL: 1H NMR (500 MHz, DMSO-d6) δ 8.77 (d, J = 9.0 Hz, 1H), 8.65 (d, J = 15.5 Hz, 1H), 8.61 (d, J = 9.5 Hz, 1H), 8.48 (s, 1H), 8.41 (d, J = 9.0 Hz, 1H), 8.22 (d, J = 8.0 Hz, 1H), 8.15 (d, J = 6.5 Hz, 1H), 8.05 (t, J = 8.0 Hz, 1H), 7.81 (t, J = 7.5 Hz, 1H), 7.66 (d, J = 6.5 Hz, 1H), 7.46 (d, J = 15.5 Hz, 1H), 7.33 (s, 2H), 5.01 (d, J = 7.5 Hz, 2H), 4.34 (d, J = 7.0 Hz, 2H), 1.57 (t, J = 7.0 Hz, 3H), 1.44 (t, J = 7.0 Hz, 3H), 13C NMR (125 MHz, DMSO-d6) δ 156.0, 143.1, 142.3, 138.5, 137.6, 136.2, 134.8, 130.6, 128.4, 127.4, 126.6, 123.9, 122.7, 120.7, 120.4, 118.8, 114.1, 111.9, 110.9, 46.0, 41.9, 15.6, 14.0, HRMS (ESI) calcd for C23H23N2+ [M + H]+ 327.1856, found 327.1853.
(E)-3-ethyl-2-(2-(1-ethyl-1H-indol-3-yl)vinyl)benzo[d]thiazol-3-ium, Styryl-BT was synthesized by the mixture of 1-ethyl-1H-indole-3-carbaldehyde (100 mg, 0.58 mmol), 3-ethyl-2-methylbenzo[d]thiazol-3-ium (102 mg, 0.58 mmol) and anhydrous sodium acetate (95 mg, 1.16 mmol) heated at 80 °C for 3 h in the presence of EtOH (4 mL). After that, the solvent was removed, and the crude product was then purified using silica gel column chromatography (5% v/v MeOH/CH2Cl2) to yield the pure product as an orange solid (88 mg, 46% yield); mp 236–238 °C. Characterization of Styryl-BT: 1H NMR (500 MHz, DMSO-d6) δ 8.53 (s, 1H), 8.40 (d, J = 15.5 Hz, 1H), 8.29 (d, J = 8.0 Hz, 1H), 8.22 (d, J = 7.0 Hz, 1H), 8.13 (d, J = 8.0 Hz, 1H), 7.76 (t, J = 8.0 Hz, 1H), 7.68 (d, J = 7.5 Hz, 1H), 7.65 (d, J = 7.5 Hz, 1H), 7.46 (d, J = 15.5 Hz, 1H), 7.36 (quin, J = 7.0 Hz, 2H), 4.84 (d, J = 8.0 Hz, 2H), 4.33 (q, J = 7.5 Hz, 2H), 1.50–1.37 (m, 6H). 13C NMR (125 MHz, DMSO-d6) δ 171.3, 143.9, 140.8, 138.7, 137.5, 129.0, 127.4, 127.0, 125.6, 124.0, 123.9, 122.8, 121.0, 115.7, 113.4, 111.7, 105.0, 43.5, 41.6, 14.9, 13.6, HRMS (ESI) calcd for C21H21N2S1+ [M + H]+ 333.1420, found 333.1429.
UV-vis and fluorescence spectroscopic measurements
For the UV-vis absorption and fluorescence spectra, stock solutions (5 mM) of the styryl dyes were prepared in DMSO. The appropriate amount of the stock solution was added to 3 mL of dimethyl sulfoxide (DMSO), methanol (MeOH) or 0.01 M PBS buffer (pH 7.4) to obtain a final concentration of 10 μM in each testing solution. For fluorescence experiments, the emission spectra were recorded at an excitation wavelength of 488 nm. The fluorescence quantum yields (Φf) were calculated in DMSO relative to fluorescein as a standard (Φ = 0.75).
Photo-stability measurement
Each styryl dye was dissolved in DMSO to obtain a final concentration of 10 μM for measuring the absorption and emission intensity. Each styryl dye was then irradiated using a blue lamp (250 W) at a distance of 75 cm. Each solution's UV-vis absorption and fluorescence spectra were measured at different time points, including 0, 1, 5, 10, 15, 20 and 30 min. Photo-stability was reported in terms of photobleaching absorption and emission (%) calculated from the absorption and emission intensity change at the absorption and emission maxima before and after irradiation.
Computational calculation
The frontier molecular orbitals of the styryl dyes were calculated using time-dependent density functional theory (DFT/TD-DFT) at the B3-LYP/6-311G level using the Turbomole program. The geometrical structure of the electronic ground states was optimized by considering the continuum solvation model (CSM) in the conductor-like screening model (Cosmo), using the dielectric environments of the gas phase (1), DMSO (47.42), and MeOH (32.6). The electronic relaxation of the solvent polarization was taken into consideration at the same theoretical level when calculating the vertical excitation using the nonequilibrium solvation model.
Cell cultures
The human hepatoma cell cancer (HepG2) and RAW264.7 cell lines were obtained from ATCC (American Type Culture Collection), cultured on 75 cm3 flasks, and maintained in complete medium. The complete medium contained Dulbecco's modified Eagle's media (DMEM, Hyclone) supplemented with 10% (v/v) heat-inactivated fetal bovine serum (FBS, Gibco, Carlsbad, CA, USA) and 1% (v/v) Penicillin/Streptomycin Solution 100× (P/S, Gibco, NY, USA). All cells were grown at 37 °C in a humidified incubator under an 95% atmospheric air and 5% CO2 environment.
Cytotoxicity of styryl dyes
To test toxicity of the styryl dyes, approximately 2 × 10⁴ cells per well of HepG2 and RAW264.7 cells were seeded into 96-well cell culture plates and incubated in complete media for 24 h. Thereafter, the cells were treated with 0, 1, 2, 5, 10, and 20 μM of styryl dyes and culturing was continued at 37 °C for 24 h. After incubation, the cells were washed with 0.01 M PBS buffer (pH 7.4) three times and treated with methylthiazolyldiphenyl-tetrazolium bromide (MTT reagent, 0.5 mg mL−1, Sigma-Aldrich) for 3 h. After removal of the medium, DMSO was added to dissolve the formazan product, and the cell viability was assessed using a microplate reader (BMG Labtech/SPECTROstar Nano) at a wavelength of 560 nm.
Confocal microscope imaging
HepG2 and RAW264.7 cells (7 × 10³ cells per well) were seeded on 8-well plates with a chambered coverglass (LabTek, Nunc) and incubated in completed media for 24 h. After that, the cells were treated with 1 μM of styryl dyes for 0, 1, 3, and 6 h. After incubation, the cells were washed with 0.01 M PBS three times and treated with 0.5 mg mL−1 of Hoechst 33342 containing media. The stained cells were observed under a Nikon A1+ laser scanning confocal microscope (Nikon, A1Rsi Tokyo, Japan) and a 60× oil objective Lens.
Titration and selectivity experiment
For DNA titration, a solution of 10 μM styryl dye, 10 mM NaPi (pH = 7), 250 mM NaCl and 2% ethanol was added to a quartz glass cuvette. Afterwards, dsDNA (final concentration ranging from 0–8 ng μL−1) was added and the absorption and fluorescence spectra (slit = 3 nm) of the mixed sample were measured.12,29,32
For the selectivity test, 1 M stock solutions of various anions or reducing species (Na2SO3 (SO32−); NaHSO3 (HSO3−); Na2S (S2−)), cations (Ni2+; Ba2+; Mg2+; Pb2+), biothiol compounds (cysteine (Cys); glutathione (GSH); dithiothreitol (DTT)), glycine (Gly), and oxidizing agents (hydrogen peroxide (H2O2); hypochlorous acid (HClO)) (1 mM) were prepared in phosphate buffer (10 mM, pH 7.4). Subsequently, solutions of the possible interferents mentioned above were diluted to 1 mM in a quartz glass cuvette, followed by the addition of 10 μM (final concentration) of styryl dye. Finally, the emission spectra were recorded at λex = 488 nm.
Antibacterial activity test
All bacteria strains were obtained from the Thailand Institute of Scientific and Technological Research (TISTR). The antibacterial activities of the styryl dyes were determined from the minimal inhibitory concentration (MIC) and the minimal bactericidal concentration (MBC) against the Gram-positive (S. aureus 1466, TISTR 1466) and Gram-negative (E. coli 780, TISTR 780) bacteria. The stocks of styryl dyes (1 × 10⁻⁴ M) were serially diluted in Muller–Hinton (MH) broth to obtain concentrations in the range of 0–250 μM. Solutions of the styryl dyes (100 μL) with different concentrations were added to the culture of the tested bacteria (100 μL) at a concentration of 1 × 10⁶ colony forming units mL−1 (CFU mL−1) in MH broth at 37 °C with shaking at 80 rpm. The bacterial numbers were determined by measuring the optical density at 600 nm using a UV-vis spectrometer. The MIC values were determined at the minimal concentration of the compounds that completely inhibited bacterial growth. To determine the MBC values, bacterial cultures (10 μL) containing solutions of the styryl dyes at the MIC and three higher concentrations were dropped on MH agar plates. After incubation at 37 °C for 24 h, the MBC values were determined as the minimal concentration of these compounds that killed 100% of the bacterial populations.
Docking DNA binding
Both ligands (Styryl-QL and Styryl-BT) were generated using ChemBioDraw Ultra 14.0, followed by 3D model building and energy minimization using ChemBio3D Ultra 14.0. The DNA structure (PDB ID: 4C64) was downloaded from the PDB database (https://www.rcsb.org/). The ligand and DNA models were prepared using AutoDockTools (Scripps Research Institute, La Jolla, CA) by removing water molecules and adding polar H atoms. Docking simulation of DNA–ligand interactions was performed using AutoDock Vina. PyMOL (http://www.pymol.org/) was used for viewing the best docking structures and processing images.
Author contributions
Conceptualization: A. K. and R.-Y. L.; Data curation: S. W., T. K., U. N., A. K. and R.-Y. L.; funding acquisition: A. K. and R.-Y. L.; investigation: S. W., T. K., U. N., and S. Wo.; methodology: A. K., R.-Y. L., U. N. and T. K.; project administration: A. K. and R.-Y. L.; resources: R.-Y. L. and A. K.; supervision: A. K., and R.-Y. L.; validation: A. K. and R.-Y. L.; visualization: S. W., U. N., T. K., and S. Wo.; writing – original draft: S. W., R.-Y. L. and A. K.; writing – review & editing: all authors.
Conflicts of interest
There are no conflicts to declare.
Acknowledgements
This work was supported by Suranaree University of Technology (SUT) and by Thailand Science Research and Innovation (TSRI); the National Research Council of Thailand (NRCT) and Suranaree University of Technology (N42A650326).
Notes and references
- J. W. Lee, M. Jung, G. R. Rosania and Y.-T. Chang, Chem. Commun., 2003, 1852–1853, 10.1039/B303960A.
- M. A. Ustimova, Y. V. Fedorov, V. B. Tsvetkov, S. D. Tokarev, N. A. Shepel and O. A. Fedorova, J. Photochem. Photobiol., A, 2021, 418, 113378 CrossRef CAS.
- C. Schwechheimer, F. Rönicke, U. Schepers and H.-A. Wagenknecht, Chem. Sci., 2018, 9, 6557–6563 RSC.
- Q. Li, Y. Kim, J. Namm, A. Kulkarni, G. R. Rosania, Y.-H. Ahn and Y.-T. Chang, Chem. Biol., 2006, 13, 615–623 CrossRef CAS PubMed.
- Y. V. Suseela, N. Narayanaswamy, S. Pratihar and T. Govindaraju, Chem. Soc. Rev., 2018, 47, 1098–1131 RSC.
- A. A. Vasilev, M. Miteva, N. Ishkitiev, M. Dragneva, L. Topalova and M. I. Kandinska, Molbank, 2022, 2022, M1392 CrossRef CAS.
- V. Botti, L. Urbanelli, K. Sagini, L. Tarpani, A. Cesaretti, C. G. Fortuna and F. Elisei, Photochem. Photobiol. Sci., 2020, 19, 362–370 CrossRef CAS.
- W. H. Mills, J. Chem. Soc., Trans., 1922, 121, 455–466 RSC.
- D. Bhurta and S. B. Bharate, ChemMedChem, 2022, 17, e202100706 CrossRef CAS.
- T. Deligeorgiev, A. Vasilev, S. Kaloyanova and J. J. Vaquero, Color. Technol., 2010, 126, 55–80 CAS.
- A. Saady, E. Varon, A. Jacob, Y. Shav-Tal and B. Fischer, Dyes Pigm., 2020, 174, 107986 CrossRef CAS.
- P. R. Bohländer and H.-A. Wagenknecht, Org. Biomol. Chem., 2013, 11, 7458–7462 RSC.
- Y. Chen, X.-R. Wei, R. Sun, Y.-J. Xu and J.-F. Ge, Sens. Actuators, B, 2019, 281, 499–506 CrossRef CAS.
- J. Gebhard, L. Hirsch, C. Schwechheimer and H.-A. Wagenknecht, Bioconjugate Chem., 2022, 33, 1634–1642 CrossRef CAS PubMed.
- K. Supabowornsathit, K. Faikhruea, B. Ditmangklo, T. Jaroenchuensiri, S. Wongsuwan, S. Junpra-Ob, I. Choopara, T. Palaga, C. Aonbangkhen and N. Somboonna, Sci. Rep., 2022, 12, 1–17 CrossRef.
- J. Steinmeyer, F. Rönicke, U. Schepers and H. A. Wagenknecht, ChemistryOpen, 2017, 6, 514–518 CrossRef CAS PubMed.
- J. L. Serrano, A. Maia, A. O. Santos, E. Lima, L. V. Reis, M. J. Nunes, R. E. F. Boto, S. Silvestre and P. Almeida, Molecules, 2022, 27, 5779 CrossRef CAS PubMed.
- M. A. Ustimova, Y. V. Fedorov, N. S. Chmelyuk, M. A. Abakumov and O. A. Fedorova, Spectrochim. Acta, Part A, 2022, 121446 CrossRef CAS PubMed.
- T. Ishi-i, K. Ikeda, M. Ogawa and Y. Kusakaki, RSC Adv., 2015, 5, 89171–89187 RSC.
- I. Zonjić, M. R. Stojković, I. Crnolatac, A. T. Paić, S. Pšeničnik, A. Vasilev, M. Kandinska, M. Mondeshki, S. Baluschev and K. Landfester, Bioorg. Chem., 2022, 127, 105999 CrossRef PubMed.
- K. Li, Y.-Y. Zhang, G.-Y. Jiang, Y.-J. Hou, B.-W. Zhang, Q.-X. Zhou and X.-S. Wang, Chem. Commun., 2015, 51, 7923–7926 RSC.
- M. Ma, Y. Sun and G. Sun, Dyes Pigm., 2003, 58, 27–35 CrossRef CAS.
- Y. Huang, W. Chen, J. Chung, J. Yin and J. Yoon, Chem. Soc. Rev., 2021, 50, 7725–7744 RSC.
- S. Tripathy, P. S. Guru and S. Dash, Spectrochim. Acta, Part A, 2014, 125, 422–430 CrossRef CAS PubMed.
- H. Doan, M. Castillo, M. Bejjani, Z. Nurekeyev, S. V. Dzyuba, I. Gryczynski, Z. Gryczynski and S. Raut, Phys. Chem. Chem. Phys., 2017, 19, 29934–29939 RSC.
- L. McDonald, D. Dahal, M. Konopka, Q. Liu and Y. Pang, Bioorg. Chem., 2019, 89, 103040 CrossRef CAS PubMed.
- V. Botti, A. Cesaretti, Ž. Ban, I. Crnolatac, G. Consiglio, F. Elisei and I. Piantanida, Org. Biomol. Chem., 2019, 17, 8243–8258 RSC.
- Y.-J. Lu, Q. Deng, D.-P. Hu, Z.-Y. Wang, B.-H. Huang, Z.-Y. Du, Y.-X. Fang, W.-L. Wong, K. Zhang and C.-F. Chow, Chem. Commun., 2015, 51, 15241–15244 RSC.
- P. R. Bohländer and H.-A. Wagenknecht, Methods Appl. Fluoresc., 2015, 3, 044003 CrossRef PubMed.
- C. Prunkl, M. Pichlmaier, R. Winter, V. Kharlanov, W. Rettig and H. A. Wagenknecht, Chem. – Eur. J., 2010, 16, 3392–3402 CrossRef CAS.
- B. Yang, Z. Lei, Y. Zhao, S. Ahmed, C. Wang, S. Zhang, S. Fu, J. Cao and Y. Qiu, Front. Microbiol., 2017, 8, 2125 CrossRef PubMed.
- L. Chang, C. Liu, S. He, Y. Lu, S. Zhang, L. Zhao and X. Zeng, Sens. Actuators, B, 2014, 202, 483–488 CrossRef CAS.
Footnote |
| † Electronic supplementary information (ESI) available: Synthetic procedures and spectral data for all new compounds, photostability test, and IC50 curves. See DOI: https://doi.org/10.1039/d2ra07601b |
|
| This journal is © The Royal Society of Chemistry 2023 |
Click here to see how this site uses Cookies. View our privacy policy here. 
 Open Access Article
 This Open Access Article is licensed under a Creative Commons Attribution-Non Commercial 3.0 Unported Licence
 *ab and
Anyanee Kamkaew
*ab and
Anyanee Kamkaew