
 Open Access Article
 This Open Access Article is licensed under a Creative Commons Attribution-Non Commercial 3.0 Unported Licence
CeO2@NH2 functionalized electrodes for the rapid detection of SARS-CoV-2 spike receptor binding domain
Ayu Triastutia,
Salma Nur Zakiyyaha,
Shabarni Gaffar ab,
Isa Anshoribc,
Akhmadi Surawijayad,
Darmawan Hidayate,
Hesti Lina Wiraswatif,
Muhammad Yusufab and
Yeni Wahyuni Hartati*ab
ab,
Isa Anshoribc,
Akhmadi Surawijayad,
Darmawan Hidayate,
Hesti Lina Wiraswatif,
Muhammad Yusufab and
Yeni Wahyuni Hartati*ab
aDepartment of Chemistry, Faculty of Mathematics and Natural Sciences, Universitas Padjadjaran, Indonesia. E-mail: yeni.w.hartati@unpad.ac.id
bMoleculer Biotechnology and Bioinformatics Research Center, Universitas Padjadjaran, Indonesia. E-mail: isaa@staff.stei.itb.ac.id; isa_anshori@stei.itb.ac.id
cLab-on-Chip Group, Biomedical Engineering Department, School of Electrical Engineering and Informatics, Bandung Institute of Technology, Indonesia
dCenter of Excellence on Microelectronics, School of Electrical Engineering and Informatics, Bandung Institute of Technology, Bandung, Indonesia
eDepartment of Electrical Engineering, Faculty of Mathematics and Natural Sciences, Universitas Padjadjaran, Indonesia
fDepartment of Parasitology Faculty of Medicine, Universitas Padjadjaran, Indonesia
First published on 16th February 2023
Abstract
A detection method based on an electrochemical aptasensor has been developed as an alternative fast, portable, simple, inexpensive, and high-accuracy detection method for detecting the SARS-CoV-2 Spike Receptor Binding Domain (spike RBD). The CeO2@NH2 functionalized Screen Printed Carbon Electrode (SPCE) was used to immobilize an aminated aptamer of spike RBD protein via glutaraldehyde as a linker. The aptamer's interaction with the SARS-CoV-2 Spike RBD was measured via the [Fe(CN)6]4−/3− redox system signal. Experimental conditions were optimized using a Box–Behnken experimental design and showed that the optimal conditions of the SARS-CoV-2 aptasensor were 1.5 ng mL−1 of aptamer, immobilization of aptamer for 60 minutes, and Spike RBD incubation for 10 minutes. The developed aptasensor was able to detect the standard SARS-CoV-2 Spike RBD with a detection limit of 0.017 ng mL−1 in the range of 0.001–100 ng mL−1. This aptasensor was used to detect salivary and oropharyngeal swab samples of normal individuals with the addition of Spike RBD, and the recoveries were 92.96% and 96.52%, respectively. The testing on nasopharyngeal swab samples of COVID-19 patients showed that the aptasensor results were comparable with the qRT-PCR results. Thus, the developed aptasensor has the potential to be applied as a SARS-CoV-2 rapid test method for clinical samples.
1 Introduction
COVID-19 is typical pneumonia and acute respiratory distress syndrome with a high risk of death caused by Severe Acute Respiratory Syndrome Coronavirus-2 (SARS-CoV-2). The human-to-human transmission of this highly infectious zoonotic virus has grown exponentially with the emergence of millions of cases resulting in a worldwide pandemic. Up to October 2022, there were more than 615 million confirmed cases, with more than 6.5 million deaths.1 Today, although the number of cases has decreased and some countries have declared the pandemic is over, there are still many confirmed COVID-19 patients. Therefore, a rapid method is needed for the detection of SARS-CoV-2.The SARS-CoV-2 genome is a single-strand positive-sense RNA (+ssRNA) that encodes non-structural proteins ORF1 and ORF2 as well as several structural proteins, such as spike (S), membrane protein (M), and envelope protein (E). Spike is a large 180 kDa glycoprotein that consists of two domains, the S1-RBD (Receptor Binding Domain) and the S2 (fusion domain). The Spike RBD plays a role in the internalization of the virus by interaction with the receptor of angiotensin-converting enzyme 2 (ACE-2) on the surface of target cells, primarily the extracellular portion of the epithelial cells of the respiratory tract.2 The Spike RBD plays a role in the formation of an immune response of the host cells, therefore it is widely used as a biomarker for the detection of SARS-CoV-2 in the immunochemistry-based methods.3–5
The gold standard method for SARS-CoV-2 detection is real-time reverse transcriptase PCR (rtRT-PCR/qPCR), using a specific probe to detect several target genes.4,6–8 The main limitations of this method are; time-consuming, requires expensive equipment and reagents, as well as trained laboratory personnel. The second widely utilized technique is an antigen-based diagnostic test employing lateral flow immunoassay (LFIA), which is quicker than qPCR but less sensitive.9,10
Several studies have also reported the use of electrochemical biosensors to detect the SARS-CoV-2 virus. Some of them are: the electrochemical immunosensor by using a working electrode functionalized with graphene-anti-spike for detection of the RBD,11 modification of electrode using cobalt–TiO nanotubes (Co–TNTs) monoclonal antibody as a detection platform for SARS-CoV-2,1 modified carbon black printed electrode with magnetic beads and antibodies,12 PET-gold electrode with monoclonal antibody,13 functionalized gold nanoparticle (AuNP)/nCoV-19Ab),9 e-Covsens based on SPCE-Ab nCovid-19 with fluorine-doped tin oxide electrode (FTO-AuNPs),14 and a ProtA/CuONC nano-bio device-SPCE as a substrate to direct the orientation of IgG antibodies, as a specific receptor for the detection of spike glycoproteins.15 The electrochemical biosensor detection method is rapid, low cost, easy operation, small sample size, and portable, allowing on-the-spot testing, as well as high sensitivity and selectivity for medical sample analysis.13,15–20
The use of antibodies as a bioreceptor molecules has several disadvantages because they are large molecules susceptible to high temperatures and changes in pH so they can be easily denatured.21 The aptamer is a single-strand DNA or RNA oligonucleotide that has a secondary structure that can interact with antigens. It has several advantages that highlight its use as a bioreceptor, such as specific with high affinity, small size (BM 20 kDa), a specific three-dimensional structure that complements the target, stability to extreme temperature and pH changes, and can return to its initial conformation when denatured.21–23
An aptasensor is a biosensor that uses an aptamer as a bioreceptor.24–26 The size of an aptamer is smaller (2–3 nm) than an antibody (12–15 nm), thereby reducing the steric barrier to the surface of the coronavirus, which is about 100 nm. A smaller bioreceptor will enable more molecules to bind to the same surface area. Song et al. have reported two aptamers that target SARS-CoV-2 Spike RBD using the ACE2 receptor competition-based selection strategy (SELEX). The published aptamers by Song et al. have drawn the interest of researchers working on constructing electrochemical aptasensor.27–31 An electrochemical aptamer-based sensor created by Idili et al. was tested directly on saliva samples. Additionally, Zakashansky et al. developed an aptasensor for saliva samples with a detection limit of 1 ng mL−1. In this work, a hairpin-structure of 51-base aptamer with a dissociation constant of 5.8 nM was studied. The aptamer binds to several amino acids of RBD, which is important for highly specific detection.2
On the other hand, modification of the working electrode surface is important to increase the selectivity and sensitivity of the sensor, as well as the efficient immobilization of biomolecules on the electrode surface.15,32–34 Cerium oxide has been reported to have beneficial properties, such as being non-toxic, having good electrical conductivity, being inert, large surface area, and being biocompatible.35–37 In addition, the excellent conductance properties of cerium play an important role in the electron transfer process.38 Various studies related to electrode modification with cerium oxide have been reported. Cerium oxide can be directly conjugated to the electrode surface or functionalized with other materials.39 The use of amino silane groups as a coupling agent can activate cerium oxide for functionalization with amine groups.36,40–43
Immobilization is a key step in the aptasensor fabrication process because it will affect the overall performance of the electrochemical sensor. An immobilized bioreceptor with good orientation and the stability of the bioreceptor on the electrode surface allows an increase in the binding capacity of the target.15,44 Glutaraldehyde is a highly reactive dialdehyde compound that functions as a crosslinker in biological tests and coupling aldehyde (–COH) groups at both glutaraldehyde terminals will spontaneously crosslink with the amine (NH) group from the surface of the electrode and the aptamer through a condensation reaction to form an amide bond.45,46
In addition, another thing related to testing is the type of sample. Generally, the specimens used for testing for COVID-19 are nasopharyngeal specimens, which are considered uncomfortable to cause bleeding for some patients. Alternative saliva is available as a non-invasive diagnostic fluid. The copy of viral particles in the saliva sample is about 102–1011 copies per ml during the infection period.28 The oral cavity communicates with the nasopharynx by continuously mixing nasopharyngeal secretions with saliva, leading to a mixed salivary nasopharyngeal environment. In particular, saliva has been used for the detection of the coronaviruses responsible for Severe Acute Respiratory Syndrome (SARS-CoV) and Middle East respiratory syndrome (MERS). Saliva contains a collection of viruses donated from the oral nasopharynx and lower respiratory tract secretions. Also, oral epithelial cells and salivary glands have increased expression of ACE-2 receptors for viruses. The salivary viral load is highest in the first week after clinical manifestations of the disease and can last for more than 3 weeks.47,48 Interestingly, the sensitivity of salivary tests in the diagnosis of COVID-19 is about 91% (95% CI; 80% to 99%) compared to the nasopharyngeal swab (NPS), which is about 98% (95% CI; 89% to 100%), which is quite good; similar due to the considerable overlap of confidence intervals.48
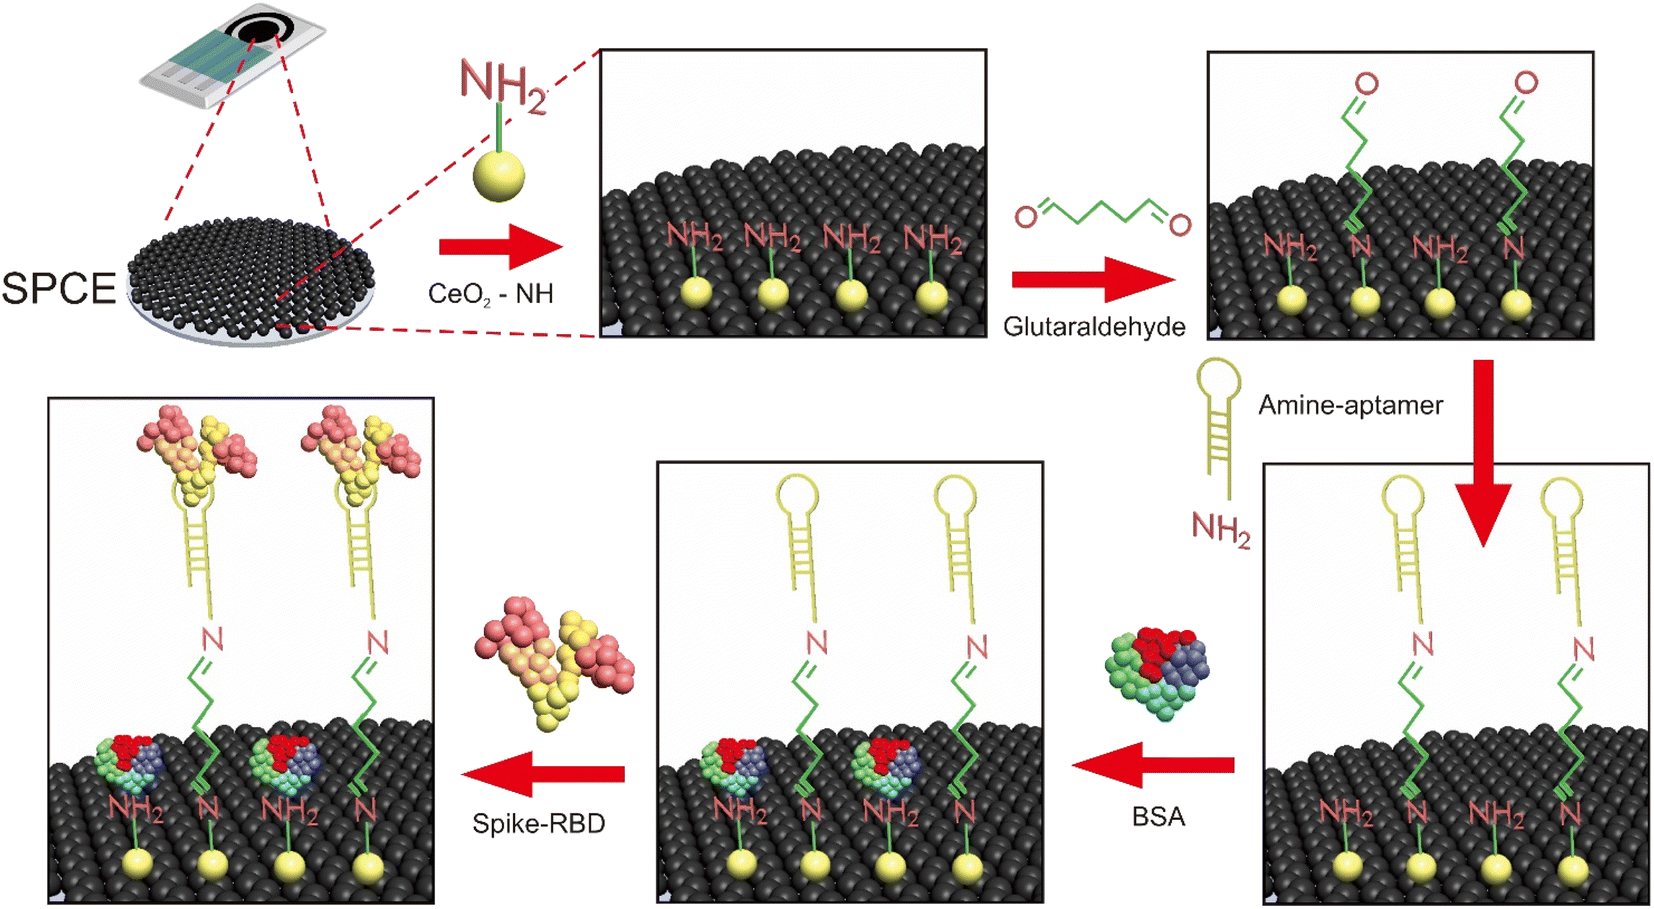
This study is involved in the development of an electrochemical aptasensor for rapid test detection of SARS-CoV-2 Spike RBD in Indonesia. The sensor device consists of the CeO2-modified SPCE using 3-aminopropyl-triethoxysilane and glutaraldehyde as linkers and aptamer as a bioreceptor. The electrode is connected to differential pulse voltammetry (DPV) measurements via the [Fe(CN)6]4−/3− redox system responses. The aptasensor performance was assessed using saliva and oropharyngeal swab samples.
2 Experimental
2.1 Materials
The materials used in this study were 3-aminopropyl triethoxysilane (APTES) (Sigma Aldrich); aptamer DNA sequence was based on Song et al. (2020) – [C6–NH2]–CAG CAC CGA CCT TGT GCT TTG GGA GTG CTG GTC CAA GGG CGT TAA TGG ACA that was synthesized by Bioneer Corporation. Bovine serum albumin (BSA), cerium nitrate hydrate (Ce[NO3])3·6H2O), glutaraldehyde 50%, phosphate buffer saline (PBS) pH 7.4, and solid potassium ferricyanide K3[Fe(CN)6] (Sigma Aldrich); potassium chloride (KCl) (Merck), sodium hydroxide (NaOH) (Merck, pa); SARS-CoV-2 Spike RBD (GenScript, USA), double distilled water (PT. Ikapharmindo Putramas Indonesia), and inactivated avian virus (H5N1) was a gift from PT. Tekad Mandiri Citra, Bandung, Indonesia. Clinical samples of COVID-19 patients used in this study were obtained from the Covid-19 test laboratory (C-29 Lab.) at Padjadjaran University.2.2 Electrochemical measurements
All electrochemical measurements were conducted using a Zimmer & Peacock potentiostat connected to a computer using the PS Trace 5.4 software (Zeamer & Peacock, UK), The three-electrode system (GSI Technologies, LLC, USA) consists of an SPCE as a working electrode, an Ag/AgCl pseudo reference electrode, and a carbon auxiliary electrode. The working, reference, and counter electrodes are integrated into the screen-printed carbon electrode. The diameter of the working electrode is 5 mm and its working area is 0.019 cm2. The modified electrode was characterized using a scanning electron microscope JSM-7500F (Jeol, US), FTIR spectrophotometer (Spectrum Pekin Elmer 100), and UV-Vis spectrophotometer (Thermo Scientific, USA). The clinical samples study was conducted within the Biological Safety Cabinet Class II in the C-29 Laboratory.2.3 Preparation of cerium oxide (CeO2)
CeO2 was synthesized by the precipitation method. First, 2.0 g of solid Ce(NO3)3 were dissolved in 25 mL double distilled water, then 25 mL of 0.3 M NaOH was added dropwise. The mixture was stirred continuously for 2–3 hours at room temperature until a pale yellowish precipitate formed. The precipitate was separated and washed several times with double distilled water and alcohol, then dried at 70 °C for 2 hours. The yellowish particles obtained were then calcined at 240 °C for 10 hours to form cubic structures of nano ceria.41,492.4 Preparation of cerium oxide functionalized amine (CeO2@NH2)
Fifty-one microliters of APTES were dissolved in 20 mL ethanol![[thin space (1/6-em)]](https://www.rsc.org/images/entities/char_2009.gif) :aqua dm = 1:3 and stirred for 30 minutes, then 68 mg of solid CeO2 was added and stirred for 2 hours at 69.85 °C. The resulting pale-yellow precipitate of CeO2@NH2 was filtered and dried at 109 °C overnight, then weighed and stored at room temperature before use.40
:aqua dm = 1:3 and stirred for 30 minutes, then 68 mg of solid CeO2 was added and stirred for 2 hours at 69.85 °C. The resulting pale-yellow precipitate of CeO2@NH2 was filtered and dried at 109 °C overnight, then weighed and stored at room temperature before use.40
2.5 Modification of SPCE by (CeO2@NH2)
The SPCE was rinsed several times using double distilled water, then dropped with 40 μL of CeO2@NH2 and incubated for 24 hours. Then, the electrodes were carefully washed with aqua pro injection and dried at room temperature. The CeO2@NH2 modified SPCE was characterized by scanning electron microscopy (SEM-EDS), DPV, and electrochemical impedance spectroscopy (EIS) using a [Fe(CN)6]4−/3− redox system.2.6 Fabrication of the aptasensor
SPCE-CeO2@NH2 was dropped with 20 μL of 2.5% glutaraldehyde (GA) and incubated for 1 hour at room temperature, GA will form a covalent bond with CeO2@NH2. The electrodes were rinsed with double distilled water to remove non-specific species that do not stick to the electrode surface. Then, 20 μL of aptamer was dropped/immobilized on the surface of the electrode and incubated for 60 minutes at room temperature. The electrodes were rinsed with 0.01 M PBS pH 7.4 to remove the unbound aptamer species. The empty surface of the electrodes was blocked using 1% BSA and incubated for 20 minutes at room temperature, and then the electrodes were rinsed with 0.01 M PBS pH 7.4. Finally, the standard Spike RBD was dropped on the electrode surface and incubated for 15 minutes at room temperature. The aptasensor response was measured electrochemically by EIS with the frequency 0.1–1000000 Hz and DPV with the potential range −1.0 V to +1 V scanning rate of 0.008 V s−1 using the [Fe(CN)6]4−/3− 10 mM redox system in 0.1 M KCl. The schematic of aptasensor is shown in Fig. 1.
 | ||
| Fig. 1 Schematic of aptasensor platform for detection of Spike RBD SARS-CoV-2. | ||
2.7 Optimization of the experimental conditions using a Box–Behnken experimental design
Three factors were optimized by the Box–Behnken experimental design using the Minitab 18, that were: aptamer concentration (X1), aptamer immobilization time (X2), and Spike RBD incubation time (X3) via three different levels, the lowest level (−1), medium (0), and highest (+1) as shown in Table 1.| Factor | Unit | Level | ||
|---|---|---|---|---|
| −1 | 0 | +1 | ||
| Aptamer concentration (X1) | μg mL−1 | 0.5 | 1.0 | 1.5 |
| Immobilization time (X2) | min | 30 | 60 | 90 |
| Incubation time of target (X3) | min | 5 | 10 | 15 |
2.8 Calibration curve, the limit of detection and limit of quantification
The standard Spike RBD (0.001, 0.01, 0.05, 0.1, 1.0, 10, and 100 ng mL−1) was tested on the aptasensor using the optimal experimental conditions and the resulting electrochemical response was measured by DPV using a redox system of 10 mM [Fe(CN)6]4−/3− in 0.1 M KCl with a scanning rate of 0.008 V s−1 and a range of −1.0 V to +1.0 V.A calibration curve of the concentration versus the mean peak current difference (ΔI) for each measurement was plotted to determine the detection limit (LOD), the quantification limit (LOQ), precision, and accuracy. The selectivity of the aptasensor was then evaluated using a negative control, Spike RBD, and inactivated influenza virus (H5N1).
2.9 Aptasensor response for salivary and oropharyngeal swab samples
Salivary and oropharyngeal swabs from normal individual were diluted to 5 mL of 0.01 M PBS 7.4. The % recovery was determined by addion of a specific concentration of the standard Spike RBD to the sample. The resulting electrochemical response was measured by DPV.3 Results and discussion
3.1 Characterization of CeO2@NH2 and SPCE-CeO2@NH2
Fig. 2A shows the absorption of CeO2 that synthesized by alkaline precipitation method from the precursor Ce(NO3)3. The maximum absorbtion wavelength of nanoceria is generally at 250–400 nm related to the band gap energy and the charge transition between O (2p) and Ce (4f) expressed in O2 and Ce4+. Moreover, the maximum absorption peak of nanoceria shifted toward lower wavelengths, which is associated with the quantum confinement effect due to the decrease in particle size. The band gap energy is incorporated with the transition between valence and conduction band in ceria.41,49,50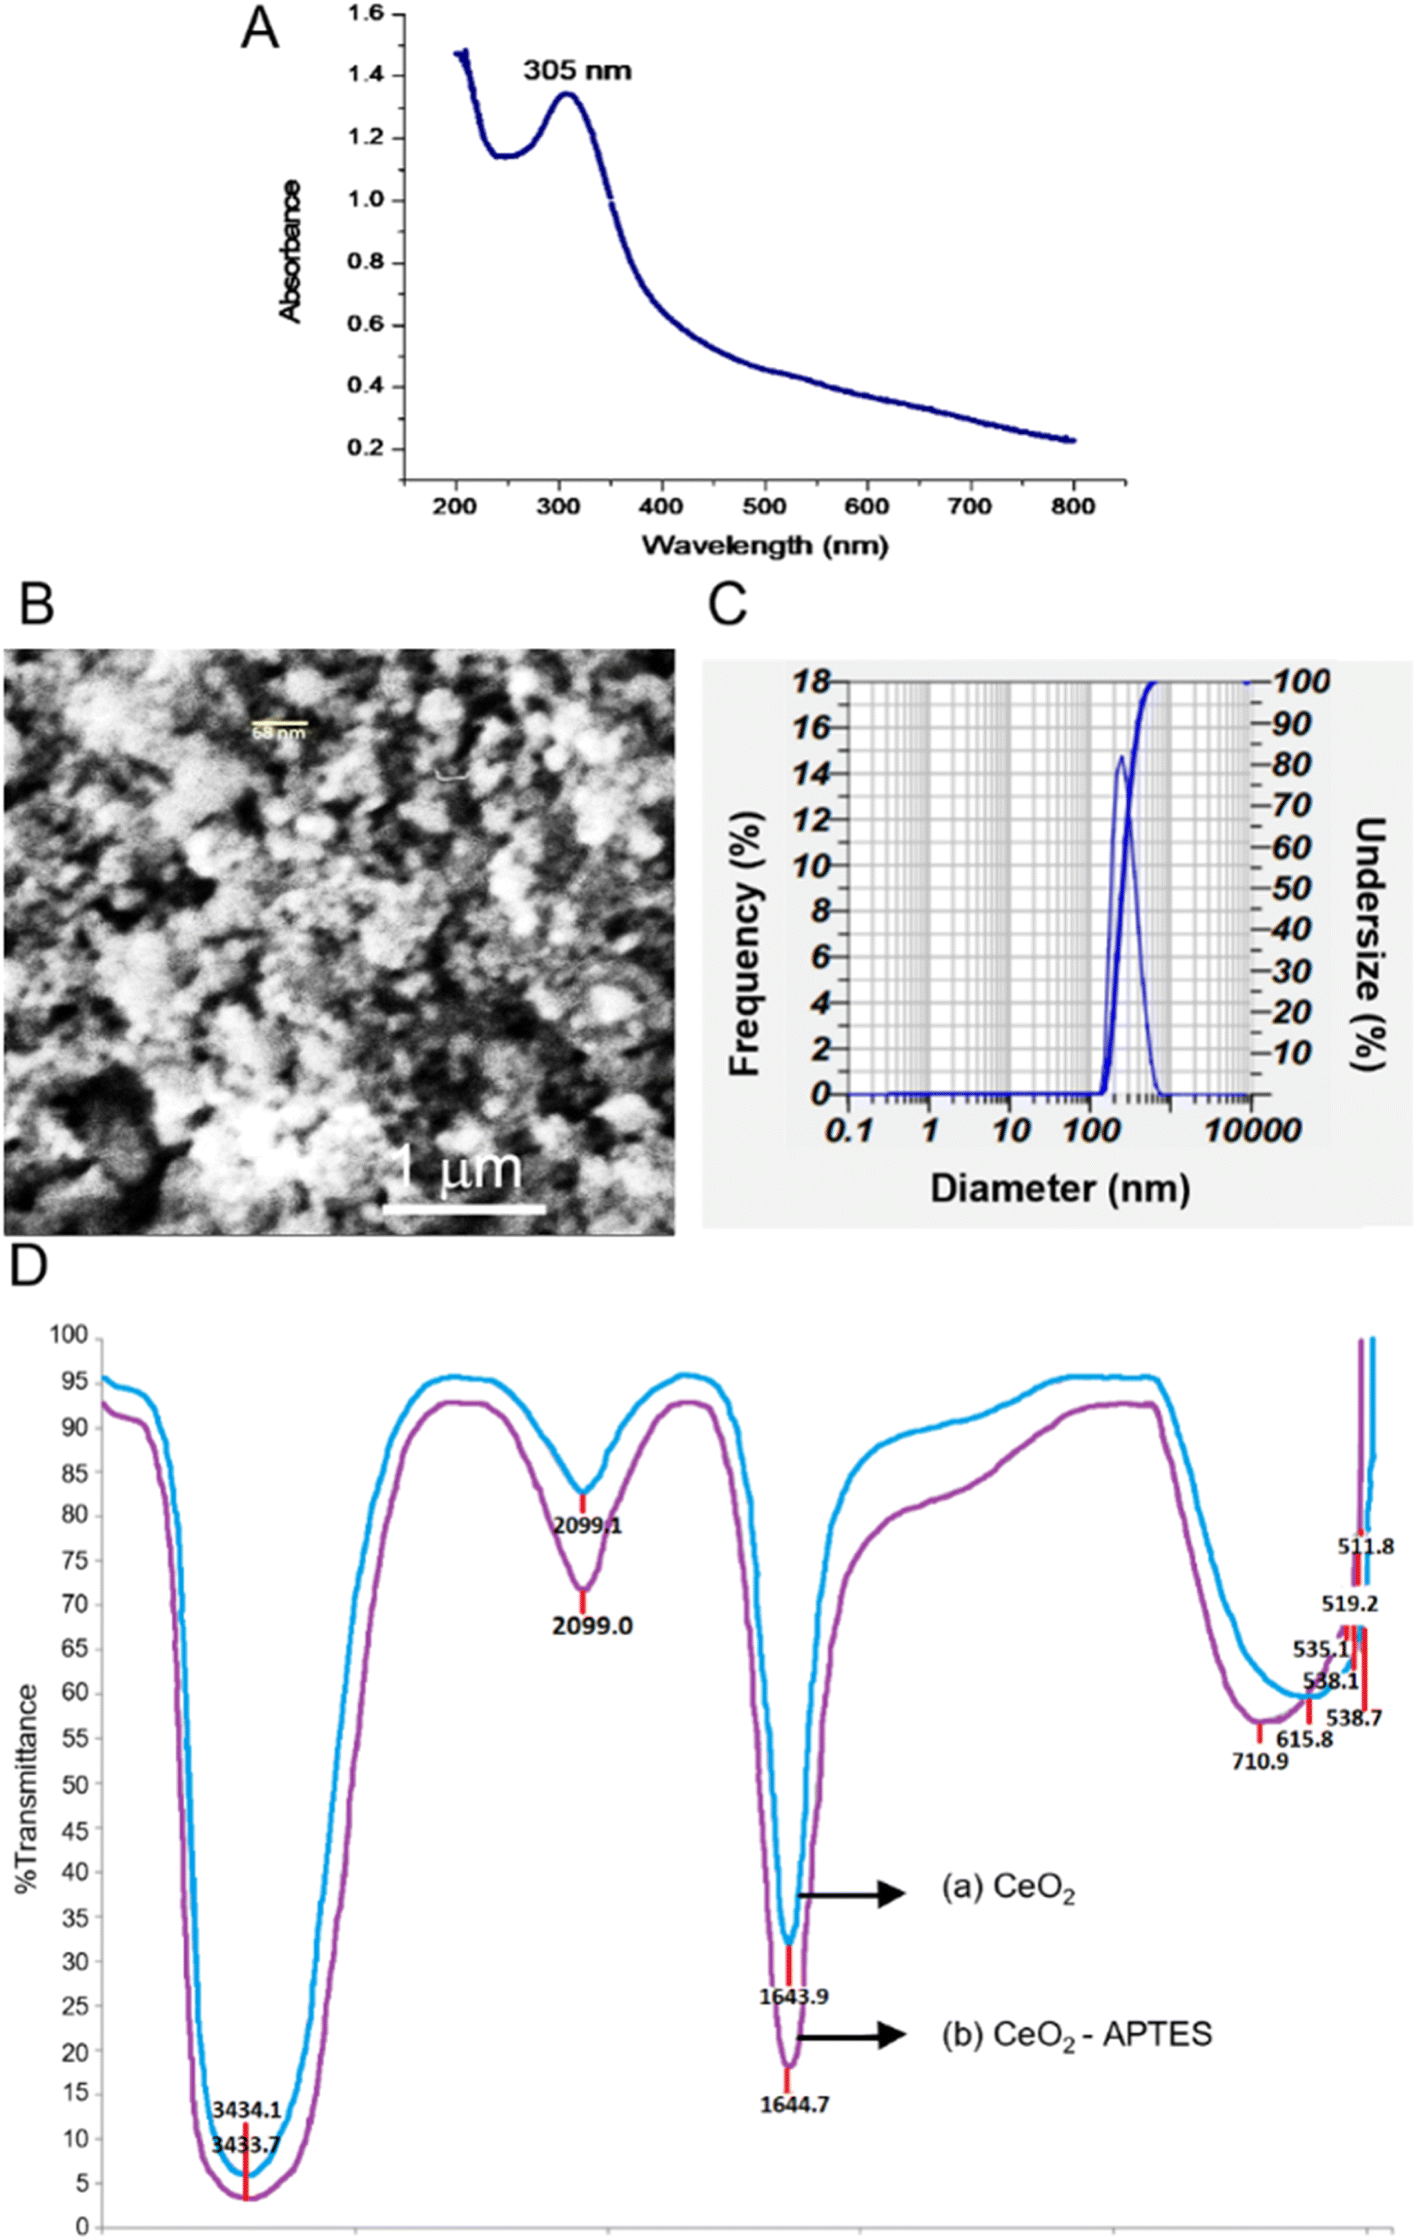 | ||
| Fig. 2 (A) UV-Vis spectrum of CeO2; (B) SEM images of CeO2 powder; (C) PSA spectrum of CeO2; (D) FT-IR Spectra of CeO2 only (a), and those of APTMS-CeO2 (b). | ||
Fig. 2B shows the SEM images of CeO2 powder. The cerium oxide nanoparticles was found to form aggregates, which may have been caused by an inadequately high synthesis temperature that prevented the particles from being evenly dispersed and supported by dynamic light scattering. The particle analyzer's findings showed that the average size distribution was 288.9 nm (Fig. 2C). However, the particle size analyzer data is usually far from the nanomaterial size calculated by the Scherer equation using the X-ray diffraction method.51
Fig. 2D shows the FTIR spectra of synthesized CeO2 and CeO2 functionalized APTES. The wavelength range of 3434.7 cm−1 and 3433.1 cm−1 correlates to O–H groups derived from the solvent and the C–H groups of the organic solvent at 2099 cm−1 and 2099.1 cm−1. The stretching vibration at 1643.9 cm−1 and 1644.7 cm−1 confirm H–OH and the wavelength of 615.8 cm−1 correlates to the binding of Ce–O.50 The peak of Ce–O bond occurs at 500–700 cm−1, presumed to be the binding of silane with cerium, Si–O–Ce. The peaks at 535.1 cm−1, which then shift to 710.9 cm−1, 519.2 cm−1, and 511.8 cm−1, 528.0 cm−1, are suspected to be Ce–O–Si. The weak transmittance of about 59% at 1459 cm−1 indicates the NH2 group.
Bare SPCE and SPCE-CeO2@NH2 were characterized by SEM-EDS to determine the morphology and verify the presence of CeO2@NH2 on the electrode surface. Fig. 3A shows the SPCE component which consists of reference, working, and counter electrodes. The working electrode is the location for depositing CeO2@NH2. Fig. 3B shows the elements C, O, N, Ce, Si, and N derived from the modification of CeO2@NH2 to the surface of the carbon electrode. Fig. 3C shows the homogeneous smooth surface of bare SPCE, while the white spots distributed on the surface are CeO2@NH2 coated carbon working electrode of SPCE (Fig. 3D).
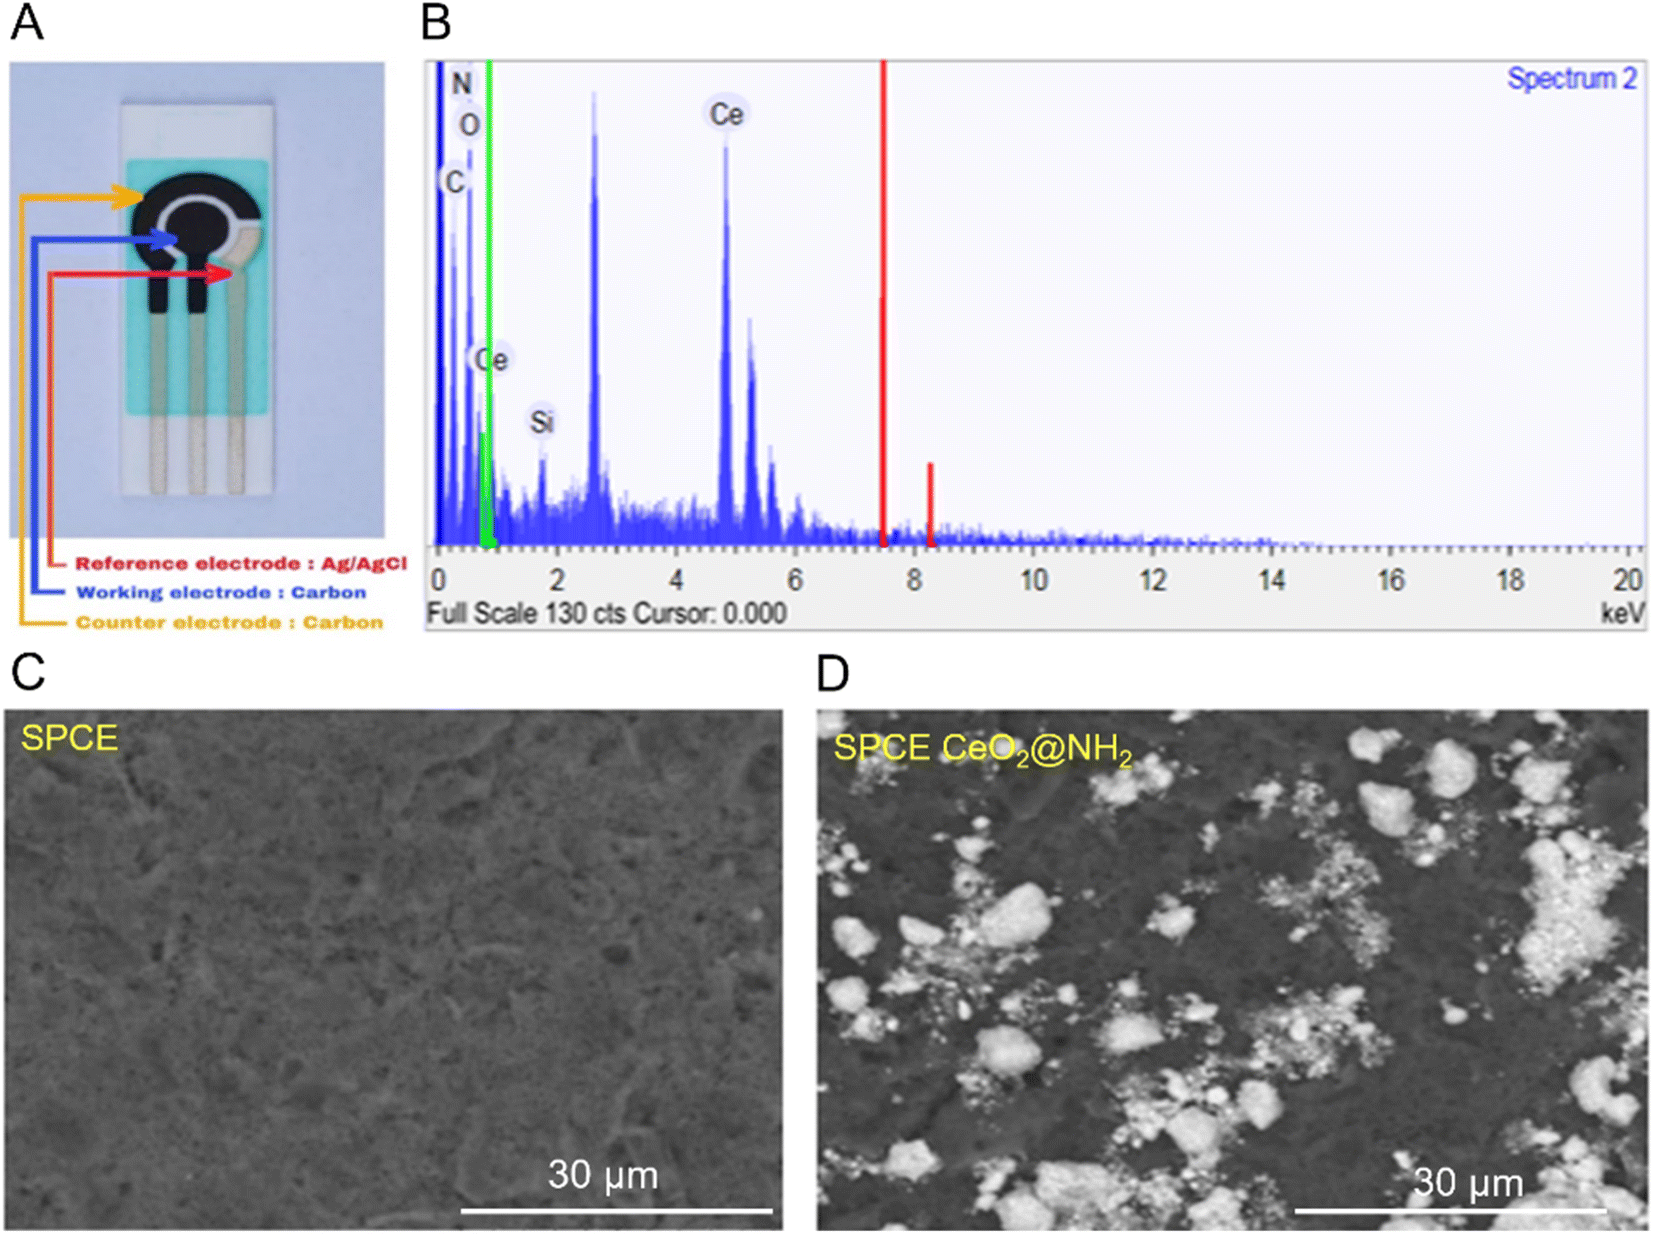 | ||
| Fig. 3 (A) Screen-printed carbon electrode (SPCE); (B) EDS spectra of SPCE-CeO2@NH2; (C) SEM images SPCE bare; (D) SEM images SPCE-CeO2@NH2. | ||
3.2 Evaluation of the aptasensor through electrochemical analyses
In order to study the effect of the CeO2@NH2 on the sensitivity, SPCE working electrodes modified with CeO2@NH2 were tested electrochemically. Fig. 4 shows the current response of [Fe(CN)6]4−/3− electrodes without and with CeO2@NH2 modification. This result indicates that the current response of the electrode containing CeO2@NH2 increases dramatically.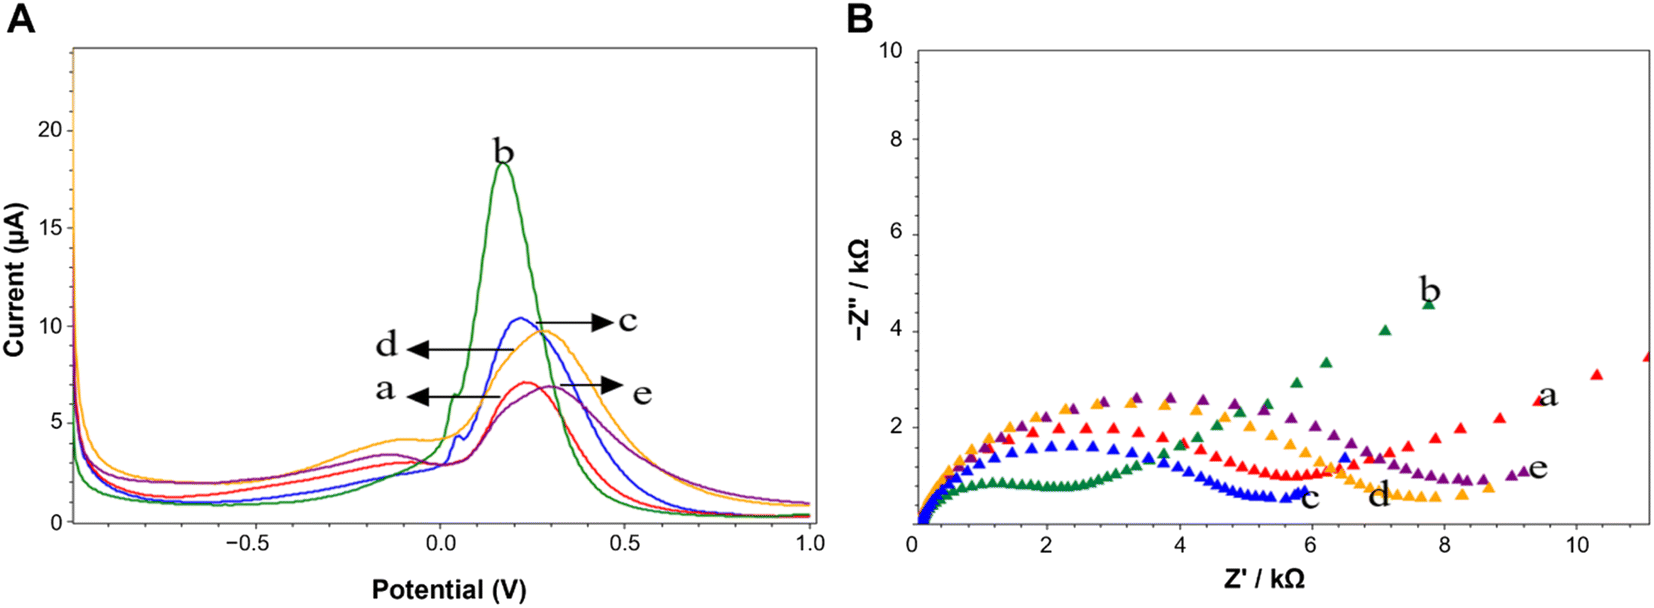 | ||
| Fig. 4 (A) Differential Pulse Voltammogram (scan rate 0.008 V s−1, at potential range −0.1 V to +0.1 V) of (a) SPCE bare (b) SPCE-CeO2@NH2 (c) SPCE-CeO2@NH2-GA (d) SPCE-CeO2@NH2-Aptamer (e) SPCE-CeO2@NH2-Aptamer-Spike RBD; (B) Nyquist plot (were recoded from 0.1 Hz to 100 kHz). Both using a redox system a redox of 10 mM K3[Fe(CN)6] with 0.1 M KCl in 0.05 PBS pH 7.4 on different. | ||
Each process in the modification of SPCE by CeO2@NH2 was characterized by Differential Pulse Voltammetry (DPV). Fig. 4A shows the DPV response of [Fe(CN)6]4−/3− on the SPCE-CeO2@NH2-GA, SPCE-CeO2@NH2-Aptamer, and SPCE-CeO2@NH2-Aptamer-Spike RBD. Peak current measurements showed that CeO2@NH2 had been conjugated to the electrode surface, measuring 5.072 μA at the SPCE's bare (curve a) and 17.877 μA at SPCE-CeO2@NH2 (curve b). These results confirm that CeO2@NH2 is already conjugated to the electrode surface, and SPCE-CeO2@NH2 is more conductive than bare SPCE. The increase in current at low potential can be attributed to the presence of CeO2 on the surface of the SPCE which facilitates the charge transfer mechanism at the modified electrode interface. The decrease in current, 9.843 μA to 44.940%, was recorded on SPCE-CeO2@NH2 after adding 2.5% GA (Fig. 4A(c)). The response decreases further 6.993 μA to 28.95% for SPCE-CeO2@NH2-GA-Aptamer (Fig. 4A(d)). The addition of GA and aptamer to the electrode surface decreased the transferability of redox [Fe(CN)6]4−/3− electrons to the electrode, indicating that the aptamer had immobilized the electrodes. The SPCE-CeO2@NH2-Aptamer was treated with BSA, which acts as a blocking agent to cover non-specific species that can interfere with the analysis. In Fig. 4A(e), the addition of the Spike RBD results in a decrease in the current of 32.29% because the Spike RBD is a non-electroactive molecule obstructing the electron transfer process at the electrode. The increasing concentration of the Spike RBD is trapped on the electrode surface, decreasing the reduction current peak of [Fe(CN)6]4−/3−.
Additionally, Electrochemical Impedance Spectroscopy (EIS) is an important tool to study different aspects of interfacial behavior in surface-modified electrodes. EIS was performed to clarify the electrochemical response, as shown in Fig. 4B. The Nyquist plot of each functionalization step affects the change in the size of the Rct. GA incubation and immobilization of the aptamer at the electrodes increased the density of the coating on the electrodes, hindering the ability to transfer electrons (Fig. 4B(c) and B(d)). The increase in the diameter of the Nyquist plot occurs due to the aptamer-Spike RBD interaction. The spontaneous adsorption of the Spike RBD on the surface of the electrode hinders the ability of [Fe(CN)6]4−/3− electron transfer, thereby increasing the impedance and resistance, which are inversely proportional to the measured height. Fig. 4B(a) and B(b) showed the EIS response for bare SPCE, and SPCE-CeO2@NH2 respectively in the frequency of 1 mHz–100 kHz using 5 mM of [Fe(CN)6]4−/3− redox couple as the electrochemical probe. The Nyquist plot of EIS spectra consists of a semi-circular part in the high-frequency domain representing the charge transfer at a limited region and a linear part in the low-frequency domain representing the diffusion-controlled region. At high frequencies, the diameter of the semicircle gives the electron transfer resistance (Rct). The Rct value of SPCE-CeO2@NH2 was less than that of bare SPCE, thus revealing enhanced electron transfer kinetics between bare and CeO2@NH2 modified SPCE, thus suggesting a very less resistance on the conduction pathway of the electron at the modified electrode and electrolyte solution interface. Furthermore, being rich in oxygen vacancies and hence ease of change of oxidation state of Ce in CeO2, could result in a better charge transfer mechanism52 providing good electrochemical activity of the material.
3.3 Optimization of experimental conditions
The aptamer concentration (X1), immobilization time (X2), and Spike RBD incubation time (X3) were optimized using a Box–Behnken experimental design with the Minitab 18 program (Table 1). Each factor was designed with three different levels, namely the lowest level (−1), medium (0), and highest (+1), to obtain the following equation:| Y = 6.209 − 2.746X1 − 0.947X2 + 0.134X3 − 0.039X12 − 0.039X22 + 2.175X32 + 0.714X1 × X2 − 0.249X1 × X3 − 0.581X2 × X3 | (1) |
The value of the correlation coefficient (R2) of eqn (1) was 0.933, indicating a good fit.53 From the regression equation above, a one-point increase in the aptamer concentration (X1) will decrease the current by 2.746%. The P-value and lack of fit (LOF) were 0.057 and 0.027, respectively. The LOF will be meaningless if the P-value in the variation model is smaller than a = 0.05. Therefore, the resulting linear equation is acceptable. The optimal conditions from the Box–Behnken experimental design data were an aptamer concentration of 1.5 μg mL−1, aptamer immobilization time of 60 minutes, and incubation of target Spike RBD for 10 minutes. The aptamer's optimal immobilization will affect the aptamer's stability on the electrode surface, thus allowing the formation of imide bonds between the aptamer and the maximum GA. Too high a concentration of aptamer allows steric hindrance at the electrodes, thereby interfering with the activity of the aptamer in recognizing the target. The mean probe-to-probe separation obtained at the highest density approximates the expected radius of this aptamer, which is believed to be partially folded in the absence of a target due to allowing it to pack less closely.54 Also, the target incubation time is related to the duration of the test time; the longer the target incubation time, the more targets are tied to the aptamer.
3.4 Calibration curve
The calibration curve and LOD were calculated in the optimal experimental conditions. Spike RBDs with various concentrations of 0.001–100 ng mL−1 were tested on the aptasensor and electrochemical response was measured using DPV in the [Fe(CN)6]4−/3− redox system containing 0.1 M KCl in PBS (0.1 M, pH 7.4). The detection principle is based on the change in peak oxidation current response (ΔI) before and after the aptamer target interaction. This peak current was evaluated using the following equation: ΔIpa = I0 − In, where I0 is the current response before interaction, while In is the response after the aptasensor interacts with the target.Fig. 5A shows the DPV current of various Spike RBD concentrations. The greater the Spike RDB concentration, the more Spike RBD species bound to the aptamer, hence the lower the measured peak current. The calibration curve consists of two linear curve segments in Fig. 5B with different slopes (two segments of the calibration curve are drawn separately). The calibration curve is linear over two concentration ranges from 0.001 to 1 ng mL−1 and 0.1 to 100 ng mL−1 (Fig. 5B). The corresponding calibration curve regression equations for lower and higher concentration ranges are ΔIpa = 9.6118 [Spike RBD] (ng mL−1) + 1.554 with R2 = 0.9828 and ΔIpa = 0.0179 [RBDspike] (ng mL−1) + 2.5883 with R2 = 0.9914, respectively (Fig. 5). The LOD was 0.017 ng mL−1 and the LOQ was 0.052 ng mL−1, with an accuracy of 90.50% and a precision of 97.38% (Table 2).
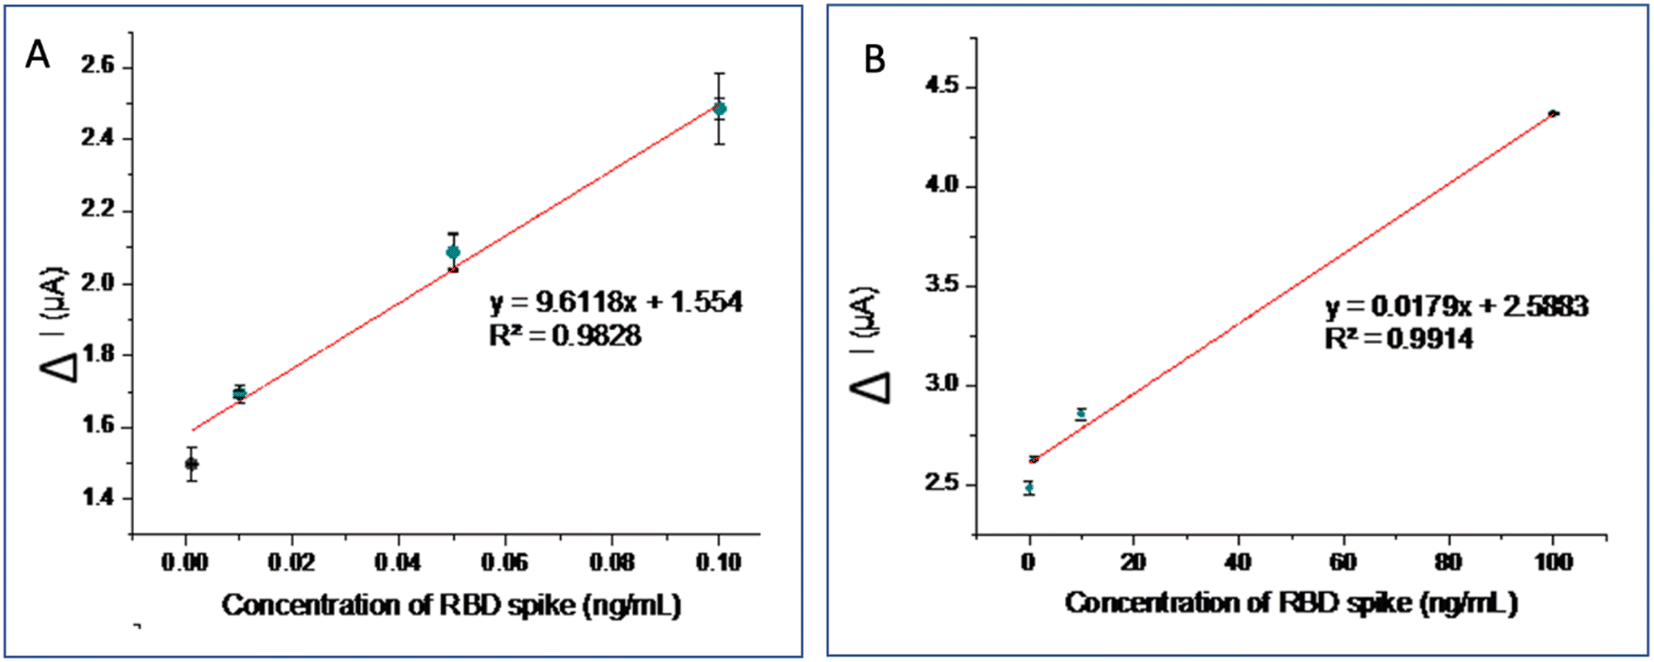 | ||
| Fig. 5 (A) Curve calibration of RBD spike for concentration (0.001–1 ng mL−1); and (B) those for concentration range (0.1–100 ng mL−1) using redoks system of 10 mM K3[Fe(CN)6] with 0.1 M KCl in 0.05 PBS pH 7.4. | ||
| Sample | ΔI (μA) | Average ΔI (μA) | SD | RSD (%) | Precision (%) | Accuracy (%) |
|---|---|---|---|---|---|---|
| Saliva | 2.623 | 2.604 | 0.062 | 2.38 | 90.50 | 97.39 |
| 2.688 | ||||||
| 2.639 | ||||||
| 2.517 | ||||||
| 2.549 | ||||||
| 2.610 |
3.5 Selectivity of the aptasensor
The selectivity of a method is its ability to specifically measure certain analytes in the presence of other components that may be present in the sample matrix. The selectivity was determined for an inactive avian influenza virus (H5N1) which may present in the sample matrix and the measured current peak response was compared with the Spike RBD peak response. Fig. 6A shows the measured response of the H5N1 virus, which is 4.281 μA, similar to the negative control (solvent without containing sample analyte) as PBS of 4.269 μA, indicating that there is no binding between the aptamer and the H5N1 virus. Other treatments were studied to see the effect of interference in determining the percentage selectivity. Fig. 6B shows the measured peak response of 2.444 μA, similar to the peak of the Spike RBD current response, namely 2.312 μA, confirming that the aptamer is very good at recognizing the Spike RBD as a target. The existence of interference or interference does not affect the activity of the aptamer. The presence of H5N1 virus in the sample matrix showed a relative response of 94.29% aptamer. This shows the high selectivity of the Spike RBD aptamer to the target.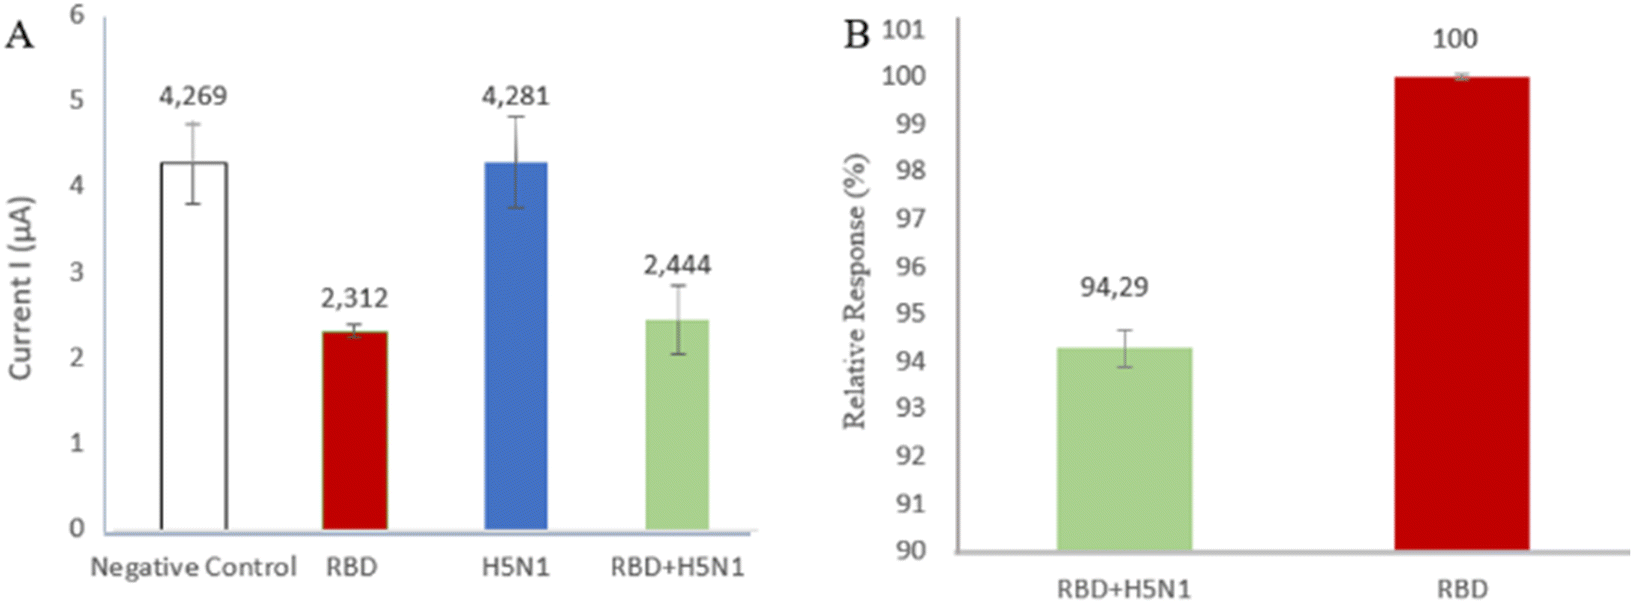 | ||
| Fig. 6 (A) The comparison of current response H5N1 toward Spike RBD; (B) selectivity of aptamer toward Spike RBD. | ||
3.6 Evaluation of aptasensor performance using clinical samples
The performance of the electrochemical aptasensor was then evaluated using saliva samples and oropharyngeal swabs using a standard addition method. The salivary samples and oropharyngeal swabs from normal individu were spiked with a 50 ng mL−1 Spike RBD. The percentage recovery were 92.96%, and 96.52% for the saliva samples oropharyngeal swabs respectively. This parameter is a measure of reproducibility of the sensor and it is seen that the RSD lies at 4.05% and 1.11%, respectively (Table 3), indicating that the developed aptasensor can be applied as a COVID-19 rapid test method for clinical samples.| Sample | ΔI (μA) | ΔI (μA) | SD | RSD (%) |
|---|---|---|---|---|
| Saliva | 3.486 | 3.420 | 0.138 | 4.05 |
| 3.514 | ||||
| 3.261 | ||||
| Oropharyngeal | 3.414 | 3.451 | 0.038 | 1.11 |
| 3.449 | ||||
| 3.492 |
The developed aptasensor was also has been tested on 10 samples from COVID-19 patients stored in PBS buffer. All samples were tested by the qRT-PCR method and showed a Ct value < 25 and the results were shown in Table 4. However, based on the peak current obtained in clinical sample testing, which is between 0.195–4496 μA, we suspect that samples with a Ct value > 25 can still be detected.
| Sample of patient | RT-PCR | Aptasensor |
|---|---|---|
| 1 | (+) | (+) |
| 2 | (−) | (−) |
| 3 | (+) | (+) |
| 4 | (+) | (+) |
| 5 | (−) | (−) |
| 6 | (+) | (+) |
| 7 | (+) | (+) |
| 8 | (+) | (+) |
| 9 | (+) | (+) |
| 10 | (−) | (−) |
Table 5 compares the performance characteristics of electrochemical aptamer-based biosensors as a method of SARS-CoV-2 detection. Judging from the comparison of LOD data, the results of this work are greater than the results of other studies. However, the simpler work steps are the advantages of this method, and it can still be used for detection in clinical samples.
| Method | Limit of detection | Linear range | Sample | Ref. |
|---|---|---|---|---|
| Electrochemical immunosensor based on graphene working a functionalized anti-spike | 20 × 103 ng mL−1 | — | — | 11 |
| Electrochemical biosensor functionalized TiO2 nanotube | 0.7 nM | 14–1400 nM | Nasal secretions, salivary | 55 |
| Electrochemical immunosensor based on magnetic beads modified carbon black printed electrode | 19 ng mL−1 | — | Salivary | 12 |
| Electrochemical sensor PET-gold electrode monoclonal antibody | — | — | Serum | 13 |
| Biosensor AuNP functionalized/nCoV-19Ab | — | — | — | 9 |
| Electrochemical aptamer based sensor using gold electrode | — | — | Salivary | 27 |
| Electrochemical aptamer based sensor using shrinky-dink electrode | 1 ng mL−1 | — | Salivary | 28 |
| Electrochemical aptasensor using SPCE-Cu2O for the spike RBD detection spike glycoprotein | 0.03 ± 0.01 (×10−6) ng mL−1 | 1 × 10⁻⁵ to 1.2 × 10³ ng mL−1 | Salivary | 56 |
| Electrochemical impedance spectroscopy-based aptasensor using a carbon nanofiber–gold for the spike RBD detection | 7.0 × 10⁻³ nM | 1 × 10⁻² to 64 nM | Salivary | 57 |
| Electrochemical aptasensor for SARS-CoV-2 antigen detection based on aptamer-binding induced multiple hairpin assembly signal amplification | 9.79 × 10⁻⁶ ng mL−1 | 50 × 10−6 to 50 ng mL−1 | 58 | |
| Nanoscale electrode-aptamer-SARS-CoV-2 imaging by photo-induced force microscopy | 1.30 × 10⁻³ nM (6.6 × 10⁻² ng mL−1) | 59 | ||
| Folding-based electrochemical aptasensor | 7 nM | 29 | ||
| Optimization electrochemical aptasensor using SPCE-Au | 2.63 ng mL−1 | Salivary | 30 | |
| Electrochemical aptasensor using SPCE-CeO2 functionalized aptamer for the RBD spike detection | 1.7 × 10⁻² ng mL−1 | 1 × 10⁻³ to 102 ng mL−1 | Salivary, oropharyngeal swab | This work |
4 Conclusions
We have shown that the simple aptasensor can detect SARS-CoV-2 Spike RBD, which is indicated by changes in electrochemical signals resulting from the interaction between the Spike RBD and SPCE-CeO2@NH2-aptamer. These electrochemical aptasensor shows a fast (within 10 minutes) and accurate portable device with precision and accuracy of 90.50% and 97.39, respectively. Some of the materials used in electrochemical aptasensor have been reported, we show a comparison in Table 5. The electrochemical aptasensor is quite promising as a candidate for a SARS-CoV-2 diagnostic tool as an alternative to the qRT-PCR method.Ethical approval
The Research Ethics Committee Universitas Padjadjaran, has approved this study (registration no. 860/UN6.KEP/EC/2020). The study was conducted within the Biological Safety Cabinet Class II in the COVID-19 Laboratory (C-29 Lab), Universitas Padjadjaran.Author contributions
AT and HLW performed and conducted the experiments, drafted the manuscript; SNA, IA, AS, and DD analyzed the data; SG and MY supervised the study; YWH conceived the whole study. All authors were involved in manuscript editing.Conflicts of interest
There are no conflicts to declare.Acknowledgements
We thank Indonesian Ministry of Research, Technology and the National Innovation Agency for supporting this work with scheme No. 69/FI/P-KCOVID-19.2B3/IX/2020, and Universitas Padjadjaran Academic Leadership Grant No. 2203/UN6.3.1/PT.00/2022. The authors thank the School of Electrical Engineering and Informatics, Bandung Institute of Technology, for funding the article processing charge.References
- World Health Organization, https://covid19.who.int/, accessed 20 November 2022.
- Y. Song, J. Song, X. Wei, M. Huang, M. Sun, L. Zhu, B. Lin, H. Shen, Z. Zhu and C. Yang, Anal. Chem., 2020, 92, 9895–9900 CrossRef CAS PubMed.
- S. Mavrikou, G. Moschopoulou, V. Tsekouras and S. Kintzios, Sensors, 2020, 20, 1–12 CrossRef PubMed.
- B. Diao, K. Wen, J. Chen, Y. Liu, Z. Yuan, C. Han, J. Chen, Y. Pan, L. Chen, Y. Dan, J. Wang, Y. Chen, G. Deng, H. Zhou and Y. Wu, MedRxiv, 2020 DOI:10.1101/2020.03.07.200.
- G. N. Fadhilah, M. Yusuf, A. K. Sari, T. R. Tohari, H. L. Wiraswati, S. Ekawardhani, L. Faridah, N. Fauziah, I. Anshori and Y. W. Hartati, ChemistrySelect, 2023, 8, e202203928 CrossRef CAS.
- P. D. Crook, J. R. Hospital and U. Kingdom, ISARIC, https://isaric.tghn.org/, accessed 20 November 2022 Search PubMed.
- S. Kang, M. Yang, Z. Hong, L. Zhang, Z. Huang, X. Chen, S. He, Z. Zhou, Z. Zhou, Q. Chen, Y. Yan, C. Zhang, H. Shan and S. Chen, Acta Pharm. Sin. B, 2020, 10, 1228–1238 CrossRef CAS PubMed.
- Y. Li, L. Yao, J. Li, L. Chen, Y. Song, Z. Cai and C. Yang, J. Med. Virol., 2020, 92, 903–908 CrossRef CAS PubMed.
- A. Ahmadivand, B. Gerislioglu, Z. Ramezani, A. Kaushik, P. Manickam and S. A. Ghoreishi, Biosens. Bioelectron., 2021, 177, 1–8 CrossRef PubMed.
- T. Nguyen, D. D. Bang and A. Wolff, Micromachines, 2020, 11, 1–7 Search PubMed.
- B. Mojsoska, S. Larsen, D. A. Olsen, J. S. Madsen, I. Brandslund and F. A. Alatraktchi, Sensors, 2021, 21, 1–11 CrossRef PubMed.
- L. Fabiani, M. Saroglia, G. Galatà, R. De Santis, S. Fillo, V. Luca, G. Faggioni, N. D'Amore, E. Regalbuto, P. Salvatori, G. Terova, D. Moscone, F. Lista and F. Arduini, Biosens. Bioelectron., 2021, 171, 112686 CrossRef CAS PubMed.
- M. Z. Rashed, J. A. Kopechek, M. C. Priddy, K. T. Hamorsky, K. E. Palmer, N. Mittal, J. Valdez, J. Flynn and S. J. Williams, Biosens. Bioelectron., 2021, 171, 1–6 CrossRef PubMed.
- S. Mahari, A. Roberts, D. Shahdeo and S. Gandhi, bioRxiv, 2020, 1–20 CAS.
- Z. Rahmati, M. Roushani, H. Hosseini and H. Choobin, Microchim. Acta, 2021, 188, 1–9 CrossRef PubMed.
- S. Kesavan, N. S. K. Gowthaman, S. Alwarappan and S. A. John, Sens. Actuators, B, 2019, 278, 46–54 CrossRef CAS.
- Y. W. Hartati, D. Nurdjanah, S. Wyantuti, A. Anggraeni and S. Gaffar, AIP Conf. Proc., 2018, 2049(1), 020051 CrossRef.
- S. Alwarappan, S. R. Singh, S. Pillai, A. Kumar and S. Mohapatra, Anal. Lett., 2012, 45, 746–753 CrossRef CAS.
- A. Sakthivel, A. Chandrasekaran, M. Sadasivam, P. Manickam and S. Alwarappan, J. Electrochem. Soc., 2021, 168, 017507 CrossRef CAS.
- A. K. Sari, S. Gaffar and Y. W. Hartati, Anal. Bioanal. Electrochem., 2022, 14, 127–143 CAS.
- S. D. Jayasena, Clin. Chem., 1999, 45, 1628–1650 CrossRef CAS.
- B. Kayhan and U. Kayabas, Dis. Mol. Med., 2013, 1, 54–60 CrossRef.
- S. M. Kim, J. Kim, S. Noh, H. Sohn and T. Lee, Biochip J., 2020, 14, 327–339 CrossRef CAS PubMed.
- L. Yang, L. Li, F. Li, H. Zheng, T. Li, X. Liu, J. Zhu, Y. Zhou and S. Alwarappan, Anal. Bioanal. Chem., 2021, 413, 193–203 CrossRef CAS PubMed.
- S. Zhang, H. Zheng, R. Jiang, J. Yuan, F. Li, T. Qin, A. Sakthivel, X. Liu and S. Alwarappan, Sens. Actuators, B, 2022, 351, 130966 CrossRef CAS.
- Y. Tang, X. Liu, H. Zheng, L. Yang, L. Li, S. Zhang, Y. Zhou and S. Alwarappan, Nanoscale, 2019, 11, 9115–9124 RSC.
- A. Idili, C. Parolo, R. Alvarez-Diduk and A. Merkoçi, ACS Sens., 2021, 6, 3093–3101 CrossRef CAS PubMed.
- J. A. Zakashansky, A. H. Imamura, D. F. Salgado, H. C. Romero Mercieca, R. F. L. Aguas, A. M. Lao, J. Pariser, N. Arroyo-Currás and M. Khine, Anal. Methods, 2021, 13, 874–883 RSC.
- F. Curti, S. Fortunati, W. Knoll, M. Giannetto, R. Corradini, A. Bertucci and M. Careri, ACS Appl. Mater. Interfaces, 2022, 14, 19204–19211 CrossRef CAS PubMed.
- A. K. Sari, Y. W. Hartati, S. Gaffar, I. Anshori, D. Hidayat and H. L. Wiraswati, J. Electrochem. Sci. Eng., 2022, 12, 219–235 CrossRef CAS.
- S. N. Zakiyyah, D. R. Eddy, M. L. Firdaus, T. Subroto and Y. W. Hartati, J. Electrochem. Sci. Eng., 2022, 1–18 Search PubMed.
- R. C. de Carvalho, A. J. Betts and J. F. Cassidy, Microchem. J., 2020, 158, 1–11 CrossRef.
- Y. W. Hartati, L. K. Letelay, S. Gaffar, S. Wyantuti and H. H. Bahti, Sens. Bio-Sens. Res, 2020, 27, 1–13 Search PubMed.
- M. Roushani and F. Shahdost-Fard, Microchim. Acta, 2018, 185, 1–8 CrossRef PubMed.
- J. T. Dahle and Y. Arai, Int. J. Environ. Res. Public Health, 2015, 12, 1253–1278 CrossRef PubMed.
- Y. W. Hartati, S. N. Topkaya, S. Gaffar, H. H. Bahti and A. E. Cetin, RSC Adv., 2021, 11, 16216–16235 RSC.
- B. C. Nelson, M. E. Johnson, M. L. Walker, K. R. Riley and C. M. Sims, Antioxidants, 2016, 5, 1–21 CrossRef PubMed.
- M. Khairy, B. G. Mahmoud and C. E. Banks, Sens. Actuators, B, 2018, 259, 142–154 CrossRef CAS.
- M. Muthukumaran, C. Venkateswara Raju, C. Sumathi, G. Ravi, D. Solairaj, P. Rameshthangam, J. Wilson, S. Rajendran and S. Alwarappan, New J. Chem., 2016, 40, 2741–2748 RSC.
- A. A. Azmi, A. H. Ruhaimi and M. A. A. Aziz, Mater. Today Chem., 2020, 16, 1–9 Search PubMed.
- Y. W. Hartati, D. R. Komala, D. Hendrati, S. Gaffar, A. Hardianto, Y. Sofiatin and H. H. Bahti, R. Soc. Open Sci., 2021, 8, 1–11 Search PubMed.
- M. Guler, V. Turkoglu, A. Kivrak and F. Karahan, Mater. Sci. Eng., C, 2018, 90, 454–460 CrossRef CAS PubMed.
- S. Ismail, N. A. Yusof, J. Abdullah and S. F. Abd Rahman, Materials, 2020, 13, 1–16 CrossRef PubMed.
- D. Liu, C. Ju, C. Han, R. Shi, X. Chen, D. Duan, J. Yan and X. Yan, Biosens. Bioelectron., 2021, 173, 1–8 Search PubMed.
- I. Soussi, Z. Mazouz, P. Y. Collart-Dutilleul, M. Echabaane, M. Martin, T. Cloitre, R. M’ghaieth, F. J. G. Cuisinier, F. Cunin, C. Gergely and A. Othmane, Colloids Surf., B, 2019, 181, 489–497 CrossRef CAS PubMed.
- Q. Wang, B. Zhang, X. Lin and W. Weng, Sens. Actuators, B, 2011, 156, 599–605 CrossRef CAS.
- C. Carlomagno, D. Bertazioli, A. Gualerzi, S. Picciolini, P. I. Banfi, A. Lax, E. Messina, J. Navarro, L. Bianchi, A. Caronni, F. Marenco, S. Monteleone, C. Arienti and M. Bedoni, Sci. Rep., 2021, 11, 1–13 CrossRef PubMed.
- K. Khiabani and M. H. Amirzade-Iranaq, Am. J. Infect. Control, 2021, 49, 1165–1176 CrossRef CAS PubMed.
- S. Tsunekawa, J. T. Wang, Y. Kawazoe and A. Kasuya, J. Appl. Phys., 2003, 94, 3654–3656 CrossRef CAS.
- M. M. Ali, H. S. Mahdi, A. Parveen and A. Azam, AIP Conf. Proc., 2018, 1953, 1–5 Search PubMed.
- A. Weibel, R. Bouchet, F. Boulc’h and P. Knauth, Chem. Mater., 2005, 17, 2378–2385 CrossRef CAS.
- P. Nayak, P. N. Santhosh and S. Ramaprabhu, J. Nanosci. Nanotechnol., 2015, 15, 4855–4862 CrossRef CAS PubMed.
- J. Hao, X. Fang, Y. Zhou, J. Wang, F. Guo, F. Li and X. Peng, Int. J. Nanomed., 2011, 6, 683–692 CAS.
- R. J. White, N. Phares, A. A. Lubin, Y. Xiao and K. W. Plaxco, Langmuir, 2008, 24, 10513–10518 CrossRef CAS PubMed.
- B. S. Vadlamani, T. Uppal, S. C. Verma and M. Misra, Sensors, 2020, 20, 1–10 CrossRef PubMed.
- Z. Rahmati, M. Roushani, H. Hosseini and H. Choobin, Bioelectrochemistry, 2022, 146, 1–9 CrossRef PubMed.
- M. A. Tabrizi and P. Acedo, Biosensors, 2022, 12, 1–14 Search PubMed.
- J. Xue, Y. Li, J. Liu, Z. Zhang, R. Yu, Y. Huang, C. Li, A. Chen and J. Qiu, Talanta, 2022, 248, 1–6 CrossRef PubMed.
- J. C. Abrego-Martinez, M. Jafari, S. Chergui, C. Pavel, D. Che and M. Siaj, Biosens. Bioelectron., 2022, 195, 1–24 CrossRef PubMed.
| This journal is © The Royal Society of Chemistry 2023 |