 Open Access Article
Modelling PIP4K2A inhibitory activity of 1,7-naphthyridine analogues using machine learning and molecular docking studies†
Muktar Musa Ibrahim *,
Adamu Uzairu,
Muhammad Tukur Ibrahim and
Abdullahi Bello Umar
Department of Chemistry, Faculty of Physical Sciences, Ahmadu Bello University, P. M. B 1045, Zaria, Nigeria. E-mail: sagagi1914@gmail.com; Fax: +234 6196 4053
First published on 24th January 2023
Abstract
PIP4K2A is a type II lipid kinase that catalyzed the rate-limiting step of the conversion of phosphatidylinositol-5-phosphate (PI5P) into phosphatidylinositol 4,5-bisphosphate (PI4,5P2). PIP4K2A has been intricately linked to the inhibition of various types of tumors via reactive oxygen species-mediated apoptosis, making it an important therapeutic target. In the quest of finding biologically active substances with efficient PIP4K2A inhibitory activity, machine learning algorithms were used to investigate the quantitative relationship between structures and inhibitory activities of 1,7-naphthyridine analogues. Three machine learning algorithms (MLR, ANN, and SVM) were used to develop QSAR models that can effectively predict the PIP4K2A inhibitory activity of a library of 1,7-naphthyridine analogues. The cascaded feature selection method was performed by sequential application of GFA and MP5 algorithms to identify a molecular descriptor subset that can best describe the PIP4K2A inhibitory activity of 1,7-naphthyridine analogues. PIP4K2A inhibitory activities predicted by the ML models were strongly correlated with the experimental values. The QSAR Modelling indicates that the best-performing ML model was SVM with the RBF kernel function. The SVM model performed very well in predicting PIP4K2A inhibitory activity of the 1,7-naphthyridine analogues with RTR and QEX values of 0.9845 and 0.8793 respectively. To further gain more structural insight into the origin of PIP4K2A inhibitory activity of 1,7-naphthyridine analogues, molecular docking studies were performed. The results indicate that five compounds; 15, 25, 13, 09, and 28 were found to have a high binding affinity with the receptor molecules. Hydrogen bonding, pi–pi interaction, and pi–cation interactions were found to modulate the binding interaction of the inhibitors. Although the SVM gives essentially a black-box model which cannot be readily interpreted, using SVM in tandem with MLR and ANN provides a unique perspective in building robust QSAR predictive models. The superior predictive performance of the ML models and the explanatory power of MLR models were combined to provide a unique insight into the structure–activity relationship of 1,7-naphthyridine inhibitors. This is relevant in that it provides information that can be invaluable as guidelines for the design of novel PIP4K2A inhibitors.
1 Introduction
Cancer is the most problematic and difficult disease to cure in the world, it is indeed one of the greatest public health challenges of our time.1 Over the last four decades, tremendous resources have been directed towards research aimed at searching for and developing effective drugs for cancer treatment. Yet, it remains a formidable public health challenge.2 The number of lives lost annually to cancer is quite significant. According to the American Cancer Society projections, in the year 2022, cancer could be the primary cause of death for about 609![[thin space (1/6-em)]](https://www.rsc.org/images/entities/char_2009.gif) 360 people in the United States alone.3 A similar disturbing trend of people losing their lives because of cancer is observed globally. According to a report by the National Cancer institute (NCI), 9.9 million people have lost their life because of cancer related diseases worldwide in 2020.4 Cancer is problematic because it tends to alter the genes responsible for the normal cellular functions, disturbing normal cellular activities.5 Moreover, cancer cells intrude and colonize normal cells in other parts of the body, slowly taking over their functions.5,6 By mimicking normal cells in the body, cancer cells evade the body's immune system, making it difficult for the body to detect and effectively neutralize them. Cancer cells need to proliferate very rapidly to speedily colonize cells in other parts of the body. This requires constant and abundant supply of nutrients. Given that the level of nutrients in the body varies, adapting to the body's constantly changing microenvironment is a key survival trait for cancer cells. Therefore, cancer cells have developed a very sophisticated and robust adaptive mechanism for effective regularization of their micro-environment.7
360 people in the United States alone.3 A similar disturbing trend of people losing their lives because of cancer is observed globally. According to a report by the National Cancer institute (NCI), 9.9 million people have lost their life because of cancer related diseases worldwide in 2020.4 Cancer is problematic because it tends to alter the genes responsible for the normal cellular functions, disturbing normal cellular activities.5 Moreover, cancer cells intrude and colonize normal cells in other parts of the body, slowly taking over their functions.5,6 By mimicking normal cells in the body, cancer cells evade the body's immune system, making it difficult for the body to detect and effectively neutralize them. Cancer cells need to proliferate very rapidly to speedily colonize cells in other parts of the body. This requires constant and abundant supply of nutrients. Given that the level of nutrients in the body varies, adapting to the body's constantly changing microenvironment is a key survival trait for cancer cells. Therefore, cancer cells have developed a very sophisticated and robust adaptive mechanism for effective regularization of their micro-environment.7
Over the years, researchers have targeted the mechanism by which cancer cells adapt to their micro-environment.8–10 Phosphoinositide-3-kinase (PI3K) signal transduction pathway is the most important pathway that controls the metabolic adaptation of cancer cells.8 Hence, developing drugs that can effectively disrupt the PI3K signal transduction pathway is of primary interests to researchers.8 Rapid growth and proliferation of cancer cells is hampered by disrupting the PI3K signal transduction pathway. This is achieved via hyperactivation of AKT, and apoptosis caused by reactive oxygen species.9 The conversion of phosphatidylinositol-5-phosphate (PI5P) into phosphatidylinositol 4,5-bisphosphate (PI4,5P2), an important step in PI3K signal transduction is catalysed by PIP4K2s, a type II kinase inhibitor.10–14 Because of the number of important cellular processes such as vesicle transport, adhesion, cell proliferation, and apoptosis that depends on this conversion, PIP4K2A have been inhibitors are intricately involved in many biological processes that are responsible for malignant phenotype. furthermore, PIP4K2A has been reported to exhibit a synthetic lethal interaction with the tumor suppressor gene p53.14 PIP4K2A inhibitors are of enormous interest to researchers because of the role they play in inhibiting tumour growth and apoptosis in multiple types of cancers including breast cancer,16 acute leukaemia,17 and glioblastoma.18
Chemists have always suspected that there is a nexus between the structure of chemical compounds and their corresponding biological activity. The quantitative relationship between chemical structure and biological activity was first investigated by Hansc and colleagues.19 In the seminal work, they established an explicit correlation between the biological activity of plant growth regulators and their structural features. Understanding the quantitative relationship between structure of molecules and their biological activity of chemical is useful for predicting biological activities and toxicity of novel compounds.20 Traditionally, simple linear regression was used to perform Quantitative Structure Activity Relationship (QSAR) to establish a mathematical relationship between structure of molecules and their biological activities.21 Although the traditional QSAR approach has been used to produce useful quantitative models that are easily interpretable, it fails to capture the complex non-linear relationship between molecular structure and biological activity.15 This is because in traditional QSAR studies, structure–activity relationship is approximated to be linear, which mostly is not the case. This makes the accuracy with which traditional QSAR approach quite low. To make accurate predictions of biological activities from descriptors derived from structures of molecule, more sophisticated learning algorithms are required.
Recently, Machine Learning Algorithms (MLAs) have been used to make more accurate predictions of biological activities of molecules as a function of their structural properties.22 Unlike the traditional regression models, MLAs take into consideration the complex and non-linear relationship that exists between molecular structure and biological activity, producing more accurate models. Many MLAs have been reported to have excellent capabilities for predicting biological activities of molecules.23 However, MLAs are notoriously difficult to interpret. This is a major limitation, because it makes it difficult discern which physico-chemical parameter is responsible for increased or decreased biological activity.24 In this work, we used Multilinear Regression (MLR) in tandem with two popular machine learning algorithms: Artificial Neural Network (ANN) and Support Vectors Machine (SVM) to modelled PIP4K2A inhibitory activity of 1,7-napthyridine analogues.1 The MLR provides an explicit mathematical relationship between the structure of these molecules and their PIP4K2A inhibitory activity while ANN and SVM gives better predictive performance. The combined strengths of the MLR and ML methods were exploited in this study to investigate the structure–activity relationships of 1,7-napthyridine inhibitors. This approach has been used in the literature to build make exhaustive QSAR investigations.39,40 Finally, we used molecular docking studies to investigate the nature of the binding interactions between PIP4K2A receptor and 1,7-naphthyridine analogues.
2 Materials and methods
A QSAR model is only useful when it can be used to make accurate and reliable predictions of the biological activity of an unknown compound. Accurate and reliable QSAR models were developed in this study in line with the OECD protocols.25 According to the OECD, the dataset used must have a specified endpoint and explicit learning algorithms must be used. Also, the domain of applicability of the QSAR models must be established. The OECD protocols were carefully considered in this work. The robustness and predictivity of the developed models were tested using standard statistical protocols, and a mechanistic interpretation of the QSAR model was attempted. The underlying ligand–receptor binding interactions of the compounds were investigated using molecular docking. To facilitate the reproducibility of the research work performed herein, the dataset used can be found in the ESI section (Dataset S1†).2.1 Dataset
We have curated forty-four compounds with the basic scaffold of 1,7-naphthyridine from the experimental work of Wortmann et al.20 The activity of the compounds curated were based on percentage inhibitory concentration (IC50), which represents the minimum amount of the inhibitor required for 50% inhibition of PIP4K2A in vitro. The IC50 values of the 1,7-naphthyridine analogues measured using PIP4K2A ADP-Glo assay falls within the range of 0.066 to 18.0 μM. The compounds were derived from the framework of BAY-09 and its various derivatives obtained using nucleophilic substitutions and Suzuki coupling reactions.20 To obtain uniform distribution of IC50 values of the PIP4K2A inhibitors, logarithmic transformation of the IC50 values to base 10 was performed using the relationship shown eqn (1).| PIC50 = −log(IC50 × 10−6) | (1) |
2.2 Geometry optimization
The lowest energy conformers of the 44 PIP4K2A inhibitors were obtained by geometry optimization using a cascaded approach.26 However, before the optimization was performed, 2D structures of the molecules were drawn using Chem Draw Ultra (version 12) and the molecular geometries of molecules in 3D were generated using Spartan 14. The 3D structures were first optimized using the semi-empirical method (AM1) to obtain low energy conformers. And then, Density Functional Theory (DFT) at DFT/B3LYP/6-311g(d) level of theory was employed to obtain the lowest energy conformers used for further computational investigations. All geometry optimization calculations were performed using Spartan 14 software in full, without any symmetry constriction. The optimized structures were saved in Sdf format and then exported to PADEL for molecular descriptor calculations.2.3 Descriptor calculation
Molecular descriptors are vectoral representations of molecular structures that can be mapped on to biological activities.25 Molecular descriptors were computed using PADEL software after the dataset was pre-treated by removing salts and standardizing tautomer. Different topographical, physicochemical, steric, geometrical, energetic, and electronic descriptors were computed. And the descriptors obtained were pre-treated to remove constant and redundant values that are not useful for QSAR model development.2.4 Variable selection
Genetic Function Approximation (GFA) is an effective method of identifying the relevant descriptors for building a robust QSAR model.27 The GFA approach uses the MARS algorithm in tandem with GA to produce a set of models that describes a training dataset. Models that fit the training data better than the average were selected based on a scoring function as the “parent” model, from which a “child” model was created. The scoring function used in selecting models in GFA was the so-called Friedman's Lack of Fit measure (LOF) (eqn (2)). Mutation probability and smoothing parameters were set to 0.1 and 0.5, respectively.
 | (2) |
2.5 Dataset division and scaling
The dataset curated were partitioned into training and validation sets using the Kennard-Stone Algorithm.28 The training set constituting 70% of the dataset was used for model development and hyperparameter optimization, while the test set, consisting 30% of the curated data set was used for external validation of the various QSAR models. Furthermore, standardization of molecular descriptors was performed to allow for comparability between the independent variables. The independent variables (molecular descriptors) were scaled to zero mean and unit variance using the relationship shown in eqn (3).
 | (3) |
![[x with combining macron]](https://www.rsc.org/images/entities/i_char_0078_0304.gif) i represent the mean value of ith descriptor while σi represent the standard deviation of the ith descriptor.
i represent the mean value of ith descriptor while σi represent the standard deviation of the ith descriptor.
2.6 Model validation
For a QSAR model to be useful, it must be able to make accurate prediction of the biological activity of compounds that are not present in the modelling set, within the model's domain of applicability.32 This ability is indicated by the reliability and predictability of the QSAR model, computed using rigorous statistical validation procedure. Tropsha29 proposed a minimum recommended value of reliability and predictability validation criteria as shown in Table 1. Models that fulfil these criteria are robust.| Symbol | Name | Value |
|---|---|---|
| R2 | Coefficient of determination | ≥0.6 |
| P (95%) | Confidence interval at 95% confidence limit | <0.05 |
| QCV2 | Cross validation coefficient | ≥0.5 |
| REX2 | Coefficient of determination of external set | ≥0.5 |
| NEX | Minimum number of external sets | ≥5.0 |
 | (4) |
 | (5) |
 | (6) |
 | (7) |
2.7 Applicability domain
The biological activity of compounds that fall outside the Applicability Domain (AD) of a model cannot be reliably predicted using the model.29 AD analysis was employed to determine outliers and influential molecules in the data set and also to affirm the model's reliability. The most commonly used method for AD analysis is based on leverage computation as described by grammatic.30 The leverage value allows for the identification of a compound, whether it is within or outside the domain of applicability. Leverage values of all the compounds are calculated using eqn (8)| Hi = xi(XTX)−kXiT (i = K, …, P) | (8) |
| ℏ* = 3(p + 1)/n | (9) |
2.8 QSAR model development
Three different learning algorithms; Multilinear Regression (MLR), Support Vector Machines (SVM), and Artificial Neural Networks (ANN) were used for QSAR model development in this study. The performance of each of these models in predicting PIP4K2A inhibitory activity of 1,7-naphthyridine analogues was evaluated Using Pearson's correlation coefficient (R), and cross-validated R squared, and root mean square error (RMSE). All calculations were carried out using Weka machine learning suite.2.9 Molecular docking studies
Co-crystallized PIP4K2A receptor (PDB 6YM3) with BAY 091 ligand was obtained from the protein data bank. The receptor was prepared by assigning hydrogen bonds, removing water molecules, converting selemethionines to methionine, creating disulphide bonds, and filling missing side chains using the protein preparation wizard of the Schrödinger suite. The receptor protein was minimized using OPLS4 forcefields as implemented in the Schrodinger software. Ligand preparation was carried out using the Ligprep module of the software. The same forcefield used for protein preparation was utilized for ligand preparations to obtain reliable results. After the ligand and protein preparations, a grid file was prepared using the grid generation tool of the glide module. Molecular docking was performed using the grid file generated using the extra-precision docking protocol as implemented on the glide module of the Schrodinger software. Before molecular docking, the docking protocol was validated by re-docking the PIP4K2A co-crystal ligand and protein.353 Results and discussion
3.1 QSAR using multilinear regression (MLR)
Feature selection performed using Genetic Function Approximation (GFA) left seven independent variables that describe the data set. The GFA algorithm selected; ATSC7p, MATS8c, MATS6i, SpMin2_Bhv, SpMin5_Bhe, SpMax8_Bhi, and Kier3 to be the most relevant descriptors for describing PIP4K2A inhibitory activity of the 1,7-naphthyridine analogues. QSAR model generated using MLR (eqn (10)) shows good predictive performance with RTR and QCV values of 0.9088 and 0.7662, respectively (Table 2). The reliability of the model was further indicated by the values of Leave-One-Out Cross-Validation (LOO-CV) parameters of QCV, RMSECV and MAECV values of 0.7860, 0.1301, and 0.2276. Furthermore, ability of the model to predict inhibitory activity for external dataset that was not involved in training set was evaluated by computing the values of QEX, RMSEEX, and MAEEX as shown in Table 2. The results indicate that the QEX, RMSEEX, and MAEEX values of the model falls within acceptable range for an acceptable model (Table 1). Indicating that the MLR model developed was robust and can be reliably used to predict PIP4K2A inhibitory activity for an independent dataset.35| Y = −0.186 × ATSC7p + 14.720 × MATS8c + 15.123 × MATS6i − 60.697 × SpMin2_Bhv + 32.911 × SpMin5_Bhe − 3.880 × SpMax8_Bhi − 0.858 × Kier3 + 102.735 | (10) |
| Algorithm | Training set | LOO-CV set | External set | ||||||
|---|---|---|---|---|---|---|---|---|---|
| RTR | RMSETR | MAETR | QCV | RMSECV | MAECV | QEX | RMSEEX | MAEEX | |
| MLR | 0.9088 | 0.3017 | 0.2301 | 0.7860 | 0.1301 | 0.2276 | 0.7662 | 0.4557 | 0.2531 |
| ANN | 0.9615 | 0.2405 | 0.1882 | 0.7784 | 0.1524 | 0.1354 | 0.7581 | 0.3423 | 0.2098 |
| SVM | 0.9845 | 0.2049 | 0.0973 | 0.8802 | 0.1368 | 0.5336 | 0.8793 | 0.1464 | 0.108 |
To further enhance the model's performance, the MP5 algorithm was utilized for feature selection to further scrutinize the resultant descriptors generated by the GFA feature selection. This resulted in the removal of 2 molecular descriptors (ATSC7p, and SpMax8_Bhi), resulting in only five descriptors in the final MLR model (eqn (11)). The final MLR also had good predictive performance with RTr and RMSETr values of 0.7008 and 0.4377, respectively.
| Y = 2.7613 × MATS8c + 4.0225 × MATS6i − 34.8628 × SpMin2_Bhv + 7.5081 × SpMin5_Bhe − 0.3842 × Kier3 + 70.0556 | (11) |
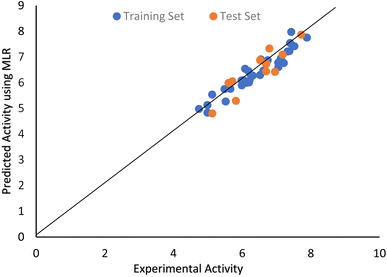
The closeness of the experimental data point and the values predicated by MLR after MP5 feature selection can be seen in the scatter plot shown in Fig. 1.
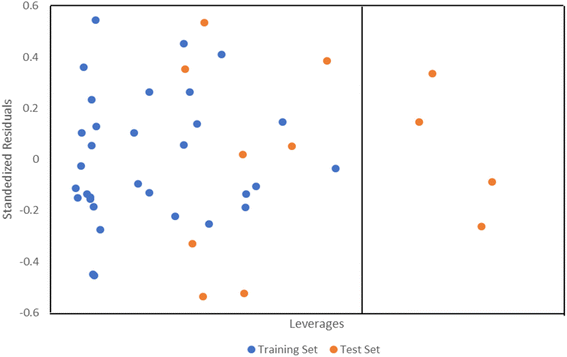
The applicability domain of the QSAR model developed using MLR was computed using the William plot (Fig. 2). Four compounds (26, 46, 1, and 15) found to have leverages higher than the warning leverage (0.75), were deemed to be structurally different from the remaining influential compounds. However, most of the compounds fall within the domain of applicability of the MLR model developed.
The first three descriptors (ATSC7p, MATS8c, MATS6i) that appear in the final MLR model (eqn (11)) were 1D autocorrelation descriptors, followed by two burden modified eigenvalue descriptors (SpMin2_Bhv, SpMin5_Bhe) and one kappa shape indices descriptor (Kier3). Autocorrelation descriptors describe the relationship between a given molecular property and the topology of a molecule. ATSC7p is a centered Moreau-Broto descriptor of lag 7 weighted by atomic polarizabilities which shows the tendency of a molecule to generate induced dipole when subjected to an external electric field. As observed in eqn (11), there is a negative correlation between ATSC7p and PIP4K2A inhibitory activity which suggests that inhibitors with lower polarizabilities would have higher PIP4K2A inhibitory activity. MATS8c and MATS6i are Moran autocorrelation descriptors of lag 8 and 6, weighted by charges and first ionization potential respectively. Both MATS8c and MATS6i are exhibiting a positive correlation with PIP4K2A inhibitory activity indicating that increasing the values of these physicochemical parameters will have a positive effect on the compound's inhibitory activity. The first three descriptors (ATSC7p, MATS8c, MATS6i) that appear in the final MLR model (eqn (11)) were 1D autocorrelation descriptors, followed by two burden modified eigenvalue descriptors (SpMin2_Bhv, SpMin5_Bhe) and one kappa shape indices descriptor (Kier3). Autocorrelation descriptors describe the relationship between a given molecular property and the topology of a molecule. ATSC7p is a centered Moreau-Broto descriptor of lag 7 weighted by atomic polarizabilities which shows the tendency of a molecule to generate induced dipole when subjected to an external electric field. As observed in eqn (11), there is a negative correlation between ATSC7p and PIP4K2A inhibitory activity which suggests that inhibitors with lower polarizabilities would have higher PIP4K2A inhibitory activity. MATS8c and MATS6i are Moran autocorrelation descriptors of lag 8 and 6, weighted by charges and first ionization potential respectively. Both MATS8c and MATS6i are exhibiting a positive correlation with PIP4K2A inhibitory activity indicating that increasing the values of these physicochemical parameters will have a positive effect on the compound's inhibitory activity.
The second sets of molecular descriptors present in the MLR model were the so-called burden modified eigenvalue descriptors (SpMin2_Bhv, SpMin5_Bhe). These descriptors also describe molecular topology, but they are derived from eigenvalues of adjacency matrix. Compounds with groups that increases the physico–chemical parameter associated with SpMin2_Bhv will have lower inhibitory activity against PIP4K2A as indicated by the negative sign of the correlation coefficient (eqn (11)). SpMin5_Bhe correlates positively with PIP4K2A inhibitory activity of 1,7-naphthyridine inhibitors. Thus, increasing the value of this physicochemical parameter will have a positive effect on PIP4K2A. Kier3 is a kappa space index molecular descriptor which describes various aspect of molecular shape. The descriptor had negative correlation with PIP4K2A inhibitory activity (eqn (11)). Interestingly, the MP5 algorithms selects at least one descriptor from each class, indicating that descriptors selected by MP5 algorithm are representative of the entire descriptor class. They contain the most relevant information related to PIP4K2A inhibitory activity of the compounds. Therefore, the descriptors that appear in eqn (11) were used for developing other QSAR models using ANN and SVM.
3.2 QSAR using artificial neural network (ANN)
The dataset consisting of 5 molecular descriptors that appeared in eqn (11) was utilized to investigate performance of ANN in predicting PIP4K2A inhibitory activity. Prior to developing a neural network, the data was standardized to obtain comparable independent variables.22 Detailed optimization of ANN hyperparameters performed using grid search algorithm (Appendix 2†) indicate that the optimal values of number of nodes in hidden layer, learning epochs, learning rate and momentum were 3, 100, 0.1, and 0.3, respectively (Table 3). These values were used build an ANN model for predicting PIP4K2A inhibitory activity of 1,7-naphthyridine analogues. Correlation coefficient was used as a metric to determine the optimal number of nodes in the hidden layer. The value of the correlation coefficient increases as the number of nodes in the hidden layer increased until the optimum value was attained. The optimum value of the number of nodes in the hidden layer was 3 nodes with correlation coefficient of 0.9468 and RMSE value of 0.2638 respectively. This gives a neural network with 7 input variables, 3 hidden node and 1 output node, resulting in a 7-3-1 network topology. The optimal learning epoch was found to be 100 with correlation coefficient of 0.88814 and RMSE value of 0.37888 respectively.| ANN parameter | Optimal values | Training | LOO-CV set | ||
|---|---|---|---|---|---|
| RTR | RMSETR | QCV | RMSECV | ||
| Node in hidden layer | 3.00 | 0.946 | 0.264 | 0.72745 | 0.62029 |
| Learning epochs | 100 | 0.889 | 0.378 | 0.70148 | 0.60176 |
| Learning rate | 0.10 | 0.95599 | 0.27154 | 0.78348 | 0.37018 |
| Momentum | 0.30 | ||||
The result of the optimization of learning rate and momentum is represented in form of 2D contour plot (Appendix 2†). Contour plot is a useful way of representing 3D dimensional data in cartesian coordinate. The learning rate and momentum varies as a function of correlation coefficient.32 The lower left quadrant of the plot, with darker shade of red indicate the area with the optimal values of momentum and learning rate with higher correlation coefficients. Conversely, the upper right quadrant represents the region of learning rate and momentum with the lowest values of correlation coefficients. The region of optimal values includes learning rate and momentum in the range of 0.0 to 0.4 and 0.0 to 0.6 respectively. The optimal learning rate and momentum were found to be 0.1 and 0.3 respectively with correlation coefficient of 0.892 and RMSE value of 0.34418.
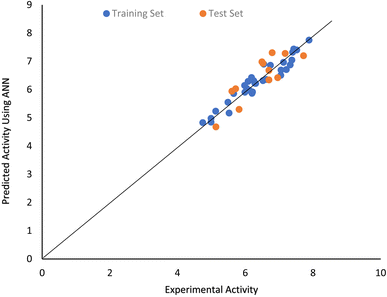
The ANN model developed at optimal values of ANN parameters have RTR and RMSETR values of 0.9615 and 0.7581 respectively. This indicate that the model was robust, and it can be reliably used to make accurate predictions of PIP4K2A inhibitory activities. The statistical metrics obtained from cross-validation of the ANN model provide further indication of its reliability. The quality of the QSAR model to predict PIP4K2A for external dataset was further investigated by computing QEX, RSMEEX and MAEEX as shown in Table 2. The results indicate the model the reliably predict external dataset with QEX, RMSEEX and MAEEX values of 0.7581, 0.3423, and 0.2098 which fall within the range of values for acceptable model. A plot of the experimental inhibitory activities of 1,7-naphthyridine analogues and values predicted using ANN are shown in Fig. 3. The nearness of the experimental and ANN predicted inhibitory activities indicate high predictive performance of the ANN model.
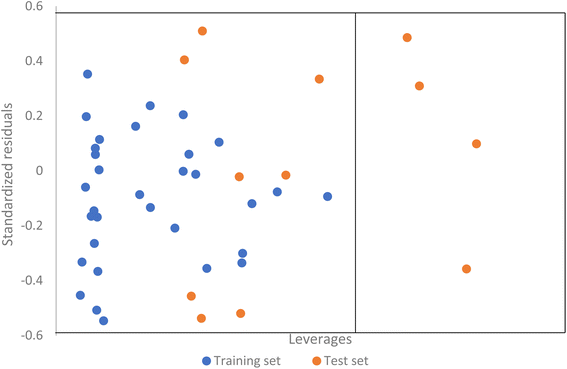
The domain of applicability of the ANN model computed using the leverage approach indicate that can be described using the model because they fall within fall within the domain of applicability. However, four compounds (26, 46, 1, and 15) had leverages greater than the warning leverage as indicated by the Williamson plot (Fig. 4). Interestingly, the same compounds identified as outliers by the MLR model also appeared as outliers in the applicability domain analysis of the ANN model.
3.3 QSAR using support vector machines (SVM)
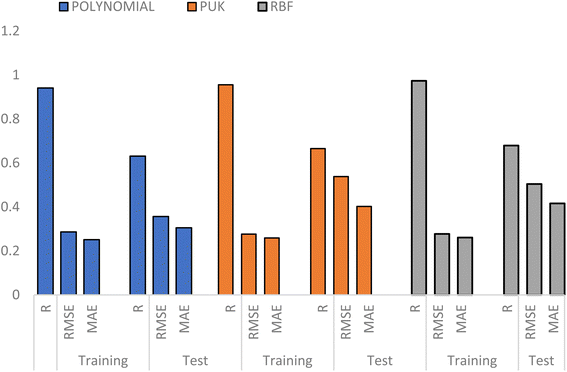
The predictive capability of SVM algorithm depends on the kernel function used in developing the model and the values of SVM hyperparameters (C, ε and γ).36 Three kernel functions including; polynomial, Pearson Universal Kernel (PUK) and Radial Basis Function (RBF) kernels were optimized using global grid search to obtain the best kernel for modelling PIP4K2A inhibitory activity of 1,7-naphthyridine inhibitors. The results of the global optimization are illustrated in Fig. 5 (Table in Appendix II†). The results of the global optimization of the complexity parameter C for the polynomial kernel (Appendix II†) as a function of RMSE, indicate that increasing the C value from −20 to 0 do not show any appreciable change in the RMSE values. However, as the C value goes beyond 0, the RMSE starts to decrease and the lowest RMSE value was obtained at C value of 5.0, implying that lower values of C are better. The optimal C value was found to be 5 corresponding to the lowest possible RMSE value of 0.35 for the polynomial kernel (Appendix II†). It was established from the global search that RBF is the best kernel function for predicting PIP4K2A inhibitory activity of 1,7-naphthyridine analogues with RTR, and RMSE values of 0.9737 and 0.2774 respectively (Appendix II†).Further hyperparameter tuning was performed using the RBF kernel to obtained more refined hyperparameter to be used for final SVM model development. The hyperparameters, C and γ were optimized concurrently as shown in (Appendix II†).
The 3D response plot (Appendix II†) for optimization of complexity parameter and gamma shows how the hyperparameters varies as a function of RMSE. It can be deduced from the plot that optimal values of C were in the region of 15–20, the region with lowest RMSE values (0.2–0.52) as indicated by the colour code in the right side of the plot. On the other hand, the lower RMSE were obtained at negative values of gamma. The optimal values of C and γ were 17 and 19 respectively (Table 4).
| Optimal parameters | Training set | LOO-CV set | ||||
|---|---|---|---|---|---|---|
| ε | C | γ | RTR | RMSETR | QCV | RMSECV |
| 0.001 | 17 | 19 | 0.9673 | 0.2341 | 0.9563 | 0.2563 |
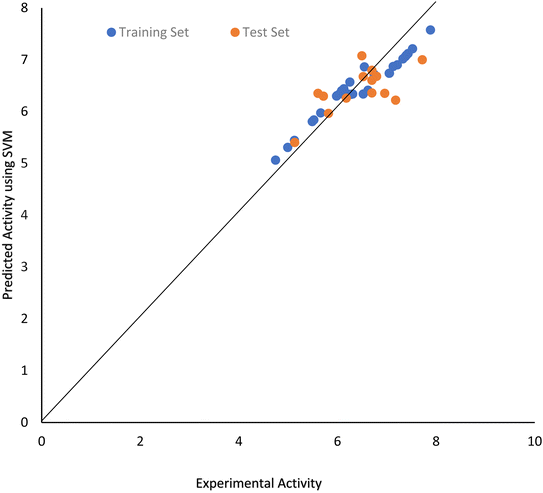
The final SVM model developed using RBF kernel at optimized SVM parameters shows good predictability with values of RTr and RMSETr as 0.984 and 0.1464 respectively. Scatter plot of PIP4K2A inhibitory activity of 1,7-naphthyridine analogues predicted by the SVM model versus their experimental activity are shown in Fig. 6.
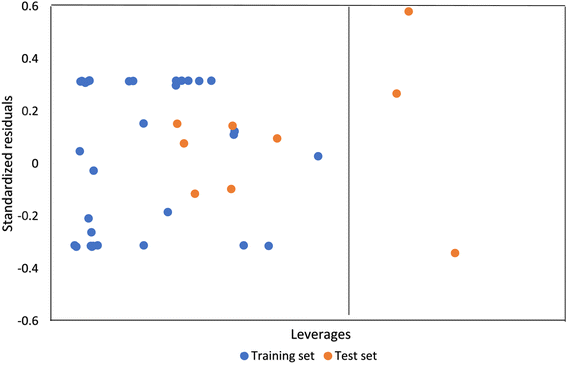
Applicability domain analysis of the QSAR model developed using SVM was also performed using the leverage approach. The Williamson plot (Fig. 7) of studentized residual versus leverages indicate that most of the compounds falls within the domain of applicability of the model with only three compounds having leverages greater than the warning leverage.
3.4 Molecular docking studies
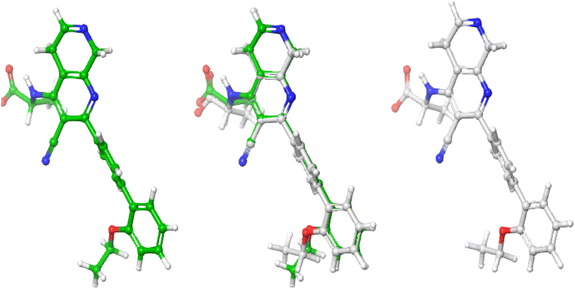
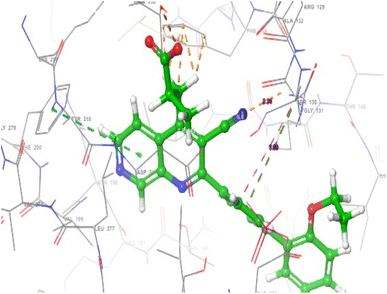
Molecular docking studies was performed to investigate the nature of the non-covalent bond interaction between the PIP4K2A receptor (pdb id = 6YM3) and 1,7-naphthyridine inhibitors. However, before the molecular docking studies, the reliability of the docking protocol was validated by redocking the co-crystallized ligand. The root mean squared deviation (RMSD) of the spatial position of atoms between the original orientation (co-crystallized) and computed (using the glide docking protocol) was found to be in the range of acceptable of 0–2 Å.34 The RSMD of the superimposed structures (Fig. 8) of the co-crystallized ligand and computed ligand poses was found to be 0.433 Å, indicating that the docking protocol used was reliable enough to investigate the non-covalent bond interaction between the 1,7-naphthyridine inhibitors and PIP4K2A receptor.The non-covalent interactions between PIP4K2A receptor and 1,7-naphthyridine analogues were investigated using five compounds (15, 25, 13, 09, and 28) with the highest docking score. The compound with the highest docking score (compound 15) was observed to have interacted with PIP4K2A receptor through hydrogen bond interaction, pi–pi stacking, and pi–cation interactions (Fig. 9). Conventional hydrogen bond was observed between the carboxylate group of the 1,7-naphthyridine inhibitor and Lys209 and Thr232 at a distance of 1.83 Å and 1.79 Å respectively. Another conventional hydrogen bond interaction was observed between the nitrogen of the naphthyridine ring and Val199 at a distance of 2.05 Å. In addition to the conventional hydrogen bonds, two pi-interactions were also observed. This includes a pi–cation interaction between electron rich diphenyl group and cationic side chain of Lys145 at distance of 5.69 Å and a pi–pi interaction observed between the electron deficient naphthyridine ring and Phe200 at 5.42 Å.
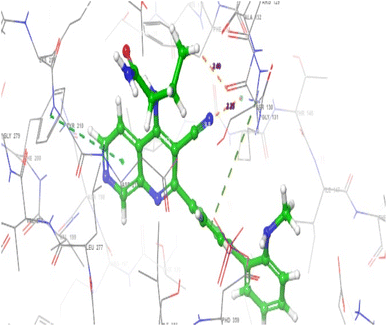
The interactions observed between PIP4K2A receptor and compound 25 were similar to the interactions observed in compound 15 as shown in Fig. 10. However, the conventional hydrogen bond was formed between the carbonyl group of amide moiety and Lys209 at a distance of 1.88 Å. Another hydrogen bond was also observed between Phd359 and the nitrogen of the secondary amine in 1,7-naphthyridine at a distance of 2.11 Å.
In addition to the pi–pi and pi-stacking interactions observed previously in compounds 15 and 25, a unique hydrogen bond interaction was observed between the cationic side chain of Lys209 and the carbonyl oxygen attached to the pyrrole ring substituent of compound 13 (Fig. 11) at a distance of 1.84 Å.
Compound 09 was also observed to have interacted with the receptor via pi–pi and pi–cation interactions as compound 15, 25 and 13. However, compound 09 also formed two conventional and one carbon hydrogen bond interactions with Gly131, Lys209 and Val199. One of the conventional hydrogen bond interaction was formed between the carbonyl group of compounds 09 with Gly131 amino acid residue at a distance of 2.45 Å. Lys209 formed a hydrogen bond interaction with the secondary amine attached to the carbonyl group of compound 09 at distance of 2.79 Å. Finally, a carbon hydrogen bond interaction was observed between Val199 amino acid residue and the nitrogen of the electron deficient naphthyridine ring. The non-covalent interactions observed between compound 09 and PIP4K2A protein residue are shown in Fig. 12.
The binding mode of compound 28 involved two conventional hydrogen bonds, single pi–pi interaction, and a pi–cation interaction. The nitrogen atoms of the amide group and that of the electron deficient naphthyridine ring formed a conventional hydrogen bond with Gly123 and Val199 at a distance of 1.65 Å and 2.01 Å respectively. Moreover, a pi–pi interaction was observed between Phe200 and the electron deficient naphthyridine ring at a distance of 5.37 Å and a pi–cation interaction between the electron rich phenyl group and side chain of Lys145 at a distance of 5.65 Å. The 3D interaction between compound 28 and PIP4K2A residue is shown in Fig. 13.
To further investigate the nature of the protein–ligand interactions, protein–ligand interaction fingerprints (PLIFs) diagram was generated for the ligands with the highest docking score as shown in Fig. 14. The barcodes in the y-axis corresponds to the ligands and the x-axis represents the amino acid residues for which the fingerprints were generated. Each barcode is a graphical representation of the protein–ligand interaction fingerprint of PIP4K2A inhibitor.
 | ||
| Fig. 14 Barcode representation of protein–ligand interaction fingerprint matrix of PIP4K2A inhibitors. | ||
The columns indicate amino acid residues that has at least one interaction with the ligands. Coloured cells indicate the interactions made by ligands with a corresponding intersecting amino acid residue. The histogram on the top of the diagram indicate the frequency of interaction made by a particular amino acid residue. It can be deduced from the diagram that Asn124, Ala128, and Phe178 have the least frequent interaction with the ligands. The amino acid residues that interact more frequently with the ligands include; Val199, Asn198, Asp151, Phe 134, Gly131 and Ala132. Compound 28 shows the least interaction with the amino acid residues of PIP4K2A as indicated by the number of white cells in the PLIFs diagram. This is followed by Compound 13 and 15. Interestingly, although compound 15 has the highest docking score (−11.187 kJ mol−1), it is among the compounds that show minimal interaction with amino acid residues. In contrast, the highest interaction was seen in compound 09 (−10.869 kJ mol−1) as indicated by the number of coloured cells in the PLIF diagram.
A plot of docking score against protein-contact to co-crystal ligand is shown in Fig. 15. The co-crystallized ligand (glide docking score = −10.771 kJ mol−1 and Tanimoto similarity = 1) was used as the reference compound (in red).
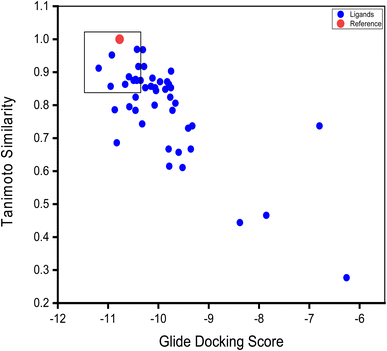 | ||
| Fig. 15 Relationship between protein–ligand contact similarity and docking scores of PIP4K2A inhibitors. | ||
Compounds with higher docking score and Tanimoto similarity index value closer to co-crystallized ligand were regarded as potential hit compounds. These compounds located upper right corner of the graph (Fig. 15) have similar binding pose with the reference compound. Although, some compounds might have favoured docking score values, their low Tanimoto similarity value indicates that their binding mode to the ligand is different from the reference compound.
4 Conclusion
Two machine learning algorithms (ANN and SVM) were used in tandem with MLR to perform QSAR investigation of 1,7-naphthyridine analogues as potent PIP4K2A inhibitors. The non-covalent binding interactions of the compounds was investigated using molecular docking analysis. The robustness and predicative capability of the QSAR models developed was ascertained using standard statistical validation parameters. The results of this investigation demonstrate that machine learning algorithms can be used with traditional QSAR approach to provide a unique insight into quantitative structure activity relations studies. The accurate predictive performances of MLAs were complemented by the highly interpretable but less accurate MLR algorithms. This allows for a robust understanding of the structure property relationships of 1,7-napthyridine analogues. In terms predictive performances, this study demonstrates that SVM model developed using RBF kernel function has the highest predictive capability followed by ANN and then MLR with QEX values of 0.8793, 0.7581, 0.7662 respectively. The molecular docking studies demonstrate that the 1,7-naphthyridine analogues formed various non-bonding interactions with PIP4K2A receptor protein. The compounds with highest inhibitory activity formed conventional hydrogen bonding, pi–pi and pi–cation interaction with various amino acid residues of PIP4K2A receptor. The methodology used in this research can serve as a template for insightful QSAR investigations by combining high predictive performance of MLAs and interpretability of traditional QSAR approach.Data availability
The datasets used for analysis during these studies were included as ESI file.†Conflicts of interest
The author(s) declared no potential conflicts of interest concerning the research, authorship, and/or publication of this article.Acknowledgements
The authors of this research did not receive any funding concerning this research.References
- S. Pilleron, E. Soto-Perez-de-Celis, J. Vignat, J. Ferlay, I. Soerjomataram, F. Bray and D. Sarfati, Int. J. Cancer, 2021, 148, 601–608 CrossRef CAS PubMed.
- A. N. Giaquinto, K. D. Miller, K. Y. Tossas, R. A. Winn, A. Jemal and R. L. Siegel, Cancer J. Clin., 2022, 72, 202–229 CrossRef PubMed.
- C. L. Rock, C. A. Thomson, K. R. Sullivan, C. L. Howe, L. H. Kushi, B. J. Caan, M. L. Neuhouser, E. V. Bandera, Y. Wang, K. Robien and K. M. Basen-Engquist, Cancer J. Clin., 2022, 72, 230–262 CrossRef PubMed.
- A. M. Hussain and R. K. Lafta, Oman Med. J., 2021, 36, 219 CrossRef PubMed.
- E. B. Yahya and A. M. Alqadhi, Life Sci., 2021, 269, 119087 CrossRef CAS PubMed.
- K. Hönigova, J. Navratil, B. Peltanova, H. H. Polanska, M. Raudenska and M. M. Biochimica Biophys, Acta, Rev. Cancer, 2022, 188705 Search PubMed.
- Y. Peng, C. Wang, W. Zhou, C. Mei and C. Zeng, Front. Oncol., 2022, 24, 819128 CrossRef PubMed.
- P. Kobialka, H. Sabata, O. Vilalta, L. Gouveia, A. Angulo-Urarte, L. Muixí, J. Zanoncello, O. Muñoz-Aznar, N. G. Olaciregui, L. Fanlo and A. Esteve-Codina, EMBO Mol. Med., 2022, 13, 15619 Search PubMed.
- C. Demarta-Gatsi, C. Donini, J. Duffy, C. Sadler, J. Stewart, J. A. Barber and B. Tornesi, Birth Defects Res., 2022, 13, 1–3 Search PubMed.
- A. Ghosh, A. Venugopal, D. Shinde, S. M. Sharma, M. Krishnan, S. Mathre and H. Krishnan, BioRxiv., 2022, 1–5 Search PubMed.
- J. Lu, W. Dong, G. R. Hammond and Y. Hong, BioRxiv, 2022, 7 CAS.
- A. Poli, S. Abdul-Hamid, A. E. Zaurito, F. Campagnoli, V. Bevilacqua, B. Sheth, R. Fiume, M. Pagani, S. Abrignani and N. Divecha, Proc. Natl. Acad. Sci. U. S. A., 2021, 118, 31 CrossRef PubMed.
- D. Wang, 2022, ecommons.cornell.edu.
- S. Sharma, S. Mathre, V. Ramya, D. Shinde and P. Raghu, Cell Rep., 2019, 27, 1979–1990 CrossRef CAS PubMed.
- P. Raghu, Curr. Opin. Cell Biol., 2021, 71, 15–20 CrossRef CAS PubMed.
- T. J. Yang, D. G. Wang, C. Pauli, R. M. Loughran, H. Kim, T. Zhang, D. Annamalai, B. M. Emerling, S. N. Powell, N. S. Gray and L. C. Cantley, Int. J. Radiat. Oncol., Biol., Phys., 2015, 93, 49–50 CrossRef.
- J. G. Jude, G. J. Spence, X. Huang, T. D. Somerville, D. R. Jones, N. Divecha and T. C. Somervaille, Oncogene, 2015, 34, 1253–1262 CrossRef CAS PubMed.
- Y. J. Shin, J. K. Sa, Y. Lee, D. Kim, N. Chang, H. J. Cho, M. Son, M. Y. Oh, K. Shin, J. K. Lee and J. Park, J. Exp. Med., 2019, 216, 1120–1134 CrossRef CAS PubMed.
- C. Hansch, A. Leo and R. W. Taft, Bull. Natl. Res. Cent., 1991, 91, 165–195 CAS.
- L. Wortmann, N. Bräuer, S. J. Holton, H. Irlbacher, J. Weiske, C. Lechner, R. Meier, J. Karén, C. B. Siöberg, V. Pütter and C. D. Christ, J. Med. Chem., 2021, 64, 15883–15911 CrossRef CAS PubMed.
- A. B. Umar, A. Uzairu, G. A. Shallangwa and S. Uba, SN Appl. Sci., 2020, 5, 1–8 Search PubMed.
- M. R. Keyvanpour and M. B. Shirzad, Curr. Drug Discovery Technol., 2021, 18, 17–30 CrossRef CAS PubMed.
- Y. Zhang and C. Ling, npj Comput. Mater., 2018, 4, 1–8 CrossRef.
- A. B. Umar, A. Uzairu, G. A. Shallangwa and S. Uba, Future J. Pharm. Sci., 2020, 6, 1 CrossRef.
- A. B. Umar, A. Uzairu, G. A. Shallangwa and S. Uba, Heliyon, 2020, 6, 1–12 CrossRef PubMed.
- Y. Isyaku, A. Uzairu, S. Uba, M. T. Ibrahim and A. B. Umar, Bull. Natl. Res. Cent., 2020, 44, 1–10 CrossRef.
- H. Liu, E. Papa and P. Gramatica, Chem. Res. Toxicol., 2006, 20, 1540–1548 Search PubMed.
- S. H. Abdullahi, A. Uzairu, M. T. Ibrahim and A. B. Umar, Bull. Natl. Res. Cent., 2021, 45, 1–22 Search PubMed.
- A. Tropsha, P. Gramatica and V. K. Gombar, QSAR & Comb. Sci., 2003, 22, 69–77 CrossRef CAS.
- S. H. Abdullahi, A. Uzairu, G. A. Shallangwa, S. Uba and A. B. Umar, Bull. Natl. Res. Cent., 2022, 46(1), 1–25 CrossRef.
- M. T. Ibrahim, A. Uzairu, G. A. Shallangwa, A. Ibrahim and J. King Saud Uni, Sci, 2020, 32, 423–432 Search PubMed.
- M. T. Ibrahim, A. Uzairu, G. A. Shallangwa and S. Uba, Heliyon, 2020, 1, 6 Search PubMed.
- M. T. Ibrahim, A. Uzairu, S. Uba and G. A. Shallangwa, Heliyon, 2022, 6, 2 Search PubMed.
- M. T. Ibrahim, A. Uzairu, G. A. Shallangwa and S. Uba, Beni-Suef Uni, J. Basic Appl. Sci., 2020, 9, 1 Search PubMed.
- M. T. Ibrahim, A. Uzairu, S. Uba and G. A. Shallangwa, Heliyon, 2020, 6, 03158 Search PubMed.
- T. T. Dai and Y. S. Dong, Adv. Elect. Mat, Comp., 2020, 24, 230–233 Search PubMed.
- G. C. Cawley and N. L. Talbot, J. Mach. Learn. Res., 2010, 11, 2079–2107 Search PubMed.
- C. Nantasenamat, A. Worachartcheewan, S. Jamsak, L. Preeyanon, W. Shoombuatong, S. Simeon, P. Mandi, C. Isarankura-Na-Ayudhya and V. Prachayasittikul, Art. Neul. Net., 2015, 119–147 CAS.
- S. J. Mohammed, H. A. Abdel-khalek and S. M. Hafez, Iran, J. Sci. Technol., 2022, 46, 3429–3451 Search PubMed.
- C. Nantasenamat, A. Worachartcheewan, P. Mandi, T. Monnor, C. Isarankura-Na-Ayudhya and V. Prachayasittikul, Chem. Pap., 2014, 68, 697–713 CAS.
Footnote |
| † Electronic supplementary information (ESI) available. See DOI: https://doi.org/10.1039/d2ra07382j |
| This journal is © The Royal Society of Chemistry 2023 |

