DOI:
10.1039/D2RA05754A
(Paper)
RSC Adv., 2023,
13, 3416-3424
Metal peroxides as potential photocatalysts for environmental remediation†
Received
12th September 2022
, Accepted 13th January 2023
First published on 24th January 2023
Abstract
Inorganic oxide materials such as TiO2 and ZnO have been extensively studied for environmental remediation, that operates through photo generated Reactive Oxygen Species (ROS) such as H2O2, ·OH and O2− to decontaminate waste water. However, inorganic solid oxidants such as metal peroxides capable of generating ROS in aqueous solutions have not been studied for environmental remediation. Towards this objective, we have synthesized peroxides of Zn, Mg, and Ba and characterized these by powder X-ray diffraction, Transmission Electron Microscopy, UV-visible spectroscopy, and X-ray photoelectron spectroscopy. The photocatalytic activity of these wide band gap semiconductors has also been investigated. The novelty of the work is in the use of these peroxides as chemical sources of ROS in aqueous suspensions in addition to their photochemical generation. Hence, these peroxides, in particular Ba, exhibit high photocatalytic activity, better than the well-known ZnO. The mechanisms of ROS generation and subsequent dye degradation are elucidated. ROS has been estimated and is correlated to the photocatalytic activity. This work reports for the first time BaO2 as potential photocatalyst.
1. Introduction
Since the breakthrough discovery of sunlight driven water splitting on the TiO2 surface by Fujishima and Honda in 1972, inorganic materials belonging to the class of semiconducting oxides have been extensively investigated as photocatalysts for environmental remediation.1–5 Oxides such as ZnO and TiO2 have been studied for dye degradation in wastewater treatment through an advanced oxidation process.6,7 It is an efficient process as this involves Reactive Oxygen Species (ROS) such as O2−, ·OH radical, H2O2. These ROS are powerful oxidizing agents that can oxidize dyes and other organic contaminants. ROS are produced at the surface of a semiconductor through the well-established photo excitation across its band gap.8–10 Among the various ROS, the most stable H2O2 can serve as the reservoir of active ROS. Under UV irradiation, H2O2 can undergo photolysis to form ·OH. In a photocatalytic process, H2O2 accepts electrons from the conduction band, facilitating charge separation and forms reactive hydroxyl radicals ·OH that are most powerful oxidizing agents.11,12
The addition of small amounts of H2O2 into the system is known to enhance the photocatalytic process.13,14 If H2O2 can be generated by the photocatalyst itself then, it would be advantageous. In this connection, inorganic solid oxidants such as metal peroxides are important as these could function as both semiconductor photocatalysts as well H2O2 sources. Accordingly, inorganic peroxides, MO2 (M = Zn, Mg, Ba) can chemically generate H2O2 in aqueous suspension as per the equation, in equilibrium.
| | |
MO2 + H2O ⇌ MO + H2O2
| (1) |
It is a surface reaction that generates H2O2 and MO in ppm levels. The released H2O2 under UV light generates ·OH radicals which are powerful oxidizing agents that can oxidize contaminants. Inorganic solid oxidants like CaO2, MgO2 and ZnO2 are useful in different fields15–17 including cancer treatment. There is only one study each on the peroxides of Mg & Zn for dye degradation.18,19 These deal with the photochemical generation of H2O2 and not on the chemical generation of H2O2 by these peroxides. In this work, we present our study on dye degradation [Rhodamine (RhB), Methylene Blue (MB)] by the peroxides of Zn, Mg and Ba under UV light and it proves that these are potential photocatalysts due to chemical and photochemical generation of ROS.
2. Experimental
2.1 Materials
For preparation of metal peroxides, the precursors such as Zn(CH3COO)2·2H2O (AR grade 99.99%), Mg(CH3COO)2·4H2O (AR grade 99.99%), Ba(CH3COO)2 (AR grade) and KOH are procured from SD Fine chemicals using without any further purification. Hydrogen peroxide (30% H2O2) obtained from Merck was used as a peroxide source and for photocatalytic studies, Rhodamine B and Methylene Blue were purchased from SRL Chemicals.
2.2 Synthesis of metal peroxides
Metal peroxides were synthesized via a simple precipitation method with the following procedure. 25 ml of 2 M KOH was added into 25 ml of 1 M metal acetate, M(CH3COO)2 (M = Zn, Mg, Ba) solution under stirring. Then, hydrogen peroxide (30% w/v) was added under stirring. Precipitates were formed, filtered and washed with ethanol and deionized water, and finally dried at 60 °C for 3 h.
2.3 ROS estimation
2.3.1 Estimation of H2O2. H2O2 generated was estimated by KMnO4 redox titrations. A known quantity of metal peroxide was suspended in 50 ml of water. Then, appropriate amounts of KMnO4 and H2SO4 were added. It was kept under constant stirring under ambient condition. At regular intervals, 5 ml aliquots were withdrawn, filtered through membrane filter. H2O2 was estimated by a standard back titration.
2.3.2 Estimation of ·OH radicals by pCBA. The amount of ·OH radicals released in the aqueous suspensions of metal peroxides under UV light was measured by degradation of p-chlorobenzoic acid (pCBA).20 To 50 ml of 10 ppm pCBA, 25 mg of metal peroxide was added. The suspension was irradiated under UV light and at regular intervals of 30 min, 1 ml of suspension was taken and centrifuged, the supernatant was examined by HPLC-UV for pCBA. Agilent 1100 series instrument (EVO C18 column) was employed, in an isocratic mode with solvent composition 40% water and 60% MeOH and flow rate of 0.5 ml min−1. The production of ·OH is directly proportional to degradation of pCBA and concentration of ·OH can be obtained by the following equation| | |
−d[pCBA]/dt = KOH pCBA[·OH]
| (2) |
where, KOH pCBA is the rate constant of pCBA and [·OH] is the steady state concentration of ·OH radicals.
2.3.3 Estimation of superoxide (O2−). Superoxide radicals generated in metal peroxide suspensions were estimated by Nitro Blue Tetrazolium (NBT).21 NBT absorbs maximum at 259 nm but on reaction with superoxide radicals, it is degraded to mono formazon and difarmazon. The release of superoxide radicals was followed by monitoring the degradation of NBT employing UV-Visible Spectroscopy.
2.4 Photocatalytic degradation of dye
20 mg of metal peroxides was suspended in the dye (50 ml, 10 ppm) and stirred for 30 min in dark to achieve adsorption and desorption equilibrium. 2 ml of aliquots from suspension were drawn at regular intervals, centrifuged at 4000 rpm. Rhodamine B degradation was followed by UV-visible spectroscopy through monitoring the absorption maximum of the dye with time. Photocatalysis was carried out under UV irradiation using Hg lamp (17 mW cm−2) as UV source. Dye solution without catalyst was used as control to negate the effect of light on dye. The degradation rate is calculated using the formula,| | |
% degradation = (C0 − C)/C0 × 100
| (3) |
where C0, Ct is the concentration at t0 & at time ‘t’ respectively.
2.5 TOC (total organic content)
To study the extent of mineralization, TOC of RhB (10 ppm) before and after UV irradiation were analyzed using Aurora TOC analyzer (O.I analytics) through converting carbon (from sample) via acidification and oxidation to CO2, the TOC was measured using an infra-red detector.
2.6 Characterization
Phase formation was analyzed by Bruker D8 Advance powder X-Ray Diffractometer (Bruker AXS GmbH, Karlsruhe, Germany) with CuKα source. The crystallite size was calculated using Scherrer formula. Transmission Electron Microscopy (FEI-Tecnai G2 20 S-TWIN) was used for studying morphology and particle size. UV-Visible Diffuse Reflectance spectra were measured using Jasco V 570 UV-Vis spectrophotometer. X-Ray photoelectron spectra were recorded using K-Alpha instrument (XPS K-Alpha surface analysis, Thermo fisher scientific, UK).
3. Results and discussion
3.1 Material characterization
XRD patterns (Fig. 1) confirm that the products of ZnO2, MgO2 and BaO2 are single phasic, nano crystalline (BaO2 contains BaCO3 impurity, around 5%) by referring to the JCPDS database. ZnO2 (JCPDS: 00-013-0311) and MgO2 (JCPDS: 01-076-1363) have cubic structure with lattice parameters 4.785 Å and 4.820 Å respectively. BaO2 (JCPDS: 00-007-0233) crystallizes in tetragonal system with a = 3.810 Å and c = 6.840 Å. Average crystallite sizes as calculated by Scherrer formula for ZnO2, MgO2 and BaO2 are 5 nm, 2 nm and 30 nm respectively.
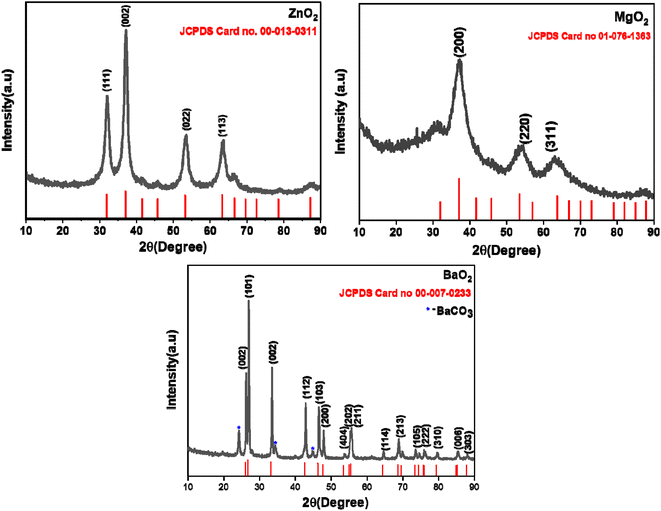 |
| | Fig. 1 Powder X-ray diffraction patterns of ZnO2, MgO2 and BaO2. | |
TEM images (Fig. 2) confirm that the particles of ZnO2 and MgO2 are mostly spherical with sizes in the range of 3–5 nm. BaO2 shows flower like morphology. The optical band gap is measured from absorption spectrum using Tauc plot (Fig. 3) obtained from UV-Vis-DRS data
where,
hν is the discrete photon energy,
α denotes absorption coefficient,
A is constant,
Eg is the band gap and exponent
n depends on type of transition. The measured band gaps of ZnO
2, MgO
2 and BaO
2 are 3.6, 4.41 and 3.72 eV respectively (
Fig. 3).
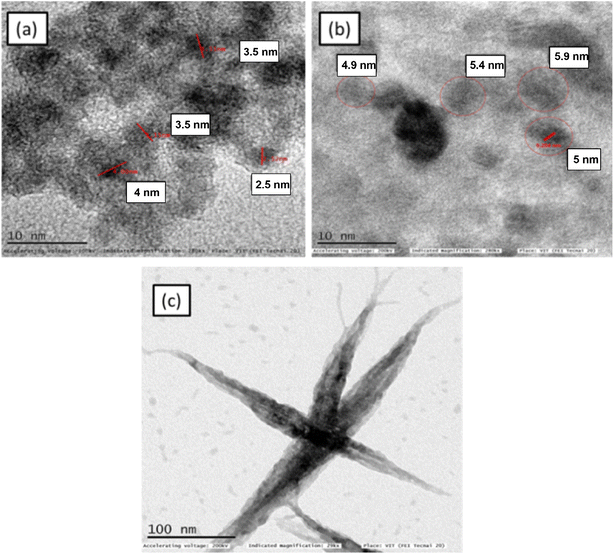 |
| | Fig. 2 TEM images of (a) ZnO2 (b) MgO2 (c) BaO2. | |
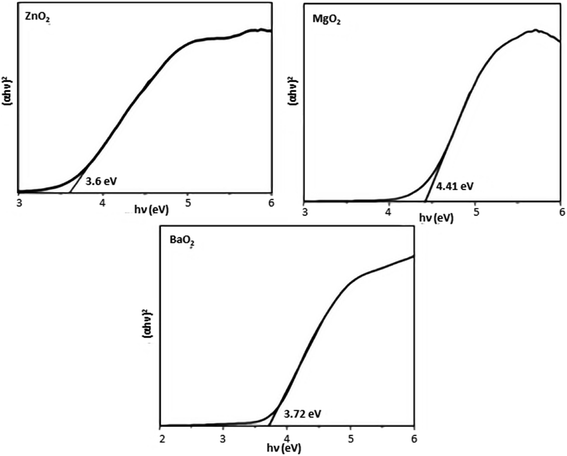 |
| | Fig. 3 Tauc's plots of metal peroxides. | |
To ascertain esp the presence of peroxide species, we have recorded XPS spectra. Fig. 4a–f shows XPS of synthesized metal peroxides. XPS spectra (a) of Zn shows a peak at 1021 eV (2p3/2) and 1044 eV (2p1/2) confirming valence of Zn in 2+. O 1s spectra (b) of ZnO2 exhibits three peaks, the peak at higher binding energy 532.5 eV corresponds to O22− species and 531.2 eV corresponds to hydroxyl species which are associated with oxygen vacancy.22 Peak at lower binding energy 528.4 eV corresponds to loosely bound oxygen species.23,24 The binding energy of Mg (c) 1s is 1034 eV confirming Mg2+ state in MgO2. O 1s (d) of MgO2 shows a peak at 532.5 eV confirming peroxides species. The high-resolution Ba 3d (e) spectra, which comprise two dominant peaks 779.5 eV and 794.9 eV correspond to the binding energy of Ba 3d5/2 and Ba 3d3/2, respectively. The energy states of Ba, 3d5/2 and 3d3/2 confirm the presence of barium in its bivalent state (Ba2+). The XPS data for the O 1s state in BaO2 reveals a peak at 532.7 eV O 1s confirming the peroxide group.
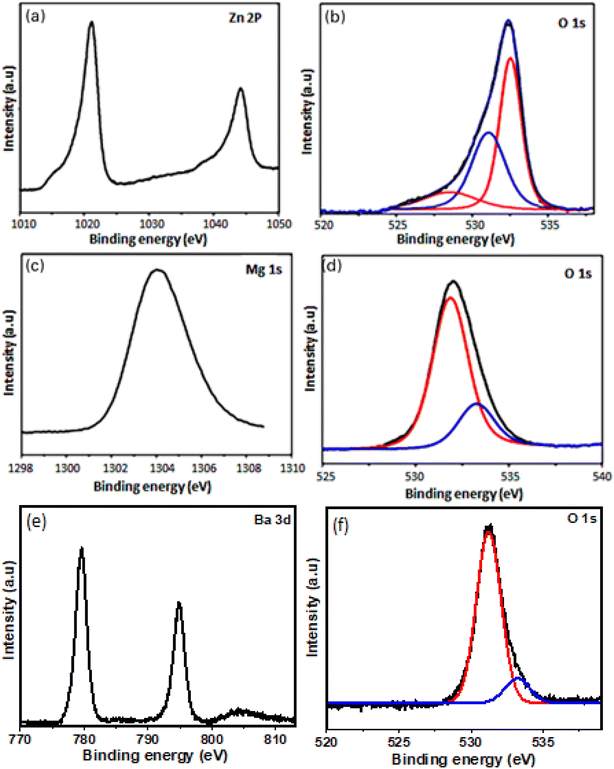 |
| | Fig. 4 X-ray photoelectron spectra of (a) Zn 2p (b) O 1s of ZnO2 (c) Mg 2p (d) O 1s of MgO2 (e) Ba 3d (f) O 1s of BaO2. | |
3.2 Estimation of ROS from metal peroxides
It is important to estimate the ROS released to understand the photocatalytic activity. Fig. 5a shows H2O2 release with time in aqueous suspensions. BaO2 produces relatively higher concentrations of H2O2 (35 ppm) followed by MgO2 and ZnO2. The concentration of ·OH radicals produced by metal peroxides under UV light were analyzed by pCBA degradation. Table S1† shows % degradation of pCBA by metal peroxides with time under UV light. Fig. 5b shows the release of ·OH radicals from aqueous suspensions under UV light and its concentration increases with time. BaO2 releases the highest amount of ·OH radicals. These peroxides release H2O2 in aqueous suspension in ppm levels and is a surface reaction as depicted in eqn (1).
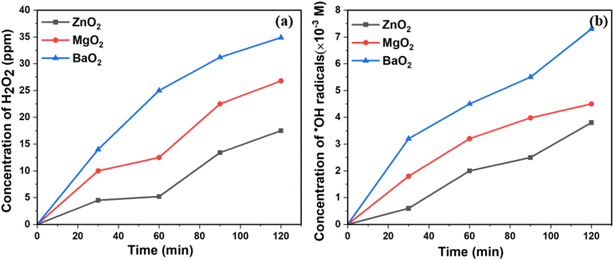 |
| | Fig. 5 (a) H2O2 produced (b) ·OH radicals produced by metal peroxides under UV light. | |
H2O2 formed in ppm level [saturation level] is sufficient to degrade dyes present in ppm levels in the waste water. More importantly, the products formed MO (ref. 25–27) in ppm levels are also UV active photocatalysts. It is to be noted that H2O2 formed undergoes photochemical reactions with UV light generating ·OH radicals. The photocatalytic activity is correlated to the amount of ROS released during the process. The higher the amount, the higher is the activity.
To ascertain the presence of O2−, NBT degradation study is carried out. Fig. 6 shows kinetics of degradation of NBT by metal peroxides under UV irradiation. Significant degradation of NBT with time is observed indicating the release of O2−.
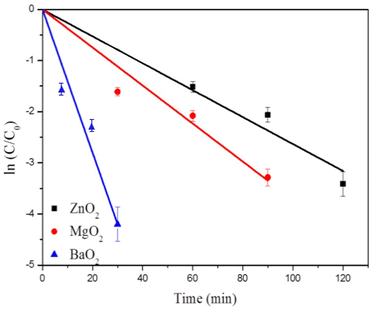 |
| | Fig. 6 Degradation of NBT. | |
3.3 Photocatalytic degradation of dyes under UV irradiation
Rhodamine B dye degradation is illustrated under UV irradiation to demonstrate the photocatalytic activity. Fig. 7 shows degradation of RhB (20 ppm) as followed by the absorption maximum at 554 nm with time. It confirms the degradation of RhB as indicated by the decrease of intensities of absorption maximum with time. Table 1 lists the % degradation and time duration along with rates of degradation. All the three catalysts degrade more than 95% within 120 minutes. Most of the dye is degraded within the first 30 minutes over the surfaces of the catalysts. BaO2 exhibits highest photocatalytic activity close to 100% degradation within 30 min, followed by MgO2 and ZnO2. The kinetics of dye degradation is shown in Fig. 8 and it follows first order kinetics in agreement with Langmuir–Hinshelwood mechanism. Accordingly, a plot of ln(C/C0) versus time is a straight line and the slope is equal to the rate constant, C concentration at time t, whereas C0 is the initial concentration. BaO2 shows the highest rate of degradation 13.4 × 10⁻² min−1 (Fig. 8).
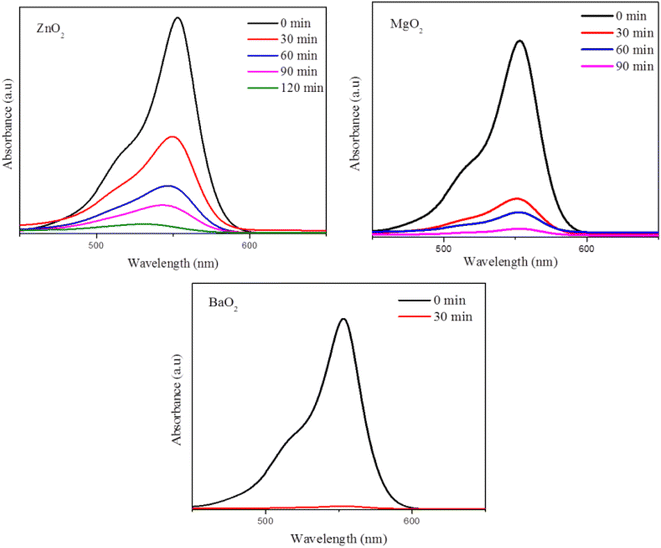 |
| | Fig. 7 Dye (RhB) degradation with time as followed by UV-visible spectroscopy. | |
Table 1 % Of degradation and rate of degradation of dyes by metal peroxides under UV irradiation
| Composition |
Dye (10 ppm) |
% Degradation/min |
Rate of degradation (min−1) × 10−2 |
| ZnO2 |
RhB |
95.5/120 |
2.6 |
| MgO2 |
RhB |
96/90 |
3.7 |
| BaO2 |
RhB |
98.8/30 |
14 |
| ZnO2 |
MB |
99/120 |
3 |
| MgO2 |
MB |
99/60 |
4.7 |
| BaO2 |
MB |
99/30 |
13.4 |
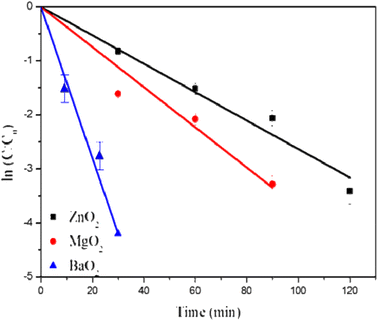 |
| | Fig. 8 Rates of degradation of RhB by metal peroxides under UV light. | |
ZnO2, MgO2 and BaO2 have been studied against MB too and Table 1 depicts the results (Fig. S1†). Ba peroxide shows maximum activity with highest rate of degradation. It can be attributed to the highest amount of H2O2 released from BaO2 and hence more amount of ROS. FT-IR data of the ZnO2 before and after the reaction confirm that no dye adsorption occurs in the photocatalytic process (Fig. S2†).
These peroxides having band gaps in the range 3.6 to 4.4 eV are expected to be active in narrow range of the solar spectrum but interestingly these generate H2O2 in aqueous suspensions which on excitation with UV light can produce most reactive ·OH radicals. It can degrade the dyes or organic contaminants as per mechanisms below. Due to the chemical generation of H2O2, all the three peroxides exhibit significant dye degradation under UV light.
3.4 Mechanism of dye degradation under UV light
Metal peroxides when suspended in water release H2O2 as shown in eqn (1). Harbour et al. observed that H2O2 under UV light produces ·OH and ·HO2 confirmed through Electron Paramagnetic Resonance (EPR) spectroscopy using spin trap experiments.28 H2O2 released undergoes hemolytic fission to form ROS under UV light as shown below29
Mechanism I
| | |
H2O2 + UV → 2·OH, E0 = +0.51 V
| (5) |
| | |
·OH + H2O2 → H2O + ·HO2
| (6) |
| | |
·HO2 + H2O2·→ ·OH + H2O + O2, E0 = +0.64 V
| (7) |
| | |
2·HO2 → H2O2 + O2, E0 = +1.07 V
| (8) |
H2O2 released chemically is expected to promote the photocatalytic activity through eqn (5)–(8) under UV light. The redox potential of UV photolysis of H2O2 is +0.51 V which is less than valence band energy level (EVB) of the synthesized metal peroxides (Fig. S3†) suggesting that this reaction is thermodynamically favorable. The redox potential of production of ·OH and H2O2 from ·HO2 are +0.64 and +1.07 V respectively and these are lower than EVB of synthesized metal peroxides. Hence, these reactions are also thermodynamically favorable by synthesized metal peroxides.30 In addition to photolysis of H2O2, ROS will be released through the absorption of UV light by wide band gap semiconductors (MgO2, BaO2 and ZnO2) resulting electron–hole pairs causing redox reaction as shown in eqn (9)–(14).
Mechanism II
| | |
MO2 + hν → e− (CB) + e− (VB), hν ≤ band gap
| (9) |
| | |
H2O + h+ → ·OH + H+, E0 = +1.97 V
| (10) |
| | |
O2 + e− → ·O2−, E0 = −0.16 V
| (11) |
| | |
·O2− + 2H+ + e− → H2O2, E0 = 0.89 V
| (12) |
| | |
H2O2 + H+ + e− → ·OH + H2O, E0 = 0.38 V
| (13) |
| | |
H2O2 + O2− → OH− + ·OH + O2
| (14) |
The production of ROS by metal peroxides under UV irradiation could be correlated to the electronic structure of metal peroxides and redox potentials of ROS generation reactions.31 Fig. S3 and Table S2† show the EVB, conduction band energy level ECB of metal peroxides. EH for ·OH production by oxidation of water is 1.97 V (ref. 32) which is equal and less than EVB of metal peroxides suggesting that h+ of synthesized metal peroxides can oxidize water to produce OH· radical. Reducing power of photo excited e− contribute for the production of ·O2−. ECB of synthesized metal peroxides as shown in Table S2† proves that synthesized metal peroxides can donate e− to O2 to form ·O2−.32 Valence band XPS and DRS suggest that these metal peroxides in aqueous suspensions could generate large amounts of ROS and hence could function as better photocatalysts comparing other wide band gap semiconductors (TiO2, ZnO)33,34 esp. in terms of rates of degradation. Mechanism I is expected to be more dominant than mechanism II in these catalysts.
In order to understand degradation of the dye by the catalysts, TOC (Total Organic Content) of reaction mixture drawn at different intervals was analyzed. However, in the case of metal peroxides (ZnO2, MgO2 & BaO2), residual TOC removal percentages 70%, 30% and 28% respectively are observed after 2 h irradiation. Fig. 9 reveals an exponential decrease. BaO2 shows the highest TOC removal.
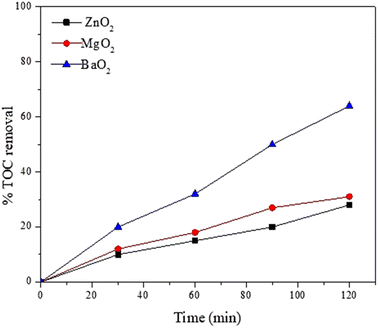 |
| | Fig. 9 TOC removal. | |
3.5 Reusability of metal peroxides for dye degradation
To understand the stability and reusability of metal peroxides for dye degradation under UV light, catalyst after dye degradation was centrifuged, washed with water and dried in oven at 60 °C and the dried powder was used for degradation of dye. This cycle is repeated 3 times and at the end of 3rd cycle, XRD of the products after reaction was recorded. Fig. 10 shows that the metal peroxides are stable and reuseable. Fig. S4† shows % degradation of RhB (10 ppm) for 3 cycles by synthesized metal peroxides.
 |
| | Fig. 10 XRD patterns of metal peroxides after 3 cycles of photocatalytic degradation of dyes under UV light. | |
4. Conclusion
Metal peroxides of Zn, Mg have been synthesized and characterized. These peroxides have been proven to be efficient UV photocatalysts with activity in the sequence BaO2 > MgO2 > ZnO2. BaO2 could degrade the dye close to 100% within 30 minutes with high rate of degradation. These peroxides are the first examples of wide band gap semiconductors that perform dual roles of a photocatalyst and chemical source of H2O2 with remarkable stability.
Author contributions
Conceptualization, V. R.; data curation, D. H.; validation V. L. P and D. H.; methodology, V. L. P. and D. H.; roles/writing – original draft, V. L. P and D. H.; writing – review & editing, D. A. and V. R.; project administration, V. R and D. A. All authors have read and agreed to the published version of the manuscript.
Conflicts of interest
There are no conflicts to declare.
Acknowledgements
Authors thank DST-SERB (Grant No. EMR 2016/007152) for financial support and VIT, Vellore for encouragement. Authors thank the VIT Seed Grant 2021-22 for support.
References
- Y. Ohko, K. I. Iuchi, C. Niwa, T. Tatsuma, T. Nakashima, T. Iguchi, Y. Kubota and A. Fujishima, Environ. Sci. Technol., 2002, 36, 4175–4181 CrossRef CAS PubMed.
- M.-J. Fang, C.-W. Tsao and Y.-J. Hsu, J. Phys. D: Appl. Phys., 2020, 53, 143001 CrossRef CAS.
- C.-W. Tsao, M.-J. Fang and Y.-J. Hsu, Coord. Chem. Rev., 2021, 438, 213876 CrossRef CAS.
- M. Miyauchi, K. Sunada and K. Hashimoto, Catalysts, 2020, 10, 1093 CrossRef CAS.
- S. Zhang, B. Bai, J. Liu and J. Zhang, Catalysts, 2021, 11, 1168 CrossRef CAS.
- Z. Li, S. Wang, J. Wu and W. Zhou, Renewable Sustainable Energy Rev., 2022, 156, 111980 CrossRef.
- F. M. Sanakousar, C. Vidyasagar, V. M. Jiménez-Pérez and K. Prakash, Mater. Sci. Semicond. Process., 2022, 140, 106390 CrossRef CAS.
- Y. Lin, C. Yang, S. Wu, X. Li, Y. Chen and W. L. Yang, Adv. Funct. Mater., 2020, 30, 1–13 Search PubMed.
- Y. Lin, S. Wu, X. Li, X. Wu, C. Yang, G. Zeng, Y. Peng, Q. Zhou and L. Lu, Appl. Catal., B, 2018, 227, 557–570 CrossRef CAS.
- Y. Lin, X. Wu, Y. Han, C. Yang, Y. Ma, C. Du, Q. Teng, H. Liu and Y. Zhong, Appl. Catal., B, 2019, 258, 117969 CrossRef CAS.
- F. Tian, R. Zhu, K. Song, F. Ouyang and G. Cao, Environ. Eng. Sci., 2016, 33, 185–192 CrossRef CAS.
- K. Sahel, L. Elsellami, I. Mirali, F. Dappozze, M. Bouhent and C. Guillard, Appl. Catal., B, 2016, 188, 106–112 CrossRef CAS.
- D. H. Tseng, L. C. Juang and H. H. Huang, Int. J. Photoenergy, 2012, 328526 Search PubMed.
- R. Rahmati, B. Nayebi and B. Ayati, Water Sci. Technol., 2021, 83, 2414–2423 CrossRef CAS PubMed.
- J. He, L. H. Fu, C. Qi, J. Lin and P. Huang, Bioact. Mater., 2021, 6, 2698–2710 CrossRef CAS PubMed.
- H. Wang, Y. Zhao, T. Li, Z. Chen, Y. Wang and C. Qin, Chem. Eng. J., 2016, 303, 450–457 CrossRef CAS.
- A. Rastinfard, B. Dalisson and J. Barralet, Acta Biomater., 2022, 145, 390–402 CrossRef CAS PubMed.
- A. gamal El-Shamy, Mater. Chem. Phys., 2020, 243, 122640 CrossRef.
- D. Yang, M. A. Gondal, Z. H. Yamani, U. Baig, X. Qiao, G. Liu, Q. Xu, D. Xiang, J. Mao and K. Shen, Mater. Sci. Semicond. Process., 2017, 57, 124–131 CrossRef CAS.
- M. Cho, H. Chung, W. Choi and J. Yoon, Water Res., 2004, 38, 1069–1077 CrossRef CAS PubMed.
- H. Goto, Y. Hanada, T. Ohno and M. Matsumura, J. Catal., 2004, 225, 223–229 CrossRef CAS.
- X. Xu, D. Chen, Z. Yi, M. Jiang, L. Wang, Z. Zhou, X. Fan, Y. Wang and D. Hui, Langmuir, 2013, 29, 5573–5580 CrossRef CAS PubMed.
- S. Verma and S. L. Jain, Inorg. Chem. Front., 2014, 1, 534–539 RSC.
- H. Y. Lee, B. K. Wu and M. Y. Chern, Electron. Mater. Lett., 2014, 10, 51–55 CrossRef CAS.
- C. B. Ong, L. Y. Ng and A. W. Mohammad, Renewable Sustainable Energy Rev., 2018, 81, 536–551 CrossRef CAS.
- M. I. Jahanger, N. A. Shad, M. M. Sajid, K. Akhtar, Y. Javed, A. Ullah, M. A. Hassan, M. H. Sarwar, M. Sarwar and M. Sillanpää, React. Kinet., Mech. Catal., 2022, 135, 499–510 CrossRef CAS.
- R. enukadevi, R. Sundaram and K. Kaviyarasu, J. Nanostruct., 2020, 10, 167–176 Search PubMed.
- J. R. Harbour, V. Chow and J. R. Bolton, Can. J. Chem., 1974, 52, 3549–3553 CrossRef CAS.
- M. A. Oturan and J. J. Aaron, Crit. Rev. Environ. Sci. Technol., 2014, 44, 2577–2641 CrossRef CAS.
- P. Cofre and D. T. Sawyer, Inorg. Chem., 1986, 25, 2089–2092 CrossRef CAS.
- Y. Li, W. Zhang, J. Niu and Y. Chen, ACS Nano, 2012, 6, 5164–5173 CrossRef CAS PubMed.
- I. Velo-Gala, A. Torres-Pinto, C. G. Silva, B. Ohtani, A. M. T. Silva and J. L. Faria, Catal. Sci. Technol., 2021, 11, 7712–7726 RSC.
- Y. F. Li, D. Xu, J. Il Oh, W. Shen, X. Li and Y. Yu, ACS Catal., 2012, 2, 391–398 CrossRef CAS.
- Q. I. Rahman, M. Ahmad, S. K. Misra and M. Lohani, Mater. Lett., 2013, 91, 170–174 CrossRef CAS.
|
| This journal is © The Royal Society of Chemistry 2023 |
Click here to see how this site uses Cookies. View our privacy policy here.  Open Access Article
 a,
Dhakshnamoorthi Harikaran‡
 b,
Dror Avisar
 a and
Vijayaraghavan. R.
 *b
*b


