
 Open Access Article
 This Open Access Article is licensed under a Creative Commons Attribution-Non Commercial 3.0 Unported Licence
A molecular dynamics study on adsorption mechanisms of polar, cationic, and anionic polymers on montmorillonite†
Yuanzhi Qu‡
a,
Ling Lin‡ b,
Shifeng Gaoa,
Yukun Yangb,
Hongjun Huanga,
Xin Lib,
Han Rena and
Wenjia Luo*b
b,
Shifeng Gaoa,
Yukun Yangb,
Hongjun Huanga,
Xin Lib,
Han Rena and
Wenjia Luo*b
aCNPC Engineering Technology R&D Company Limited, Beijing, 102206, P. R. China
bSchool of Chemistry and Chemical Engineering, Southwest Petroleum University, Chengdu, 610500, P. R. China. E-mail: luowenjia@swpu.edu.cn
First published on 11th January 2023
Abstract
Adsorption of polymers on clay in aqueous solutions has wide applications in environmental, medical, and energy-related areas, but the interactions between polymers and clay under varied conditions are still not fully understood. In this study, we investigated the adsorption mechanisms of four polymers belonging to different categories, namely anionic poly(acrylic acid) (poly-AA), cationic poly(diallyldimethylammonium chloride) (poly-DADMAC), nonionic polyacrylamide (poly-AM), and the copolymer of AA and DADMAC (poly-AADADMAC). By using molecular dynamics simulations, we compared the desorption kinetics of these polymers at different temperatures and found that poly-AA and poly-AM have the weakest and strongest adsorption abilities, respectively. Polymer adsorptions are slightly more stable at higher pressures, and high salinity favors the adsorption of charged polymers. Further analysis suggests that the adsorption of anionic poly-AA is less stable than that of cationic poly-DADMAC because the latter is attracted to the negatively charged surface by direct coulombic forces, and poly-AM is stabilized by van der Waals forces and hydrogen bonds. This study provides insights on how to enhance the adsorption affinity of polymers on a clay surface and may help the design or improvement of polymer/clay nanocomposite materials.
1 Introduction
Polymer-clay nanocomposite (PCNC) materials are widely used in multiple areas, for example as adsorbents of pollutants in wastewater treatment1–4 or as drug delivery systems in medical applications.5,6 PCNC materials have particularly important applications in oil and gas drilling operations, where they are often used as multipurpose additives of drilling fluids. The roles of PCNCs include but are not limited to improving rheological properties of drilling fluid,7,8 preventing fluid loss,9,10 elevating carrying capacity, inhibiting the hydration and swelling of shale,11–14 and conducting heat.10PCNC materials are prepared by combining polymers with clay minerals. Currently, there are two major approaches to preparing PCNC materials, which are chemical grafting and physical adsorption.15 In the former approach, clay surfaces are modified chemically and the polymers are linked to the clay surface via covalent bonds.16–19 On the other hand, polymers can also be physically adsorbed on clay via van der Waal, electrostatic, and hydrogen-bonding interactions.20–23 Our aim in this study is to investigate the general principles behind polymer/clay interactions, but the strength of chemisorption depends on the number and distributions of chemical bonds, which are determined by the specific preparation method and cannot be discussed unless the details of preparation method are provided. Therefore, we focus only on physical adsorption in this paper.
Understanding the interaction between polymer and clay is the key to improving the design and application of novel PCNC materials that can have satisfactory performance under certain working conditions. For example, additives of drilling fluids must withstand high temperatures (>400 K), high pressures (>100 MPa), and high salinity conditions (up to saturation) in deep wellbores.24–26 Polymer adsorption on clay minerals can be investigated by various experimental techniques, including Fourier transform infrared spectroscopy (FTIR), X-ray diffraction (XRD), atomic force microscopy (AFM), ζ potential, particle size distribution, to measure adsorption amount, adsorption site, polymer conformation, mechanical strength, clay basal spacing, and many other quantities.27–29 Such results can be analyzed to provide insights into the adsorption mechanisms. For example, Nakatani et al. studied the effect of polymer conformation,30 Kohay et al. investigated the influence of polycation density,31 Sengwa et al. compared polymers with different structures,32 and Kádár et al. focused on clay surface characteristics.27
Although experimental techniques are versatile, quantizable, and indispensable in the research of PCNC materials, it is usually challenging to experimentally investigate the microscopic adsorption mechanisms at the molecular level. Instead, molecular dynamics (MD) and related computational methods can be used to simulate the adsorption process of polymers and predict the properties of PCNC materials. Reviews by Pereira et al.,33 Suter et al.,34 Cygan et al.,35 and Teppen et al.36 summarized early attempts to study clay materials by MD and numerical simulations. Camara et al.,37 Greathouse et al.,38 Shahriyari et al.,39 and Yang et al.40 simulated the adsorption of salts on clay, while many other researchers focused on the adsorption of organic or inorganic small molecules on clay.41–45 Wang et al.46 studied the wettability of silica, and Yu et al.47 investigated the phase equilibrium of n-pentane in quartz pores. The formation mechanisms of CO2 hydrate48,49 or CH4 hydrate50,51 in pores of various types of clay minerals were examined using molecular simulation methods, and the effect of cations was discussed.51
The adsorption of various kinds of polymers on clay have been investigated, which include but are not limited to bitumen,52 poly(butylene 2,5-furan-dicarboxylate),53 poly(lactic-co-glycolic acid),54 chitin and chitosan,55 xyloglucans,56,57 poly(ethylene glycol),58,59 poly(ε-caprolactone),60,61 and poly(ethylene oxide).62 While most researchers chose montmorillonite (MMT) to represent clay, some other studies considered other types of clay including quartz,63 kaolinite,64 and silica.65
In many studies, the authors focused on predicting the mechanical,66–68 rheological,69,70 or thermodynamical properties71,72 of the PCNC materials. On the other hand, many other researchers investigated the adsorption mechanisms of polymers and provided insights on how to enhance the adsorption. For example, Sun et al. demonstrated that divalent Ca2+ ions can enhance the adsorption of anionic polymers,73 and cationic chitosan can enhance the adsorption of neutral poly(acrylamide).74 Quezada showed that the adsorption strength of hydrolyzed polyacrylamide is proportional to salinity but inversely proportional to surface charge concentration.63 Jamil et al. suggested that ionic clouds formed on the basal plane of clay can enhance the adsorption of polymers.75 Haouti et al. compared the adsorption strengths of two cationic molecules on clay.76 Experimental studies on the effects of temperatures, pressures, and salinity on polymer adsorption are widely available. For example, Mpofu et al. showed that temperatures up to 90 °C and salt concentrations up to 0.01 M have limited effect on polyetheramine adsorption on MMT.77 Tekin et al. investigated the adsorption of cationic polyacrylamide onto sepiolite under temperatures up to 55 °C.78 However, to the best of our knowledge, few molecular dynamics studies have been reported on comparing the adsorption mechanisms of different types of polymers on clay, especially the desorption under high temperatures.
In this study, we aim to compare the adsorption mechanisms of different types of polymers on MMT. Poly(acrylic acid) (poly-AA), poly(diallyldimethylammonium chloride) (poly-DADMAC), and polyacrylamide (poly-AM). We chose these polymers both because they are widely used in drilling fluids and also because each of them represents a different category of polymers. Specifically, poly-AA, poly-DADMAC, and poly-AM represent anionic, cation, and nonionic polymers. In addition, the copolymer of acrylic acid and diallyldimethylammonium chloride (poly-AADADMAC) was selected to represent polymers that possess both positive and negative charges. In Section 2 we describe how the molecular system was constructed and the forcefield used in this study. In Section 3 we compare the desorption kinetics of these polymers under different temperatures and investigate the conditions that can affect the adsorption stability such as salinity and pressure. Finally, we provide insights on how to enhance the adsorption affinity based on the simulation results.
2 Methods
2.1 The molecular model
We chose a classical Na-montmorillonite (Na-MMT) model (Na3(Si31Al)(Al14Mg2)O80(OH)16·nH2O) to represent the typical composition of a sodium smectite clay.79,80 In this model, one Al3+ and two Mg2+ ions replace one octahedral Si4+ and two octahedral Al3+ ions, leaving the MMT layer carrying three negative charges. The size of this model is 1.036 nm × 1.796 nm in the x and y directions. To simulate the adsorption of polymers on a large clay surface, we created a 10 × 5 supercell, which is 10.36 nm × 8.98 nm wide, to represent one MMT layer.Our computational model is shown in Fig. 1. In this model, two identical MMT plates were placed in the xy-plane and separated by around 6.0 nm, and the lower plate was designated to be the adsorption site for polymers. This 6.0 nm layer-to-layer distance corresponds to an inter-layer spacing of around 6.6 nm. Although experimentally measured basal spacing of MMT intercalated by polymers is usually less than 5 nm,17 we found that this 5 nm spacing is too narrow to simulate the complete desorption of polymers into the solution; the polymer must be at least 3.0 nm away from both plates. On the other hand, using an even larger spacing would dramatically increase the demand on computational resources and is unnecessary.
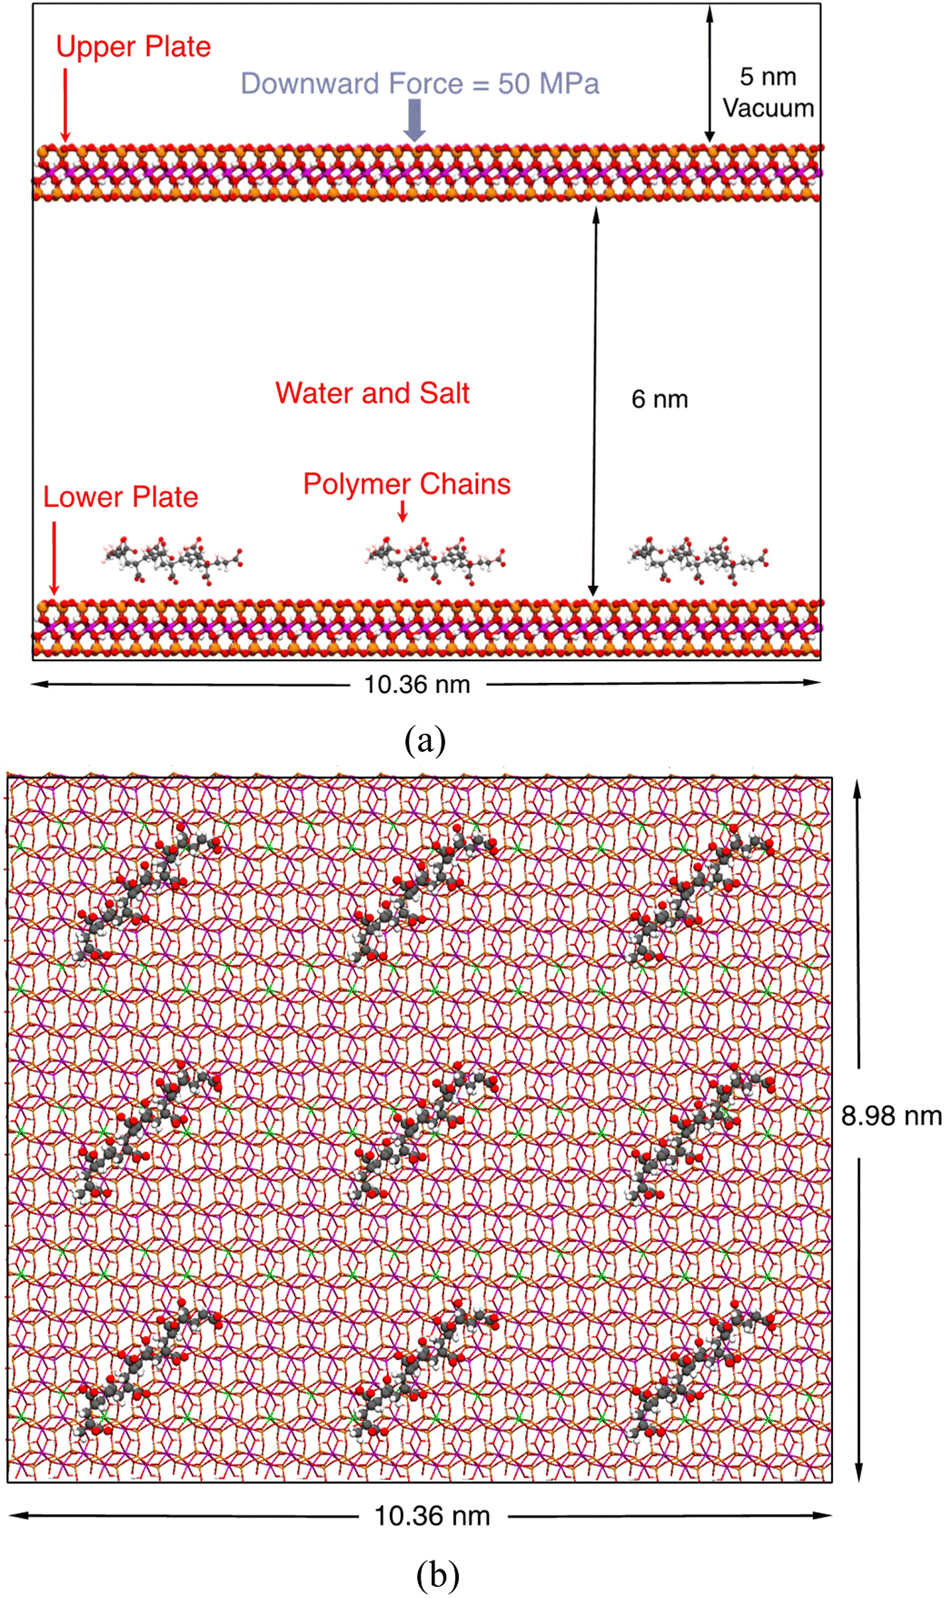 | ||
| Fig. 1 Front (a) and top (b) views of the molecular model in this study. The black boxes outline the boundaries of a periodic unit cell. Red, orange, magenta, green, white, and gray spheres represent O, Si, Al, Mg, H, and C atoms, respectively. This figure shows, as an example, poly-AA chains adsorbed on the MMT surface. The space between the upper and lower plates is filled with water and salt, which are not shown in this figure for clarity. The upper plate is also hidden in the top view to make the polymers visible. | ||
As stated in the Introduction section, we considered four types of polymers, poly-AA, poly-DADMAC, poly-AADADMAC, and poly-AM, in this study. At the start of each simulation, nine identical polymer chains were placed above the lower plate in a 3-by-3 fashion as shown in Fig. 1. By adjusting the number of repeating units, chains of different polymers have similar lengths of around 2 nm. Parameters of polymer chains including the numbers of atoms and molecular weights are summarized in Table 1. The structures of these four polymer chains are further illustrated in Fig. S1.†
| Polymer | Repeating unitsa | Number of atomsb | Molecular weight | Charge |
|---|---|---|---|---|
| a All chains are isotactic.b Excluding counter ions for poly-AA and poly-DADMAC.c Poly-AADADMAC is an alternating copolymer consisting of five AA and five DADMAC units. Each AA and DADMAC unit carry a negative and positive charge, respectively. | ||||
| Poly-AA | 10 | 82 | 712.57 | −10.0 |
| Poly-DADMAC | 6 | 152 | 759.35 | 6.0 |
| Poly-AADADMACc | 10 | 167 | 988.41 | 0.0 |
| Poly-AM | 10 | 102 | 712.81 | 0.0 |
Counter ions, K+ or Cl−, were added to the system where the anionic poly-AA or the cationic poly-DADMAC are present to always keep the system charge-neutral. The space between the upper and lower plates was filled with water and salt (10 wt% KCl, unless otherwise stated), where the percent by weight (wt%) means the mass of salt divided by the mass of the salt solution (excluding polymer and clay). And the 10 wt% KCl concentration is equivalent to a mole fraction of 0.026. A periodic boundary condition was imposed on the simulation box and a vacuum space of at least 5.0 nm was left between periodic images in the z-direction. In all simulations, the lower plate was fixed in space, while the upper plate is mobile and experienced a constant downward force equivalent to a pressure of 50 MPa unless otherwise stated. Therefore, all simulations in this study were effectively performed under constant-pressure conditions although the volume of the simulation box was fixed. To simplify the problem, we did not consider the influence of pH values by adding additional H+ or OH− ions. In other words, all calculations were performed at a constant pH value of 7.
2.2 Molecular dynamics
All molecular dynamics (MD) simulations were performed using the LAMMPS program.81 Pairwise interactions and atomic charges were described by a combination of forcefields. Specifically, the MMT layers and ions were described by the CLAYFF forcefield.79 The MD parameters of polymers, including bonded and non-bonded interactions, were taken from the OPLS all-atom forcefield (OPLS-AA).82 Water molecules were described by the SPC/E model of Berendsen et al.83 For all nonbonded interactions, the van der Waals and electrostatic forces as given by eqn (1) were considered.
 | (1) |
Mixing rules are used for van der Waals parameters of unlike atoms by eqn (2)
 | (2) |
Long-range electrostatic interactions were summed by using the particle–particle particle-mesh (PPPM) method with an accuracy of 10−4.84 As explained in Section 2.1, although all simulations were performed under constant pressure conditions because of the external forces applied on the upper plate, the volume and shape of the periodic simulation box were fixed, therefore the MD runs were under the NVT ensemble with a Nosé–Hoover thermostat.85 All simulations were performed with a time step of 1.0 fs and a total integration time of 5.0 ns. Moreover, each simulation has been repeated three times by starting from different random velocities, and the averaged results of three independent runs were reported.
Self-diffusion coefficients (Ds) were estimated from the mean-squared displacement (MSD) based on the Einstein model (eqn (3)), where N is the number of total atoms and rk(t) is the position of atom k at time t.
 | (3) |
3 Results and discussion
3.1 Polymer desorption under different conditions
In this section, we report the MD simulation results of polymer desorption from the MMT surface. Specifically, we compare the desorption behaviors of four polymers and consider the influence of temperatures, pressures, salinity, and salt types.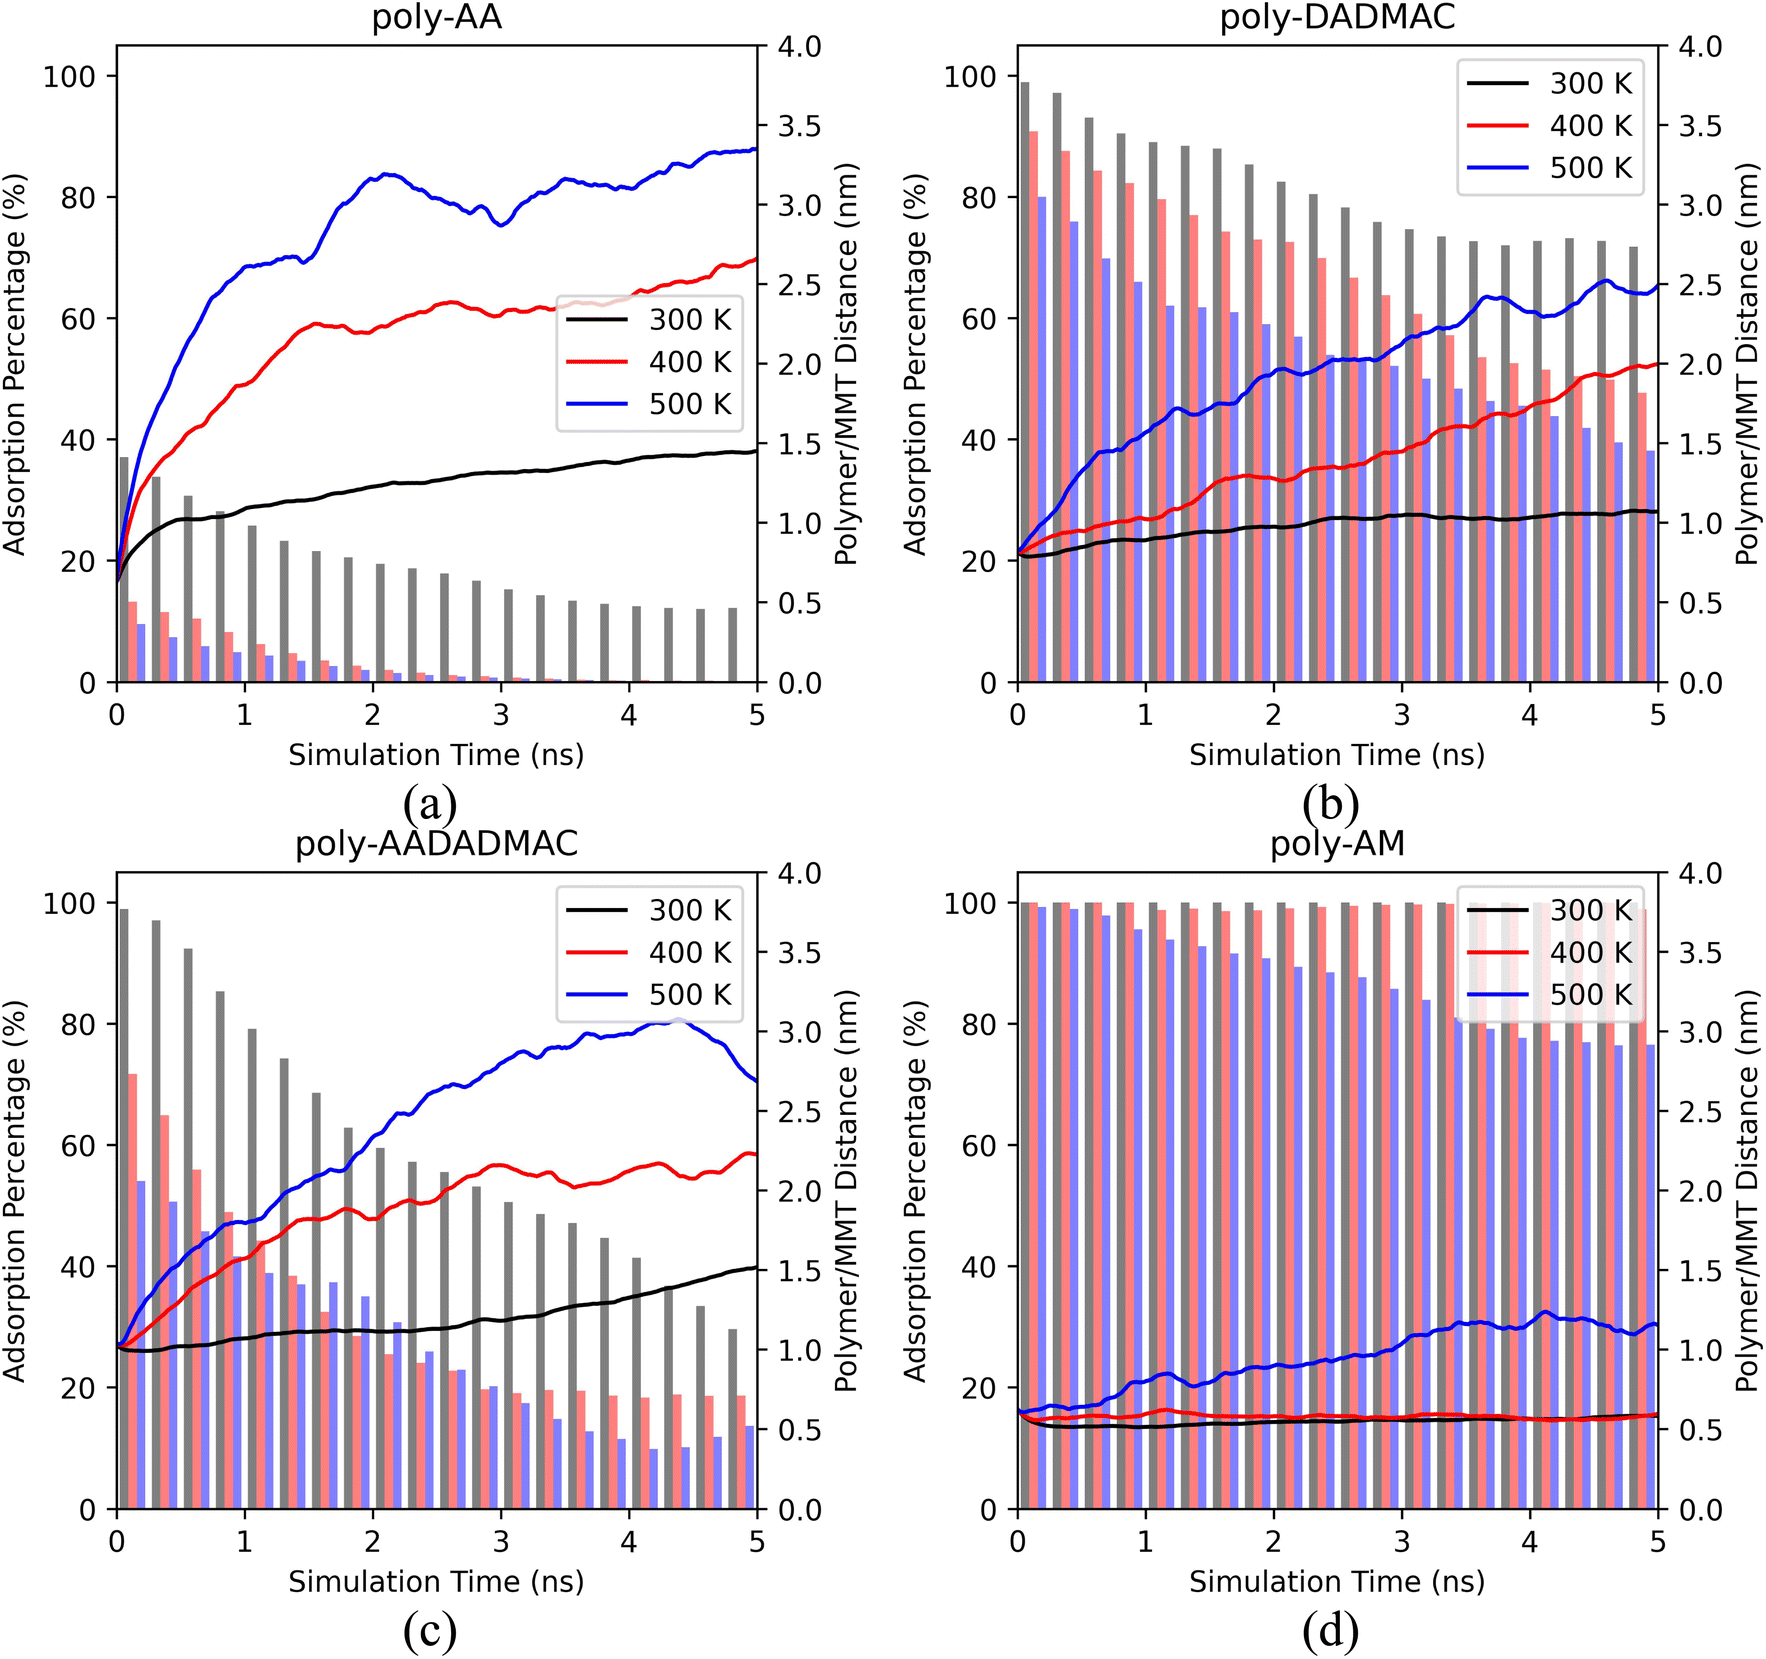 | ||
| Fig. 2 The polymer/MMT distances (curves, axis on the right) and the ratios of adsorbed polymer chains (bars, axis on the left) of (a) poly-AA, (b) poly-DADMAC, (c) poly-AADADMAC, and (d) poly-AM as functions of MD simulation time under different temperatures. In the calculations of the polymer/MMT distances, the distance is measured from the center of the polymer chain to the MMT surface. In the calculations of adsorption percentages, a chain is considered to be adsorbed if its minimum distance to the surface is less than 0.4 nm. All simulations were at 50 MPa, in 10% wt KCl solution. | ||
Fig. 2 shows averaged results of three independent runs. We have further provided the results of each separate run in ESI Fig. S2,† which also includes the simulations under an even lower temperature (275 K).
Both the polymer/MMT distances and adsorption percentages indicate that the adsorption of all polymers becomes less stable under higher temperatures.
As shown in Fig. 2(a), the adsorption of poly-AA is the least stable among all four polymers. Even at room temperatures (300 K), poly-AA chains steadily desorb from the surface and are on average 1.5 nm above the surface at 5.0 ns. Under higher temperatures (400–500 K), poly-AA chains desorb even faster with adsorption rates dropping to nearly zero after 3.0 ns.
The adsorption of poly-AADADMAC (Fig. 2(c)) is more stable than poly-AA (Fig. 2(a)) but less stable than poly-DADMAC (Fig. 2(b)). Poly-DADMAC can retain nearly 40% adsorption ratio at 500 K after 5 ns, while for poly-AADADMAC only 15% of chains remain on the surface under the same conditions.
Surprisingly, poly-AM shows exceptional adsorption stability as shown in Fig. 2(d). Its adsorption is completely stable at 300 K and 400 K. Only in the highest temperature (500 K), poly-AM slightly desorbs from the surface but its adsorption rate never drops below 75%. While the adsorption mechanism of poly-AA, which is presumably different from those of the other three polymers, will be further investigated in the subsequent sections, at this point we can qualitatively conclude that the relative adsorption stability of these four polymers follows the order of poly-AM > poly-DADMAC > poly-AADADMAC > poly-AA.
This order of adsorption stability loosely matches the order of self-diffusion coefficients (Ds) of polymers listed in Table 2 at least for temperatures below 400 K. For example, the Ds of poly-AA are two to five times higher than that of poly-AM. A more detailed table containing Ds values of water and salt ions is provided as Table S1.†
| Polymer | Ds (10−9 m2 s−1) | ||
|---|---|---|---|
| 300 K | 400 K | 500 K | |
| a All simulations in this table are at 50 MPa, in 10 wt% KCl solution. | |||
| Poly-AA | 0.1014 | 0.5059 | 2.4269 |
| Poly-DADMAC | 0.0513 | 0.4728 | 1.2065 |
| Poly-AADADMAC | 0.0615 | 0.4678 | 0.8268 |
| Poly-AM | 0.0233 | 0.1264 | 0.9311 |
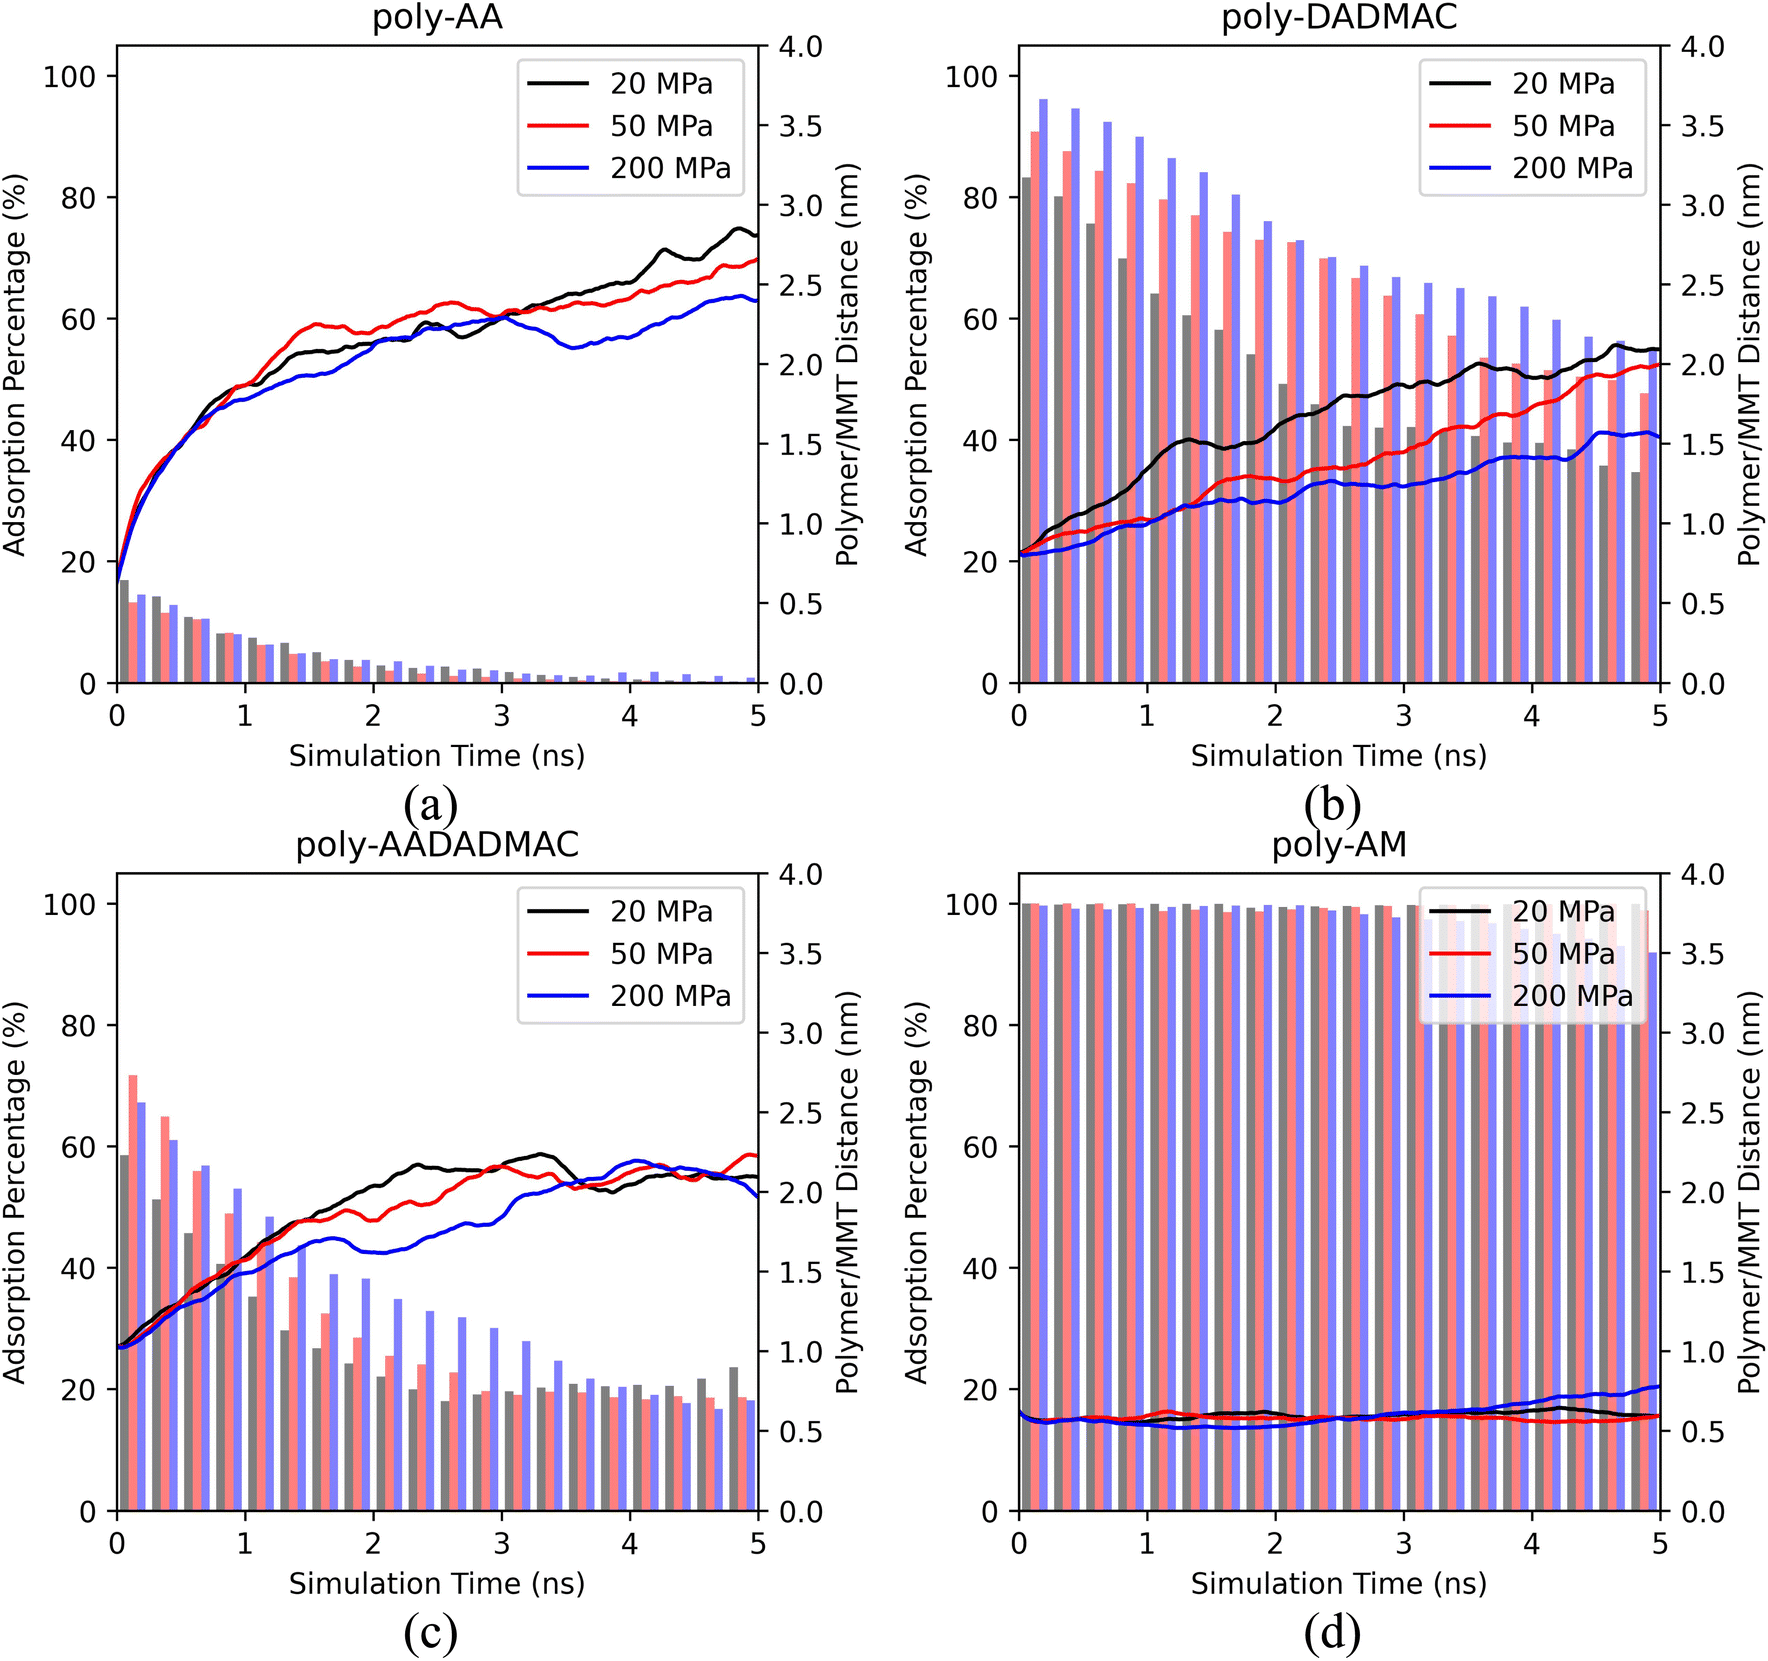 | ||
| Fig. 3 The polymer/MMT distances and the ratios of adsorbed polymer chains of (a) poly-AA, (b) poly-DADMAC, (c) poly-AADADMAC, and (d) poly-AM as functions of MD simulation time under different pressures. All simulations were at 400 K, in 10 wt% KCl solution. | ||
Based on Fig. 3, we conclude that pressures varying between 20 and 200 MPa have a weak influence on the desorption behaviors of polymers. Except for poly-AM, the other three polymers have slightly stronger adsorption under higher pressures. A possible reason is that the elevated density of the polymer/salt solution (approximately 1.01 g cm−3 at 20 MPa and 1.08 g cm−3 at 200 MPa, see Table S2†) under high pressures reduces the mobility of polymer chains by decreasing the Ds values of polymer chains and salt ions. For example, Table 3 suggests that the Ds of poly-AA decreases from 0.63 to 0.40 from 20 MPa to 200 MPa. Table S2† further lists the density of the polymer/salt solution and the Ds values of K+, Cl−, and water. Especially for water, its Ds strictly decreases as the pressure rises.
| Polymer | Ds (10−9 m2 s−1) | ||
|---|---|---|---|
| 20 MPa | 50 MPa | 200 MPa | |
| a All simulations in this table are at 400 K, in 10 wt% KCl solution. | |||
| Poly-AA | 0.6325 | 0.5059 | 0.4014 |
| Poly-DADMAC | 0.5737 | 0.4728 | 0.4382 |
| Poly-AADADMAC | 0.5182 | 0.4678 | 0.5069 |
| Poly-AM | 0.2010 | 0.1264 | 0.1563 |
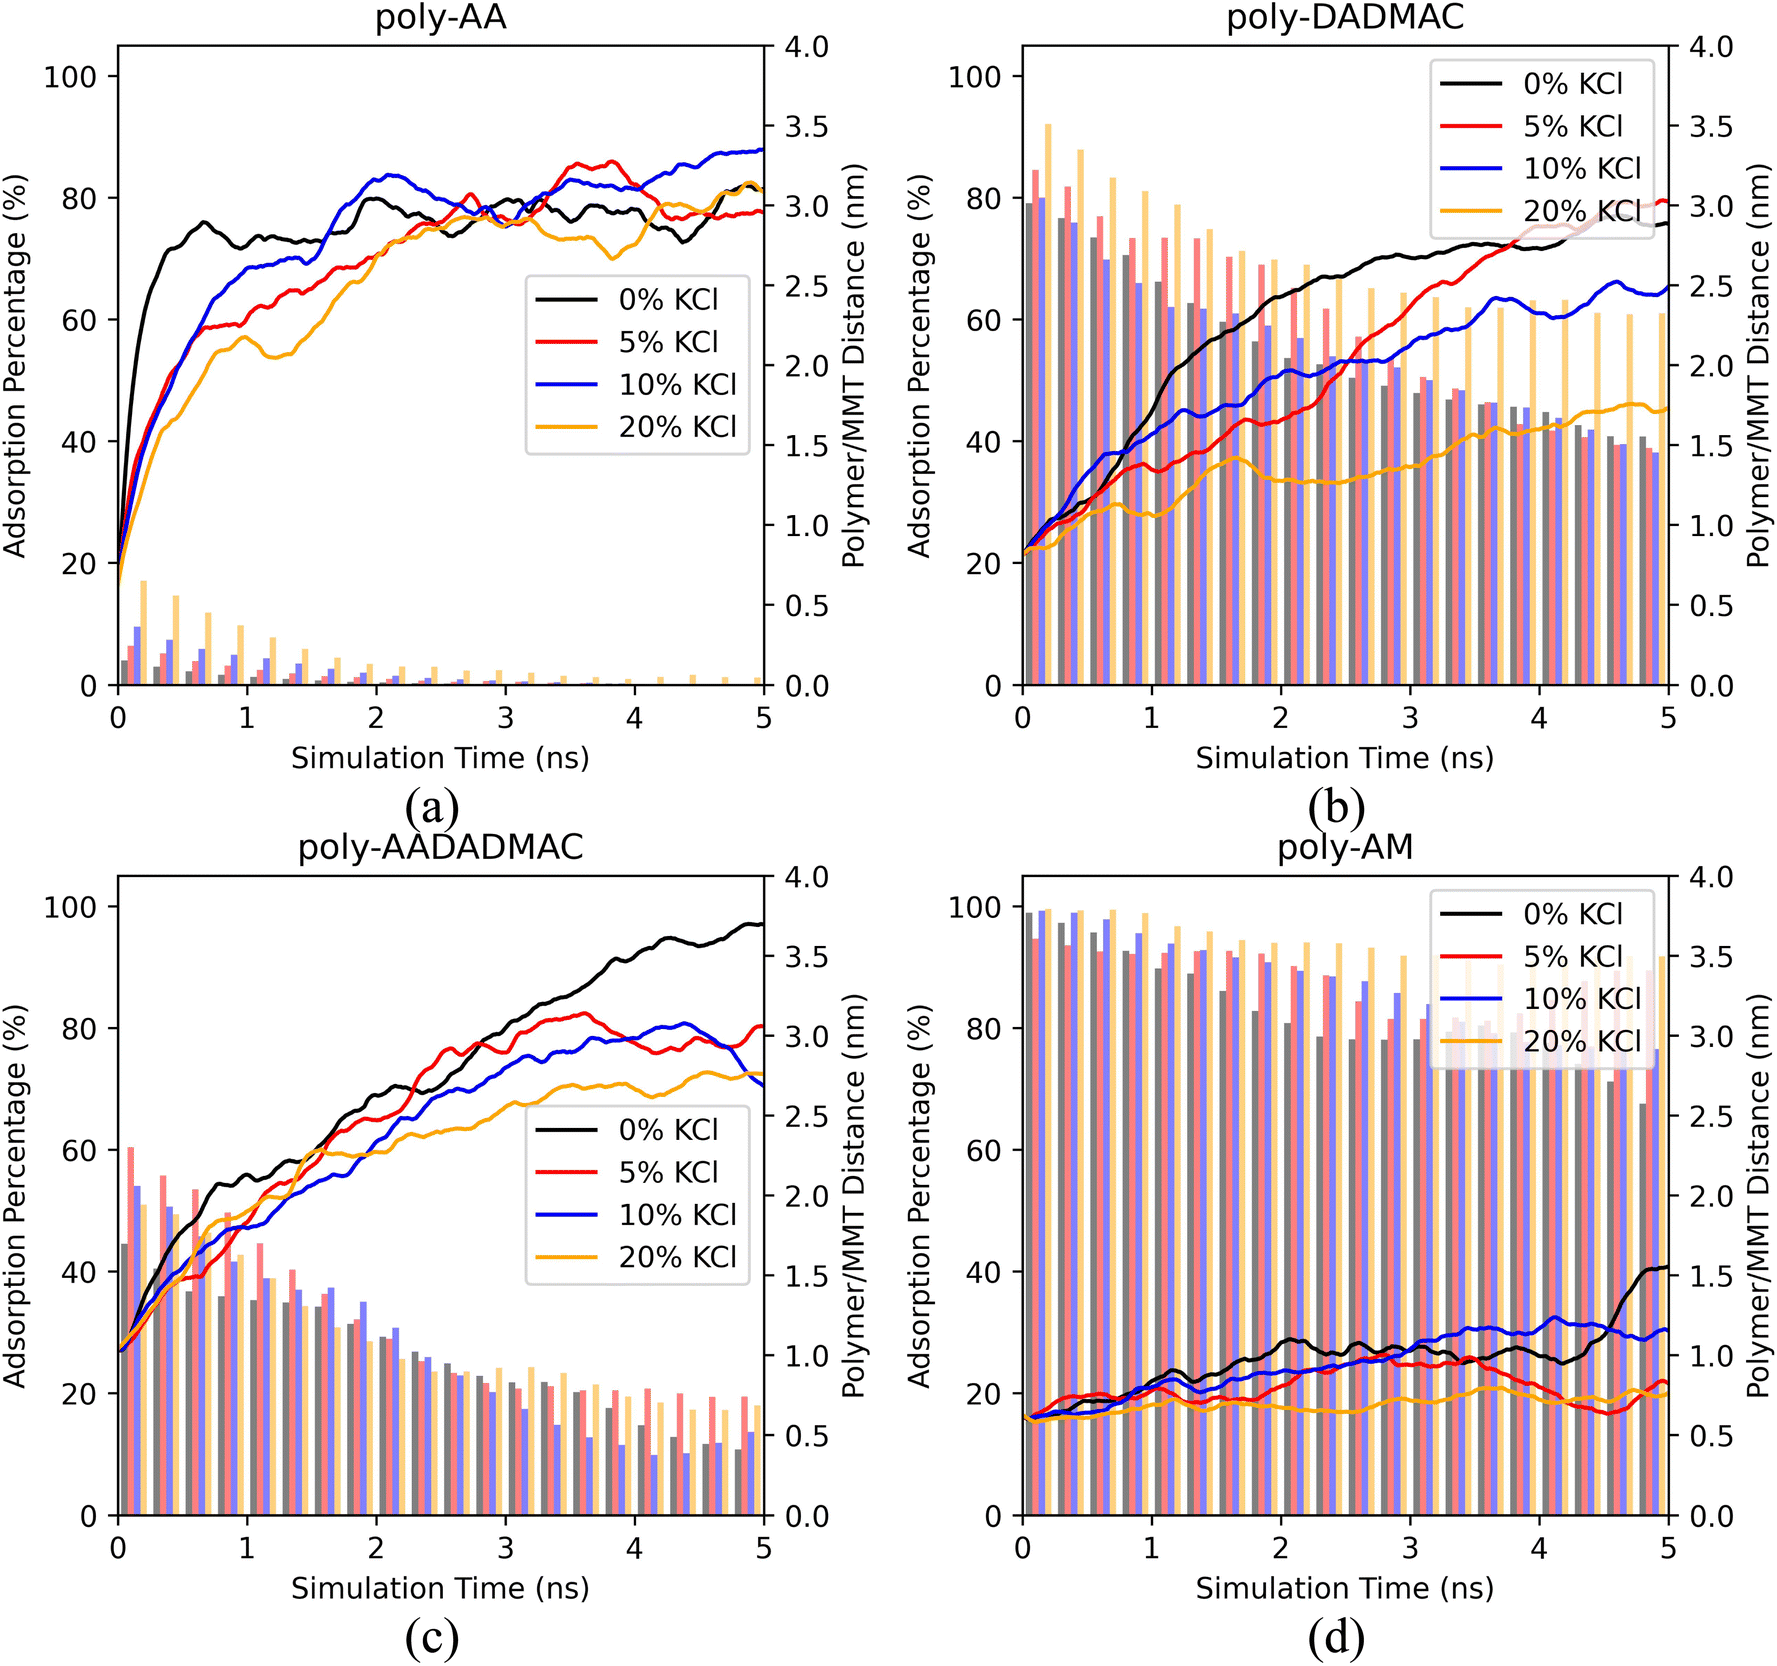 | ||
| Fig. 4 The polymer/MMT distances and the ratios of adsorbed polymer chains of (a) poly-AA, (b) poly-DADMAC, (c) poly-AADADMAC, and (d) poly-AM as functions of MD simulation time under different KCl concentrations. All simulations were at 500 K, 50 MPa. | ||
For poly-AA, Fig. 4(a) suggests that the adsorption rate is inversely proportional to the salinity, at least in the first two nanoseconds. With no salt at all, the polymer quickly detaches (distance > 3.0 nm) from the surface in just half a nanosecond, while when a high concentration of KCl (20 wt%) is present, the desorption process is significantly delayed. However, after the poly-AA chains fully desorb from the surface after 2 ns, both the adsorption rates and distances are no longer dependent on salinity.
Desorption of poly-DADMAC has a more profound dependence on salinity as depicted in Fig. 4(b). A high concentration of 20% KCl can significantly enhance the adsorption of poly-DADMAC within the entire simulated time range. However, there is no obvious difference in adsorption ratios among 0%, 5%, and 10% concentrations.
For poly-AADADMAC and poly-AM shown in Fig. 4(c) and (d), salinity has a less obvious influence on the desorption rates. In the first nanosecond, desorption rates under different salinity are almost the same (difference in desorption distance <0.5 nm). At a longer timescale (2–5 ns), the desorption distances and adsorption rates show no correlation with the salinity and are more likely a consequence of random distribution due to the Brownian motion of partially desorbed polymer chains.
Therefore, we conclude that high salinity (≥20%) can enhance the adsorption of poly-AA and poly-DADMAC, which are both charged polymers. On the other hand, salinity has no apparent influence on the desorption rates of poly-AADADMAC and poly-AM. For poly-AA, a high salinity may slow down, but not prevent its desorption at high temperatures (500 K).
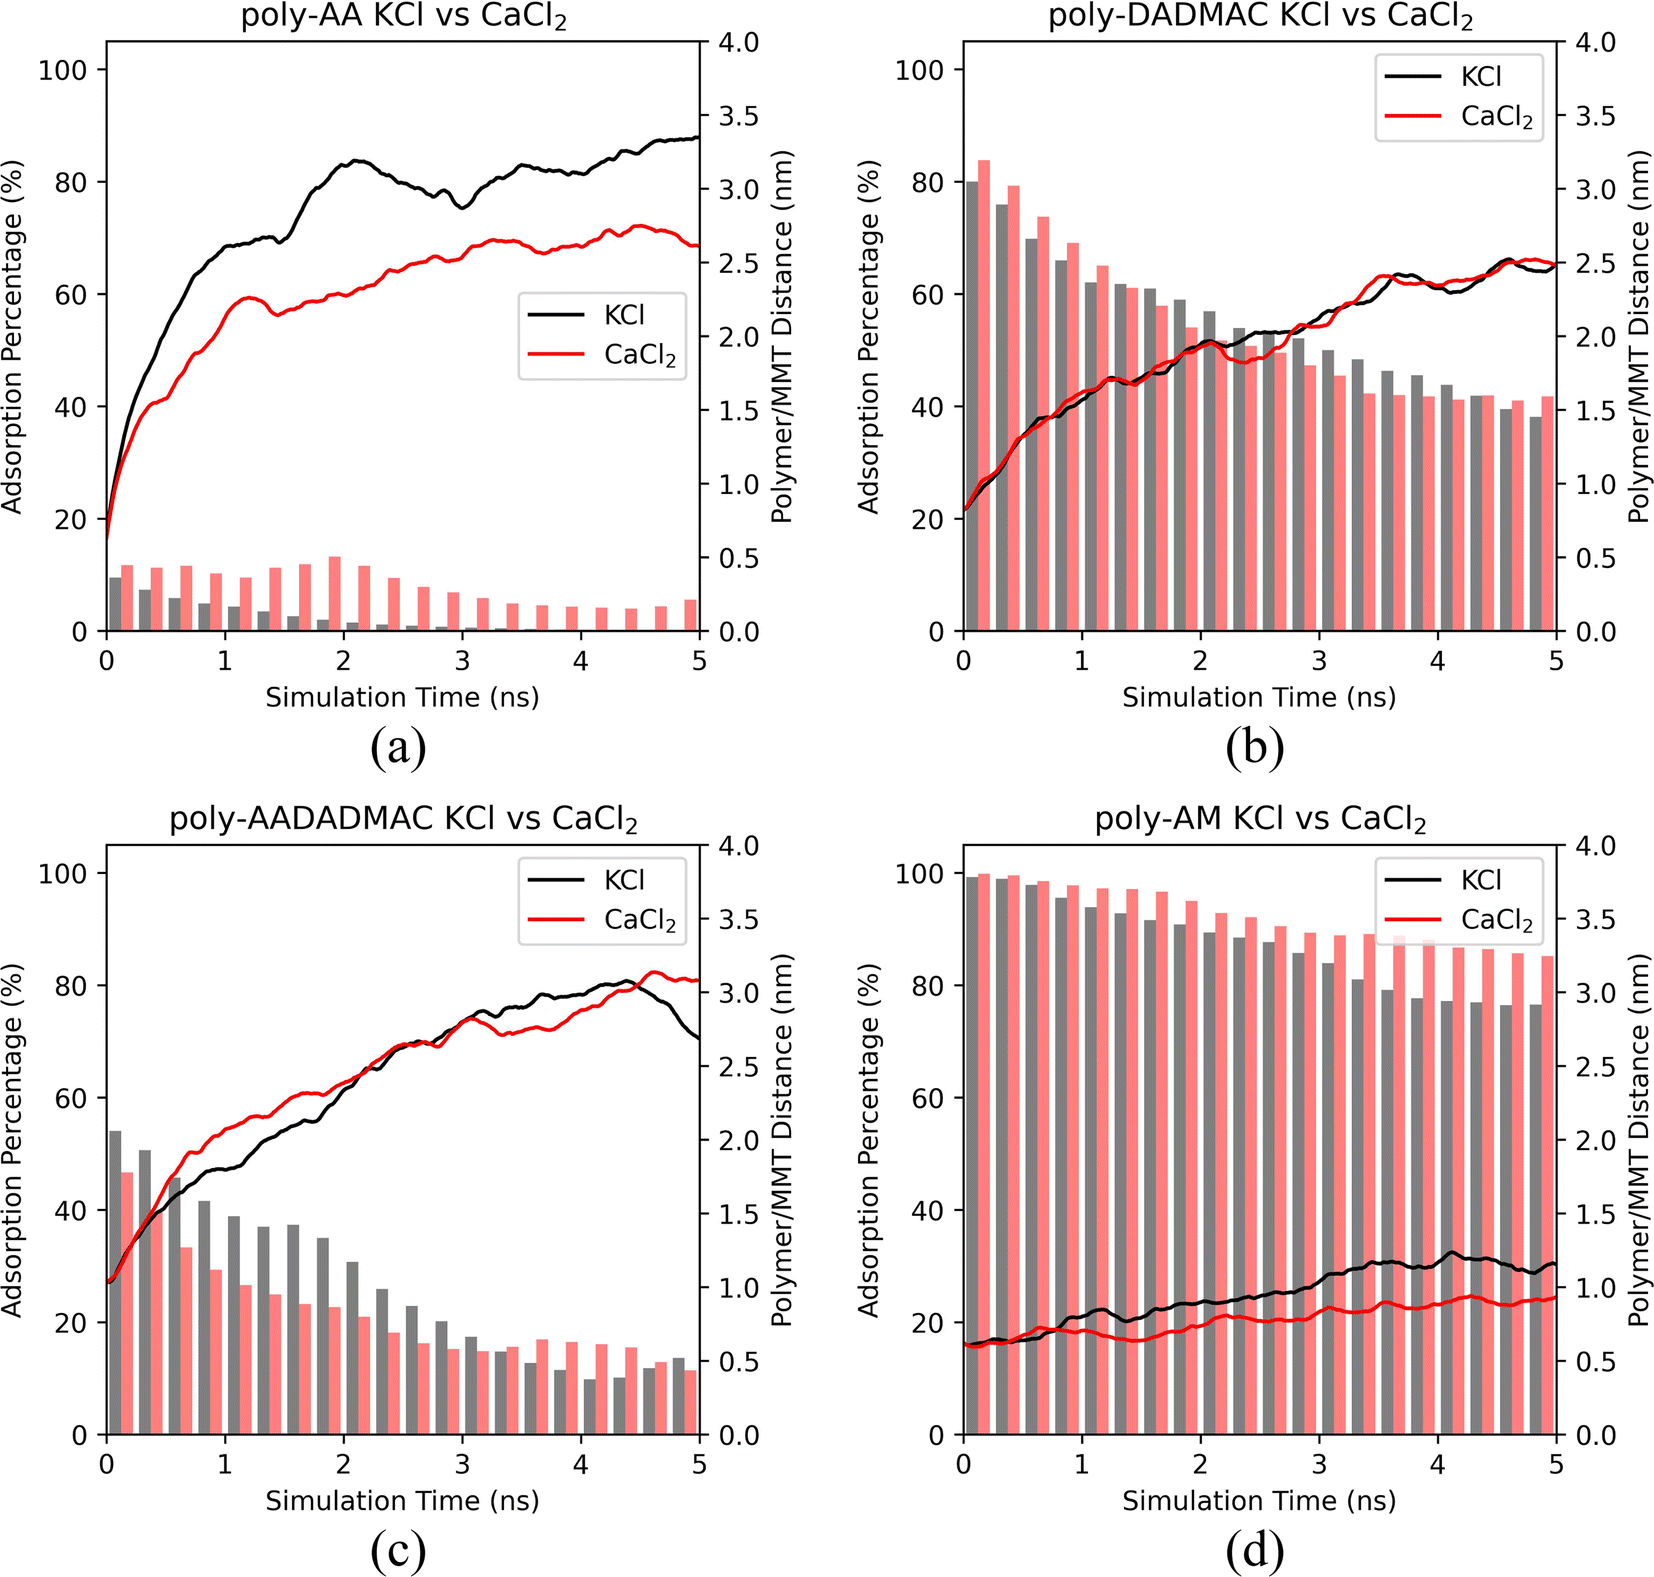 | ||
| Fig. 5 The polymer/MMT distances and the ratios of adsorbed polymer chains of (a) poly-AA, (b) poly-DADMAC, (c) poly-AADADMAC, and (d) poly-AM as functions of MD simulation time in 10 wt% KCl and 7.54 wt% CaCl2 solutions at 500 K and 50 MPa. | ||
It is evident from Fig. 5 that poly-AA has stronger adsorption in CaCl2 than in KCl. However, the presence of CaCl2 did not prevent the polymer from desorbing from the surface after 2.0 ns. We conclude that the divalent Ca2+ cations may enhance the adsorption of poly-AA by slowing its desorption. But from the thermodynamic point of view, KCl and CaCl2 showed no difference at the high temperature (500 K) since the polymer chains eventually desorbed in both cases.
For the other three polymers shown in Fig. 5, adsorption behaviors in KCl have no apparent difference compared with those in CaCl2 solutions at 500 K.
Additional simulations at 275 K provided in Fig. S4† suggest that similar conclusions can be drawn for low temperatures. Only poly-AA is affected by the presence of CaCl2.
3.2 Adsorption mechanisms
Unfortunately, significant desorption of polymer chains can be observed at or above 300 K. To obtain structures in which polymer chains are adsorbed on the MMT surface, we lowered the temperature to 275 K and performed a series of simulations. These results are summarized in Fig. S3,† which is previously referenced in Section 3.1.3 as a part of the investigation into salinity dependency. At 275 K and in 10% KCl solution, all polymers including poly-AA are on average within 1.5 nm from the MMT surface. Therefore, the subsequent analysis of adsorption mechanisms will be performed based on the results under the 275 K, 10% KCl condition.
We have calculated the distributions of polymer chains and salt ions along the z-direction (perpendicular to the MMT surface) averaged over each five-nanosecond trajectory and plotted them in Fig. 6. Positions of characteristic functional groups of each polymer are chosen to represent the locations of polymer chains. Specifically, the distributions of carboxyl groups (COO−) on poly-AA, tertiary ammonium nitrogen (>N<+) on poly-DADMAC, COO− and >N<+ on poly-AADADMAC, and amide (CONH2) on poly-AM are shown. Furthermore, for each polymer, Fig. 7 shows the structure of the molecular system after 3.0 ns of MD simulations. These snapshots are intended to provide an intuitive, but less rigorous, representation of the typical structures of adsorbed polymer chains. In addition, radial distribution functions (RDFs) between polymer functional groups and salt ions are shown in Fig. S5.†
 | ||
| Fig. 6 Distributions of polymer functional groups and salt ions along the z-direction for (a) poly-AA, (b) poly-DADMAC, (c) poly-AADADMAC, and (d) poly-AM adsorbed on the MMT surface at 275 K, 50 MPa, in 10 wt% KCl solution. | ||
 | ||
| Fig. 7 Snapshots of (a) poly-AA, (b) poly-DADMAC, (c) poly-AADADMAC, and (d) poly-AM adsorbed on the MMT surface after 3.0 ns of MD simulations at 275 K, 50 MPa. In each panel, the figure on the right is a close-up view of the polymer-clay interfacial region highlighted by blue squares on the left. For clarity, water and ions are shown only in the close-up views. In addition to the coloring rules defined in Fig. 1, K+ and Cl− are shown as purple and light green spheres, respectively. | ||
Since the carboxyl groups and the MMT surface carry like charges and repel each other, Fig. 6(a) suggests that the carboxyl groups keep a minimum distance of 0.5 nm and are most likely 1.2 nm away from the surface. Meanwhile, K+ aggregate between the polymer and the MMT surface as counter ions to form an electric double-layer (EDL). The interaction between poly-AA and the MMT is dominated by coulombic forces, which rely on the existence of cations between the polymer and the clay. This mechanism can explain the observation that both the existence of divalent Ca2+ ions and higher salinity can enhance the adsorption stability because the coulombic forces are proportional to the amounts of charges. On the other hand, under high temperatures (500 K), cations with larger kinetic energies are more likely to escape the polymer/clay interfacial region, which may lead to the desorption of poly-AA.
As shown in Fig. 6(b), positively charged poly-DADMAC is attracted to the negatively charged Na-MMT surface in the adsorbed state. The density of poly-DADMAC splits into three peaks, which can be attributed to DADMAC sidechains that point towards the surface, sideways, and upwards as suggested by the close-up view in Fig. 7(b). The first peak of >N<+ appears at around 0.5 nm, much closer than the most probable 1.2 nm distance between poly-AA and MMT surface. Furthermore, the first peak of >N<+ is followed by a peak of Cl− at 0.7 nm. The >N<+ groups from poly-DADMAC and Cl− ions form an EDL similar to poly-AA, which may stabilize the adsorbed polymer chains and can explain why high salinity also favors the adsorption of poly-DADMAC.
The adsorption mechanism of poly-AADADMAC appears to be a combination of poly-DADMAC and poly-AA. As shown in Fig. 6(c), only DADMAC units are directly adsorbed on the surface (first peak at 0.5 nm), while AA units are further away from the surface (most likely at 0.7 nm). Since the polymer chain itself is charge neutral, neither cations nor anions accumulate between the polymer and the clay surface, and the peaks of Cl− almost coincide with >N<+, and K+ peaks coincide with COO− peaks. The DADMAC and AA units form a dipole with positively charged DADMAC units facing the surface. Not surprisingly, the adsorption stability of poly-AADADMAC is stronger than poly-AA but weaker than poly-DADMAC because the adsorption affinity is contributed mainly by the DADMAC units, and poly-AADADMAC is a 1![[thin space (1/6-em)]](https://www.rsc.org/images/entities/char_2009.gif) :1 copolymer of AA and DADMAC units.
:1 copolymer of AA and DADMAC units.
The adsorption mechanism of poly-AM is completely different from the others. The sidechains of poly-AM are polar but not ionic. The amide groups carry negative partial charges and are hydrogen-bond donors. As shown in Fig. 6(d), there are two peaks of CONH2 at 0.4 nm and 0.8 nm, which may correspond to functional groups pointing downward and upward, respectively, as demonstrated in Fig. 7(d). This short amide-surface distance (0.4 nm) leads to significant contributions from van der Waals forces.
Moreover, the amide groups form hydrogen bonds with oxygen atoms on the MMT surface. If we consider the criteria to form a hydrogen bond to be H⋯O distance less than 0.25 nm and N–H⋯O angle greater than 100°, our calculations found that each poly-AM chain on average forms 1.64 hydrogen bonds with the surface at 275 K. Under higher temperatures, the average numbers of hydrogen bonds per chain are 1.52, 1.02, and 0.78 at 300 K, 400 K, and 500 K, respectively. Since each chain contains 10 amide groups (Table 1), 8% to 16% amide groups have contributions to hydrogen bonding with the surface. Under temperatures below 400 K, each poly-AM chain is anchored to the MMT surface by at least one hydrogen bond, which may be one of the major reasons for the observed strong adsorption affinity shown in Fig. 2(d).
 | ||
| Fig. 8 Distributions of polymer functional groups and salt ions along the z-direction for (a) poly-AA, (b) poly-DADMAC, (c) poly-AADADMAC, and (d) poly-AM at 300 K, 400 K, and 500 K. All simulations in this figure are at 50 MPa, in 10 wt% KCl solution. | ||
The COO− peak which appears at 1.2 nm at 275 K (Fig. 6(a)) gradually shifts to the right in Fig. 8(a) and becomes broader at higher temperatures, meaning that poly-AA is no longer attracted to the MMT surface and finally dissolves in the solution.
In Fig. 8(b), the second and third peaks of >N<+, which represent DADMAC units pointing sideways and upwards in the original adsorbed poly-DADMAC, gradually flatten out at 400 K and 500 K. However, the first peak at 0.5 nm, which represents >N<+ groups directly attracted to the surface, does not shift or disappear under higher temperatures. Moreover, the area under the first peak is inversely proportional to the temperature (height reduced from around 1.6 mol L−1 at 275 K to 0.8 mol L−1 at 500 K). These results suggest that the DADMAC units pointing sideways and upwards in the originally adsorbed poly-DADMAC may not have significant contributions to the adsorption stability and can easily detach from the surface, possibly because long-range coulombic forces are screened in solutions with high salinity.
Similarly, Fig. 8(c) indicates that >N<+ peaks can resist the high temperature while the peak of COO− completely disappears at 500 K. This result corroborates the conclusion that adsorption stability of poly-AADADMAC is mainly contributed by cationic DADMAC units, at least under high temperatures.
Fig. 8(d) further verifies the strong affinity of poly-AM with the MMT surface. The peak at 0.4 nm, which represents amide groups directly attached to the surface via hydrogen bonds, does not shift its position under high temperatures. But the second peak gradually disappears. The height of the first peak drops from 3.75 mol L−1 at 275 K to 2.1 mol L−1 at 500 K, which matches the change in the number of average hydrogen bonds between poly-AM and the surface from 1.64 at 275 K to 0.78 at 500 K.
 | ||
| Fig. 9 Illustrations for the adsorption mechanisms of (a) poly-AA, (b) poly-DADMAC, (c) poly-AADADMAC, and (d) poly-AM on MMT surfaces. | ||
Fig. 9 summarizes the adsorption mechanisms discovered in this study. Specifically, Fig. 9(a) demonstrates the EDL structure formed by K+ and COO− groups on poly-AA. Fig. 9(b) also depicts the EDL by >N<+ and Cl−. For the neutral poly-AADADMAC, Fig. 9(c) shows that poly-AADADMAC is stabilized on the surface through the contributions from both DADMAC and AA units, and Fig. 9(d) indicates that van der Waals interactions and hydrogen bonds exist between poly-AM and the surface.
Adsorption mechanisms revealed by the simulations can also provide insights into the strategies to enhance the polymer/clay interactions:
(1) Strongly polar polymers should have higher adsorption stability than anionic or cationic polymers under high temperatures (>500 K). The introduction of hydrogen bond donors can enhance the adsorption of polymer on MMT.
(2) Cationic polymers should have stronger adsorption stability than anionic polymers since they can be attracted to the negatively charged clay surface directly through coulombic forces. However, cationic polymers are less stable than neutral polar polymers, especially under high temperatures. A possible strategy to increase the adsorption stability is to introduce both cationic and polar repeating units into the polymer chains.
(3) High salinity favors the adsorption of both anionic and cationic polymers. A possible reason is that the EDL structure formed under high salinity can better stabilize the adsorbed polymer chains. Charged polymers, especially polymers with cationic units, should be recommended in high-salinity environments.
4 Conclusion
In this study, we have simulated the desorption kinetics and mechanisms of poly-AA, poly-DADMAC, poly-AADADMAC, and poly-AM from the Na-MMT surface. We found that the adsorption stability follows the order of poly-AM > poly-DADMAC > poly-AADADMAC > poly-AA. This order of relative stability remains the same under different temperatures, pressures, and salinity.We found that temperature significantly affects the adsorption stability of polymers as all polymers are less stable under higher temperatures. Pressure is only a minor factor of adsorption stability as polymers are marginally more sable under higher pressures. High salinity favors the adsorption of both positively and negatively charged polymers but has negligible influence on neutral polymers.
Based on the simulation results, we predict that a polymer with small and strongly polar sidechains, for example with hydrogen donor sites similar to poly-AM, would adsorb firmly on clay surfaces. Positively charged polymers would also have strong adsorption stability. On the other hand, anionic polymers would have limited adsorption stability on negatively charged clay surfaces under high temperatures.
One limitation of this study is that only montmorillonite was investigated while other types of clay minerals are also widely used in drilling fluids. Furthermore, only the basal planes of clays are considered due to periodic boundary conditions, while in reality, the clay platelet edges may also be adsorption sites. Our future work will be focused on the adsorption of polymers on other types of clay under more complex situations by considering the influence of pH values and platelet edges. Nevertheless, the simulation framework and insights proposed in this study can be extended and utilized in the design and screening of polymers with high adsorption stability on clays, which will also be the aim of our future studies.
Author contributions
Conceptualization, Yuanzhi Qu, Ling Lin, and Wenjia Luo; methodology, Ling Lin; software, Wenjia Luo, Hongjun Huang, and Xin Li; validation, Ling Lin, Yukun Yang, and Ren Han; formal analysis, Hongjun Huang and Ren Han; investigation, Yukun Yang and Xin Li; resources, Yuanzhi Qu and Ling Lin; data curation, Yuanzhi Qu; writing-original draft preparation, Wenjia Luo and Ling Lin; writing-review and editing, Wenjia Luo; visualization, Hongjun Huang and Han Ren; supervision, Ling Lin and Wenjia Luo; project administration, Yuanzhi Qu, Ling Lin, and Wenjia Luo; funding acquisition, Yuanzhi Qu and Ling Lin.Conflicts of interest
The authors declare no conflict of interest.Acknowledgements
This work was financially supported by CNPC key core technology project (Environment-friendly new materials for wellbore working fluid with temperature resistance above 240 °C, grant no. 2020A-3913) and the National Natural Science Foundation of China (grant no. 41702391).References
- J. S. Essomba, J. P. Alla, P. D. B. Belibi and N. N. Fathima, Int. J. Environ. Sci. Technol., 2022, 19, 5181–5194 CrossRef CAS.
- Ş. Yılmaz, A. Zengin and T. Şahan, Colloids Surf., A, 2021, 612, 125979 CrossRef.
- A. Amari, F. Mohammed Alzahrani, K. Mohammedsaleh Katubi, N. Salem Alsaiari, M. A. Tahoon and F. Ben Rebah, Materials, 2021, 14, 1365 CrossRef CAS PubMed.
- E. Baigorria and L. F. Fraceto, J. Cleaner Prod., 2022, 331, 129867 CrossRef CAS.
- J. Dong, Z. Cheng, S. Tan and Q. Zhu, Expert Opin. Drug Delivery, 2021, 18, 695–714 CrossRef CAS PubMed.
- N. Khatoon, M. Q. Chu and C. H. Zhou, J. Mater. Chem. B, 2020, 8, 7335–7351 RSC.
- N. Mohamadian, H. Ghorbani, D. A. Wood and M. A. Khoshmardan, J. Polym. Res., 2019, 26, 33 CrossRef.
- H. M. Ahmad, M. S. Kamal and M. A. Al-Harthi, Appl. Clay Sci., 2018, 160, 226–237 CrossRef CAS.
- X. Jia, X. Zhao, B. Chen, S. B. Egwu and Z. Huang, Appl. Surf. Sci., 2022, 578, 152089 CrossRef CAS.
- R. Saboori, S. Sabbaghi and A. Kalantariasl, Powder Technol., 2019, 353, 257–266 CrossRef CAS.
- M. A. Abbas, A. Zamir, K. A. Elraies, S. M. Mahmood and M. H. Rasool, J. Pet. Sci. Eng., 2021, 204, 108745 CrossRef CAS.
- F. Zhang, J. Sun, Z. Dai, X. Chang, X. Huang, J. Liu, Z. Wang and K. Lv, J. Polym. Res., 2020, 27, 107 CrossRef CAS.
- Q. Chu, J. Su and L. Lin, Appl. Clay Sci., 2020, 185, 105315 CrossRef CAS.
- X. Shu, L. Wan and M. Duan, J. Polym. Eng., 2018, 38, 323–331 CrossRef CAS.
- P. Liu, Appl. Clay Sci., 2007, 38, 64–76 CrossRef CAS.
- O. T. Salami and J. Plank, J. Appl. Polym. Sci., 2013, 129, 2544–2553 CrossRef CAS.
- Y. Mansoori, A. Akhtarparast, M. Reza Zamanloo, G. Imanzadeh and T. M. Masooleh, Polym. Compos., 2011, 32, 1225–1234 CrossRef CAS.
- K. R. Reddy, C. Venkata Reddy, B. Babu, K. Ravindranadh, S. Naveen and A. V. Raghu, in Modified Clay and Zeolite Nanocomposite Materials, ed. M. Mercurio, B. Sarkar and A. Langella, Elsevier, 2019, pp. 197–218 Search PubMed.
- M. Abbasian, M. Seyyedi and M. Jaymand, Polym. Bull., 2020, 77, 1107–1120 CrossRef CAS.
- A. Vasudeo Rane, K. Kanny, V. K. Abitha, S. S. Patil and S. Thomas, in Clay-Polymer Nanocomposites, ed. K. Jlassi, M. M. Chehimi and S. Thomas, Elsevier, 2017, pp. 113–144 Search PubMed.
- H. Lei, J. Lou, X. Li, M. Jiang and C. Tu, Int. J. Geomech., 2020, 20, 04020050 CrossRef.
- J. Cao, L. Meng, Y. Yang, Y. Zhu, X. Wang, C. Yao, M. Sun and H. Zhong, Energy Fuels, 2017, 31, 11963–11970 CrossRef CAS.
- G. Wang, G. Jiang, J. Yang, L. Yang, X. Li, Y. He and X. Chang, J. Appl. Polym. Sci., 2021, 138, 51001 CrossRef CAS.
- M. T. Alsaba, M. F. Al Dushaishi and A. K. Abbas, J. Pet. Explor. Prod. Technol., 2020, 10, 1389–1399 CrossRef CAS.
- S. Gautam, C. Guria and V. K. Rajak, J. Pet. Sci. Eng., 2022, 213, 110318 CrossRef CAS.
- J. Sun, X. Zhang, K. Lv, J. Liu, Z. Xiu, Z. Wang, X. Huang, Y. Bai, J. Wang and J. Jin, J. Pet. Sci. Eng., 2022, 209, 109808 CrossRef CAS.
- F. Kádár, L. Százdi, E. Fekete and B. Pukánszky, Langmuir, 2006, 22, 7848–7854 CrossRef PubMed.
- G. Cheraghian, S. S. Khalili Nezhad, M. Kamari, M. Hemmati, M. Masihi and S. Bazgir, Int. Nano Lett., 2014, 4, 1–8 CrossRef CAS.
- R. Y. Lochhead and C. M. Boykin, in Polymer Nanocomposites, American Chemical Society, 2001, ch. 8, vol. 804, pp. 85–98 Search PubMed.
- A. I. Nakatani, C. E. Mohler and S. Hughes, Soft Matter, 2021, 17, 6848–6862 RSC.
- H. Kohay, I. I. Bilkis and Y. G. Mishael, J. Colloid Interface Sci., 2019, 552, 517–527 CrossRef CAS PubMed.
- R. J. Sengwa and S. Choudhary, J. Appl. Polym. Sci., 2014, 131, 40617 CrossRef.
- S. P. Pereira, G. Scocchi, R. Toth, P. Posocco, D. R. Nieto, S. Pricl and M. Fermeglia, J. Multiscale Modell., 2011, 03, 151–176 CrossRef CAS.
- J. L. Suter, L. Kabalan, M. Khader and P. V. Coveney, Geochim. Cosmochim. Acta, 2015, 169, 17–29 CrossRef CAS.
- R. T. Cygan, J. A. Greathouse, H. Heinz and A. G. Kalinichev, J. Mater. Chem., 2009, 19, 2470–2481 RSC.
- B. J. Teppen, K. Rasmussen, P. M. Bertsch, D. M. Miller and L. Schäfer, J. Phys. Chem. B, 1997, 101, 1579–1587 CrossRef CAS.
- M. Camara, J. Xu, X. Wang, J. Zhang, Z. Chen and X. Li, Appl. Clay Sci., 2017, 146, 206–215 CrossRef.
- J. A. Greathouse, R. T. Cygan, J. T. Fredrich and G. R. Jerauld, J. Phys. Chem. C, 2016, 120, 1640–1649 CrossRef CAS.
- R. Shahriyari, A. Khosravi and A. Ahmadzadeh, Mol. Phys., 2013, 111, 3156–3167 CrossRef CAS.
- S. Yang, X. Li, Z. Jia, Q. Li and G. Yang, Soil Sci. Soc. Am. J., 2018, 82, 1384–1391 CrossRef CAS.
- Y. Zhang, X. Liu, C. Zhang and X. Lu, Geochim. Cosmochim. Acta, 2020, 291, 110–125 CrossRef CAS.
- A. A. Tsukanov and S. G. Psakhie, Sci. Rep., 2016, 6, 19986 CrossRef CAS PubMed.
- A. Kadoura, A. K. Narayanan Nair and S. Sun, J. Phys. Chem. C, 2016, 120, 12517–12529 CrossRef CAS.
- J. A. R. Willemsen, S. C. B. Myneni and I. C. Bourg, J. Phys. Chem. C, 2019, 123, 13624–13636 CrossRef CAS.
- S. He, J. C. Palmer and G. Qin, Microporous Mesoporous Mater., 2017, 249, 88–96 CrossRef CAS.
- Z. Wang, C. Yu, J. Zhao, P. Guo and H. Liu, J. Mater. Res. Technol., 2022, 19, 4371–4380 CrossRef CAS.
- C. Yu, J. Zhao, Z. Wang, P. Guo, H. Liu, Z. Su and H. Liao, J. Mol. Liq., 2022, 365, 120075 CrossRef CAS.
- Y. Li, S. Han, B. Zhang, H. Tang, J. Han, H. Kang, Y. Zhao and J. Zhu, Appl. Clay Sci., 2022, 216, 106344 CrossRef CAS.
- Y. Li, M. Chen, H. Tang, S. Han, H. Song, P. Wang, Y. Zhao and J. Zhu, ACS Sustainable Chem. Eng., 2022, 10, 6358–6369 CrossRef CAS.
- Y. Li, M. Chen, C. Liu, H. Song, P. Yuan, B. Zhang, D. Liu and P. Du, Langmuir, 2020, 36, 3323–3335 CrossRef CAS PubMed.
- Y. Li, M. Chen, H. Song, P. Yuan, B. Zhang, D. Liu, H. Zhou and H. Bu, ACS Earth Space Chem., 2020, 4, 572–582 CrossRef CAS.
- H. Zhang, J. Cao, H. Duan, H. Luo and X. Liu, Fuel, 2022, 310, 122380 CrossRef CAS.
- P. A. Klonos, L. Papadopoulos, Z. Terzopoulou, G. Z. Papageorgiou, A. Kyritsis and D. N. Bikiaris, J. Phys. Chem. B, 2020, 124, 7306–7317 CrossRef CAS PubMed.
- D. Karataş, A. Tekin, F. Bahadori and M. S. Çelik, J. Mater. Chem. B, 2017, 5, 8070–8082 RSC.
- Y. Wang, J. Wohlert, M. Bergenstråhle-Wohlert, Y. Tu and H. Ågren, RSC Adv., 2015, 5, 54580–54588 RSC.
- Y. Wang, J. Wohlert, M. Bergenstråhle-Wohlert, J. J. Kochumalayil, L. A. Berglund, Y. Tu and H. Ågren, Biomacromolecules, 2015, 16, 257–265 CrossRef CAS PubMed.
- Y. Wang, J. Wohlert, L. A. Berglund, Y. Tu and H. Ågren, J. Mater. Chem. A, 2014, 2, 9541–9547 RSC.
- M. Krishnan, M. Saharay and R. J. Kirkpatrick, J. Phys. Chem. C, 2013, 117, 20592–20609 CrossRef CAS.
- J. L. Suter and P. V. Coveney, Soft Matter, 2009, 5, 2239–2251 RSC.
- F. Gardebien, J.-L. Brédas and R. Lazzaroni, J. Phys. Chem. B, 2005, 109, 12287–12296 CrossRef CAS PubMed.
- F. Gardebien, A. Gaudel-Siri, J.-L. Brédas and R. Lazzaroni, J. Phys. Chem. B, 2004, 108, 10678–10686 CrossRef CAS.
- R. Toth, D.-J. Voorn, J.-W. Handgraaf, J. G. E. M. Fraaije, M. Fermeglia, S. Pricl and P. Posocco, Macromolecules, 2009, 42, 8260–8270 CrossRef CAS.
- G. R. Quezada, R. E. Rozas and P. G. Toledo, Miner. Eng., 2021, 162, 106741 CrossRef CAS.
- A. Jacquet, D. L. Geatches, S. J. Clark and H. C. Greenwell, Minerals, 2018, 8, 130 CrossRef.
- Q.-X. Pei, V. Sorkin, P. Liu, Y. Zhong, W. Thitsartarn, C. He and Y.-W. Zhang, J. Polym. Res., 2021, 28, 29 CrossRef CAS.
- L. Kabalan, M. M. Zagho, M. J. Al-Marri and M. M. Khader, J. Vinyl Addit. Technol., 2019, 25, 172–181 CrossRef CAS.
- W. Xu, X. Wu and W. Sun, Adv. Mech. Eng., 2016, 8, 1–8 CAS.
- K. Hagita, Y. Shudo and M. Shibayama, Polymer, 2018, 154, 62–79 CrossRef CAS.
- Y. Yang, S. Adhikari and G. Xu, Surf. Interface Anal., 2020, 52, 665–675 CrossRef CAS.
- D. Xu, D. Bhatnagar, D. Gersappe, J. C. Sokolov, M. H. Rafailovich and J. Lombardi, Macromolecules, 2015, 48, 840–846 CrossRef CAS.
- V.-H. Nguyen, S. Mahouche-Chergui, B. Carbonnier, D. Di Tommaso and S. Naili, Comput. Mater. Sci., 2017, 139, 191–201 CrossRef.
- K. Anoukou, A. Zaoui, F. Zaïri, M. Naït-Abdelaziz and J.-M. Gloaguen, Phys. E, 2015, 65, 56–60 CrossRef CAS.
- W. Sun, H. Zeng and T. Tang, J. Phys. Chem. A, 2021, 125, 1025–1035 CrossRef CAS PubMed.
- W. Sun, H. Zeng and T. Tang, Appl. Clay Sci., 2020, 193, 105654 CrossRef CAS.
- T. Jamil, J. R. Gissinger, A. Garley, N. Saikia, A. K. Upadhyay and H. Heinz, Nanoscale, 2019, 11, 11183–11194 RSC.
- R. El Haouti, H. Ouachtak, A. El Guerdaoui, A. Amedlous, E. Amaterz, R. Haounati, A. A. Addi, F. Akbal, N. El Alem and M. L. Taha, J. Mol. Liq., 2019, 290, 111139 CrossRef CAS.
- P. Mpofu, J. Addai-Mensah and J. Ralston, J. Colloid Interface Sci., 2004, 271(1), 145–156 CrossRef CAS PubMed.
- N. Tekin, A. Dinçer, Ö. Demirbaş and M. Alkan, J. Hazard. Mater., 2006, 134, 211–219 CrossRef CAS PubMed.
- R. T. Cygan, J.-J. Liang and A. G. Kalinichev, J. Phys. Chem. B, 2004, 108, 1255–1266 CrossRef CAS.
- A. Viani, A. F. Gualtieri and G. Artioli, Am. Mineral., 2002, 87, 966–975 CrossRef CAS.
- S. Plimpton, J. Comput. Phys., 1995, 117, 1–19 CrossRef CAS.
- W. L. Jorgensen, D. S. Maxwell and J. Tirado-Rives, J. Am. Chem. Soc., 1996, 118, 11225–11236 CrossRef CAS.
- H. J. C. Berendsen, J. R. Grigera and T. P. Straatsma, J. Phys. Chem., 1987, 91, 6269–6271 CrossRef CAS.
- R. W. Hockney and J. W. Eastwood, Computer simulation using particles, CRC Press, 1988 Search PubMed.
- W. Hoover, Phys. Rev. A, 1985, 31, 1695 CrossRef PubMed.
Footnotes |
| † Electronic supplementary information (ESI) available. See DOI: https://doi.org/10.1039/d2ra07341b |
| ‡ Yuanzhi Qu and Ling Lin contributed equally to this work. |
| This journal is © The Royal Society of Chemistry 2023 |