DOI:
10.1039/D2RA07310B
(Paper)
RSC Adv., 2023,
13, 6861-6871
Optical band gaps and spectroscopy properties of Bim+/Eun+/Yb3+ co-doped (m = 0, 2, 3; and n = 2, 3) zinc calcium silicate glasses†
Received
18th November 2022
, Accepted 2nd February 2023
First published on 1st March 2023
Abstract
In this study, the indirect/direct optical band gaps and spectroscopy properties of Bim+/Eun+/Yb3+ co-doped (m = 0, 2, 3; and n = 2, 3) zinc calcium silicate glasses under different excitation wavelengths were investigated. Zinc calcium silicate glasses with the main compositions of SiO2–ZnO–CaF2–LaF3–TiO2 were prepared by the conventional melting method. EDS analysis was performed to determine the elemental composition existing in the zinc calcium silicate glasses. Visible (VIS)-, upconversion (UC)-, and near-infrared (NIR)-emission spectra of Bim+/Eun+/Yb3+ co-doped glasses were also investigated. Indirect optical band gaps and direct optical band gaps of Bim+-, Eun+- single-doped, and Bim+–Eun+ co-doped SiO2–ZnO–CaF2–LaF3–TiO2–Bi2O3–EuF3–YbF3 zinc calcium silicate glasses were calculated and analyzed. CIE 1931(x, y) color coordinates for VIS and UC emission spectra of Bim+/Eun+/Yb3+ co-doped glasses were determined. Besides, the mechanism of VIS-, UC-, NIR-emissions, and energy transfer (ET) processes between Bim+ and Eun+ ions were also proposed and discussed.
1. Introduction
During the last several decades, the optical band gaps and spectroscopy properties of host materials single-doped by a rare earth (RE) atom as well as co-doped by rare earth ions (REIs), or doped by REIs together with transition metals (TMs)1,2 or pnictogen3 have been extensively studied due to their great potential for applications in many technological fields such as displays, solar cells, and medical diagnosis.4–6 Among the REIs, europium ions (Eun+) have attracted much research interest, particularly in lighting, light emitting diodes (LED), white LED (WLED), and display applications owing to the Eun+ ions favoring existing in two valence states as the Eu3+ trication and Eu2+ dication in glass materials with 5D0 → 7FJ (J=0, 1, 2, 3, and 4) and 4f65d1 → 4f7 transitions, respectively.7,8 Visible (VIS) emission spectra of Eu3+/Eu2+ ions can emit blue, green, orange, orange-red, and red color light depending on the different excitation wavelengths and host materials.9,10 Bismuth (Bi) element is the post-transition metal belonging to the pnictogen group; Bi exhibits many optoelectronic properties and exists in various valence states such as Bi5+, Bi3+, Bi2+, Bi+, and Bi0 depending on the experimental conditions and the host materials. In the VIS wavelength region, the 1P1 → 1S0 transition of Bi3+ ions can emit blue color light,11,12 and the 2S1/2-, 2P3/2(2)-, 2P3/2(1)- → 2P1/2 transitions of Bi2+ ions can emit orange, orange-red, and red color light, respectively.12,13 In the near-infrared (NIR) wavelength region, the 3P2-, 3P1- → 3P0 transitions of Bi+ ions and the 2D3/2- → 4S3/2 transition of Bi0 neutral can produce NIR emission bands from ∼1.0 to 1.35 μm.14,15 In addition, Bim+ (m = 0, 2, and 3) ions can combine with the 2F5/2 → 2F7/2 transition of Yb3+ ions to generate NIR emission spectra in the ∼950 nm to 1350 nm wavelength region.16,17 Therefore, NIR emission spectra of Bim+–Yb3+ have been extensively studied with the aim of improving the efficiency and quantum effect of NIR emission spectra utilized in solar cell applications.18,19 In recent years, many investigations focusing on the energy transfer (ET) processes from Bim+ to Eu3+ ions that can be color-tuned in the VIS emission to create light bands with different colors have been carried out. The obtained results confirmed that the energy was transferred from Bi3+ and Bi2+ ions to 5D0 → 7FJ (J=0, 1, 2, 3, and 4) transitions of Eu3+ and thus color-tuned the VIS emission spectra of Eu3+/Eu2+ ions.20–23 Besides, the measurement and calculation of the optical band gap parameters of REIs doped in different host materials have also been performed to determine the optical band gap energy (Eg) value of REIs in the host materials24 and thereby directing the relevant optical applications such as color display, LED, WLED, and solar energy. Zinc silicate glasses can be used for optical material applications due to their advantages such as high thermal expansion properties,26 relatively low glass transition temperature (Tg), and the value of ΔT = Tc − Tg greater than 100.25 Based on these advantages as well as the results obtained from a recent study,25 in this work, we chose zinc calcium silicate glass as the host material. In addition, Na2O was replaced by CaF2 to enhance the self-reduction process from Eu3+ to Eu2+ ions through F− ions.8 Simultaneously, we investigated and reported the results concerning the direct/indirect optical band gaps, VIS-, UC-, and NIR-emission spectra of Bim+/Eun+/Yb3+ co-doped in SiO2–ZnO–CaF2–LaF3–TiO2 (SZC) zinc calcium silicate glasses. Remarkably, through analyzing the optical properties of Bim+/Eun+/Yb3+ co-doped, we have also calculated and determined the direct/indirect optical band gaps values, CIE 1931 (x, y) color coordinates to develop for LED, WLED, and display applications.
2. Experimental materials and methods
2.1. Materials
Raw materials of SiO2, ZnO, CaF2, LaF3, TiO2, Bi2O3, EuF3, and YbF3 used in the experiments of this study are high-purity laboratory-grade materials (99.99%). Chemical compositions and ratios for each glass sample are listed in detail in Table 1.
Table 1 Chemical compositions and ratios of SiO2–ZnO–CaF2–LaF3–TiO2–Bi2O3–EuF3–YbF3 glasses
| Notation of glass samples |
Chemical compositions and ratios of glasses (in mol%) |
| SiO2 |
ZnO |
CaF2 |
LaF3 |
TiO2 |
Bi2O3 |
EuF3 |
YbF3 |
| SZC-1Bi |
45 |
25 |
15 |
10 |
4 |
1.0 |
0 |
0 |
| SZC-0.6Eu |
45 |
25 |
15 |
9.4 |
5 |
0 |
0.6 |
0 |
| SZC-1Bi0.6Eu |
45 |
25 |
15 |
9.4 |
4 |
1.0 |
0.6 |
0 |
| SZC-1.8Bi0.6Eu |
45 |
25 |
15 |
9.4 |
3.2 |
1.8 |
0.6 |
0 |
| SZC-1.0Bi0.6Eu2Yb |
45 |
25 |
15 |
7.4 |
4 |
1.0 |
0.6 |
2.0 |
| SZC-1.2Bi0.6Eu2Yb |
45 |
25 |
15 |
7.4 |
3.8 |
1.2 |
0.6 |
2.0 |
| SZC-1.4Bi0.6Eu2Yb |
45 |
25 |
15 |
7.4 |
3.6 |
1.4 |
0.6 |
2.0 |
| SZC-1.6Bi0.6Eu2Yb |
45 |
25 |
15 |
7.4 |
3.4 |
1.6 |
0.6 |
2.0 |
| SZC-1.8Bi0.6Eu2Yb |
45 |
25 |
15 |
7.4 |
3.2 |
1.8 |
0.6 |
2.0 |
| SZC-1.8Bi0.7Eu2Yb |
45 |
25 |
15 |
7.3 |
3.2 |
1.8 |
0.7 |
2.0 |
| SZC-1.8Bi0.8Eu2Yb |
45 |
25 |
15 |
7.2 |
3.2 |
1.8 |
0.8 |
2.0 |
| SZC-1.8Bi0.9Eu2Yb |
45 |
25 |
15 |
7.1 |
3.2 |
1.8 |
0.9 |
2.0 |
| SZC-1.8Bi1.0Eu2Yb |
45 |
25 |
15 |
7 |
3.2 |
1.8 |
1.0 |
2.0 |
| SZC-1.8Bi0.6Eu2.2Yb |
45 |
25 |
15 |
6.8 |
3.2 |
1.8 |
0.6 |
2.2 |
| SZC-1.8Bi0.6Eu2.4Yb |
45 |
25 |
15 |
6.6 |
3.2 |
1.8 |
0.6 |
2.4 |
| SZC-1.8Bi0.6Eu2.6Yb |
45 |
25 |
15 |
6.4 |
3.2 |
1.8 |
0.6 |
2.6 |
| SZC-1.8Bi0.6Eu2.8Yb |
45 |
25 |
15 |
6.2 |
3.2 |
1.8 |
0.6 |
2.8 |
2.2. Experimental methods
The raw material mixtures weighing 12 g for each experimental glass sample were crushed with an onyx mortar and pestle.8,27 These mixtures were compacted into platinum crucibles with lids.8 The platinum crucibles with lids were then placed in an electric furnace to melt at 1600 °C for 1 hour using the conventional melting method.8,27 After melting, the mixture was quenched on the surface of the polished stainless steel plate to form the glass.8 Glass samples were heat treated at 520 °C for 6 hours8,25 to increase mechanical strength and reduce the possibility of breakage when cut. For the convenience and accuracy of optical measurements, glass samples were cut to the size of 10 mm × 10 mm × 2 mm with polished surfaces and edges.8 Details for EDS analysis, absorption spectra, VIS-, UC-, and NIR-emission spectra measuring and analyzing devices have been described in detail in our recent studies.8,27–29
3. Results and discussion
3.1. EDS analysis
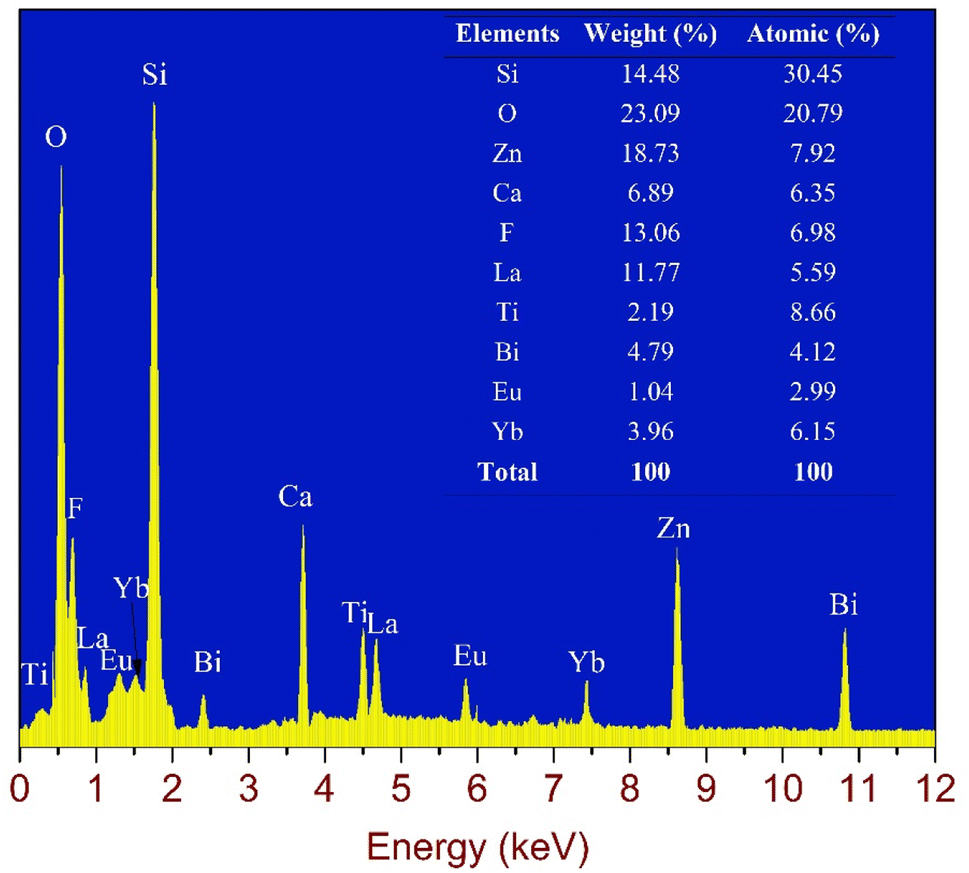
Fig. 1 shows the results of the EDS spectrum analysis of the SZC-1.0Bi0.6Eu2Yb zinc calcium silicate glass sample. Energy levels at ∼0.45 and 4.51 keV were determined for titanium (Ti) element,30 energy levels at ∼2.42 and 10.84 keV were determined for the Bi element, energy levels at ∼0.83 and 4.65 keV were attributed to lanthanum (La) element.30 Energy levels of the Eu element were defined at ∼1.13 and 5.85 keV.30 Energy levels of the ytterbium (Yb) element were also defined at ∼1.52 and 7.41 keV. Energy levels at ∼0.53, 0.68, 1.74, 3.69, and 8.63 keV were determined for oxygen (O), fluorine (F), silicon (Si), calcium (Ca), and zinc (Zn) elements, respectively.30,31 The element composition table including weight and atomic percentages of the SZC-1Bi0.6Eu2Yb zinc calcium silicate glass sample inserted in Fig. 1 also described in detail the proportions of elements present in the host glass. From the results of the EDS analysis, it can be seen that all elements Si, O, Zn, Ca, F, La, Ti, Bi, Eu, and Yb presenting in SiO2–ZnO–CaF2–LaF3–TiO2–Bi2O3–EuF3–YbF3 raw materials were distributed and existed in zinc calcium silicate glass matrix.
 |
| | Fig. 1 EDS spectrum of SZC-1.0Bi0.6Eu2Yb zinc calcium silicate glass sample. | |
3.2. Absorption spectra
Absorption spectra of SZC-1.0Bi, SZC-0.6Eu, and SZC-1.0Bi0.6Eu zinc calcium silicate glass samples in the wavelength range from 300 to 1200 nm are shown in Fig. 2. Curve (a) (black curve) in Fig. 2 is the absorption spectrum of Bim+ ions which has three main bands, generated by the transitions of Bim+ ions, with the peaks at ∼458, 653, and 700 nm, corresponding to 1S0 → 3P1 transition of Bi3+ ions,11,18,29 4S3/2 → 2P1/2 transition of Bi0 ions,14,15 and 2P1/2 → 2P3/2(1) transition of Bi2+ ions.13 We did not analyze and discuss the absorption spectrum of Bim+ (m = 0, 2, and 3) ions in detail in this study. The absorption spectrum of the SZC-0.6Eu zinc calcium silicate glass sample is shown by curve (b) (red curve) in Fig. 2. It can be observed that the absorption spectrum of this curve includes four main absorption peaks at ∼394, 434, 465, and 536 nm corresponding to transitions from 7F0 ground-state to 5L6, 5D3, 5D2, and 5D1 excited states of Eu3+ ions.7,8,32 The absorption spectrum of the SZC-1.0Bi0.6Eu zinc calcium silicate glass sample is shown by curve (c) (blue curve) of Fig. 2. This absorption spectrum includes all the absorption peaks of Bim+ and Eun+ ions present in curves (a) and (b) due to overlapping and combining absorption spectra of Bim+ and Eun+ ions.7,8,11,13,32 The images inserted in Fig. 2 are photographs of SZC-1Bi, SZC-0.6Eu, and SZC-1Bi0.6Eu zinc calcium silicate glass samples.
 |
| | Fig. 2 Absorption spectra of SZC-1.0Bi, SZC-0.6Eu, and SZC-1.0Bi0.6Eu zinc calcium silicate glass samples. | |
3.3. Optical band gaps
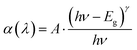
Fig. 3 shows the direct optical band gaps (DOBG) (Fig. 3a) and indirect optical band gaps (IOBG) (Fig. 3b) of SZC-1.0Bi, SZC-0.6Eu, and SZC-1.0Bi0.6Eu zinc calcium silicate glass samples. DOBG and IOBG values for SZC-1.0Bi, SZC-0.6Eu, and SZC-1.0Bi0.6Eu zinc calcium silicate glass samples can be calculated based on the absorption spectra of these glass samples, and Tauc following formula:8| |
 | (1) |
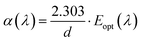
In there, γ = 1/2 for the DOBG, and γ = 2 for the IOBG; Eg is the energy gap of SZC-1.0Bi, SZC-0.6Eu, and SZC-1.0Bi0.6Eu zinc calcium silicate glass samples; (λ) is the absorption coefficient; A is a proportionality constant; ν is the frequency; h is Planck's constant; λ is the wavelength. The relation between α(λ) and hν is given by the Davis and Mott theory.33 For each glass sample, (λ) is determined based on the expression:8,33| |
 | (2) |
In there, Eopt(λ) is the absorbance; d is the thickness of SZC zinc calcium silicate glass samples.33
 |
| | Fig. 3 (a) Direct optical band gaps of SZC-1.0Bi, SZC-0.6Eu, and SZC-1.0Bi0.6Eu zinc calcium silicate glass samples. (b) Indirect optical band gaps of SZC-1.0Bi, SZC-0.6Eu, and SZC-1.0Bi0.6Eu zinc calcium silicate glass samples. | |
Thus, the DOBG values for SZC-1.0Bi, SZC-0.6Eu, and SZC-1.0Bi0.6Eu zinc calcium silicate glass samples were determined to be ∼4.01, 3.47, and 3.96 eV, respectively. Compared with the DOBG value of the SZC-0.6Eu zinc calcium silicate glass sample, the DOBG value of SZC-1.0Bi0.6Eu zinc calcium silicate glass sample was significantly greater with the energy difference ΔEg(DOBG) = 3.96 eV − 3.47 eV = 0.49 eV. The IOBG values for SZC-1.0Bi, SZC-0.6Eu, and SZC-1.0Bi0.6Eu zinc calcium silicate glass samples were determined to be ∼3.78, 2.83, and 3.65 eV, respectively. Compared with the IOBG value of the SZC-0.6Eu zinc calcium silicate glass sample, the IOBG value of the SZC-1.0Bi0.6Eu zinc calcium silicate glass sample was also increased significantly with the energy difference ΔEg(IOBG) = 3.65 eV − 2.83 eV = 0.82 eV. This result thus confirmed that both DOBG and IOBG values were significantly increased with the presence of Bim+ ions in the SZC-1.0Bi0.6Eu zinc calcium silicate glass sample. On the contrary, when comparing the DOBG and IOBG values of the SZC-1Bi sample with the corresponding DOBG and IOBG values of the SZC-1Bi0.6Eu sample, both DOBG and IOBG values of the SZC-1Bi0.6Eu sample are all significantly decreased. These results can be rationalized by the following reasons: (i) the absorption spectrum of the SZC-0.6Eu sample does not appear in the surface plasmon resonance (SPR),34 whereas for the SZC-1Bi0.6Eu, sample, the absorption spectrum appears in the SPR at the peak of ∼458 nm of Bim+ ions. Therefore, the Eopt(λ) value of the SZC-1Bi0.6Eu sample increases more than the Eopt(λ) value of the SZC-0.6Eu sample34 leading to the values of both DOBG and IOBG of the sample SZC-1Bi0.6Eu increase according to formula (1); (ii) compared with the SZC-1Bi sample, the Eopt(λ) value of the SZC-1Bi0.6Eu sample decreases linearly in the presence of Eun+ ions due to Eun+ ions combining with Bim+ ions to increase the non-bridging oxygen (NBO) bonds35 leading to the band edge shift to higher energies.35 The calculated results for DOBG and IOBG values in this work are also completely consistent with the results of previous studies36–39 and are compared in detail in Table 2. The IOBG value of SZC-1.0Bi, SZC-0.6Eu, and SZC-1.0Bi0.6Eu zinc calcium silicate glass samples showed that the green and blue curves exhibited shallow collisions centered about 2.71 eV. This result is due to both absorption spectra of SZC-1Bi and SZC-1Bi06Eu samples, the peak was at about 458 nm, corresponding to the hν = 2.71 eV, and thus it appeared the SPR attributed to Bim+ ions.
Table 2 The comparison of direct and indirect optical band gaps in this work with previous related studies36–39
| Host materials |
Doped/co-doped |
DOBG (eV) |
IOBG (eV) |
Ref. |
| Germanium-borate glasses |
1.0Bi3+ |
— |
3.43 |
X. Y. Liu et al.36 |
| Germanium-borate glasses |
1.0Bi3+/3.5Eu3+ |
— |
3.35 |
X. Y. Liu et al.36 |
| Boron glasses |
1Eu3+ |
3.529 |
3.306 |
K. Maheshvaran et al.37 |
| Boro-tellurite glasses |
1Eu3+ |
3.161 |
3.011 |
K. Maheshvaran et al.37 |
| Zinc soda lime silica glasses |
4.7Eu3+ |
3.20 |
— |
N. A. S. Omar et al.38 |
| Borosilicate glasses |
10Bi3+/0.6Eu3+ |
3.430 |
3.419 |
D. V. K. Reddy et al.39 |
| Borosilicate glasses |
10Bi3+/1Eu3+ |
3.456 |
3.449 |
D. V. K. Reddy et al.39 |
| Zinc calcium silicate glasses |
0.6Eu3+ |
3.47 |
2.83 |
This study |
| Zinc calcium silicate glasses |
1Bi3+ |
4.01 |
3.78 |
This study |
| Zinc calcium silicate glasses |
1Bi3+/0.6Eu3+ |
3.96 |
3.65 |
This study |
3.4. Visible (VIS) emission
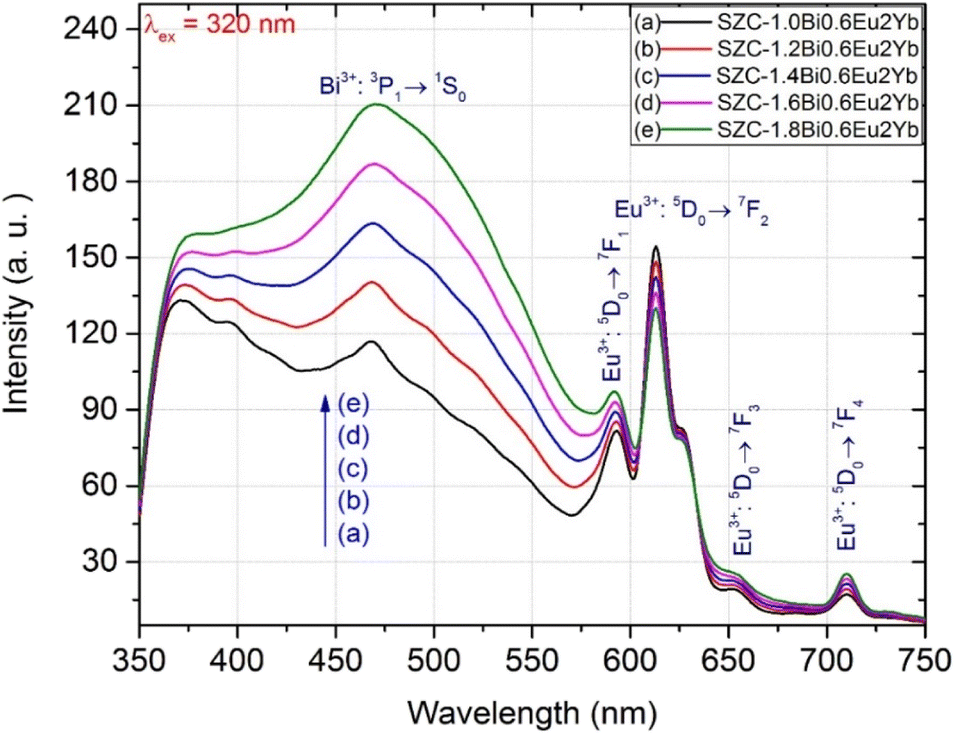
Visible (VIS) emission spectra of SZC-1.0Bi, SZC-0.6Eu, SZC-1.0Bi0.6Eu2Yb, and SZC-1.8Bi0.6Eu2Yb zinc calcium silicate glass samples under 320 nm excitation are shown in Fig. 4. For the SZC-1.0Bi zinc calcium silicate glass sample, VIS emission spectra of Bim+ ions were observed consisting of two peaks at ∼457 and 720 nm, which are attributed to VIS emissions from 3P1 → 1S0 transition of Bi3+11 and 2P3/2(1) → 2P1/2 transition of Bi2+,12,13 respectively. For the SZC-0.6Eu zinc calcium silicate glass sample, VIS emission spectra of Eu3+/Eu2+ ions were observed in a band from ∼373 to 468 nm, attributed to VIS emission from 4f65d1 → 4f7 transition of Eu2+ ions,7,8 and four VIS emission peaks at ∼593, 613, 654, and 710 nm attributed to 5D0 → 7FJ (J=1, 2, 3, and 4) transitions of Eu3+ ions.20,21 For the SZC-1.0Bi0.6Eu2Yb and SZC-1.8Bi0.6Eu2Yb zinc calcium silicate glass samples, VIS emission intensity of Eu3+/Eu2+ ions in the band of 373–468 nm was significantly increased due to ET process from Bi3+ to Eu2+ ions. The remaining VIS emission spectra of Eu3+ ions peaks at ∼593, 613, 654, and 710 nm were also observed.21,22 However, the VIS emission spectra of Bi2+ ions peak at ∼720 nm have ceased to exist and can not be observed. This result also means that the energy from the 2P3/2(1) → 2P1/2 transition of Bi2+ ions is transferred to 5D0 → 7F4 neighboring transition of Eu3+ ions.20–22
 |
| | Fig. 4 VIS emission spectra of SZC-1.0Bi, SZC-0.6Eu, SACL-1.0Bi0.6Eu2Yb and SACL-1.8Bi0.6Eu2Yb zinc calcium silicate glass samples under 320 nm excitation. | |
VIS emission spectra of SZC-xBi0.6Eu2Yb (x = 1.0, 1.2, 1.4, 1.6, and 1.8 mol%) zinc calcium silicate glass samples under 320 nm excitation are shown in Fig. 5. With the increasing of Bim+ concentrations from 1.0 up to 1.8 mol%, the VIS emission intensity of the peak at ∼468 nm was strongly increased. At the same time, the VIS emission intensity of the peaks at ∼593, 613, 654, and 710 nm of Eu3+ were also increased. This proves that the energy from 3P1 → 1S0 transition of Bi3+ ions11,12 and 2P3/2(1) → 2P1/2 transition of Bi2+ ions17,18 is transferred to 5D0 → 7FJ (J=1, 2, 3, and 4) transitions of Eu3+ ions.7,8,32
 |
| | Fig. 5 VIS emission spectra of SZC-xBi0.6Eu2Yb (x = 1.0, 1.2, 1.4, 1.6, and 1.8 mol%) zinc calcium silicate glass samples under 320 nm excitation. | |
For the Eu3+/Eu2+-doped and Bim+/Eu3+/Eu2+ co-doped in the glass materials, the determination of color coordinates is significant for LED, WLED, and color display applications. Therefore, we calculated and determined CIE 1931 (x, y) color coordinates for these samples using the CIE chromaticity coordinates calculation software. CIE 1931 (x, y) color coordinates for the VIS emission spectra of SZC-0.6Eu and SZC-xBi0.6Eu2Yb (x = 1.0, 1.2, 1.4, 1.6, and 1.8 mol%) zinc calcium silicate glass samples under 320 nm excitation are described in detail in Fig. 6. For the Eu3+/Eu2+-doped in SZC-0.6Eu zinc calcium silicate glass sample, CIE 1931 (x, y) color coordinates for VIS emission were determined at P0 point in the pink region. For the Bim+/Eun+ co-doped in SZC-xBi0.6Eu2Yb (x = 1.0, 1.2, 1.4, 1.6, and 1.8 mol%) zinc calcium silicate glass samples, CIE 1931 (x, y) color coordinates were determined at P1, P2, P3, P4, and P5 points in the white pink region, which is the neighborhood around black body curve. CIE 1931 (x, y) color coordinates of P0, P1, P2, P3, P4, and P5 points are listed in detail in Table 3.
 |
| | Fig. 6 CIE 1931 (x, y) color coordinates for VIS emission of SZC-0.6Eu and SZC-xBi0.6Eu2Yb (x = 1.0, 1.2, 1.4, 1.6, and 1.8 mol%) zinc calcium silicate glass samples under 320 nm excitation. | |
Table 3 CIE 1931 (x, y) color coordinates of SZC-0.6Eu and SZC-xBi0.6Eu2Yb (x = 1.0, 1.2, 1.4, 1.6, and 1.8 mol%) zinc calcium silicate glass samples under 320 nm excitation
| Glass samples |
Position on CIE 1931 chromaticity diagram |
CIE 1931 (x) |
CIE 1931 (y) |
| SZC-0.6Eu |
P0 |
0.2534 |
0.2902 |
| SZC-1.0Bi0.6Eu2Yb |
P1 |
0.2992 |
0.2801 |
| SZC-1.2Bi0.6Eu2Yb |
P2 |
0.2832 |
0.2837 |
| SZC-1.4Bi0.6Eu2Yb |
P3 |
0.2710 |
0.2865 |
| SZC-1.6Bi0.6Eu2Yb |
P4 |
0.2614 |
0.2886 |
| SZC-1.8Bi0.6Eu2Yb |
P5 |
0.2537 |
0.2904 |
3.5. Upconversion (UC) emission
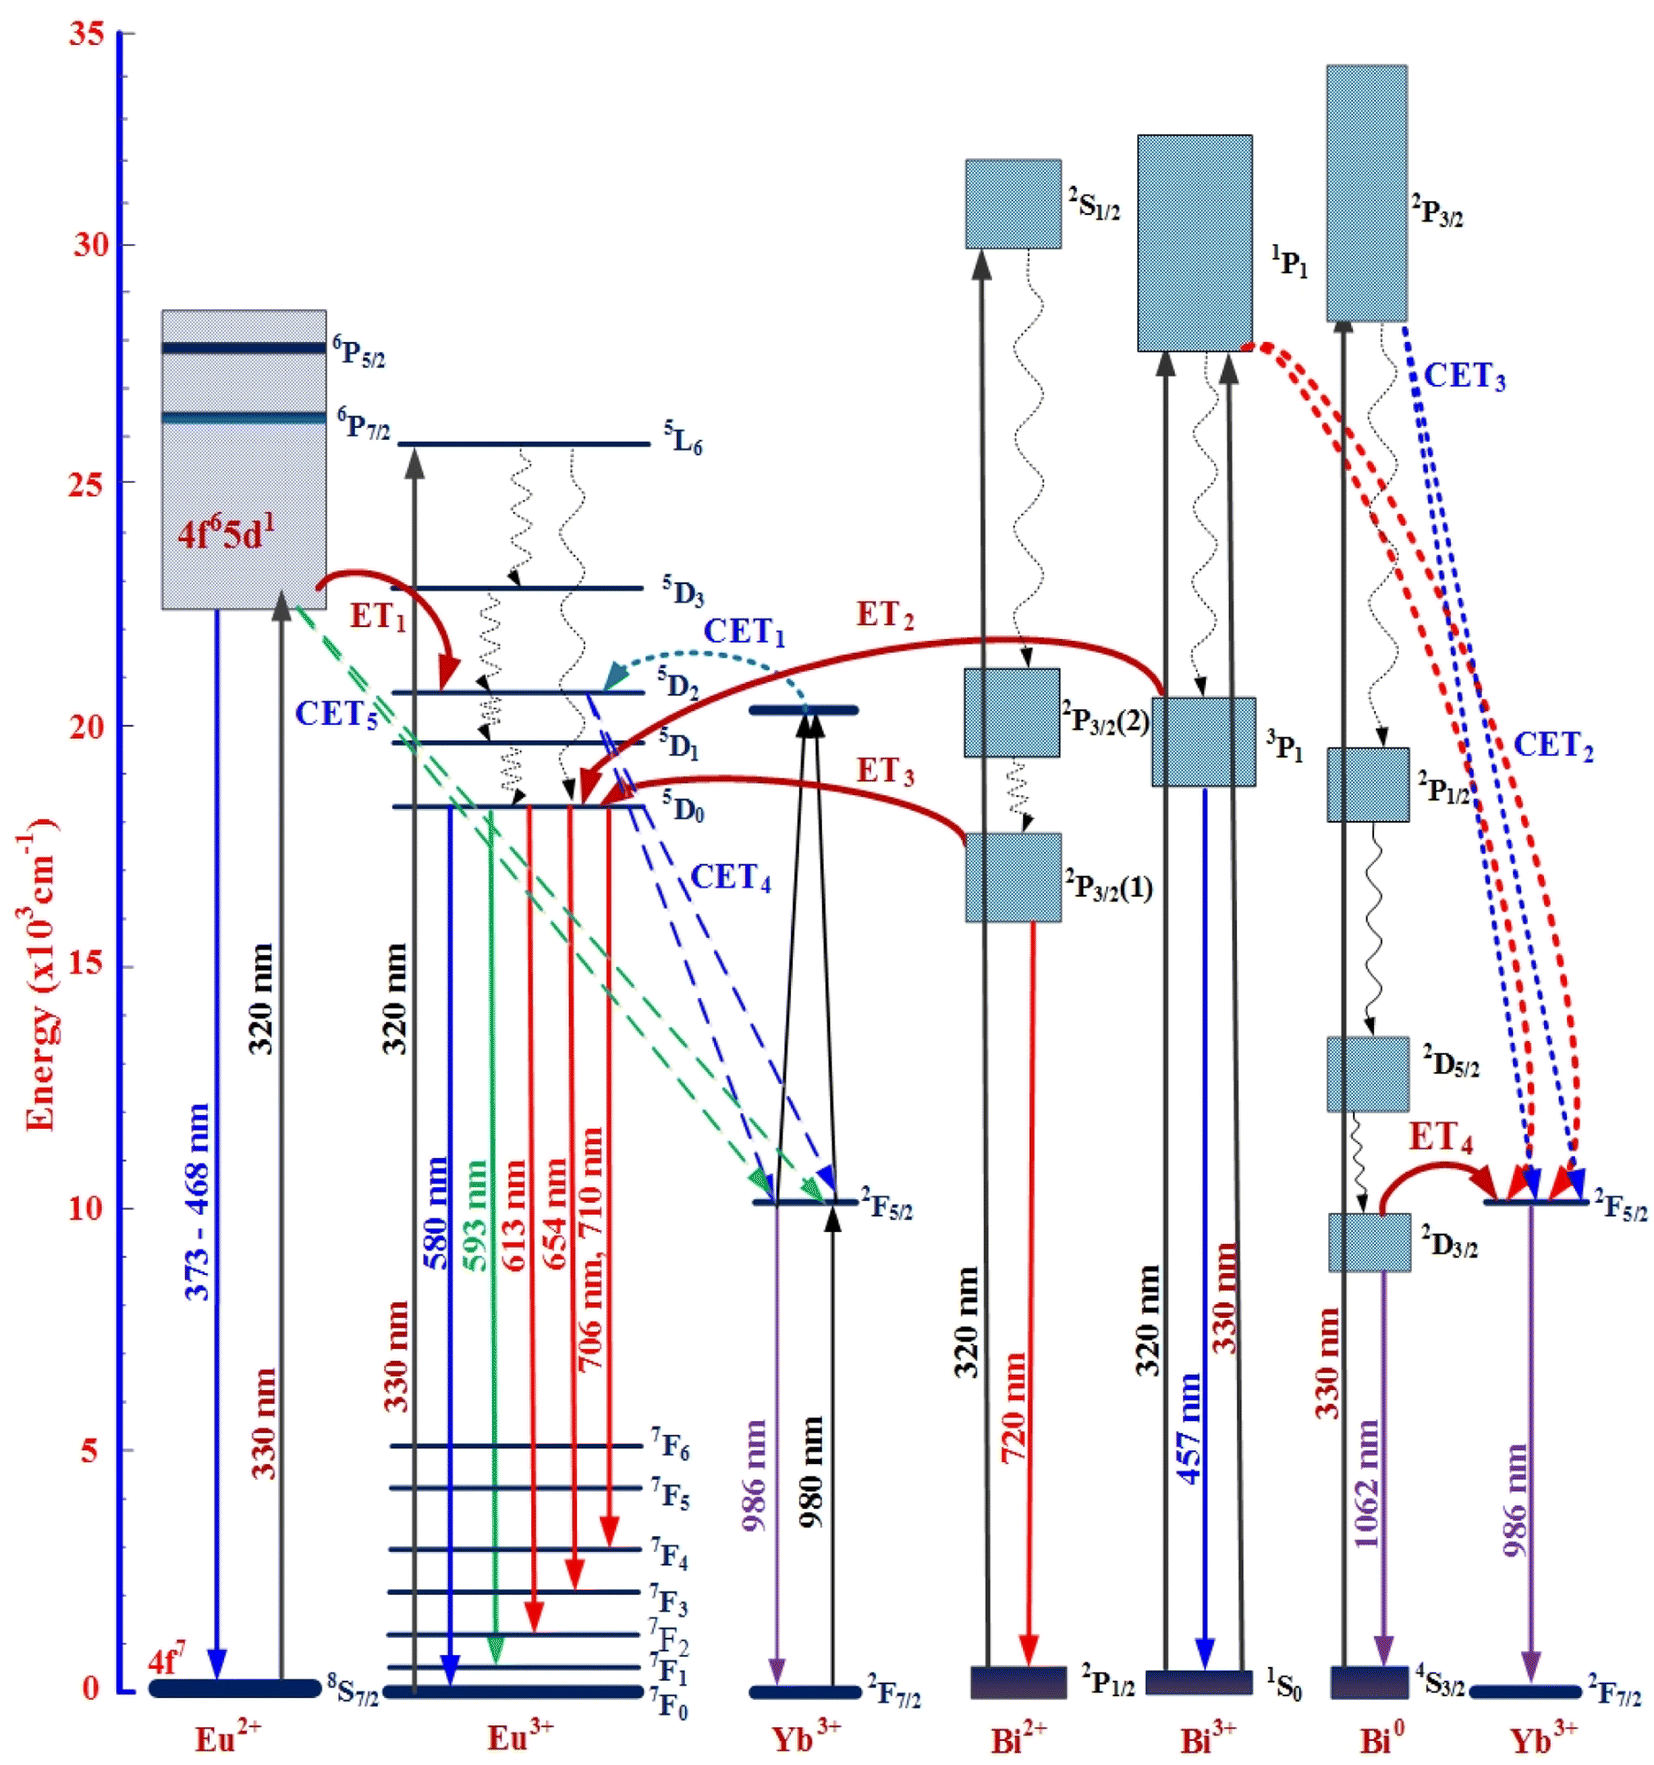
Fig. 7 shows the UC emission spectra of SZC-1.8BiyEu2Yb (y = 0.6, 0.7, 0.8, 0.9, and 1.0 mol%) zinc calcium silicate glass samples under 980 nm LD excitation. From the results presented in Fig. 7, we can determine that the UC emission peaks at ∼580, 593, 613, 654, and 706 nm, which are attributed to 5D0 → 7FJ (J=0, 1, 2, 3, and 4) transitions of Eu3+ ions.40 Under 980 nm LD excitation, UC emission of Bim+ ions was hardly observed at any peaks. At the same time, when increasing the Eu3+/Eu2+ concentrations from 0.6 up to 1.0 mol%, UC emission intensity of Eu3+ peaks at ∼580, 593, 613, 654, and 706 nm was significantly increased.41,42 The mechanism of the UC process of Bim+/Eun+/Yb3+ co-doped is depicted in Fig. 10. When excited at the wavelength of 980 nm, two Yb3+ ions are formed Yb3+–Yb3+ pairs. Through the CET 1 process, the photons are transferred to the 5D2 level of Eu3+. Then the photons rapidly transfer to the 5D0 level via the non-radiative transition. The 5D0 → 7FJ (J = 4, 3, 2, 1 and 0) transitions of Eu3+ produce the UC emissions peaks at ∼580, 593, 613, 654, and 706 nm, respectively.
 |
| | Fig. 7 UC emission spectra of SZC-1.8BiyEu2Yb (y = 0.6, 0.7, 0.8, 0.9, and 1.0 mol%) zinc calcium silicate glass samples. | |
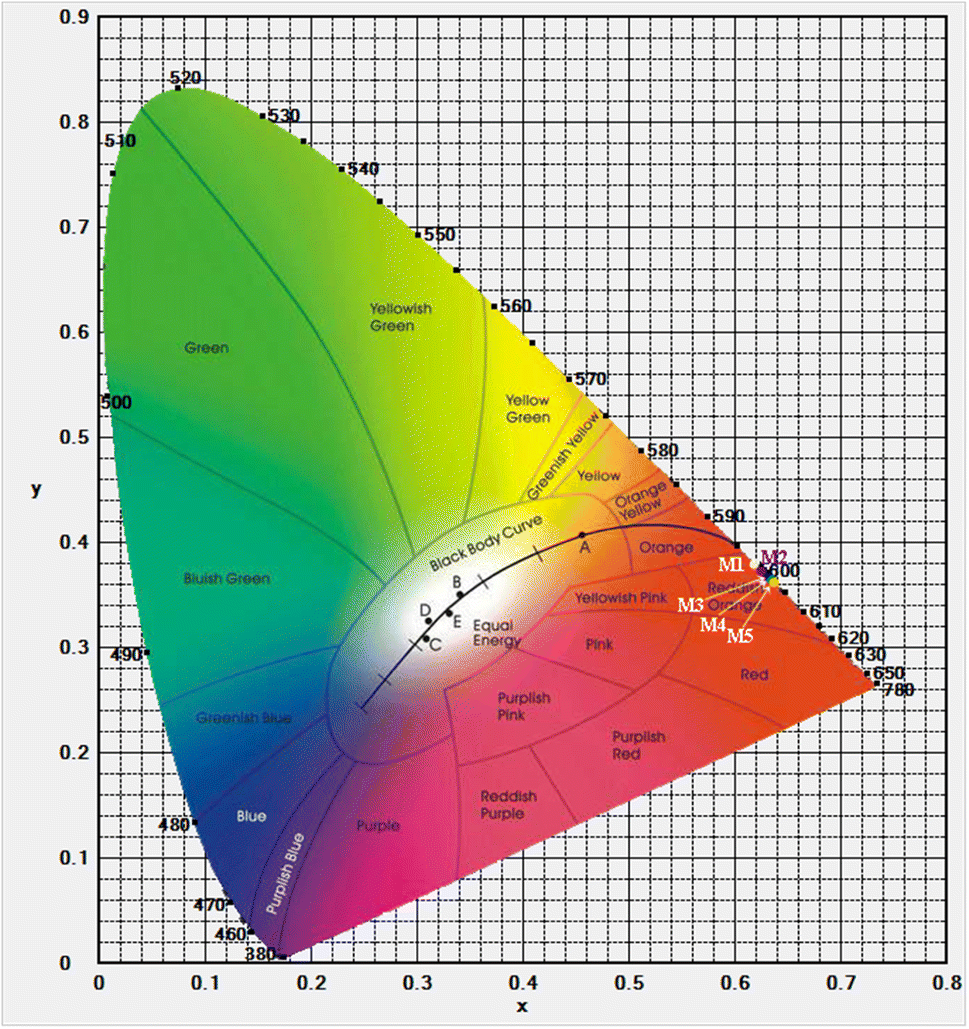
CIE 1931 (x, y) coordinates for the UC emission spectra of SZC-1.8BiyEu2Yb (y = 0.6, 0.7, 0.8, 0.9, and 1.0 mol%) zinc calcium silicate glass samples under 980 nm LD excitation is also described in detail in Fig. 8. Based on the results in Fig. 8, it can be seen that the CIE 1931 (x, y) color coordinates for UC emission spectra of SZC-1.8BiyEu2Yb (y = 0.6, 0.7, 0.8, 0.9 and 1.0 mol%) zinc calcium silicate glass samples were determined at M1, M2, M3, M4, and M5 points in the reddish-orange region. For the SZC-1.8Bi0.8Eu2Yb, SZC-1.8Bi0.9Eu2Yb, and SZC-1.8Bi1.0Eu2Yb zinc calcium silicate glass samples, although the UC emission intensity at ∼580, 593, 613, 654, and 706 nm was significantly increased, but CIE 1931 (x, y) color coordinates changed very little, the M3, M4, and M5 points almost coincide. CIE 1931 (x, y) color coordinates of M1, M2, M3, M4, and M5 points are listed in detail in Table 4. Moreover, the comparison of the CIE 1931 (x, y) color coordinates in this study with those in a few previous related studies4,36,43–47 is presented in Table 5. From the results revealed in Table 5, we can confirm that with the difference of the host materials, the ratio of Bi3+/Eu3+ concentrations, and the excitation wavelength, the CIE 1931 (x, y) color coordinates also changes differently.
 |
| | Fig. 8 CIE 1931 (x, y) for UC emission spectra of SZC-1.8BiyEu2Yb (y = 0.6, 0.7, 0.8, 0.9, and 1.0 mol%) zinc calcium silicate glass samples under 980 nm LD excitation. | |
Table 4 CIE 1931 (x, y) color coordinates of SZC-1.8BiyEu2Yb (y = 0.6, 0.7, 0.8, 0.9, and 1.0 mol%) zinc calcium silicate glass samples under 980 nm LD excitation
| Glass samples |
Position on CIE 1931 chromaticity diagram |
CIE 1931 (x) |
CIE 1931 (y) |
| SZC-1.8Bi0.6Eu2Yb |
M1 |
0.6239 |
0.3756 |
| SZC-1.8Bi0.7Eu2Yb |
M2 |
0.6293 |
0.3703 |
| SZC-1.8Bi0.8Eu2Yb |
M3 |
0.6317 |
0.3679 |
| SZC-1.8Bi0.9Eu2Yb |
M4 |
0.6321 |
0.3675 |
| SZC-1.8Bi1.0Eu2Yb |
M5 |
0.6322 |
0.3674 |
Table 5 The CIE 1931 (x, y) color coordinates in this work in comparison with those in previous related studies.4,36,43–47
| Host materials |
Doped/co-doped |
λex (nm) |
CIE 1931(x, y) |
Color region |
Ref. |
| Germanium-borate glasses |
1.0Bi3+/0.5Eu3+ |
345 |
(0.356, 0.325) |
White |
X. Y. Liu et al.36 |
| Germanium-borate glasses |
1.0Bi3+/3.5Eu3+ |
345 |
(0.562, 0.371) |
Reddish orange |
X. Y. Liu et al.36 |
| Ba2Y5B5O17 phosphors |
0.0005Bi3+/0.4Eu3+ |
365 |
(0.415, 0.359) |
Orange pink |
G. Annadurai et al.43 |
| Lu2Ge2O7 phosphors |
0.06Bi3+/0.2Eu3+ |
290 |
(0.558, 0.232) |
Purplish red |
Q. F. Li et al.4 |
| (Ba, Sr)3Sc4O9 solid solution compounds |
0.03Bi3+/0.3Eu3+ |
330 |
(0.575, 0.340) |
Reddish orange |
P. P. Dang et al.44 |
| Silicate glasses |
2Bi3+/0.3Eu3+ |
333 |
(0.595, 0.352) |
Reddish orange |
O. G. Giraldo et al.45 |
| KY3F10 oxyfluoride glass-ceramics |
0.3Bi3+/0.4Eu3+ |
280 |
(0.2969, 0.2275) |
Reddish purple |
B. C. Yu et al.46 |
| LaNbO4 phosphor |
0.12Eu3+/0.05Yb3+ |
980 |
(0.560, 0.390) |
Orange |
A. Dwivedi et al.47 |
| Zinc calcium silicate glasses |
0.6Eu3+ |
320 |
(0.2534, 0.2902) |
Pink |
This study |
| Zinc calcium silicate glasses |
1Bi3+/0.6Eu3+/2Yb3+ |
320 |
(0.2992, 0.2801) |
Purplish blue (near the white area) |
This study |
| Zinc calcium silicate glasses |
1.8Bi3+/0.6Eu3+/2Yb3+ |
980 |
(0.6239, 0.3756) |
Reddish orange |
This study |
3.6. NIR emission
NIR emission spectra of SZC-1Bi0.6EuzYb (z = 2.0, 2.2, 2.4, 2.6, and 2.8 mol%) zinc calcium silicate glass samples under excitation of 330 nm are shown in Fig. 9. It can be observed that the NIR emission spectra of Bim+/Eun+/Yb3+ co-doped (m = 0, 2, 3 and n = 2, 3) consist of two emission peaks at ∼986 and 1062 nm, which the NIR emission of Bim+/Eun+/Yb3+ co-doped peak at ∼986 nm due to 2F5/2 → 2F7/2 transition of Yb3+ ions,48 while the NIR emission peak at ∼1062 nm can be attributed to 2D3/2 → 4S3/2 transition of Bi0 ions.48–50 In the NIR range of ∼960–1040 nm, NIR emission spectra of Bim+/Eun+/Yb3+ co-doped produced a bandwidth of ∼40 nm. However, according to many previous reports, it has been attributed the NIR emission at ∼1062 nm to Bi0 ions because Bi-dopant exists at three states including Bi3+, Bi+, and Bi0 ions that can emit in NIR range from ∼950 to 1500 nm,.12,15–17 It thus has been confirmed that (i) NIR emission of Bi-doped peak around 1100 nm was attributed to Bi0 ions;38 (ii) the NIR emission spectrum of Bi3+ ions was unobserved in the NIR wavelength range15–17 and that NIR emission of Bi3+ under different excitation wavelengths is usually emitted from ∼1250 to 1500 nm.11,39 With the increase of Yb3+ concentrations from 2.0 up to 2.8 mol% and Bim+ concentrations remained unchanged, NIR emission intensity of Bi0 ions peak at ∼1062 nm was decreased. This result has confirmed that ET from 2D3/2 → 4S3/2 transition of Bi0 ions to 2F5/2 → 2F7/2 transition of Yb3+ ions has occurred. At the same time, the NIR emission intensity of Bim+/Eun+/Yb3+ co-doped peak at ∼986 nm was strongly increased due to the energy contribution of cooperative ET (CET)4 and CET5 processes from Eu3+ and Eu2+ ions to Yb3+ ions.40,41
 |
| | Fig. 9 NIR emission spectra of SZC-1Bi0.6EuzYb (z = 2.0, 2.2, 2.4, 2.6, and 2.8 mol%) zinc calcium silicate glass samples. | |
Mechanism of CETI (I from 1 to 5) and ETJ (J from 1 to 4) processes among Eun+, Bim+, and Yb3+ ions in SZC zinc calcium silicate glasses are described and defined in detail in Fig. 10. CETI (I from 1 to 5) and ETJ (J from 1 to 4) processes were described as follows:50–52
| CET1: (2F7/2 + 2F5/2)(Yb3+) + 5D2(Eu3+) → (2F7/2 + 2F7/2)(Yb3+) + 7F0(Eu3+). |
| CET2: 2P1/2(Bi3+) + 2F7/2(2Yb3+) → 1S0(Bi3+) + 2F5/2(2Yb3+). |
| CET3: 1S0(Bi0) + 2F7/2(2Yb3+) → 4S3/2(Bi0) + 2F5/2(2Yb3+). |
| CET4: 5D2(Eu3+) + 2F7/2(2Yb3+) → 7F0(Eu3+) + 2F5/2(2Yb3+.) |
| CET5: 4f65d(Eu2+) + 2F7/2(2Yb3+) → 4f7(Eu2+) + 2F5/2(2Yb3+). |
| ET1: 4f65d(Eu2+) + 7F0(Eu3+) → 5D2(Eu3+) + 4f7(Eu2+). |
| ET2: 3P1(Bi3+) + 7F0(Eu3+) → 5D0(Eu3+) + 1S0(Bi3+). |
| ET3: 2P1/2(1)(Bi2+) + 7F0(Eu3+) → 5D0(Eu3+) + 2P1/2(Bi2+). |
| ET4: 2D3/2(Bi0) + 2F7/2(Yb3+) → 2F5/2(Yb3+) + 4S3/2(Bi0). |
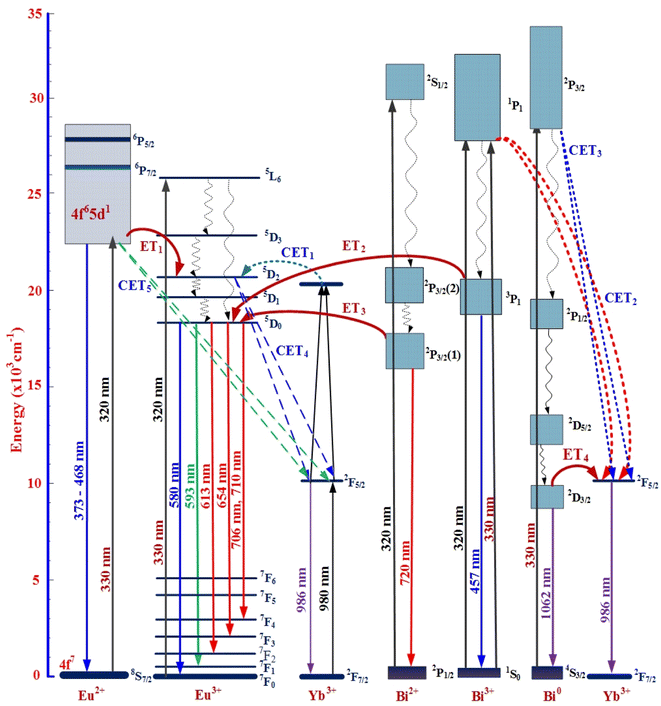 |
| | Fig. 10 Energy levels, VIS-, UC-, NIR-emissions and mechanism of CETI (I from 1 to 5), and ETJ (J from 1 to 4) processes between Bim+, Eun+, and Yb3+ in SZC zinc calcium silicate glasses. | |
4. Conclusions
In this work, we have successfully synthesized zinc calcium silicate glass with the main compositions of SiO2–ZnO–CaF2–LaF3–TiO2–Bi2O3–EuF3–YbF3. The DOBG and IOBG values for Bim+/Eun+ co-doped in SZC-1.0Bi0.6Eu zinc calcium silicate glass samples were determined at ∼3.65 and 3.96 eV, respectively. Both of these values were increased in the presence of Bim+ ions in SZC-1.0Bi0.6Eu zinc calcium silicate glass samples. Under the excitation of 320 nm, VIS emission spectra of Bim+/Eun+/Yb3+ co-doped were observed in the peaks at ∼468, 593, 613, 654, and 710 nm attributed to Bi3+, Bi2+, Eu3+, and Eu2+ ions. CIE 1931 (x, y) color coordinates for VIS emission spectra of Bim+/Eun+/Yb3+ co-doped zinc calcium silicate glass samples were determined in the white-pink region neighborhood around the black body curve. UC emission spectra of Bim+/Eun+/Yb3+ co-doped were observed in the peaks at ∼580, 593, 613, 654, and 706 nm attributed to Eu2+ ions. CIE 1931 (x, y) color coordinates for UC emission spectra of Bim+/Eun+/Yb3+ co-doped zinc calcium silicate glass samples were determined in the reddish-orange region. NIR emission spectra of Bim+/Eun+/Yb3+ co-doped have two emission peaks at ∼986 and 1062 nm, attributed to Yb3+ and Bi0 ions, respectively. NIR emission spectra of Bim+/Eun+/Yb3+ co-doped produced a bandwidth of ∼40 nm in the wavelength range of ∼960 to 1040 nm. The energy from 3P1 → 1S0 transition of Bi3+ ions and 2P3/2(1) → 2P1/2 transition of Bi2+ ions transferred to 5D0 → 7FJ (J=1, 2, 3, and 4) transitions of Eu3+ ions and ET process from 2D3/2 → 4S3/2 transition of Bi0 ions to 2F5/2 → 2F7/2 transition of Yb3+ ions also occurred. The Bim+/Eun+/Yb3+ co-doped zinc calcium silicate glasses in this study can be further developed for LED, WLED, display, and solar cell applications.
Conflicts of interest
There are no conflicts to declare.
Acknowledgements
This research is funded by Projects B2022-TNA-37 of the Vietnam Ministry of Education and Training. The author Ho Kim Dan would like to express his gratitude to Van Lang University.
References
- A. D. Sontakke, A. J. van Bunningen, F. T. Rabouw, S. Meijers and A. Meijerink, Unraveling the Eu2+ → Mn2+ energy transfer mechanism in W-LED phosphors, J. Phys. Chem. C, 2020, 124(25), 13902–13911, DOI:10.1021/acs.jpcc.0c03425.
- H. K. Dan, D. C. Zhou, R. F. Wang, Q. Jiao, Z. W. Yang, Z. G. Song, X. Yu and J. B. Qiu, Effect of Mn2+ ions on the enhancement red upconversion emission and energy transfer of Mn2+/Tm3+/Yb3+ tri-doped transparent glass-ceramics, Mater. Res. Bull., 2016, 73, 357–361, DOI:10.1016/j.materresbull.2015.09.019.
- X. Yu, L. Zhang, X. H. Xu, T. Wang, H. L. Yu, T. M. Jiang, Q. Jiao, Z. W. Yang, D. C. Zhou and J. B. Qiu, Development of a single-phased Ca3SnSi2O9: Bi3+, Dy3+, Eu3+ phosphor with tri-colors for white light-emitting diodes, J. Lumin., 2014, 145, 114–118, DOI:10.1016/j.jlumin.2013.07.009.
- Q. F. Li, S. A. Zhang, W. X. Lin, W. F. Li, Y. X. Li, Z. F. Mu and F. G. Wu, A warm white emission of Bi3+-Eu3+ and Bi3+-Sm3+ codoping Lu2Ge2O7 phosphors by energy transfer of Bi3+-sensitized Eu3+/Sm3+, Spectrochim. Acta, Part A, 2020, 228(5), 117755, DOI:10.1016/j.saa.2019.117755.
- Y. Zhydachevskyy, I. I. Syvorotkac, V. Tsiumraa, M. Barand, L. Lipińskad, A. Wierzbickaa and A. Suchocki, Quantum efficiency of the down-conversion process in Bi3+-Yb3+ and Ce3+-Yb3+ co-doped garnets, Sol. Energy Mater. Sol. Cells, 2018, 185, 240–251, DOI:10.1016/j.solmat.2018.05.037.
- X. Liu, C. Chen, S. Li, Y. Dai, H. Guo, X. Tang, Y. Xie and L. Yan, Host-sensitized and tunable luminescence of GdNbO4:Ln3+ (Ln3+ = Eu3+/Tb3+/Tm3+) nanocrystalline phosphors with abundant color, Inorg. Chem., 2016, 55, 10383–10396, DOI:10.1021/acs.inorgchem.6b01637.
- Y. D. Ma, M. Z. Fei, W. N. Zhang, L. M. Teng, F. F. Hu, R. F. Wei and H. Guo, Energy transfer and tunable luminescent properties in Eu2+/Tb3+/Eu3+ co-doped oxyfluoride aluminosilicate glass, J. Lumin., 2020, 219, 116966, DOI:10.1016/j.jlumin.2019.116966.
- H. K. Dan, N. D. Trung, T. H. Le, N. L. Thai, N. M. Ty, D. C. Zhou and J. B. Qiu, Influence of F− on the reduction process of Eu3+ to Eu2+ and optical properties of Eu3+/Eu2+–Er3+–Yb3+ co-doped niobate silicate glasses, J. Non-Cryst. Solids, 2022, 581, 121417, DOI:10.1016/j.jnoncrysol.2022.121417.
- W. P. Chen, Y. J. Ouyang, M. Mo, H. Z. Zhang and Q. Su, Observation of energy transfer from Eu2+ to Eu3+ and tunable luminescence in phosphors YF3:Eu prepared by hydrothermal method, J. Lumin., 2021, 229, 117672, DOI:10.1016/j.jlumin.2020.117672.
- H. Bouchouicha, G. Panczer, D. de Ligny, Y. Guyot, M. L. Baesso, L. H. C. Andrade, S. M. Lima and R. Ternane, Synthesis and luminescent properties of Eu3+/Eu2+ co-doped calcium aluminosilicate glass - ceramics, J. Lumin., 2016, 169, 528–533, DOI:10.1016/j.jlumin.2014.11.054.
- Q. S. Wu, Y. Y. Li, Y. J. Wang, H. Liu, S. S. Ye, L. Zhao, J. Y. Ding and J. C. Zhou, A novel narrow-band blue-emitting phosphor of Bi3+-activated Sr3Lu2Ge3O12 based on a highly symmetrical crystal structure used for WLEDs and FEDs, Chem. Eng. J., 2020, 401, 126130, DOI:10.1016/j.cej.2020.126130 , https://www.sciencedirect.com/journal/chemical-engineering-journal/vol/401/suppl/C1.
- M. Puchalska, P. Bolek, K. Kot and E. Zych, Luminescence of Bi3+ and Bi2+ ions in novel Bi-doped SrAl4O7 phosphor, Opt. Mater., 2020, 107, 109999, DOI:10.1016/j.optmat.2020.109999.
- R. P. Cao, M. Y. Peng and J. R. Qiu, Photoluminescence of Bi2+-doped BaSO4 as a red phosphor for white LEDs, Opt. Express, 2012, 20(S6), A977–A983, DOI:10.1364/OE.20.00A977.
- N. Zhang, K. N. Sharafudeen, G. P. Dong, M. Y. Peng and J. R. Qiu, Mixed network effect of broadband near-infrared emission in Bi-Doped B2O3-GeO2 glasses, J. Am. Ceram. Soc., 2012, 95(12), 3842–3846, DOI:10.1111/jace.12016.
- R. F. Wang, J. Liu and Z. Zhang, Luminescence and energy transfer progress in Bi-Yb co-doped germanate glass, J. Alloys Compd., 2016, 688, 332–336, DOI:10.1016/j.jallcom.2016.07.152.
- Y. P. Tai, B. L. Pan, X. G. Du, H. Y. Liu, R. Q. Niu and X. Z. Li, Broadband downconversion in Bi3+-Yb3+-codoped transparent glass ceramics containing LaF3 nanocrystals, J. Mater. Sci.: Mater. Electron., 2020, 31, 5117–5123, DOI:10.1007/s10854-020-03072-9.
- A. J. Huang, Z. W. Yang, C. Y. Yu, Z. Z. Chai, J. B. Qiu and Z. G. Song, Near-infrared quantum cutting luminescence and energy transfer mechanism of Ba2Y(BO3)2Cl: Bi3+, Yb3+ phosphors, IEEE Photonics J., 2018, 10, 8400307, DOI:10.1109/JPHOT.2017.2782842.
- L.-T. Lin, J.-Q. Chen, C. Deng, L. Tang, D.-J. Chen, J.-X. Meng and L.-W. Cao, Broadband near-infrared quantum-cutting by cooperative energy transfer in Yb3+–Bi3+ co-doped CaTiO3 for solar cells, J. Alloys Compd., 2015, 640, 280–284, DOI:10.1016/j.jallcom.2015.04.031.
- E. Lee, R. E. Kroon, J. J. Terblans and H. C. Swart, Luminescence properties of Y2O3: Bi3+, Yb3+ co-doped phosphor for application in solar cells, Phys. B, 2018, 535(15), 102–105, DOI:10.1016/j.physb.2017.06.072.
- R. P. Cao, Z. Y. Huang, B. Lan, L. Li, X. H. Yi, Z. Y. Luo, C. X. Liao and J. Wang, Adjustable luminescence properties of Eu3+ and Bi3+ codoped Ca3Zn3Te2O12 phosphor, Mater. Res. Bull., 2022, 152, 111851, DOI:10.1016/j.materresbull.2022.111851 , https://www.sciencedirect.com/journal/materials-research-bulletin/vol/152/suppl/C.
- H. Zhang, M. S. Liao, Y. Jiao, W. C. Li, H. H. Dong, Y. Z. Fang, W. Q. Gao and L. L. Hu, Color-tunable emissions in Bi3+/Eu3+ activated phosphors for multi-mode optical thermometers, Ceram. Interfaces, 2022, 48(22), 33072–33081, DOI:10.1016/j.ceramint.2022.07.240 , https://www.sciencedirect.com/journal/ceramics-international/vol/48/issue/22.
- L. D. Guo, T. Li, C. C. Zhu, W. C. Liang and L. N. Wu, Tunable luminescent chromaticity of CaZnOS: Bi3+, Eu3+ with white emitting based on energy transfer, J. Alloys Compd., 2022, 905, 164262, DOI:10.1016/j.jallcom.2022.164262.
- Z. Tang, J. Q. Qi, Z. Y. Huang, L. X. Liang, A. J. Liu, Y. C. Ye, Y. T. Zhang and T. C. Lu, Novel multicolor-tunable Eu3+/Bi3+ co-doped Y2Zr2O7 transparent ceramics as potential white-light-emitting materials, Ceram. Interfaces, 2022, 48(3), 4216–4222, DOI:10.1016/j.ceramint.2021.10.213 , https://www.sciencedirect.com/journal/ceramics-international/vol/48/issue/22.
- E. Erol, N. Vahedigharehchopogh, O. Kıbrıslı, M. C. Ersundu and A. E. Ersundu, Recent progress in lanthanide-doped luminescent glasses for solid-state lighting applications - a review, J. Phys.: Condens. Matter, 2021, 33, 483001, DOI:10.1088/1361-648X/ac22d9.
- H. K. Dan, N. M. Ty, D. C. Zhou, J. B. Qiu and A.-. L. Phan, Influence of Cr3+ on yellowish-green UC emission and energy transfer of Er3+/Cr3+/Yb3+ tri-doped zinc silicate glasses, J. Am. Ceram. Soc., 2020, 103(11), 1–13, DOI:10.1111/jace.17359.
- D. Ehrt and S. Flügel, Properties of zinc silicate glasses and melts, J. Mater. Sci. Eng., 2011, A 1, 312–320 Search PubMed.
- H. K. Dan, D. C. Zhou, R. F. Wang, Q. Jiao, Z. W. Yang, Z. G. Song, X. Yu and J. B. Qiu, Effect of Mn2+ ions on the enhancement upconversion emission and energy transfer of Mn2+/Tb3+/Yb3+ tri-doped transparent glass-ceramics, Mater. Lett., 2015, 150, 76–80, DOI:10.1016/j.matlet.2015.03.005.
- H. K. Dan, A.-. L. Phan, N. M. Ty, D. C. Zhou and J. B. Qiu, Optical bandgaps and visible/near-infrared emissions of Bin+-doped (n = 1, 2, and 3) fluoroaluminosilicate glasses via Ag+-K+ ions exchange process, Opt. Mater., 2021, 112, 110762, DOI:10.1016/j.optmat.2020.110762.
- H. K. Dan, T. D. Tap, H. Nguyen-Truong, N. M. Ty, D. C. Zhou and J. B. Qiu, Effects of heat treatment and Yb3+ concentration on the downconversion emission of Er3+/Yb3+ co-doped transparent silicate glass-ceramics, Mater. Res., 2019, 22(5), e20190113, DOI:10.1590/1980-5373-MR-2019-0113.
- Y. G. Liao, X-Ray emission lines & Periodic table for EDS Analysis, Practical Electron Microscopy and Database - An Online Book, https://www.globalsino.com/EM, accessed 15 November 2022 Search PubMed.
- N. W. M. Ritchie, D. E. Newbury, H. Lowers and M. Mengason, Exploring the limits of EDS microanalysis: rare earth element analyses, IOP Conf. Ser.: Mater. Sci. Eng., 2018, 304, 012013, DOI:10.1088/1757-899X/304/1/012013.
- K. Lenczewska, Y. Gerasymchuk, N. Vu, N. Q. Liem, G. Boulon and D. Hreniak, The size effect on the energy transfer in Bi3+–Eu3+ co-doped GdVO4 nanocrystals, J. Mater. Chem. C, 2017, 5, 3014–3023, 10.1039/C6TC04660F.
- N. F. Mott and E. A. Davis, Electronic processes in Non-crystalline materials, Oxford, UK, Clarendon, 2nd edn, 1979 Search PubMed.
- S. P. Singh and B. Karmakar, Photoluminescence enhancement of Eu3+ by energy transfer from Bi2+ to Eu3+ in bismuth glass nanocomposites, RSC Adv., 2011, 1, 751–754, 10.1039/C1RA00160D.
- M. H. M. Zaid, K. A. Matori, S. H. A. Aziz, A. Zakaria and M. S. M. Ghazali, Effect of ZnO on the physical properties and optical band gap of soda lime silicate glass, Int. J. Mol. Sci., 2012, 13, 7550–7558, DOI:10.3390/ijms13067550.
- X. Y. Liu, H. Guo, S. X. Dai, M. Y. Peng and Q. Y. Zhang, Energy transfer and thermal stability in Bi3+/Eu3+ co-doped germanium-borate glasses for organic-resin-free UV LEDs, Opt. Mater. Express, 2016, 6(11), 3574, DOI:10.1364/OME.6.003574.
- K. Maheshvaran, P. K. Veeran and K. Marimuthu, Structural and optical studies on Eu3+ doped boro-tellurite glasses, Solid State Sci., 2013, 17, 54–62, DOI:10.1016/j.solidstatesciences.2012.11.013.
- N. A. S. Omar, Y. W. Fen, K. A. Matori, M. H. M. Zaid and N. F. Samsudin, Structural and optical properties of Eu3+ activated low cost zinc soda lime silica glasses, Results Phys., 2016, 6, 640–644, DOI:10.1016/j.rinp.2016.09.007.
- D. V. K. Reddy, S. Taherunnisa, A. L. Prasanna, T. S. Rao, N. Veeraiah and M. R. Reddy, Enhancement of the red emission of Eu3+ by Bi3+ sensitizers in yttrium alumino bismuth borosilicate glasses, J. Mol. Struct., 2019, 1176(15), 133–148, DOI:10.1016/j.molstruc.2018.08.057.
- A. Dwivedi, K. Mishra and S. B. Rai, Investigation of upconversion, downshifting and quantum–cutting behavior of Eu3+, Yb3+, Bi3+ co-doped LaNbO4 phosphor as a spectral conversion material, Methods Appl. Fluoresc., 2018, 6, 035001, DOI:10.1088/2050-6120/aab253.
- X. X. Han, E. H. Song, W. B. Chen, Y. Y. Zhou and Q. Y. Zhang, Color-tunable upconversion luminescence and prolonged Eu3+ fluorescence lifetime in fluoride KCdF3:Yb3+, Mn2+, Eu3+ via controllable and efficient energy transfer, J. Mater. Chem. C, 2020, 8, 9836–9844, 10.1039/D0TC01502D.
- J. F. Li, Y. Long, Q. C. Zhao, S. P. Zheng, Z. J. Fang and B.-U. Guan, Efficient white upconversion luminescence in Yb3+/Eu3+ doubly-doped transparent glass ceramic, Opt. Express, 2021, 29(14), 21763, DOI:10.1364/OE.431959.
- G. Annadurai, L. L. Sun, H. Guo and X. Y. Huang, Bright tunable white-light emissions from Bi3+/Eu3+ co-doped Ba2Y5B5O17 phosphors via energy transfer for UV-excited white light-emitting diodes, J. Lumin., 2020, 226, 117474, DOI:10.1016/j.jlumin.2020.117474.
- P. P. Dang, S. S. Liang, G. G. Li, H. Z. Lian, M. M. Shang and J. Lin, Broad color tuning of Bi3+/Eu3+-doped (Ba, Sr)3Sc4O9 solid solution compounds via crystal field modulation and energy transfer, J. Mater. Chem. C, 2018, 6, 9990, 10.1039/C8TC03334J.
- O. G. Giraldo, M. Z. Fei, R. F. Wei, L. M. Teng, Z. G. Zheng and H. Guo, Energy transfer and white luminescence in Bi3+/Eu3+ co-doped oxide glasses, J. Lumin., 2020, 219, 116918, DOI:10.1016/j.jlumin.2019.116918.
- B. C. Yu, X. Zhou, H. P. Xia, B. J. Chen and H. W. Song, Novel Bi3+/Eu3+ co-doped oxyfluoride transparent KY3F10 glass ceramics with wide tunable emission and high optical temperature sensitivity, J. Lumin., 2021, 239, 118366, DOI:10.1016/j.jlumin.2021.118366.
- A. Dwivedi, K. Mishra and S. B. Rai, Investigation of Upconversion, downshifting and quantum –cutting behavior of Eu3+, Yb3+, Bi3+ co-doped LaNbO4 phosphor as a spectral conversion material, Methods Appl. Fluoresc., 2018, 6, 035001, DOI:10.1088/2050-6120/aab253.
- M. Peng, B. Sprenger, M. A. Schmidt, H. G. L. Schwefel and L. Wondraczek, Broadband NIR photoluminescence from Bi-doped Ba2P2O7 crystals: Insights into the nature of NIR-emitting Bismuth centers, Opt. Express, 2010, 18, 12852–12863, DOI:10.1364/OE.18.012852.
- J. D. Wu, D. P. Chen, X. K. Wu and J. R. Qiu, Ultra-broad near-infrared emission of Bi-doped SiO2-Al2O3-GeO2 optical fibers, Chine, Opt. Lett., 2011, 9(7), 071601, DOI:10.3788/COL201109.071601.
- F. G. Chen, Y. F. Wang, W. W. Chen, P. X. Xiong, B. F. Jiang, S. F. Zhou, Z. J. Ma and M. Y. Peng, Regulating the Bi NIR luminescence behaviours in fluorine and nitrogen co-doped germanate glasses, Mater. Adv., 2021, 2, 4743–4751, 10.1039/D1MA00395J.
- M.-H. Qu, R.-Z. Wang, Y. Zhang, K.-Y. Li and H. Yan, High efficient antireflective down-conversion Y2O3: Bi, Yb films with pyramid preferred oriented nano-structure, J. Appl. Phys., 2012, 111, 093108, DOI:10.1063/1.4712461.
- Y. P. Tai, G. J. Zheng, H. Wang and J. T. Bai, Broadband down-conversion based near-infrared quantum cutting in Eu2+–Yb3+ co-doped SrAl2O4 for crystalline silicon solar cells, J. Solid State Chem., 2015, 226, 250–254, DOI:10.1016/j.jssc.2015.02.020.
|
| This journal is © The Royal Society of Chemistry 2023 |
Click here to see how this site uses Cookies. View our privacy policy here. 
 Open Access Article
 This Open Access Article is licensed under a Creative Commons Attribution-Non Commercial 3.0 Unported Licence
 *ab,
Nguyen Dinh Trungcd,
Nguyen Minh Tam
*ab,
Nguyen Dinh Trungcd,
Nguyen Minh Tam