 Open Access Article
Electronic analysis of hydrogen-bonded molecular complexes: the case of DNA sensed in a functionalized nanogap†
Frank C. Maiera and
Maria Fyta *ab
*ab
aInstitute for Computational Physics, University of Stuttgart, Allmandring 3, 70569 Stuttgart, Germany
bComputational Biotechnology, RWTH Aachen University, Worringerweg 3, Aachen, Germany. E-mail: maria.fyta@rwth-aachen.de
First published on 17th January 2023
Abstract
DNA nucleotides can be interrogated by nanomaterials in order to be detected. With the aid of quantum-mechanical simulations, we unravel the intrinsic details of the electronic transport across nanoelectrodes functionalized with tiny modified diamond-like molecules. These electrodes generate a gap in which DNA nucleotides are placed and can be identified. The identification is strongly affected by the hydrogen bonding characteristics of the diamond-like particle and the nucleotides. The results point to the connection of the electronic transmission across the functionalized nanogap and the electronic and bonding characteristics of the molecular complexes within the nanogap. Specifically, our discussion focuses on the influence of the DNA dynamics on the electronic signals across the nanogap. We identify the molecular complex's details that hinder or promote the electronic transport through an analysis that moves from the bonding within the molecular complex up to the electronic current that this can accommodate. Accordingly, our work discusses pathways for analyzing hydrogen-bonded molecular complexes or molecules hydrogen-bonded to a material part having the optimization of the design of biosensing nanogaps and read-out nanopores in mind. The presented approach, though, is applicable to a wide range of applications utilizing exactly the bio/nano interface.
1 Introduction
Single-molecule detection is being developed within different concepts. One of these involves the setup including holes in materials, the nanopores. Within nanopores, biomolecules of different types and lengths can be electrophoretically threaded. Briefly explained, the nanopore material is placed within a salt, typically a physiological, solution dividing two chambers. A voltage difference is applied across the nanopore and the two chambers giving rise to an electric force applied at the pore region. Any species that are charged and approach the pore feel the electric force and are dragged through it. This concept is the basic and first to investigate in the nanopore concept.1,2 However, the detection of any species entering the pore is possible with ionic,3–5 electronic,6–8 optical9–11 or concurrent ionic and electronic12–14 means.The electronic detection is based on measuring the tunneling current across the nanopore. For this, a voltage bias is applied across metallic electrodes, which captures the translocating biomolecule.15–17 The embedded break junction electrodes form a nanogap which is threaded by the biological analyte. The electrodes can detect the difference in the electronic structure of the translocating biomolecule and read out the genetic information (i.e. sequence). Although, this sensing scheme is simple and efficient, still the distinctive coupling of the different nucleotide species to the electrodes needs to be improved and a sufficient sampling in the measurement of each nucleotide located between the electrodes is needed.18,19 Often, the tunneling signals corresponding to the four DNA nucleotides overlap leading to a low signal-to-noise ratio and many errors in the detection.15,20 A strong enhancement of these electronic current signals leading to a low signal-to-noise ratio20 is expected to be resolved using functionalized electrodes embedded in the nanopore.21 The functionalization is based on molecules of the size of the nucleotides grafted on the electrodes and can render the measured signals nucleotide-specific.22,23 The functionalization introduces molecular states within the electronic gap of the electrodes' band structure, across which, the electrons can hop over enhancing the tunneling current.21 Nanometer-sized hydrogenated amine-derivatives of diamond cages, the diamondoids, with tunable electronic properties and a variety of potential applications24,25 have been shown to functionalize electrodes in a way that promotes nucleotide specificity in the nanopore read-out.26 The functionalizing diamondoid provides donor/acceptor sites for binding specifically to DNA units, as well as amino acids,27 forming stable hydrogen bonds.28 This reveals a high potential in enhancing the read-out signals from nanopores, distinguishing among natural and mutated nucleotides and detecting more complex molecules like proteins and peptides. In order to support such an efficient read-out, we move here very deep into the microscopic details of DNA nucleotides in a nanogap that can be thought of being embedded in the pore, in order to provide all the features that control an efficient detection at the nanopore level. This nanogap provides with the necessary setup for detecting tunneling currents through a nanopore. The approach followed and proposed here would be extendable and applicable to other systems involving the interaction of a (bio)molecule and a material, opening ways in understanding complex biomaterials systems and the interface of materials and biology down to their very fine detail.
2 Computational method
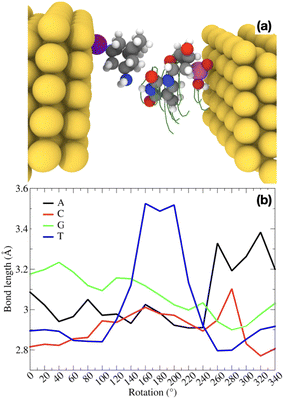
We model a nanogap made of gold electrodes functionalized on the left side with a amine-derivative of the smallest diamondoid. An amine-modified diamondoid derivative29 known as memantine (‘mem’) is taken for the functionalization. Memantine is and a drug used in Alzheimer's disease.30 Here, it is modified with a thiol group in order for the diamondoid to be anchored to the electrode, therefore labelled as ‘memS’. A DNA nucleotide is placed within the electrode nanogap. This nanogap is initially 18 Å wide, while the width reduces to about 12.5 Å when the diamondoid is attached on the surface of the left electrode. This refer to the initial setup of the nanogap. For this, we set up a sensing device, which is made up of 5 gold (111) layers for each electrode, each layer with 5 × 5 gold atoms fixed during the geometry optimization. The (111) gold plane is perpendicular to the direction roughly connecting the two molecules. The electrodes are semi-infinite and periodic in two dimensions. The size of the supercell is 14.8 × 14.8 × 39.8 Å. The four natural DNA nucleotides, 2′-deoxyadenosine 5′-monophosphate (“A”), 2′-deoxythymidine 5′-monophosphate (“T”), 2′-deoxycytosine 5′-monophosphate (“C”), 2′-deoxyguanosine 5′-monophosphate (“G”) are separately placed within the electrode nanogap, initially the nucleotide with the sugar-phosphate group facing to the right electrode. In this way, the hydrogen bonding sites of the nucleotide to the memS force the amine group of the memantine to form hydrogen bonds to the nucleotides. A representation of this setup is depicted in Fig. 1.We perform quantum mechanical calculations based on the density functional theory (DFT)31,32 as implemented in the code SIESTA33 on the already optimized geometries for the functionalized nanogap.29 The gold electrodes are considered and represented by a single-zeta plus polarization basis set, while the atoms of the molecules are represented by double-zeta plus (DZP) polarization basis sets. The exchange-correlation functional is approximated by the Perdew–Burke–Ernzerhof (PBE-GGA) functional34 and the norm-conserving Troullier–Martins pseudopotentials35 are being used. The energy shift and the real space sampling grid (mesh cutoff) were set to 0.01 Ry and 200 Ry, respectively. A 4 × 4 × 1 k-points Monkhorst–Pack mesh was used for the structural optimization and a k-space of 5 × 5 × 1 k-points for the calculation of the electronic and transport properties.
The structural relaxation was performed until the maximum atomic forces reached less than 0.01 eV Å−1. Rotation dynamics are considered through rotations of the nucleotide with steps of 20° with respect to the mem functionalizing molecule and along the axis connecting both electrodes as can be seen from the snapshots in Fig. 1. After each rotation, a geometry optimization was performed. The rotation were performed.
For the electronic transport calculations, the non-equilibrium Green's functions (NEGF) formalism combined with DFT was employed as implemented in the code Transiesta.36 The functionalized nanogap device is made up of two electrodes and the scattering region including the diamondoid and the nucleotide. The two electrodes are considered the leads in our computations, while the scattering region is all the region between the two electrodes, namely from the surface of the left electrode to the surface of the right electrode. This scattering region includes only the two molecules, functionalizing diamondoid and nucleotide. A detailed sketch has been published previously.26 The semi-infinite left (L) and right (R) electrodes play the role of the source and drain of electrons, respectively and have a self-energy ΣL(R). The latter are used to define Green's functions Γα(E) = i[Σα − Σ†α] with α = (L, R). Through these, the energy-resolved electronic transmission, T(E, V), with V the applied bias voltage. T(E, V) represents the probability of an electron injected from the left electrode to reach the right electrode and can be written as:
 | (1) |
The current, I(V), is obtained by integrating the electronic transmission using the Landauer-Büttiker formula37 through
 | (2) |
3 Discussion
We discuss in the following the results for all four natural nucleotides placed separately within the functionalized electrode nanogap in order to provide a complete picture of the diamondoid-nucleotide complexes within the nanogap. The results will be discussed with respect to the dynamics, that is rotation of the nucleotide in the gap and in some cases, as a variation with the applied bias. We provide an analysis, starting with the structural and binding features of all memS-nucleotide complexes in the electrode gap, move on to a detailed discussion of their electronic properties in order to in the end address how these influence the electronic transport across the nanogap.3.1 Structural characteristics
We begin the analysis with the structural variations within the nanogap. These are induced by the rotations of the nucleotide within the gap and the respective rearrangements of the two molecules, the probe diamondoid functionalizing the electrode and the target nucleotide. These rearrangements thus directly influence the binding characteristics of the two molecules and can be monitored through the changes of the hydrogen bond length. For all four natural DNA nucleotides, the variations of the main hydrogen bond within the molecular complex are given for a whole rotation of each nucleotide in the nanogap in Fig. 1(b). Quite distinct curves can be observed, with each nucleotide underlining its own signature. For example, in the case of thymine, the bond length increases significantly at intermediate rotations. This relatively higher bond stretching compared to the other nucleotides is directly related to the smaller size of thymine. Accordingly, at certain rotation angles, the thymine is further away from the amine group of the diamondoid, which is mainly involved in the hydrogen bonding. These variations in the hydrogen bond lengths are expected to strongly affect all other properties of the molecules within the electrode gap. Very relevant to the electronic detection of the nucleotides are the electronic and transport properties of the functionalized gap including a nucleotide, which we address next. All these connect together as follows: the hydrogen bonding is directly and exponentially related to the nanogap conductance,19 thus also the charge transfer. A high charge transfer is related to a high conductance. At the same time, the hydrogen bonded molecules in the nanogap are electronic coupled to the electrodes. For relatively strong hydrogen bonding of the two molecules, the coupling is higher at the highest electronic transmission across the nanogap.263.2 Electronic features
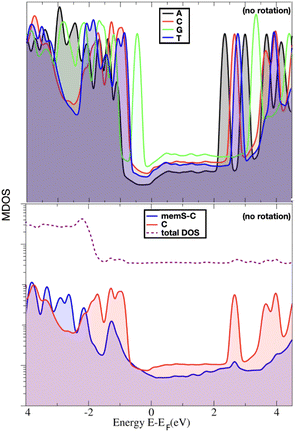
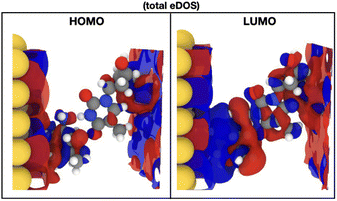
In order to indeed get an insight into these properties, we first focus on the information raised from the electronic levels available in the systems under study. Typically, electronic properties are analyzed through the electronic density of states (eDOS), that is a histogram of all the electronic levels available in the system. The eDOS provides information on the total electronic behavior of a system. In order, though, to address the characteristics of the single molecules, probe diamondoid and target nucleotide, and unravel their influence on the total electronic behavior of the system, we decompose the eDOS into its molecular counterparts. Specifically, we define as ‘MDOS’ the molecular electronic density of states, which is similar to a projected eDOS only projected on a specific molecule; in our case memS or a nucleotide. We first focus on the energy levels and peaks on the MDOS for all nucleotides placed separately within the nanogap. Of main interest in view of transport and electronic current detection are the frontier orbitals of the two molecules in the electrode gap. The frontier orbitals are the ones corresponding to the energy levels close and on either sides of the Fermi level. These are the higher occupied and lowest unoccupied molecular orbitals, HOMO and LUMO, respectively. Note, that we will use throughout the notation ‘HOMO-n’ for the immediate levels below the HOMO, with ‘n’ being and index starting with n = 1 for the first level below the HOMO. In the case of the LUMO level, the immediate states above this are also indexed with ‘n’ and denoted as ‘LUMO + n’. As these molecular levels are key in the interaction of the two molecules, thus in the interaction of the nucleotide with the functionalized device, we emphasize and focus on these molecular levels within the electronic structure of the nanogap. However, as the nanogap comprises a solid state device, the terms “valence band maximum (VBM)’ and ‘conduction band minimum (CBM)’ would be used to define the electronic properties of the whole device and would include the molecular levels we discuss in the following.In order to reduce the complexity, we first look at the MDOS for all four natural nucleotides in Fig. 2(top) at no rotation, i.e. at the configurations corresponding to a 0° rotation angle within the electrode gap. The respective curves show distinct, nucleotide-specific, features as each nucleotide reveals MDOS peaks at different energies. In order to assess further the influence of the nucleotide type in the electronic behavior of the whole system (electrodes, diamondoids, nucleotide), we depict the MDOS of the nucleotide and the diamondoid-nucleotide contribution and compare these to the total eDOS in Fig. 2(bottom) for the case of cytosine, again at no rotation. It can be clearly observed that though the nucleotide has its own specific MDOS peaks, the memS–C complex is the one that shares its MDOS peaks with those in the total eDOS of the whole system (electrodes-diamondoid-nucleotide). Accordingly, the eDOS peaks are characteristic of the molecular complex, that is the specific interaction between the diamondoid and the nucleotide. Hence, it is not the nucleotide alone that is responsible for the total electronic behavior or the system. It is rather its very distinct hydrogen binding to the diamondoid that controls the total electronic properties of the electrode gap. The spatial distribution orbitals related to the electronic levels of the total eDOS exactly below and above the Fermi level are sketched in Fig. 3 for thymine, representative for all four nucleotides. The level (HOMO) below the Fermi energy is more localized than the level (LUMO) above the Fermi energy, which is quite delocalized spreading across the electrodes. The latter relates to a coupling of the two electrodes through the two molecules in the nanogap. Note, that previous studies focusing on the isolated molecule, that is no electrodes were present, have evaluated the exact influence of the molecular binding on the electronic properties of the isolated molecules, as well as the charge dynamics across different molecular donor or acceptor configurations.28,40 These can provide a direct comparison to the results of the current work. For example, in the isolated molecules, the HOMO and LUMO levels are mainly associated with the nucleotide, while in the nanogap these are less localized on the molecules.
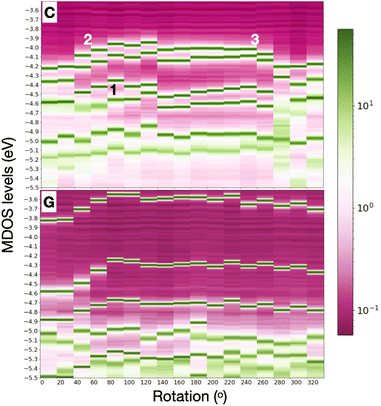
In order to include in our observations also the influence, at least partly, of the nucleotide dynamics in the nanogap, we summarize the results for all rotations and all nucleotides placed separately within the electrode gap. Note that no dynamical simulations are performed here and no time evolution of the conformational changes in our system are observed. However, through our simple static calculations with DFT, we could implicitly and indirectly obtain some information on how dynamics, at least in a first order, influence the nanogap properties. Respective data are shown for one of the pyrimidines, cytosine, and one of the larger nucleotides, guanine in Fig. 4 for the whole rotation spectrum in the electrode gap. The respective data for A and T are provided in the ESI.† Specifically, this figure represents the data through heat maps that take into account the importance of the peaks in the MDOS, that is how distinct these are in the respective energy spectrum. The first levels below the Fermi energy are shown. A first inspection of this figure reveals that the HOMO levels are deeper in C as compared to G. Similar trends were observed for all four nucleotides overall resulting to the fact that the smaller pyrimidines (T, C) have deeper HOMO levels than the larger purines (A, G). Hence on top of the nucleotide-specificity of the electronic levels themselves, also a nucleotide size dependence was seen. Comparing C to T, reveals for the latter a shift in the HOMO-2 levels in the MDOS further away from the HOMO-1. This, though, does not hold exactly in the levels below the HOMO, namely the HOMO-1, HOMO-2, and HOMO-3 peaks in the MDOS. Guanine shows electronic HOMO levels, closer to the Fermi energy, leading to a smaller current.41 An attempt to correlate the total variation of the HOMO peak to the respective total variation in the hydrogen bond length (Fig. 1) did not result any specific trend. The total variation in the HOMO for A, G, C, T in the electrode gap was approx. 0.45, 0.3, 0.25, and 0.15 eV, respectively. The corresponding total variations in the hydrogen bond length were calculated at 0.5, 0.35, 0.32, and 0.7 Å, respectively. Note, that the hydrogen bond distance in this figure was calculated between the nitrogen atom in the diamondoid memantine and the corresponding nitrogen atom in the nucleobases and was found to vary in the range 2.77 Å to 3.53 Å.
3.3 Implicit connection of the electronic levels to electronic transport
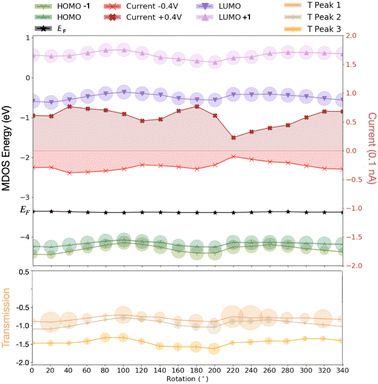
The results above clear show that the dynamics through the rotation of the nucleotides in the gap strongly affect the energy levels in the MDOS as intuitively expected. Again, a qualitative difference can be reported for the pyrimidines compared to the purines underlining again the importance of the nucleotide size. For the smaller pyrimidines, C and T, the MDOS spectrum becomes more rich, as either additional electronic levels are introduced or even single energy levels are split into two. The latter is more pronounced for C (Fig. 4) and partly for T (refer to ESI†). This is not observed for the larger purines, A (refer to ESI†) and G (Fig. 4). Note, that the energy levels in the heat maps are not shifted with respect to the Fermi level. Absolute energy values are rather depicted in order to promote the respective ‘energy distances' among these. In the following discussion, the indices refer to the positions pointed to in Fig. 4. In the case of C, the HOMO-2 (position ‘1′ in the figure) level in the MDOS is split into two at intermediate rotations of the nucleotide, while these are shifting closer to the Fermi level. We have observed in the spatial distribution of the respective frontier orbitals that moving from the HOMO downwards to the HOMO-2 level in the MDOS reveals a slight shift or extension from the nucleotide to the diamondoid. The respective wavefunctions care included in the ESI.† The splitting in the case of T was observed deeper in the HOMO-3 level. As T is smaller than C, this leads to the observation, that the smaller nucleotide, the deeper the splitting, which can also be assigned to a lifting of the degeneracy of these levels.Interestingly, the HOMO and HOMO-1 levels for C, as well as for T (refer to the ESI†) are much closer in energy than the respective levels for G and A (the latter not shown). The results from our simulations also reveal that the LUMO levels follow the shift of the HOMO levels with respect to nucleotide rotation. At rotations leading to a shift of the HOMO levels towards the Fermi level (position ‘2′ up to ‘3′ in Fig. 4), the respective LUMO levels shift away from the Fermi level. Accordingly, this shift does not reduce the molecular electronic band gap hindering an electron hopping across it, which could enhance the electronic transport. The molecular levels are not closer to the Fermi energy for some rotations, thus not more accessible for electrons to cross the electronic gap. The correlated trends in the HOMO and LUMO shifts with the rotation can be observed in Fig. 5(top) for a thymine placed and rotated within the electrode gap. The two HOMO levels shown vary with rotation similarly to the two LUMO levels in the graph. These variations are also monitored in the electronic transmission shown in the bottom panel of the same figure.
The electronic transmission is the property directly related to the transport of the electrons and the thereby generated electronic current across the nanoelectrodes. As the electronic current is key for the detection of biomolecules based on the concept of this work, this can be obtained directly once the electronic transmission has been obtained from the quantum transport calculations. In Fig. 5(bottom), the three first peaks in the electronic transmission below the Fermi level are sketched for the case of thymine being rotated within the nanogap. The circles on the data point for the transmission denote the importance, i.e. sharpness of the respective peaks. Accordingly, a larger circle points to a peak that is not very distinct at the given energy compared to the neighboring transmission peaks. As further observed in this figure, moving the HOMO closer to the Fermi level, lowers the electronic transmission by shifting its first peak closer to Fermi level. At the same time, the transmission peaks become ‘weaker’ when the LUMO moves higher in energy (E) and the area in T(E) vs. E becomes smaller leading to a smaller current. Note, that the electronic current corresponds to the area below the T(E) curve. This current is increasing with increasing bias voltage. In order to also reveal the trends in the electronic current across the electrode gap, the current was calculated for different applied bias voltages across the electrodes. In Fig. 5, the calculated electronic current for two different values of the bias voltage is mapped.
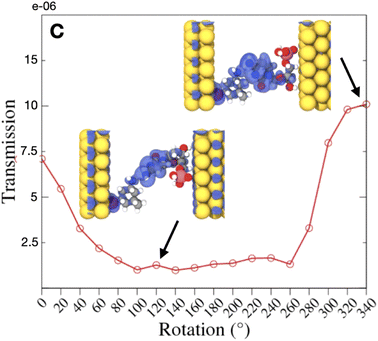
As observed in this figure, the electronic current increases when the HOMO levels move away from the Fermi level, while the LUMO levels move closer to this level. Interestingly, the current for the negative bias is lower in absolute values compared to the current for the positive bias. This is a result of the non-symmetric IV characteristics of the electrode gap.41 Note that the current values in the figure are much lower, at least two orders of magnitude, than the electronic current measured in the nanopore with an embedded electrode gap experiments. One of the main reasons for this difference is the absence of a solution in our simulations and especially the absence of ions, which can also be current carriers and enhance the measured electronic current. Overall, the current range taking into account all rotations, was decreasing in the following order with respect to the nucleotide in the nanogap: C, G, T, A. No strong nucleotide size dependence could be observed here. For a cytosine in the nanogap in Fig. 6 the variations in the transmission with respect to the dynamics is depicted. A comparison of these data to the hydrogen bond length in Fig. 1(b) reveals a very similar but inverse trend. A larger hydrogen bond, thus a weaker binding corresponds to a smaller electronic transmission and less current. This is quite intuitive as a stronger binding of the two molecules is expected to better accommodate electronic current, allowing electrons to hop over from one molecule to the other. Connecting these arguments to our previous discussion and Fig. 4(top), clearly shows that, e.g. for the case of cytosine, a current drop is observed at rotations shifting the HOMO levels in the MDOS closer to the Fermi energy. This shifting is also related to a less extended HOMO spatial distribution as depicted in Fig. 6.
At the same time, the fact that more electronic levels are provided through splitting by the pyrimidines, especially C at intermediate rotations can be translated to more electrons being accommodated on the HOMO levels. Accordingly, less electrons are available to eventually hop over to the LUMO and also generate the electronic current. This is more pronounced in the case of thymine, for which the splitting is found deeper in the HOMO levels, meaning that more electrons can fill these deeper HOMO-3, HOMO-4 levels and would need a higher applied bias voltage to be “transported” and generate an electronic current. Inspection of the LUMO levels (not shown) reveal that in the case of A, three LUMO levels are close to the Fermi energy. For the smaller T and C, these are two, though for C another very small LUMO peak is observed in the MDOS close to the Fermi level. In G, an almost degenerate LUMO peak is observed at small rotations, which is split into two peaks, LUMO and LUMO-1, just above the Fermi level. The splitting gives rise to a higher current at rotation angles where this splitting occurs. The fact that very close to the Fermi level, additional LUMO levels occur, provides more levels the HOMO electrons can easily hop over with the application of a small bias voltage, thus generating a current. In C, the small LUMO-1 peak shrinks at small rotations. At large rotations, the LUMO-2 level moves closer to LUMO-1, which becomes slightly more pronounced and this leads to current increase, again due to a small shift of these levels to the LUMO and the Fermi energy. Note that the focus of this work was to provide a connection of the hydrogen bonding between the probe and target molecules in the nanogap to their electronic structure within the nanogap electronic environment, as well as with the electronic transmission across the nanogap. To this end, the most important information was chosen to reveal this link. A very detailed analysis on the electronic properties and transmission of this system, as well as the detailed influence of nucleotide rotations on the transmission can be found elsewhere.26,29,41
4 Conclusions
In this work, microstructural insight on the characteristics of a biomolecule interacting with a solid state structure was provided. Of specific focus has been the interaction of single DNA nucleotides with tiny diamond-like cages in view of enhancing the detection of DNA. To this aim, the nanopore concept was considered, which can make use of embedded functionalized electrodes. The nanopore can thread the DNA, while the electrodes detect the DNA. In this approach, the very specific binding of the DNA nucleotides with the electrodes, through the functionalizing diamondoid is key. The main study focused on the electronic characteristics of the electrode gap, as these are essential for unravelling the detection efficiency of the nanogap. The main findings include the more rich electronic levels being introduced with the dynamics of the nucleotide. This is strongly controlled by the nucleotide size and influences the tunneling current through the electrode nanogap, which is higher for the smaller nucleotides T and C. The structure and the distance of the electronic levels from the Fermi level control the current. When the LUMO levels increase, i.e. move deeper into the energy spectrum, this hinders the electron hopping across the nanogap. No molecular levels are accessible for ‘covering’ the electronic gap. In addition, the transmission peaks become ‘weaker’ when the LUMO moves higher in energy and the HOMO moves closer to the Fermi level. Accordingly, the area in the transmission variation with the energy becomes smaller leading to a smaller current. This is related with an increasing localization of the HOMO wavefunctions Looking into the frontier orbitals, a shift of the electron density from the nucleotide towards the diamondoid is observed while moving from HOMO-4 to HOMO-1. These orbitals are more localized compared to the LUMO orbitals that control stronger the current.The approach followed and proposed here was applied on a molecule/material complex related to the detection of biomolecules, such as DNA and its sequence. In this, the exact interactions and bonding of the two parts, the biomolecule and the nanoparticle are of high and essential importance. In this work, we proposed and discussed an analysis of the hydrogen-bonded complex's features. This is expected to be important in other complex systems made of biological and solid-state species that interact through hydrogen bonds to realize specific applications. Our approach, based on the binding and arrangement of the bio/material complex, as well as the decomposition of its distinct molecular signatures on the electronic properties of the whole system and its connection to measurable values, such as the electronic current used here, can be applied on a more general ground. In principle, when dealing with hybrid systems made of a biological and a material part, a decomposition of both their characteristics in order to assess their weight and influence on the complex's properties would be the key towards the design of novel applications. The latter would profit from controlling the two components of the hybrid system in a very efficient way based on an analysis, as the one proposed and followed here.
Author contributions
CM and MF designed the research, CM performed the simulations and most of the analysis, MF performed part of the analysis and wrote the manuscript.Conflicts of interest
There are no conflicts to declare.Acknowledgements
The authors acknowledge financial support from the collaborative network SFB 716 “Dynamic simulations of systems with large particle numbers” funded by the German Funding Agency (Deutsche Forschungsgemeinschaft-DFG). This research was supported in part by the bwHPC initiative and the bwHPC-C5 project provided through associated compute services of the JUSTUS HPC facility at the University of Ulm. The bwHPC and bwHPC-C5 (http://www.bwhpc-c5.de) are funded by the Ministry of Science, Research and the Arts Baden-Württemberg (MWK) and the German Research Foundation (DFG). Part of this work was performed on the computational resource ForHLR Phase II funded by the Ministry of Science, Research and the Arts Baden-Württemberg and DFG.References
- A. Meller, L. Nivon and D. Branton, Phys. Rev. Lett., 2001, 86, 3435 CrossRef CAS PubMed.
- N. Varongchayakul, J. Song, A. Meller and M. W. Grinstaff, Chem. Soc. Rev., 2018, 47, 8512–8524 RSC.
- S. Howorka, S. Cheley and H. Bayley, Nat. Biotechnol., 2001, 19, 636–639 CrossRef CAS PubMed.
- J. Li, M. Gershow, D. Stein, E. Brandin and J. A. Golovchenko, Nat. Mater., 2003, 2, 611–615 CrossRef CAS PubMed.
- J. Feng, K. Liu, M. Graf, D. Dumcenco, A. Kis, M. Di Ventra and A. Radenovic, Nat. Mater., 2016, 15, 850–855 CrossRef CAS PubMed.
- M. Zwolak and M. Di Ventra, Rev. Mod. Phys., 2008, 80, 141 CrossRef.
- M. Di Ventra and M. Taniguchi, Nat. Nanotechnol., 2016, 11, 117–126 CrossRef CAS PubMed.
- J. Feng, K. Liu, R. D. Bulushev, S. Khlybov, D. Dumcenco, A. Kis and A. Radenovic, Nat. Nanotechnol., 2015, 10, 1070–1076 CrossRef CAS PubMed.
- B. McNally, A. Singer, Z. Yu, Y. Sun, Z. Weng and A. Meller, Nano Lett., 2010, 10, 2237–2244 CrossRef CAS PubMed.
- F. Sawafta, B. Clancy, A. T. Carlsen, M. Huber and A. R. Hall, Nanoscale, 2014, 6, 6991–6996 RSC.
- J. P. Fried, Y. Wu, R. D. Tilley and J. J. Gooding, Nano Lett., 2022, 22, 869–880 CrossRef CAS PubMed.
- A. Fanget, F. Traversi, S. Khlybov, P. Granjon, A. Magrez, L. Forró and A. Radenovic, Nano Lett., 2014, 14, 244–249 CrossRef CAS PubMed.
- M. Kayci and A. Radenovic, Sci. Rep., 2015, 5, 1–5 Search PubMed.
- M. Graf, M. Lihter, D. Altus, S. Marion and A. Radenovic, Nano Lett., 2019, 19, 9075–9083 CrossRef CAS PubMed.
- J. Lagerqvist, M. Zwolak and M. Di Ventra, Nano Lett., 2006, 6, 779–782 CrossRef CAS PubMed.
- M. Tsutsui, M. Taniguchi, K. Yokota and T. Kawai, Nat. Nanotechnol., 2010, 5, 286 CrossRef CAS PubMed.
- B. N. Miles, A. P. Ivanov, K. A. Wilson, F. Dogan, D. Japrung and J. B. Edel, Chem. Soc. Rev., 2013, 42, 15 RSC.
- S. Carson and M. Wanunu, Nanotechnology, 2015, 26, 074004 CrossRef CAS PubMed.
- P. Krstić, B. Ashcroft and S. Lindsay, Nanotechnology, 2015, 26, 084001 CrossRef PubMed.
- M. Zwolak and M. Di Ventra, Nano Lett., 2005, 5, 421–424 CrossRef CAS PubMed.
- D. Branton, D. W. Deamer, A. Marziali, H. Bayley, S. A. Benner, T. Butler, M. Di Ventra, S. Garaj, A. Hibbs and X. Huang, et al., Nat. Biotechnol., 2008, 26, 1146 CrossRef CAS PubMed.
- H. He, R. Scheicher, R. Pandey, A. Reily Rocha, S. Sanvito, A. Grigoriev, R. Ahuja and S. Karna, J. Phys. Chem. C, 2008, 112, 3456–3459 CrossRef CAS.
- G. Sivaraman and M. Fyta, Nanoscale, 2014, 6, 4225–4232 RSC.
- J. E. Dahl, S. G. Liu and R. M. K. Carlson, Science, 2003, 299, 96–99 CrossRef CAS PubMed.
- H. Schwertfeger, A. A. Fokin and P. R. Schreiner, Angew. Chem., Int. Ed., 2008, 47, 1022–1036 CrossRef CAS PubMed.
- G. Sivaraman, R. G. Amorim, R. H. Scheicher and M. Fyta, Nanoscale, 2016, 8, 10105 RSC.
- P. Partovi-Azar, C. S. Sarap and M. Fyta, ChemPhysChem, 2019, 20, 2166–2170 CrossRef CAS PubMed.
- C. S. Sarap, P. Partovi-Azar and M. Fyta, ACS Appl. Bio Mater., 2018, 1, 59–69 CrossRef CAS.
- G. Sivaraman, R. G. Amorim, R. H. Scheicher and M. Fyta, Nanotechnology, 2016, 27, 414002 CrossRef PubMed.
- S. Matsunaga, T. Kishi and N. Iwata, PLoS One, 2015, 10(4), e0123289 CrossRef PubMed.
- P. Hohenberg and W. Kohn, Phys. Rev., 1964, 136, B864 CrossRef.
- W. Kohn and L. J. Sham, Phys. Rev., 1965, 140, A1133 CrossRef.
- J. M. Soler, E. Artacho, J. D. Gale, A. Garcia, J. Junquera, P. Ordejon and D. Sanchez-Portal, J. Phys.: Condens. Matter, 2002, 14, 2745 CrossRef CAS.
- J. P. Perdew, K. Burke and M. Ernzerhof, Phys. Rev. Lett., 1996, 77, 3865 CrossRef CAS PubMed.
- N. Troullier and J. L. Martins, Phys. Rev. B: Condens. Matter Mater. Phys., 1991, 43, 1993 CrossRef CAS PubMed.
- M. Brandbyge, J. Mozos, P. Ordejón, J. Taylor and K. Stokbro, Phys. Rev. B: Condens. Matter Mater. Phys., 2002, 65, 165401 CrossRef.
- M. Büttiker, Y. Imry, R. Landauer and S. Pinhas, Phys. Rev. B: Condens. Matter Mater. Phys., 1985, 31, 6207–6215 CrossRef PubMed.
- S. Datta, Quantum transport: atom to transistor, Cambridge University Press, 2005 Search PubMed.
- A. Rocha, V. García-Suárez, S. Bailey, C. Lambert, J. Ferrer and S. Sanvito, arXiv, 2005, preprint cond-mat/0510083.
- F. C. Maier and M. Fyta, ChemPhysChem, 2014, 15, 3466–3475 CrossRef CAS PubMed.
- F. C. Maier, M. Dou and M. Fyta, High Performance Computing in Science and Engineering’19, Springer, 2021, pp. 155–166 Search PubMed.
Footnote |
| † Electronic supplementary information (ESI) available. See DOI: https://doi.org/10.1039/d2ra06928h |
| This journal is © The Royal Society of Chemistry 2023 |

