
 Open Access Article
 This Open Access Article is licensed under a Creative Commons Attribution-Non Commercial 3.0 Unported Licence
Recycling of NdFeB magnets employing oxidation, selective leaching, and iron precipitation in an autoclave
Elif Emil-Kaya *abc,
Buse Polata,
Srecko Stopica,
Sebahattin Gürmenb and
Bernd Friedricha
*abc,
Buse Polata,
Srecko Stopica,
Sebahattin Gürmenb and
Bernd Friedricha
aIME Process Metallurgy and Metal Recycling, RWTH Aachen University, Aachen 52056, Germany. E-mail: eemil@ime-aachen.de
bDepartment of Metallurgical & Materials Eng., Istanbul Technical University, Istanbul 34469, Turkey
cDepartment of Materials Science and Tech., Turkish-German University, Istanbul 34820, Turkey
First published on 5th January 2023
Abstract
The increasing production of neodymium–iron–boron (NdFeB) magnets for technological applications results in disposal problems. NdFeB magnets contain a significant quantity of rare earth elements (REEs). China is the largest REEs producer, but it applies quotas and increases the export prices of REEs. To address this issue, this study aims at investigating the recovery process of REEs from scrap NdFeB magnets. After oxidation of NdFeB magnet powders, selective leaching with nitric acid was carried out to achieve high-purity REE-rich leaching liquor. First, the oxidation kinetics of NdFeB powders was studied in detail to determine the oxidation temperature and duration. Afterwards, the effects of selective leaching parameters, including acid concentration, leaching temperature, stirring speed and solid/liquid ratio, were examined by analysis of variance (ANOVA) analysis based on Taguchi method. The most substantial parameters were assigned to be the temperature and solid/liquid ratio. Eventually, the dissolution kinetics were studied to propose a model for REEs. Several universal equations for dissolution kinetics were tested, and (1 − (1 − x) = k × tn) gives the best results for REEs. The findings show that the leaching process follows the shrinking core model. Activation energy was calculated to be 40.375 kJ mol−1 for REEs. As the last step, the iron dissolved during leaching was precipitated as hematite in the autoclave. The hematite precipitation experiments were performed based on the Box–Behnken design. The effect of precipitation parameters was investigated by ANOVA analysis, and the precipitation process was optimized using response surface methodology (RSM), which resulted in the minimum iron and maximum REEs content in the leach liquor.
Introduction
Permanent magnets and rare earth elements (REEs) have wide usage in technological products and applications and form the basis for a new generation of technology. However, REEs were added to the list of critical metals due to the increased demand and the associated supply risk.1–3 REEs are the ones with the highest supply risk among all elements, and are on the list of critical metals in Europe. The critical importance of permanent magnets and REEs led to an increase in efforts to ensure the sustainability of their raw materials. The importance of NdFeB magnets in technological applications and the inclusion of REEs in the list of critical metals led to a search for alternative ways to obtain raw materials.4–6 NdFeB magnets are used in a wide variety of high-tech products; therefore, the recycling of NdFeB magnets whose service life is completed or which are scrapped due to a process error is the most effective alternative solution to the supply problem of raw materials.7–9 There have been plenty of studies on the recovery of REEs using pyrometallurgy and hydrometallurgy.10–18 The widely preferred technique for recovering REEs from waste materials is hydrometallurgy. Hydrometallurgical processes can produce pure products from lower grade and complex streams. In addition, compared to the pyrometallurgical route, the leaching process, which produces less gas emission, may be carried out more simply and scaled up with lower operational costs.19–21Kumari et al. studied the selective leaching of Nd, Pr and Dy from NdFeB magnets of wind turbines. Roasted magnet powders were leached to define optimum leaching parameters. The optimum leaching conditions of 0.5 mol L−1 HCl, 100 g L−1 pulp density, 368 K temperature and 500 rpm stirring speed were determined for achieving 98% purity of REEs. The dissolution kinetics of REEs follow the mixed controlled model in the range of 348 to 368 K. Finally, mixed RE oxides of 99% purity were produced using oxalic acid followed by calcination at 1073 K.22 The effects of solid/liquid ratio, stirring speed, time, temperature, acid type and acid concentration on the selective leaching process of REEs from waste NdFeB magnets were investigated based on the L18 Taguchi orthogonal array by Ni'am et al. Acid type is the most important factor for the selective leaching process of magnets, and leaching of the oxidized sample with 5 mol L−1 HCl at 368 K and 2% solid–liquid ratio for 24 h allows selective recovery of REEs.23 Jiang et al. reported that magnet powders roasted at 800 °C were leached under pressure, with the REEs leaching rate of 96.27%, along with 13.33% for Fe. After the water leaching, hematite was separated from the leach liquor. The selective pressure HCl acid leaching process for NdFeB magnets was evaluated in detail.24
Yoon et al. proposed a leaching mechanism for NdFeB magnets, and the activation energy was calculated. Nd and Nd2O3 in the NdFeB magnet was converted to Nd2(SO4)3 in solution with 3 mol L−1 H2SO4 and a pulp density of 110.8 g L−1 for 4 h. It was reported that the leaching kinetics followed a shrinking core model.25 Liu et al. studied the selective separation of REEs from iron by a selective pressure leaching process. In this study, REEs and Boron were effectively separated from the iron, especially with the addition of NaNO3 promoter to decrease the level of iron in the leaching solution. Afterwards, boron was recovered by the solvent extraction process.26 In another study reported by Mao et al., the effect of mechanical activation of oxidized magnet powder on the efficiency of selective leaching process by low-concentration HCl was investigated. The reactivity of magnet powder increased with ball milling activation. It enhanced the leaching speed and leaching efficiency of REEs.27 Considering the studies in the literature, selective leaching of NdFeB with HNO3 was not investigated in detail. In addition, hematite precipitation is a well-known method in hydrometallurgy, but it is still an outstanding topic for the recycling of NdFeB magnets.
Dutricaz et al. investigated hematite precipitation from ferric chloride at a temperature less than 100 °C at atmospheric pressure. The formation of β-FeO·OH was observed at approximately 60 °C by controlling the seeding and changing the molarity of the solution. Prolonged retention time favored a stable hematite phase, at times longer than 100 h, where only hematite phase was observed.28 In the zinc industry, the hematite precipitation process has been employed for the iron removal process. Cheng et al. elucidated the kinetics and chemistry of hematite precipitation. In their study, hematite was formed through the oxydrolysis reaction of ferrous sulphate at temperatures between 195 and 200 °C at a pressure in the range of 103 to 414 kPa.29
The aim of this work to was examine the oxidation of NdFeB magnet powders and their selective leaching and hematite precipitation in the autoclave. The leaching optimization and kinetics study on the dissolution of REEs from NdFeB magnet powders with nitric acid for the functions of solid/liquid ratio, acid concentration, stirring speed and temperature were investigated based on the experimental design method and statistical analysis. Afterwards, the influence of temperature, time and water addition on the precipitation of iron and REEs in the autoclave was examined by ANOVA analysis on the basis of Box–Behnken experimental design. Moreover, the effect of process parameters and their relationship on the iron and REEs precipitation are investigated via response surface methodology.
Experimental
Scrap NdFeB magnet powder and oxidized powder characterization
Waste NdFeB magnet samples were supplied in bulk form. The samples were crushed to obtain suitable particle size for leaching experiments using a jaw crusher (Retsch GmbH, Haan, Germany); subsequently, the powders were sieved with a vibratory sieve shaker (Retsch, AS200). X-ray fluorescence (XRF) spectroscopy (Panalytical WDXRF spectrometer, Malvern Panalytical B.V., Eindhoven, Netherlands) and inductively coupled plasma optical emission spectroscopy ICP-OES (SPECTRO ARCOS, SPECTRO Analytical Instruments GmbH, Kleve, Germany) analyses were conducted to determine the elemental composition of NdFeB magnet powders.Oxidation of NdFeB magnet powders
The oxidation of NdFeB magnet powders was performed in a muffle furnace. The experiments for calculation of weight gain were implemented by heating 1 g of magnet powder in an alumina crucible in a muffle furnace. After the furnace reached each desired temperature, 1 g of sample was placed into the hot zone of the muffle furnace and held in ambient air for the desired durations. Afterwards, the samples were weighed, and graphs of the weight gain versus time were drawn. On the basis of the graphs of weight gain – time and the DTA-TG analysis, the optimum oxidation temperature was determined. Phase analysis of the oxidized magnet powders was carried out with the LynxEye detector, applying Cu-Kα radiation (λ = 1.54187 Å) in the X-ray diffractometer (Bruker D8 Advance) in the 2θ range of 10–90°. To reveal the particle size distribution of the oxidized magnet powders, dynamic particle analysis was conducted with an M5 lens by SympaTech QuickPick Oasis. The morphology of the oxidized NdFeB magnet powders was by revealed scanning electron microscope (Zeiss Gemini 500).Taguchi experimental design for selective leaching with HNO3
Selective leaching experiments were conducted in a 500 mL three-neck round-bottom glass flask placed on a heating mantle (IKA Werke GmbH, Staufen im Breisgau, Germany) equipped with temperature controller. Nitric acid (65%) was provided by VWR International GmbH, Darmstadt, Germany in analytical grade.One neck of the flask is attached with the probe for the temperature controller; the other neck is used to attach with a condenser; and the other neck is used for feeding and withdrawing the samples during the leaching process at defined time intervals. The leaching solution in the flask was stirred using a mechanical stirrer at a variable speed for 3 h. A Teflon stirrer blade was preferred for the stirring of the solution. The schematic experimental setup for the selective leaching process is exhibited in Fig. 1.
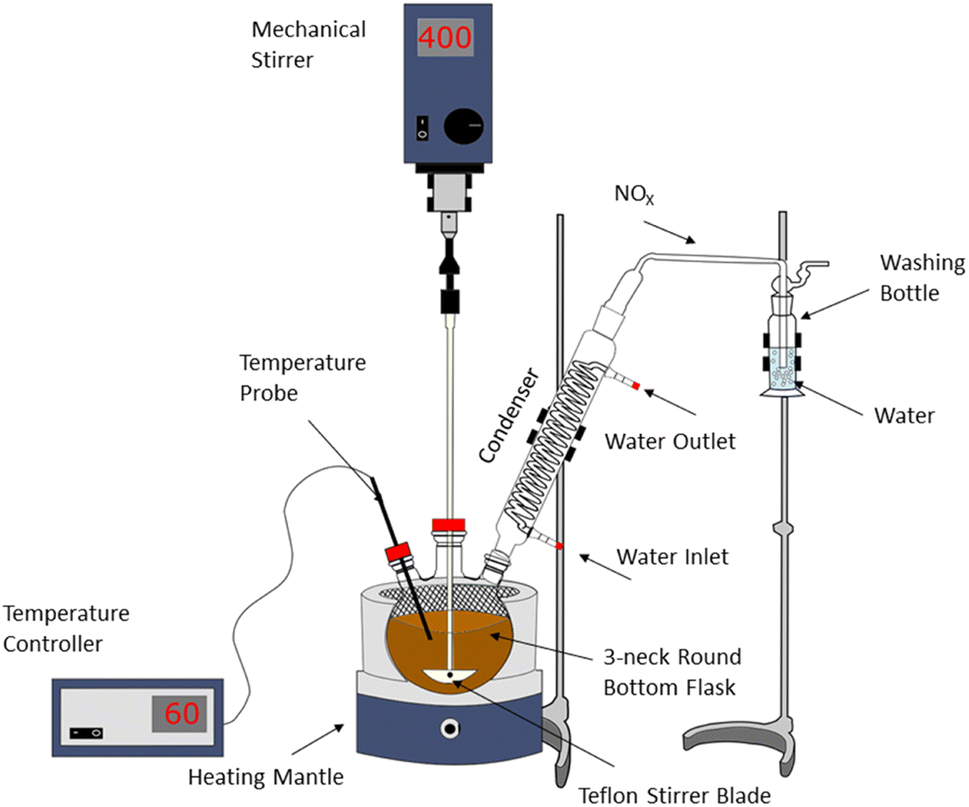 | ||
| Fig. 1 Schematic picture of experimental setup for selective leaching experiments. | ||
To establish the best experimental conditions for the selective leaching process of NdFeB magnets by nitric acid, Taguchi orthogonal array (L9) was employed. The orthogonal array was composed of 4 variables with 3 levels each. The process parameters and their levels for selective leaching can be found in Table 1.
| Parameters | Levels | ||
|---|---|---|---|
| 1 | 2 | 3 | |
| Acid concentration (mol L−1) | 1 | 2 | 3 |
Solid![[thin space (1/6-em)]](https://www.rsc.org/images/entities/char_2009.gif) :liquid ratio :liquid ratio |
1/10 | 1/20 | 1/30 |
| Process temperature (°C) | 40 | 60 | 80 |
| Stirring speed (rpm) | 200 | 350 | 500 |
After the optimum process parameters were defined by using the Taguchi plots, the leaching process was analysed using several kinetic models at different leaching temperatures.
After selective dissolution of REEs, leach solution was filtered by vacuum filtration setup. After filtration, the pregnant leach solutions were sampled to elucidate the dissolution of REEs and iron. Potentiometric titration of Fe2+ in the solution was performed with cerium(IV) sulfate using a titration system (Metrohm Dosimat 655, Titrosampler 855). Finally, the kinetic calculation was performed to define the leaching control mechanism of REEs and iron.
Box–Behnken design for hematite precipitation in the autoclave
During selective leaching process, iron dissolution was observed. The dissolved iron was precipitated in the autoclave. Fig. 2 illustrates the schematic diagram of the autoclave.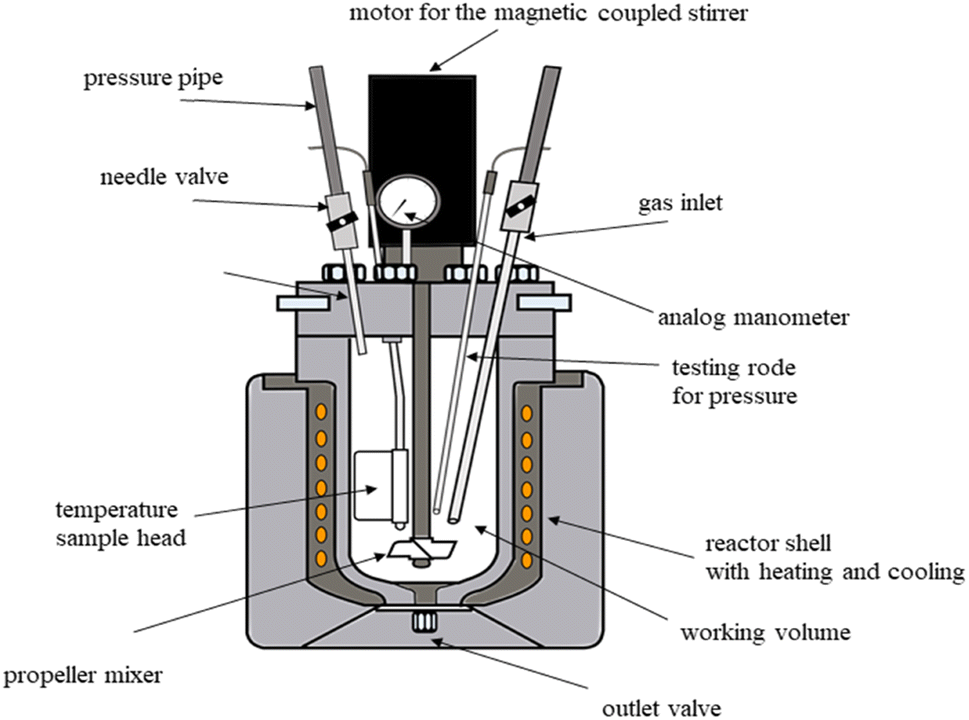 | ||
| Fig. 2 Schematic diagram of the autoclave. | ||
Before precipitation experiments, some preliminary experiments for iron precipitation in the autoclave were performed. However, the precipitation ratio of iron was found to be low based on the result of preliminary experiments. Before the iron precipitation in the autoclave, with the aim of removal of iron from the system, the pH value of the leach solution was increased by adding NH4OH until it reached approximately 1. After that, the pH value of the solutions with water addition of 0%, 25%, and 50% were measured. The pH value of the solutions were approximately 1, 1.2, and 1.4, respectively.
A Box–Behnken design was employed for the iron removal process in an autoclave under pressure. The precipitation experiments in the autoclave were conducted with three parameters in three levels. Process temperature was adjusted in three levels of 140, 160, and 180 °C, process time of 2, 4, and 6 h, and water addition of 0, 25 and 50%. The process parameters and their levels can be found in Table 2.
| Parameters | Levels | ||
|---|---|---|---|
| 1 | 2 | 3 | |
| Process temperature (°C) | 140 | 160 | 180 |
| Time (h) | 2 | 4 | 6 |
| Water addition (%) | 0 | 25 | 50 |
Afterwards, Taguchi and ANOVA analyses were conducted to define the optimal process conditions. Optimization tool in MINITAB was employed to specify the optimal process parameters for achieving both maximum REEs extraction and minimum iron extraction.
Results and discussion
Characterization of NdFeB magnet powders
The composition of NdFeB magnet powder was determined using XRF. Table 3 shows the phase composition of NdFeB magnet powder. As can be seen in Table 3, the presence of Fe, Nd and Pr, as well as small amounts of Dy, Al, Si, Co, Mn, and Pd, was detected with XRF analysis. The results of ICP-OES analysis of NdFeB magnet powders is shown in Table 4.| Component | Na2O | Al2O3 | SiO2 | MnO | Fe2O3 |
| Concentration (%) | 0.34 | 0.42 | 0.24 | 1.97 | 68.1 |
| Component | Co3O4 | CuO | Ga2O3 | As2O3 | Nb2O5 |
| Concentration (%) | 0.70 | 0.14 | 0.20 | 0.21 | 0.12 |
| Component | PdO | Pr2O3 | Nd2O3 | Tb4O7 | Other |
| Concentration (%) | 0.24 | 5.72 | 20.4 | 0.70 | 0.50 |
| Composition | B | Co | Cr | Cu | Dy |
| Concentration (%) | 0.877 | 0.773 | < 0.1 | 0.102 | 0.662 |
| Composition | Fe | Mo | Nd | Ni | Pr |
| Concentration (%) | 66.27 | < 0.1 | 23.9 | < 0.1 | 7.38 |
Oxidation of NdFeB magnet powders
During oxidation of the powder samples, various phases were observed in previous literature (NdFeO3, PrFeO3, Nd2O3). Analysis of Gibbs energy at different temperatures was investigated based on eqn (1) and (2):|
2M + 3/2O2 → M2O3M: Fe, Nd, Dy, B
| (1) |
|
M1 + M2 + 3/2O2 → M1M2O3M: Fe, Nd, Dy, B
| (2) |
Thermochemical calculation was used to predict the possible phase formation and its corresponding sequence, and this is shown in Fig. 3.
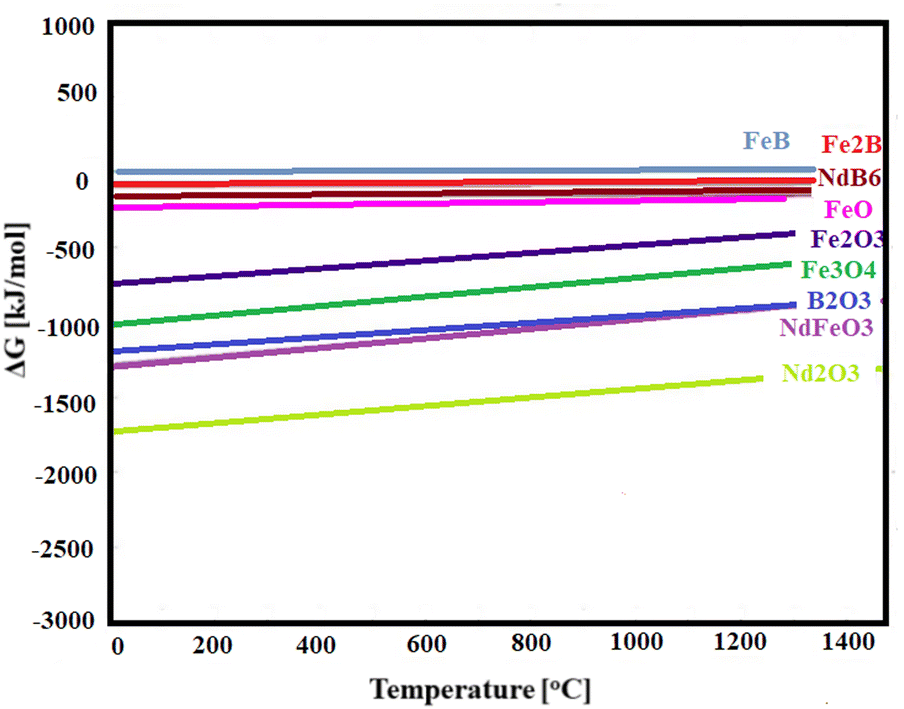 | ||
| Fig. 3 Phase formation during oxidation of NdFeB magnets. | ||
The figures demonstrated that the first phase to form will be Nd2O3 due to its most negative standard free enthalpy of formation (ΔG°), following by NdFeO3 and finishing with Fe2B, as the line of FeB is slightly above 0, corresponding to a non-spontaneous reaction. Based on the composition of the raw materials, the phases of Nd2O3, NdFeO3 and FexOy are highly expected. Fig. 4 illustrates the DTA-TGA analysis of NdFeB magnet powders.
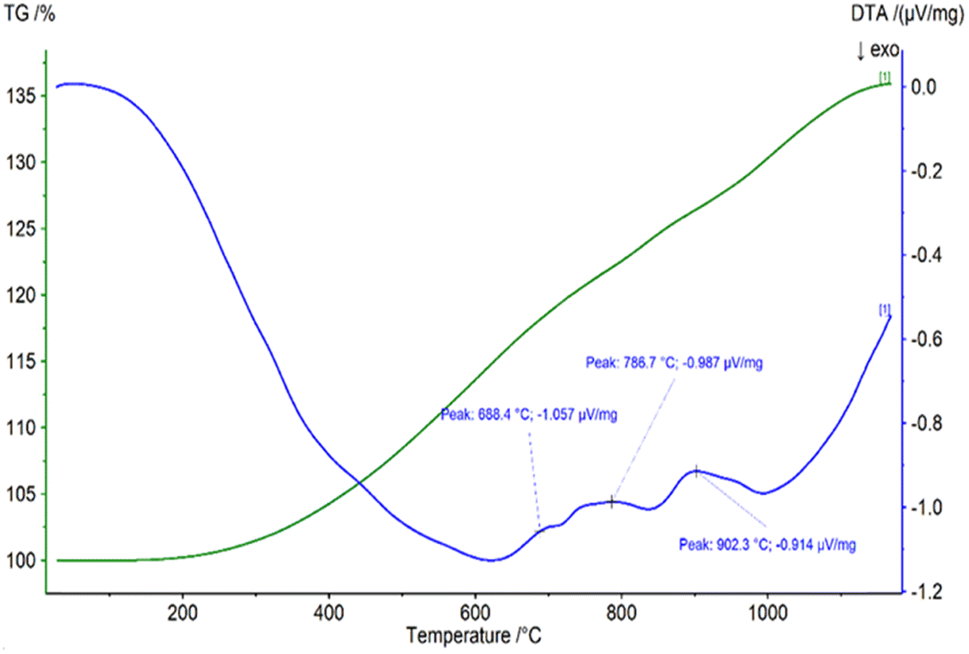 | ||
| Fig. 4 DTA-TGA analysis of NdFeB magnet powders in air (10 K min−1). | ||
Because of an oxidation process, TGA analysis revealed an increased sample mass of about 35% between room temperature and 1100 °C, which is very close to the total calculated theoretical value (36.8%) for the oxidation of Fe, REEs and B. The calculated theoretical value for the oxidation of REEs amounts to 3.6%. DTA analysis revealed three peaks at 688, 786, and 902 °C, respectively, that show different types of oxide can be formed.
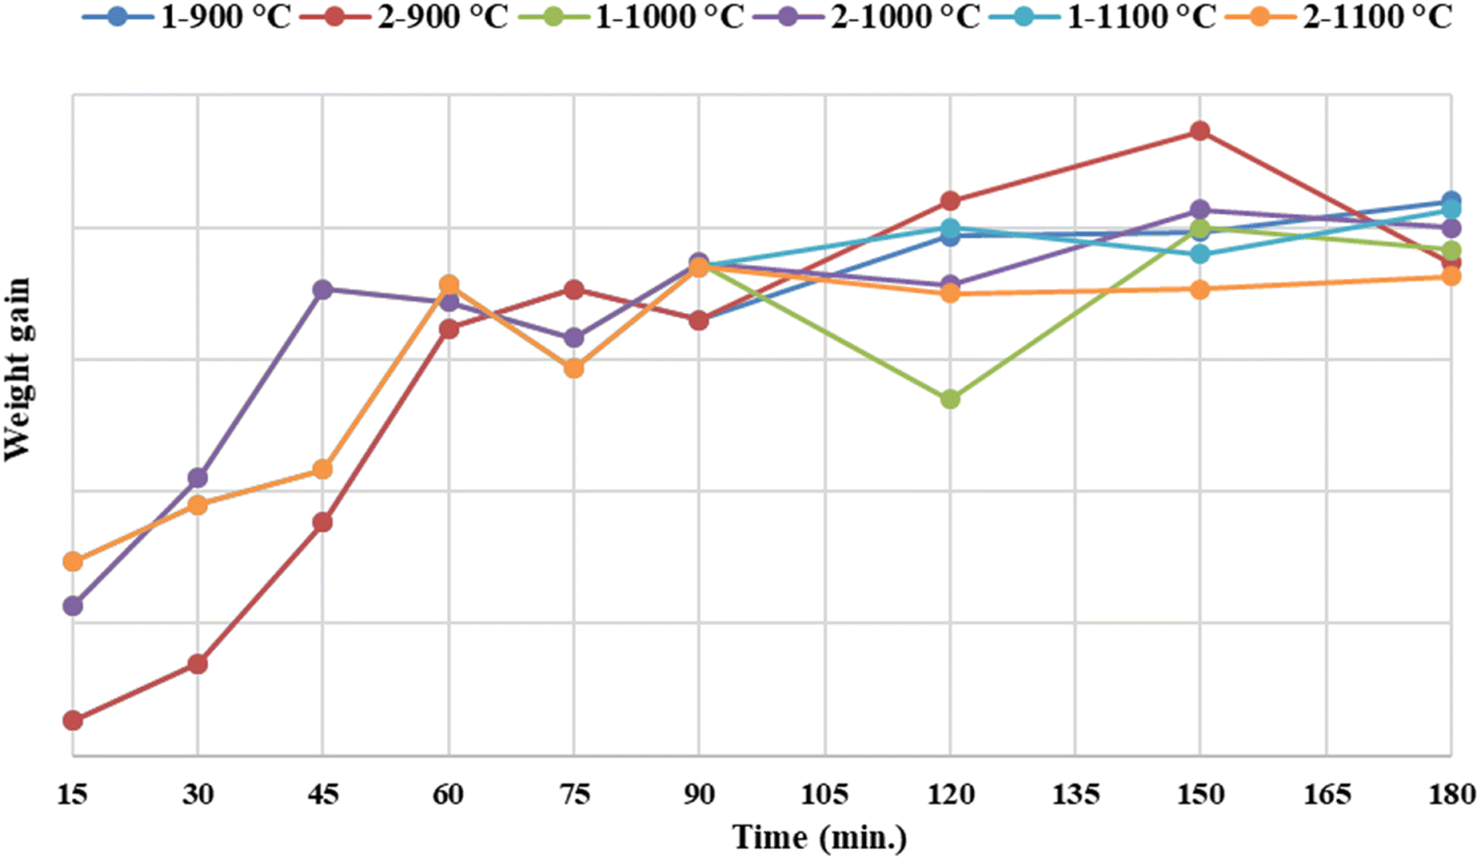
Firstly, to determine the oxidation temperature and time, magnet powders were oxidized at different temperatures for 15, 30, 45, 60, 75, 90, 120, 150 and 180 min. The weight gains of samples were calculated, and the graph of the weight gain and time were drawn, shown in Fig. 5.
 | ||
| Fig. 5 Graphic of the weight gain and time at 900, 1000 and 1100 °C. | ||
On the basis of DTA-TGA analysis, 900, 1000 and 1100 °C were chosen as the oxidation temperature. The experiments at 120, 150 and 180 minutes were implemented twice in order to have more precise data. After the desired holding time was reached, samples were taken from the furnace and weighed immediately.
The values of weight gain were summed up and averaged. The oxidation temperature was determined to be 900 °C for 150 min.
Fig. 6 illustrates the XRD analysis of the oxidized magnet powders at 900 °C for 150 min.
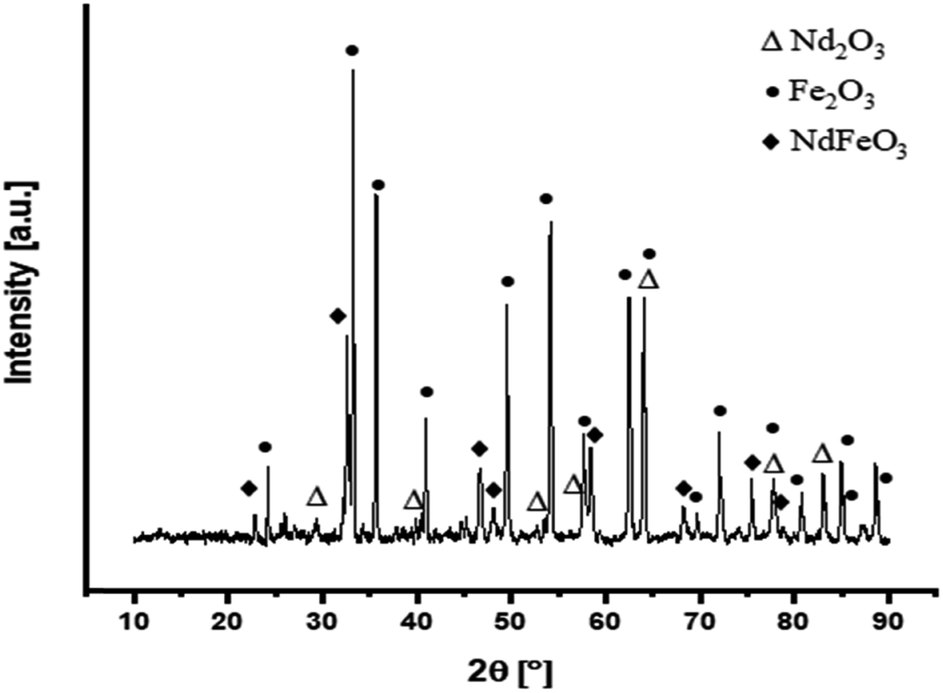 | ||
| Fig. 6 XRD analysis of the oxidized magnet powders at 900 °C for 150 min. | ||
According to the XRD analysis, the oxidized material consists entirely of the metal oxides. Through the oxidation, Nd2Fe14B decomposed to form Fe2O3, Nd2O3 and NdFeO3. The XRD peaks in Fig. 6 correspond to rhombohedral Fe2O3, orthorhombic NdFeO3, hexagonal Nd2O3 with the space group of R![[3 with combining macron]](https://www.rsc.org/images/entities/char_0033_0304.gif) c (JCPDS #01-084-0307), Pnma (JCPDS #01-089-6644) and Pm1 (JCPDS #00-006-0408), respectively. Fig. 7 shows SEM images of the oxidized NdFeB magnet particles with EDS analysis.
c (JCPDS #01-084-0307), Pnma (JCPDS #01-089-6644) and Pm1 (JCPDS #00-006-0408), respectively. Fig. 7 shows SEM images of the oxidized NdFeB magnet particles with EDS analysis.
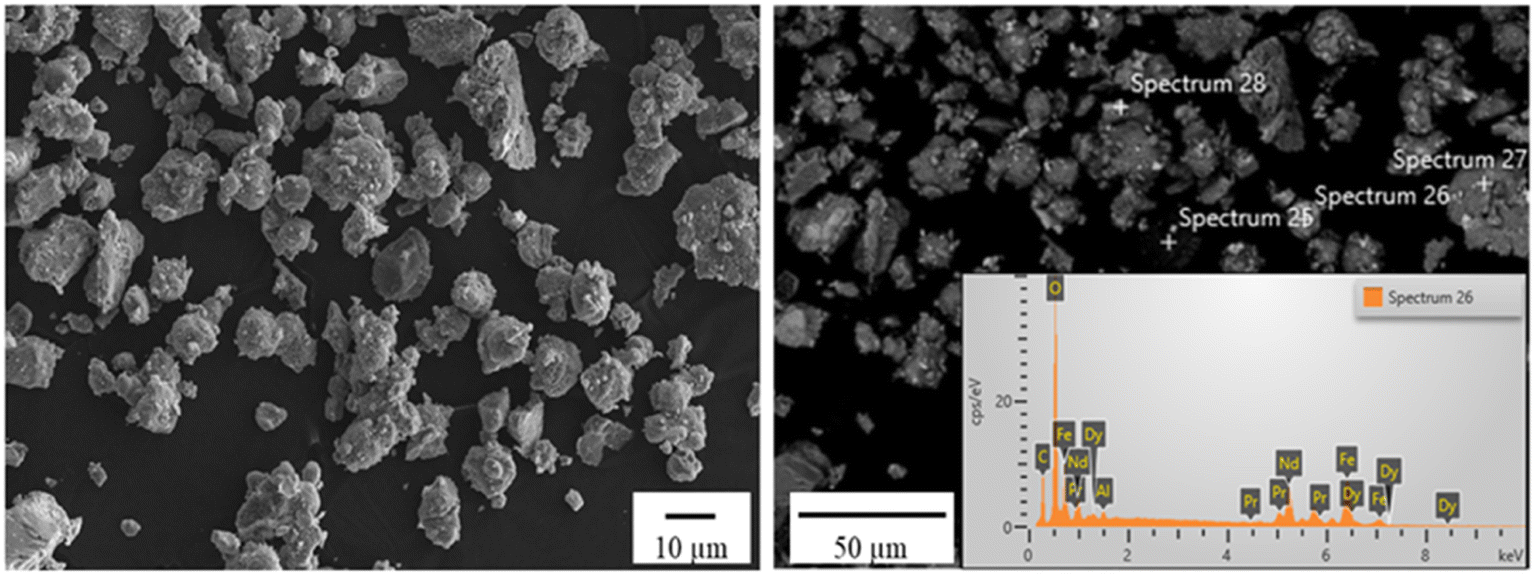 | ||
| Fig. 7 SEM images of the oxidized NdFeB magnet powders with EDS analysis. | ||
The morphology of the oxidized NdFeB magnet powders was irregular, having a narrow size distribution. Furthermore, EDS analysis confirmed the presence of Nd, Fe, Pr, Dy and O. Fig. 8 shows the dynamic particle analysis of the NdFeB magnet powders.
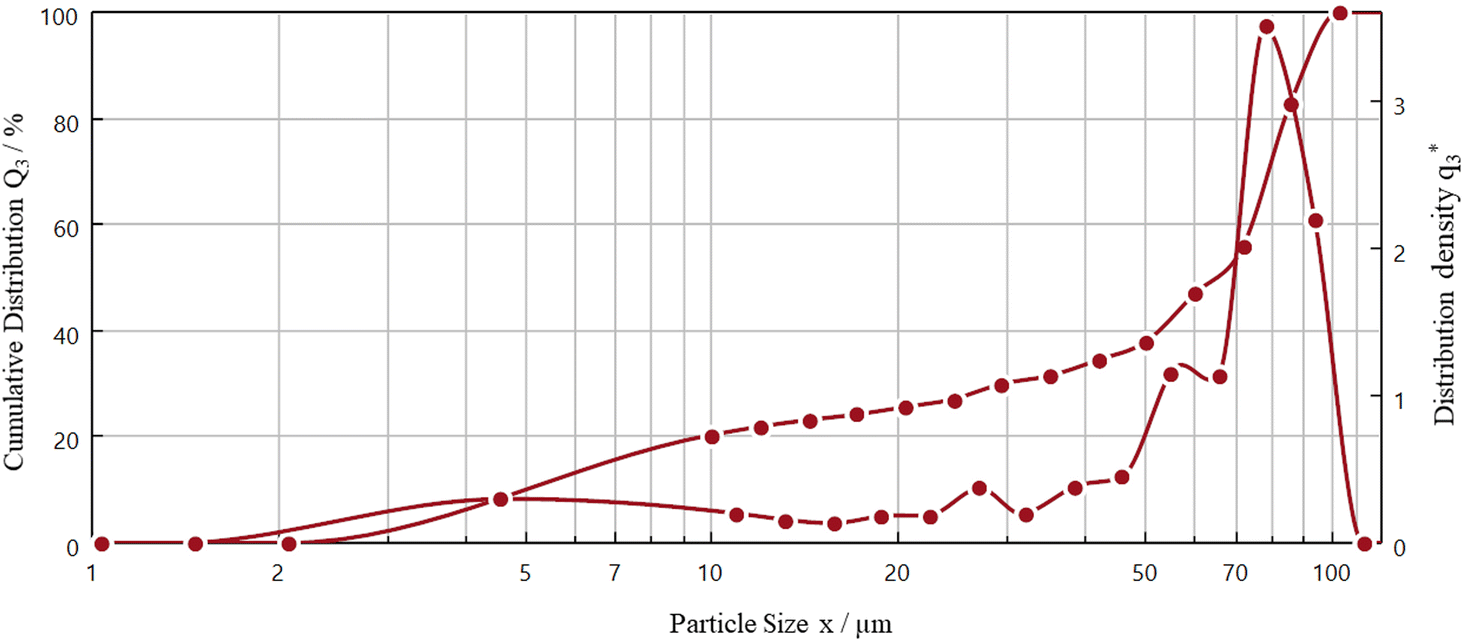 | ||
| Fig. 8 Dynamic particle analysis of the oxidized NdFeB magnet powders. | ||
Fig. 8 reveals the distribution density  and cumulative distribution (Q3) of the oxidized NdFeB magnet powders with the diameter (EQPC)-value of the NdFeB magnet powders. According to the distribution sum (Q3), the d90.3, d50.3, d10.3 values are 92.62 μm, 64.04 μm and 5.96 μm, respectively. These results confirm that 90.3% of the oxidized NdFeB magnet powders range in size from 5.96 to 100 μm. The distribution density of powders
  reaches its global maximum at ∼80 μm.
Taguchi analysis of selective leaching process and statistical analysis
Considering the environmental factors, maximum leaching efficiency was aimed with minimum acid consumption for the design of the leaching experiments. Reactions for Nd and Fe (main components in waste NdFeB magnet) dissolution in HNO3 are given in eqn (3) and (4).| NdFeO3(k) + 6HNO3(aq) → Nd(NO3)3 + Fe(NO3)3 + 3H2O(g) | (3) |
| Fe2O3(k) + 6HNO3(aq) → 2Fe(NO3)3 + 3H2O | (4) |
The three-level L9 orthogonal array was employed to optimize the leaching efficiency of iron and REEs. Table 5 gives the selective leaching parameters, the level of experiments and chemical analysis results determined by ICP analysis. The S/N ratios for REEs and iron were calculated. Table 5 presents the S/N ratio values for each experiment.
| Code | Molar. of acid (mol L−1) | S/L ratio | Temperature (°C) | Stirring speed (rpm) | Leach. Eff. [Fe] | S/N for Fe (db) | Leach. Eff. [REE] | S/N for REEs (db) |
|---|---|---|---|---|---|---|---|---|
| L1 | 1 | 1:10 |
RT | 200 | 19.7 | −5.88 | 255 | 48.13 |
| L2 | 1 | 1:30 |
40 | 350 | 60.5 | −15.63 | 170 | 44.60 |
| L3 | 1 | 1:50 |
60 | 500 | 218 | −26.76 | 205 | 46.23 |
| L4 | 2 | 1:10 |
40 | 500 | 162 | −24.19 | 523 | 54.37 |
| L5 | 2 | 1:30 |
60 | 200 | 915 | −39.22 | 515 | 54.23 |
| L6 | 2 | 1:50 |
RT | 350 | <1 | 20.0 | 57 | 35.11 |
| L7 | 3 | 1:10 |
60 | 350 | 2530 | −48.06 | 1457 | 63.26 |
| L8 | 3 | 1:30 |
RT | 500 | 12.2 | −1.727 | 115 | 41.21 |
| L9 | 3 | 1:50 |
40 | 200 | 157 | −23.91 | 178 | 45.00 |
F-values, MS, and SS values can be determined by statistical analysis. Tables 6 and 7 represent the calculated values for the extraction of REEs and the extraction of Fe, respectively. Tables 8 and 9 represent the calculated values with F-value for the extraction of REEs and the extraction of iron, respectively.
| Parameter | DoF | SS | MS | F-value |
|---|---|---|---|---|
| Acid concentration | 2 | 18.491 | 9.246 | |
| Solid/liquid ratio | 2 | 266.863 | 133.431 | |
| Temperature | 2 | 257.132 | 128.566 | |
| Stirring speed | 2 | 5.715 | 2.858 | |
| Total | 8 | 548.201 |
| Parameter | DoF | SS | MS | F-value |
|---|---|---|---|---|
| Solid/liquid ratio | 2 | 266.863 | 133.431 | 0.0069 |
| Temperature | 2 | 257.132 | 128.566 | 0.0074 |
| Stirring speed | 2 | 24.207 | 6.052 | |
| Total | 8 | 555.594 |
| Parameter | DoF | SS | MS | F-value |
|---|---|---|---|---|
| Acid concentration | 2 | 176.34 | 88.17 | |
| Solid/liquid ratio | 2 | 376.38 | 188.19 | |
| Temperature | 2 | 2701.67 | 1350.83 | |
| Stirring speed | 2 | 110.01 | 55.01 | |
| Total | 8 | 3364.4 |
| Parameter | DoF | SS | MS | F-value |
|---|---|---|---|---|
| Solid/liquid ratio | 2 | 376.38 | 188.19 | 0.1867 |
| Temperature | 2 | 2701.6 | 1350.8 | 0.0092 |
| Error | 4 | 286.35 | 71.59 | |
| Total | 8 | 3364.4 |
The F-value illustrates the effect of the leaching parameters on leaching efficiency. Statistical analysis revealed that process temperature and S/L are the important parameters for the leaching efficiency of REEs, and temperature is the most important parameter for theextraction of iron under the working conditions.
Fig. 9 illustrates the effect of the leaching parameters on the optimization criteria for both REEs and iron. According to the Taguchi plots, NdFeB magnet powders should be leached in 4 mol L−1 of nitric acid solution with a S/L ratio of 1:10 and a stirring speed of 200 rpm at a process temperature of 60 °C, with the goal of achieving maximum REEs content in the leach liquor. On the other hand, the magnet powders should be leached in 2.5 mol L−1 of acid concentration with a solid/liquid ratio of 1:50 and stirring speed of 350 rpm at a process temperature of 20 °C, with the aim of achieving minimum iron extraction. Validation experiments were conducted under the specified experimental conditions. The aim of this study is to achieve maximum dissolution of REEs. Afterwards, an iron removal process will be performed to obtain high-purity REEs solution. Although 4 mol L−1 nitric acid concentration was the best parameter, there is not much difference in the Taguchi plots between 1 mol L−1 and 4 mol L−1 of acid concentration. Two validation experiments were performed in a 1 mol L−1 and a 4 mol L−1 nitric acid solution to compare their effect on REEs and iron dissolution. It was observed that there is no notable difference between 1 mol L−1 and 4 mol L−1 of nitric acid solution on the dissolution of REEs.
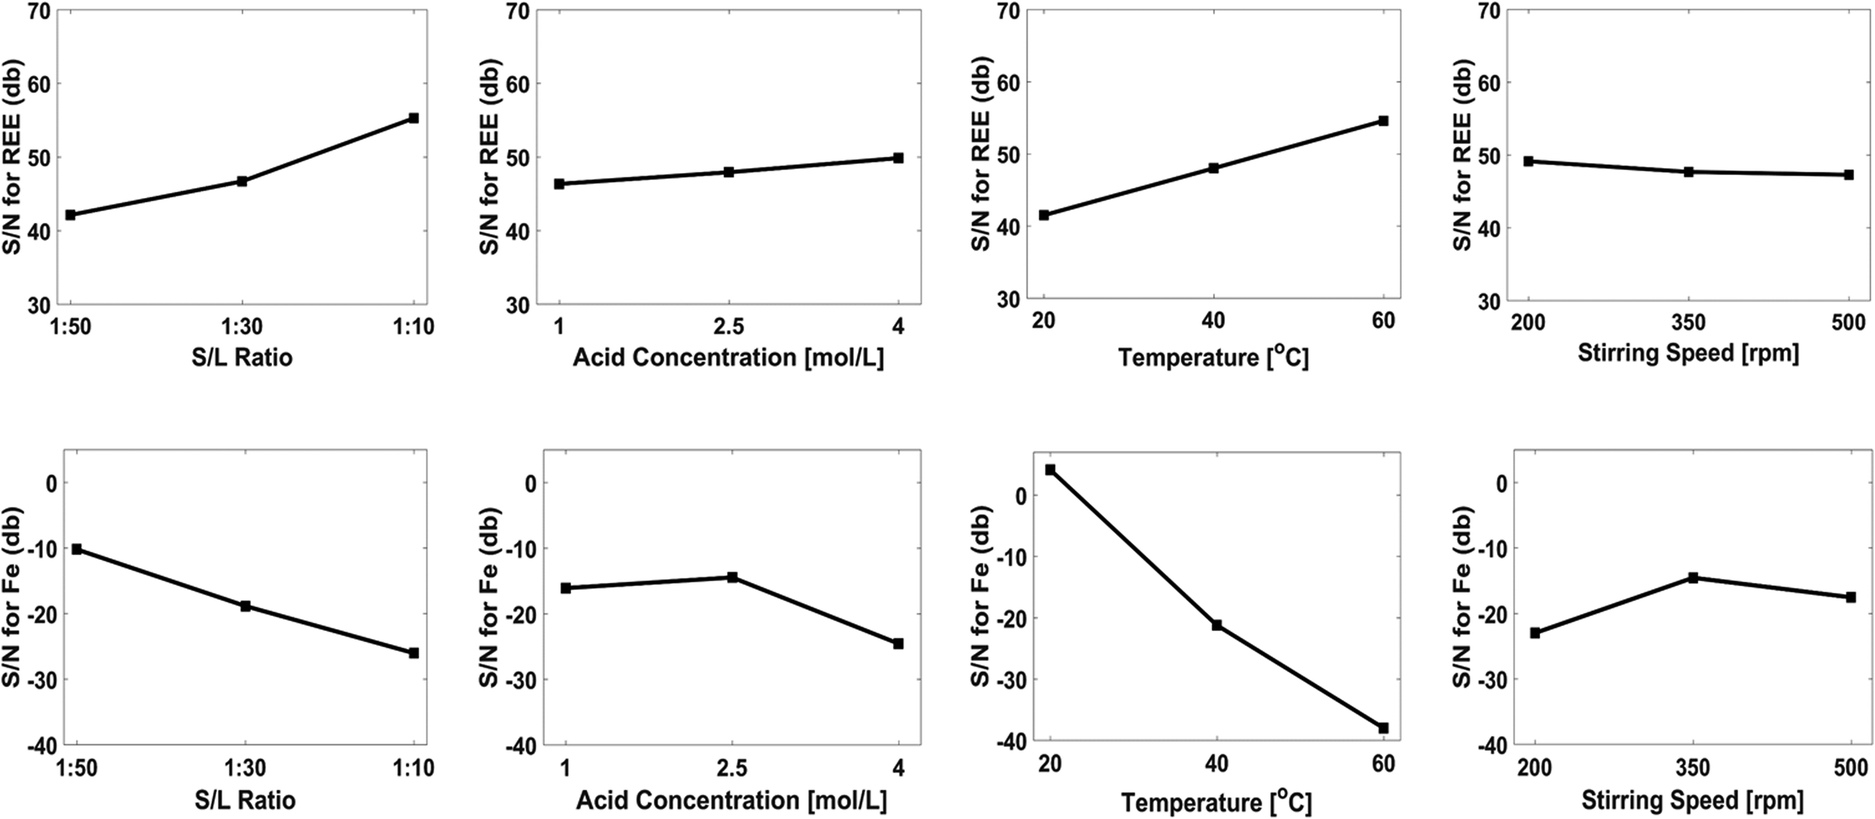 | ||
| Fig. 9 Effect of leaching parameters on the optimization criteria for both REEs and iron. | ||
To understand the effect of leaching time on leaching efficiency of iron and REEs, validation experiments were conducted in 1 mol L−1 and 4 mol L−1 nitric acid solution for 7 h. The chemical analysis results were elucidated, and leaching efficiency of iron and REEs was calculated. Fig. 10a and b show the effect of leaching time on leaching efficiency of iron and REEs in 4 mol L−1 of nitric acid solution and 1 mol L−1 of nitric acid solution, respectively.
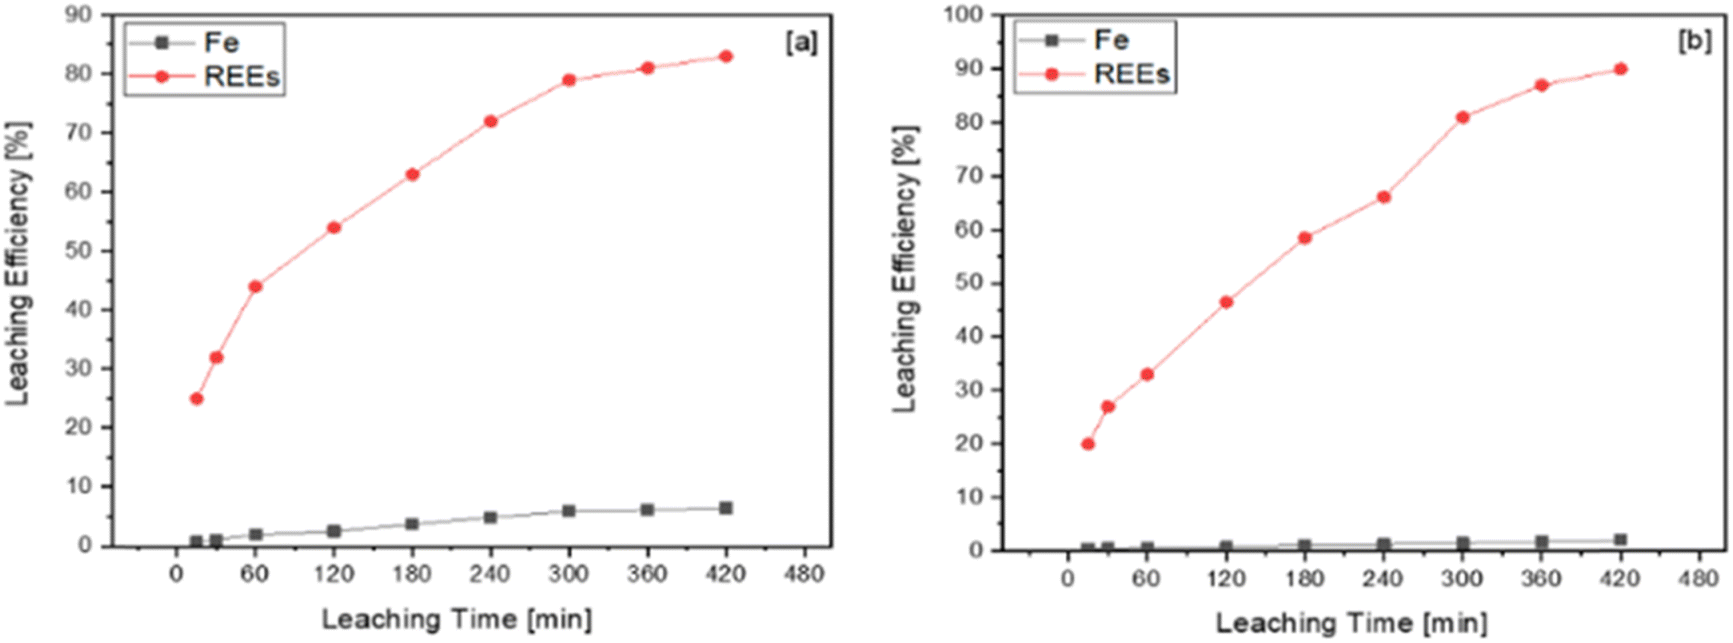 | ||
| Fig. 10 Effect of leaching time on the leaching efficiency of iron and REEs in (a) 4 mol L−1 and (b) 1 mol L−1 of nitric acid solution. | ||
While the duration of leaching showed a minor effect on the leaching efficiency of iron, it showed a major effect on the leaching efficiency of REEs. The dissolution ratio of iron in 4 mol L−1 nitric acid solution was higher than in 1 mol L−1 nitric acid solution. The leaching efficiency of REEs in 1 mol L−1 and 4 mol L−1 of nitric acid solution were approximately 90% and 82%, respectively. REEs dissolution was inhibited by a solubility limit in 4 mol L−1 of the nitric acid solution because iron dissolution ratio in 4 mol L−1 of nitric acid solution is higher than in 1 mol L−1 of the nitric acid solution.
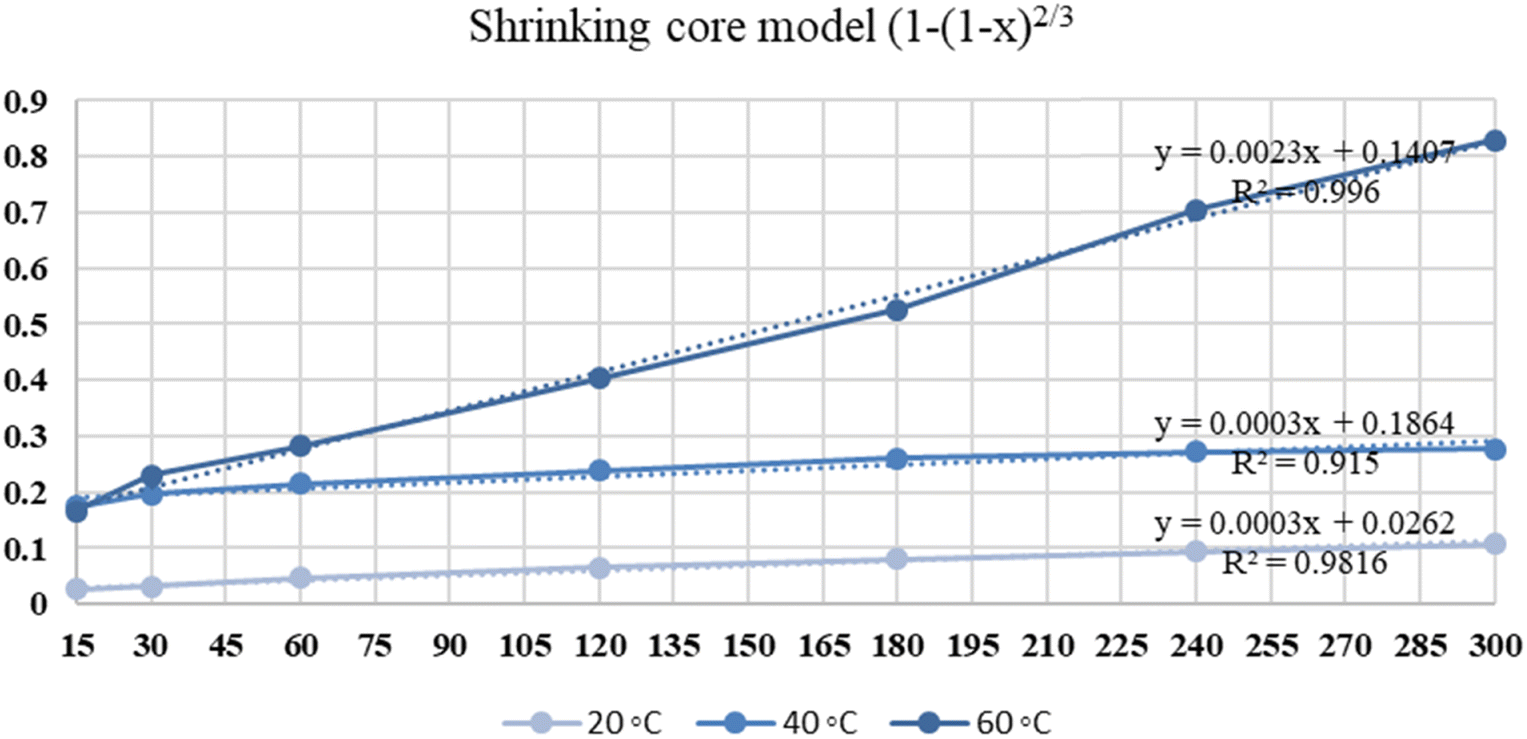
The leaching of NdFeB magnet powders in 1 mol L−1 of nitric acid was analyzed by different kinetic models at different temperatures. Table 10 shows the kinetic models and calculated R2 values for REEs leaching.
| Kinetic models | R2 | k | ||||
|---|---|---|---|---|---|---|
| 20 °C | 40 °C | 60 °C | 20 °C | 40 °C | 60 °C | |
| Mixed controlled −ln(1 − x) | 0.9845 | 0.9238 | 0.946 | 0.0005 | 0.0007 | 0.0078 |
| Diff. through product layer 1−(2/3 × x) − (1 − x)2/3 | 0.9981 | 0.9443 | 0.9423 | 0.00001 | 0.00004 | 0.0007 |
| Chemical reaction control 1 − (1 − x)1/3 | 0.9831 | 0.9195 | 0.9814 | 0.0001 | 0.0002 | 0.0017 |
| Surface reaction control by shrinking core model 1 − (1 − x × 0.45)1/3 | 0.9814 | 0.9137 | 0.9957 | 0.00006 | 0.00008 | 0.0004 |
| Shrinking core model 1 − (1 − x)2/3 | 0.9816 | 0.915 | 0.996 | 0.0003 | 0.0003 | 0.0023 |
The maximum R2 values for REEs dissolution are achieved when the shrinking core model is used. Fig. 11 illustrates the kinetic curve of nitric acid leaching of REEs.
 | ||
| Fig. 11 Kinetic curve of nitric acid leaching of REEs. | ||
The activation energy of the leaching reaction was calculated on the basis of Arrhenius eqn (5).
 | (5) |
k–1/T plots for REEs. Adjusted R2 is approximately 0.5, and R2 is approximately 0.78.
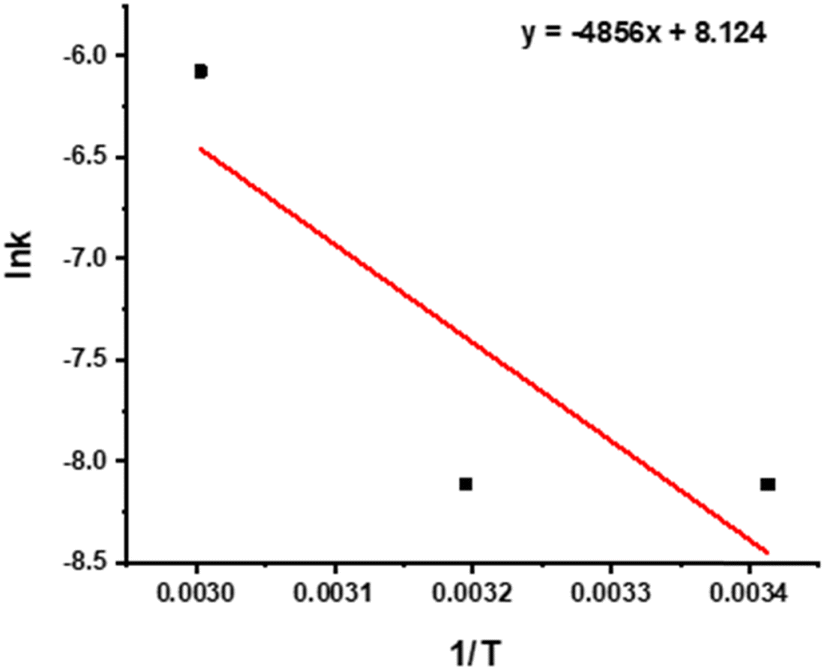 | ||
| Fig. 12 lnk–1/T plots for REEs. | ||
The activation energy was calculated as 40.375 kJ mol−1 for REEs leaching with HNO3.
Characterization of the leach residue
Table 11 shows the XRF analysis of the leach residue obtained from validation experiments performed with 1 mol L−1 of nitric acid solution.| Composition | Co | Fe | Nd | Pr | others, oxides |
|---|---|---|---|---|---|
| % | 0.17 | 77.9 | 1.98 | 0.71 | 19.24 |
The amount of Fe, Nd, and Pr were 77.9%, 1.98%, and 0.71% of the leach residue, respectively.
Iron precipitation in the autoclave
The iron dissolved during the selective leaching was precipitated in the autoclave. The iron precipitation experiments were performed on the basis of the Box–Behnken design. The significant experimental parameters affecting the efficiency of iron removal under pressure and temperature in the autoclave were determined by ANOVA analysis. The precipitation process was optimized with RSM, which results in the minimum iron and maximum REEs content in the leach liquor. Table 12 shows the Box–Behnken matrix and the results concerning the percentage of iron and REEs content in the leach liquor after iron precipitation in the autoclave.| Sample | Process temperature [°C] | Time [h] | Water addition [vol%] | Recovery rate of REEs % | Removal rate of iron % |
|---|---|---|---|---|---|
| A1 | 160 | 6 | 0 | 99.13 | 0.63 |
| A2 | 180 | 6 | 25 | 94.64 | 0.15 |
| A3 | 180 | 4 | 0 | 96.27 | 0.52 |
| A4 | 180 | 4 | 50 | 91.61 | 0.02 |
| A5 | 160 | 2 | 50 | 92.13 | 0.09 |
| A6 | 180 | 2 | 25 | 96.54 | 0.31 |
| A7 | 140 | 2 | 25 | 93.34 | 2.09 |
| A8 | 160 | 4 | 25 | 94.12 | 0.35 |
| A9 | 160 | 6 | 50 | 92.30 | 0.06 |
| A10 | 140 | 4 | 0 | 96.54 | 1.52 |
| A11 | 160 | 2 | 0 | 94.18 | 1.04 |
| A12 | 160 | 4 | 25 | 91.35 | 0.27 |
| A13 | 160 | 4 | 25 | 93.25 | 0.30 |
| A14 | 140 | 6 | 25 | 90.92 | 0.35 |
| A15 | 140 | 4 | 50 | 90.57 | 0.11 |
Model fitting, statistical analysis and response surface analysis
The empirical relationship between the input parameters (temperature T, time TM, and water addition W) and the output variables was examined through regression analysis. The equations for the precipitation of REEs and iron are given in eqn (6) and (7), respectively.| REEs = 98.2 − 0.025T − 1.79TM − 0.185W + 0.00014T × T + 0.224 TM × TM + 0.00126W × W + 0.0032T × TM + 0.00065T × W − 0.0207T × W | (6) |
| Fe = 29.55 − 0.272T − 2.105TM − 0.0962W + 0.000632T × T + 0.0414TM × TM + 0.000027W × W + 0.00987T × TM + 0.000455T × W + 0.00190TM × W | (7) |
Eqn (6) provides the regression equation for the precipitation of REEs, which has R2 = 78.50% and R2-adjusted = 39.81%. Moreover, eqn (7) provides the regression equation for iron precipitation, which has R2 = 92.11% and R2-adjusted = 77.90%. ANOVA was carried out for the precipitation of iron and REEs.
The F-value for each parameter presents the influence of the precipitation parameters on the purity of the solution. A P-value of less than 0.05 indicates the statistical significance of each process parameter. Tables 13 and 14 provide the MS, SS, F-value, and P-value of process parameters for REEs and iron, respectively.
| Source | DF | Adj SS | Adj MS | F-value | P-value |
|---|---|---|---|---|---|
| Model | 9 | 67.8754 | 7.5417 | 2.03 | 0.226 |
| Linear | 3 | 58.1677 | 19.3892 | 5.22 | 0.053 |
| Temperature | 1 | 7.4112 | 7.4112 | 1.99 | 0.217 |
| Time | 1 | 0.0036 | 0.0036 | 0.00 | 0.976 |
| Water addition | 1 | 50.7528 | 50.7528 | 13.65 | 0.014 |
| Square | 3 | 4.9120 | 1.6373 | 0.44 | 0.734 |
| Temperature × temperature | 1 | 0.0113 | 0.0113 | 0.00 | 0.958 |
| Time × time | 1 | 2.9769 | 2.9769 | 0.80 | 0.412 |
| Water addition × water addition | 1 | 2.2922 | 2.2922 | 0.62 | 0.468 |
| 2-Way interaction | 3 | 4.7957 | 1.5986 | 0.43 | 0.741 |
| Temperature × time | 1 | 0.0676 | 0.0676 | 0.02 | 0.898 |
| Temperature × water addition | 1 | 0.4225 | 0.4225 | 0.11 | 0.750 |
| Time × water addition | 1 | 4.3056 | 4.3056 | 1.16 | 0.331 |
| Error | 5 | 18.5873 | 3.7175 | ||
| Lack-of-fit | 3 | 14.5741 | 4.8580 | 2.42 | 0.306 |
| Pure error | 2 | 4.0133 | 2.0066 | ||
| Total | 14 | 86.4628 |
| Source | DF | Adj SS | Adj MS | F-value | P-value |
|---|---|---|---|---|---|
| Model | 9 | 4.52395 | 0.50266 | 6.48 | 0.027 |
| Linear | 3 | 3.33318 | 1.11106 | 14.33 | 0.007 |
| Temperature | 1 | 1.17811 | 1.17811 | 15.19 | 0.011 |
| Time | 1 | 0.68445 | 0.68445 | 8.83 | 0.031 |
| Water addition | 1 | 1.47061 | 1.47061 | 18.96 | 0.007 |
| Square | 3 | 0.32355 | 0.10785 | 1.39 | 0.348 |
| Temperature × temperature | 1 | 0.23619 | 0.23619 | 3.05 | 0.141 |
| Time × time | 1 | 0.10103 | 0.10103 | 1.30 | 0.305 |
| Water addition × water addition | 1 | 0.00108 | 0.00108 | 0.01 | 0.911 |
| 2-Way interaction | 3 | 0.86722 | 0.28907 | 3.73 | 0.095 |
| Temperature × time | 1 | 0.62410 | 0.62410 | 8.05 | 0.036 |
| Temperature × water addition | 1 | 0.20702 | 0.20702 | 2.67 | 0.163 |
| Time × water addition | 1 | 0.03610 | 0.03610 | 0.47 | 0.525 |
| Error | 5 | 0.38774 | 0.07755 | ||
| Lack-of-fit | 3 | 0.38448 | 0.12816 | 78.46 | 0.013 |
| Pure error | 2 | 0.00327 | 0.00163 | ||
| Total | 14 | 4.91169 |
Statistical analysis revealed that while water addition is the most important parameter for the precipitation of REEs, temperature, time and water addition are the significant parameters for the removal of iron in the autoclave under the experimental working conditions. Fig. 13 illustrates the surface response and contour plots for determining the maximum REEs and minimum iron content in the leach liquor.
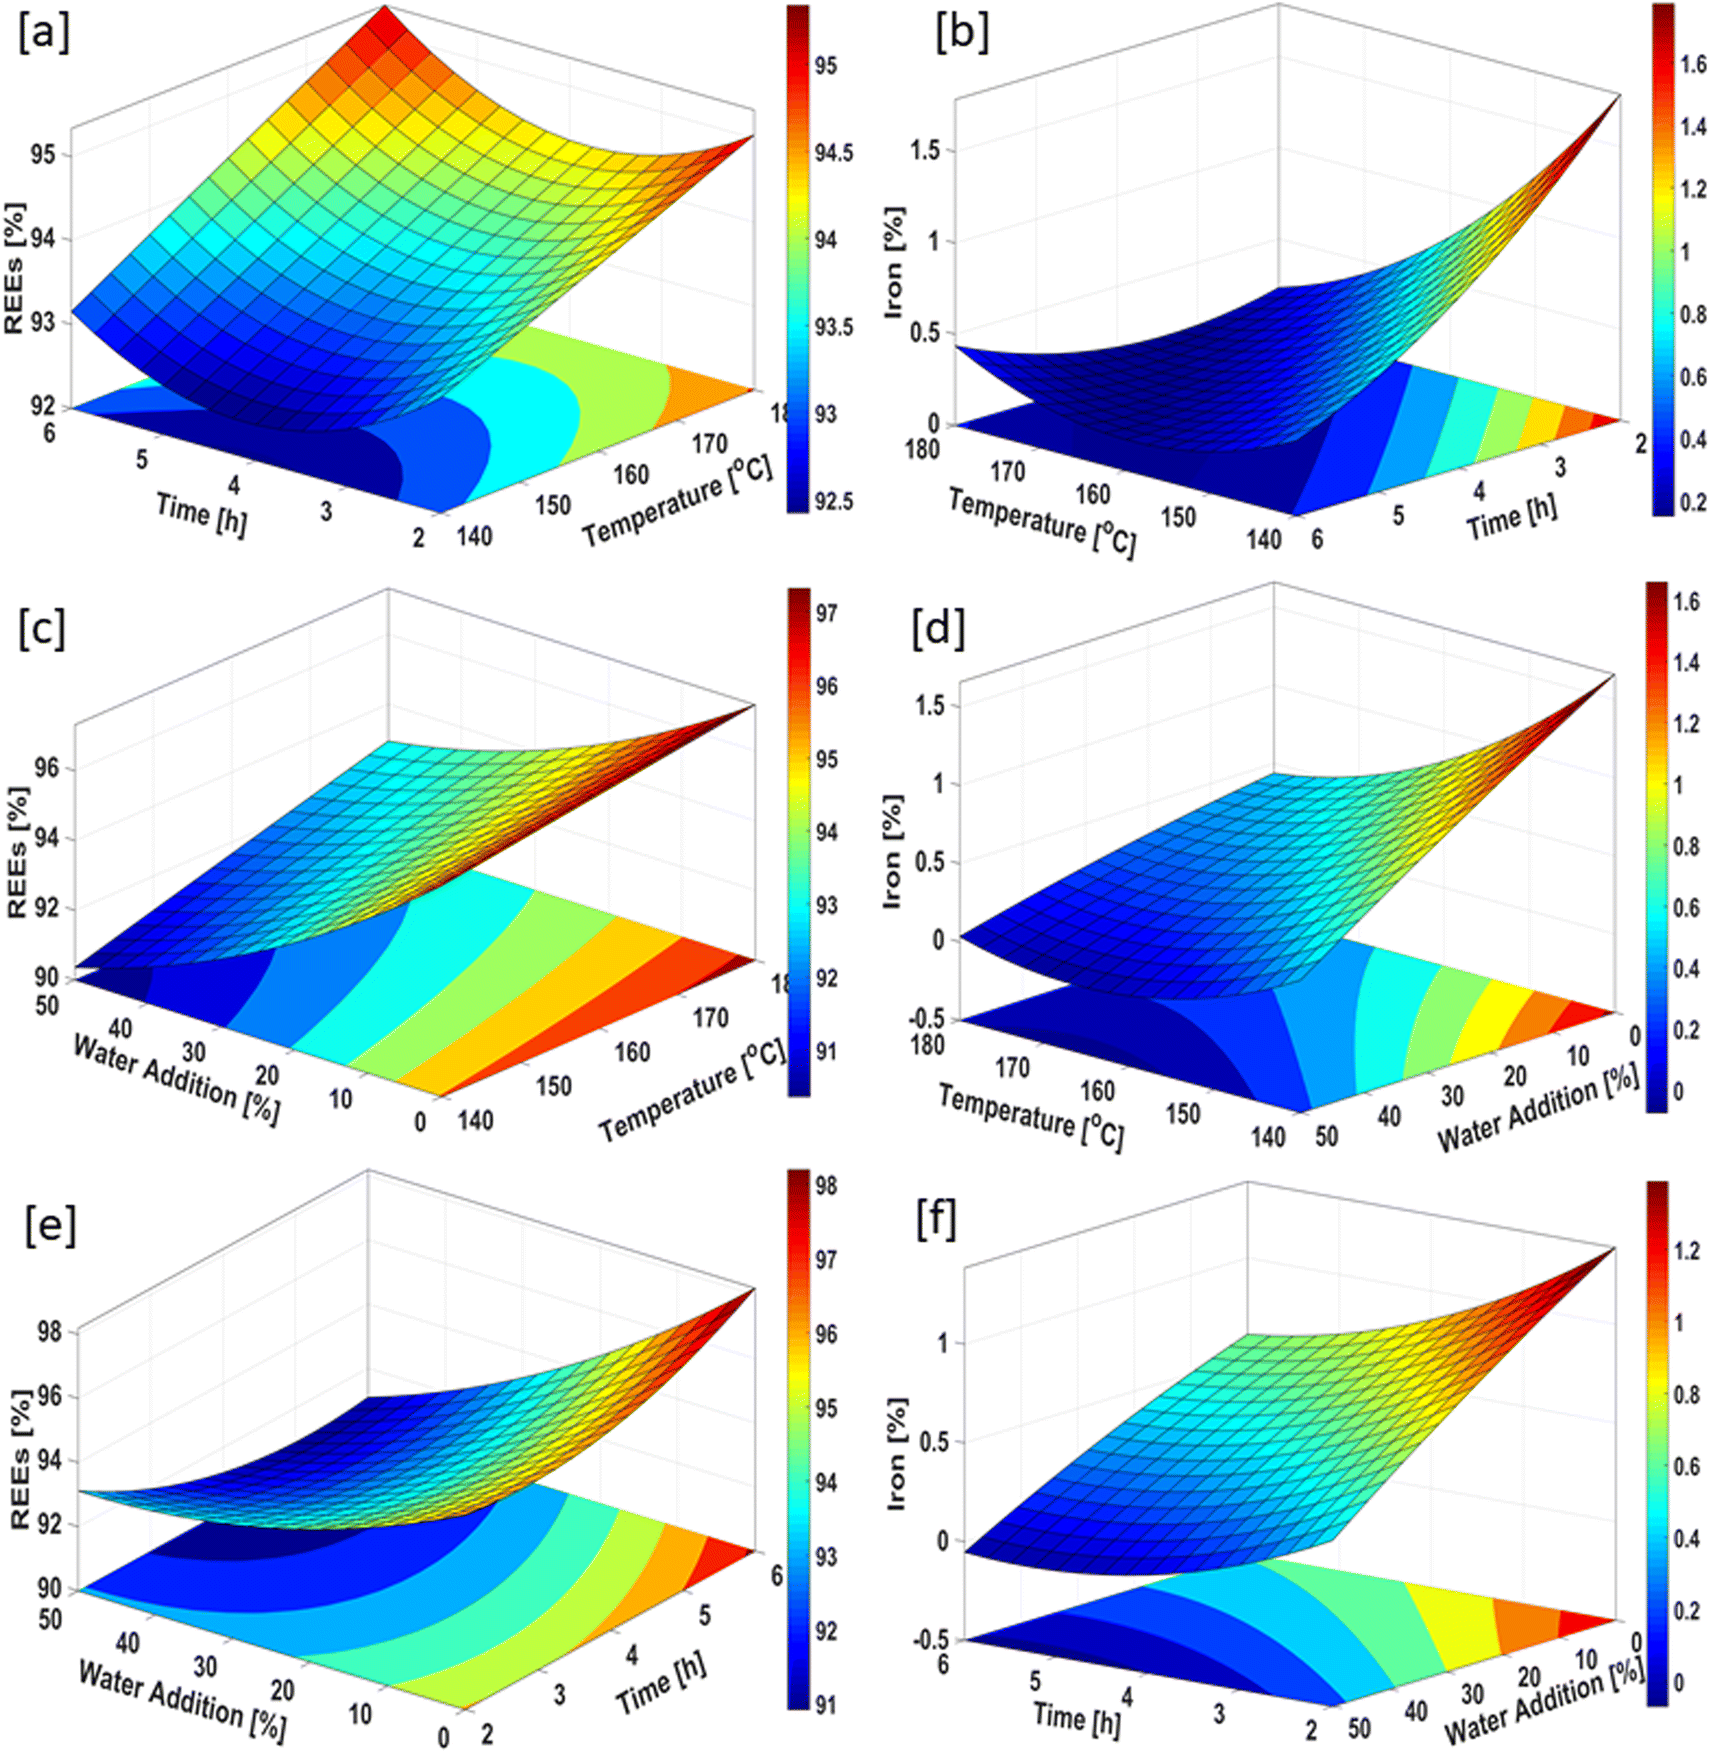 | ||
| Fig. 13 Three-dimensional response surface counter plots for (a and b) the effect of time and temperature, (c and d) the effect of water addition and temperature, and (e and f) the effect of water addition and time. | ||
The main purpose of this step is to achieve REEs with high purity in the leach liquor. The efficiency of REEs recovery needs to be increased by means of defining the optimal process parameters for iron removal in the autoclave. Fig. 13 illustrates the surface response and contour plots for determining the maximum REEs and minimum iron contents in the leach liquor.
Fig. 13a presents the surface response and contour plot for the effect of time and temperature on the maximum REEs content. This figure illustrates that REEs with high purity can be achieved when the process temperature is higher than 170 °C and the time is longer than 5 h. Fig. 13b shows the effect of time and temperature on the minimum iron content in the leach liquor. A process time higher than 5 h and a temperature higher than 160 °C provide the minimum iron content in the leach liquor after autoclave experiment. Fig. 13c and d illustrate the effect of temperature and water addition on maximum REEs and minimum iron contents in the leach liquor, respectively. A process temperature higher than 170 °C and water addition of 0% provide the maximum REEs content. As can be seen in Fig. 13d, low iron values in the leach liquor were obtained for the temperature values of 165 °C < T < 180 °C and at the water addition of 35%. Fig. 13e displays the effect of water addition and time on achieving the maximum REEs content in the leach liquor. This figure shows that the maximum content of REEs in the leach liquor was obtained at lower water addition and higher process time. Fig. 13f illustrates that low iron content in the leach liquor was achieved at the water addition of 50% and time period of 4 h < TM < 6 h. These surface response and contour plots display that temperature, water addition and time are defined as important parameters for promising results of the iron removal process. This conclusion is also consistent with the ANOVA results for the iron removal process in the autoclave.
Optimization of the iron precipitation process in the autoclave
This optimization process aims to achieve high purity REEs in the leach liquor while preventing the precipitation of REEs together with iron. Therefore, both a maximum REEs content and a minimum iron content are anticipated during the iron removal process in the autoclave. For this purpose, an optimization study was conducted with MINITAB. The optimization plot for both maximum REEs and minimum iron content is presented in Fig. 14.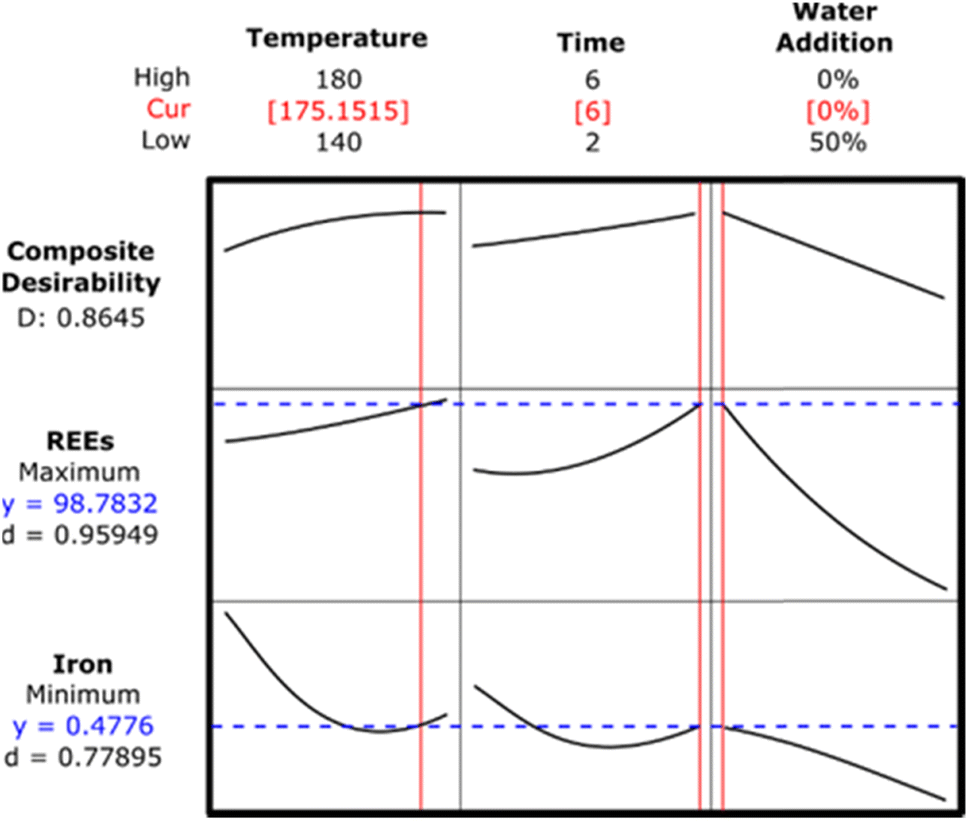 | ||
| Fig. 14 Optimization plots for maximum REEs and minimum iron content in the leach liquor. | ||
The optimal parameters were determined to be a process temperature of approximately 175 °C, a process time of 6 h, and a water addition of 0%. A validation experiment was conducted with the specified process parameters. Iron was removed from the system with 1% loss of REEs.
Fig. 15 illustrates the proposed conceptual flowsheet for high REEs recovery from the spent NdFeB magnets.
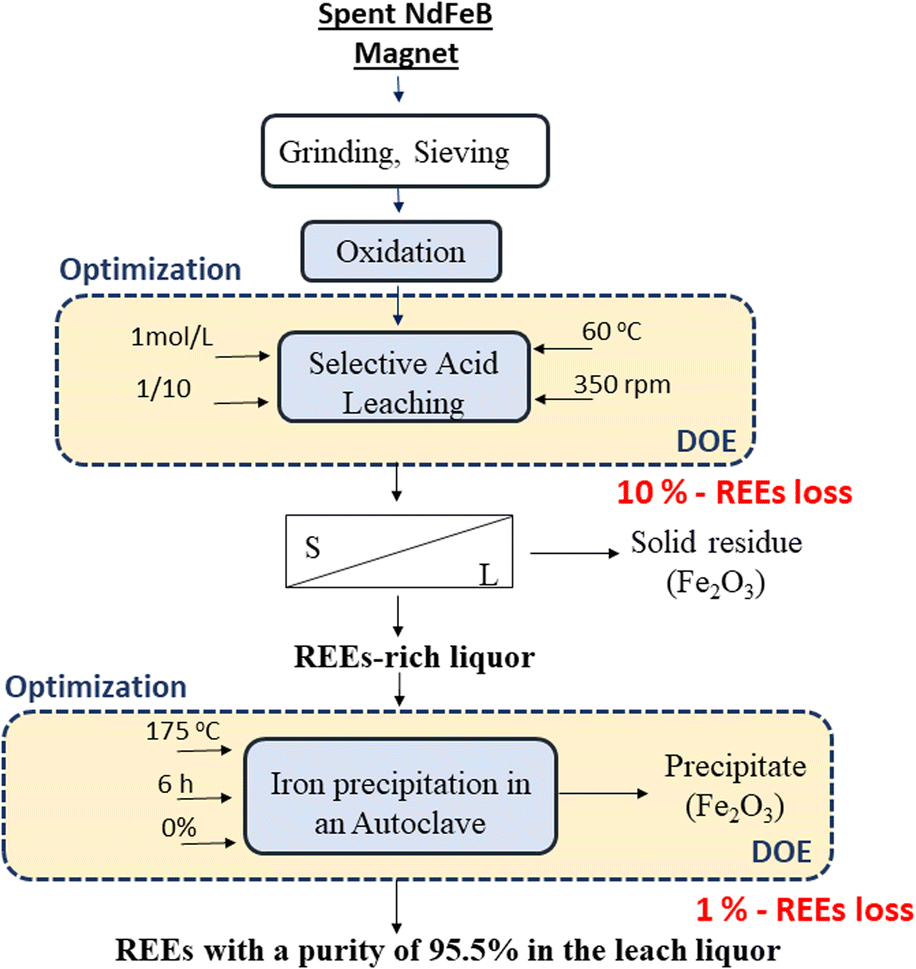 | ||
| Fig. 15 Proposed conceptual flowchart for high REEs recovery from spent NdFeB magnets. | ||
Conclusion
In this study, magnet powders were oxidized at 900 °C followed by a selective leaching process. The iron extracted during leaching was removed through iron hydrolysis in the autoclave.Notable findings of this study are given as follows: the Taguchi method was employed to determine the optimal leaching parameters for maximum REEs extraction and minimum iron extraction. Statistical analysis revealed that while process temperature and S/L are the important parameters for the leaching efficiency of REEs, temperature is the most important parameter for the dissolution of iron under the experimental working conditions.
The aim of this study was to achieve maximum dissolution of REEs. Afterwards, the iron removal process was performed to obtain high-purity REEs solution. Although 4 mol L−1 nitric acid concentration was the best parameter, there was not much difference in the Taguchi plots between 1 mol L−1 and 4 mol L−1 acid concentrations. Thus, the optimal nitric acid concentration was chosen as 1 mol L−1.
The iron extracted during leaching was removed in the autoclave under pressure. The precipitation experiments were carried out based on the Box–Behnken experimental design.
The validation experiment was performed at a process temperature of 175 °C, a process time of 6 h, and a water addition of approximately 0%. Thus, iron was removed from the system with 1% loss of REEs.
Author contributions
Conceptualization E. E. K., experiment E. E. K., B. P. Data curation E. E. K., formal analysis E. E. K., funding acquisition S. S., S. G., B. F., investigation E. E. K., methodology E. E. K, project administration S. S., S. G., B. F., resources S. S., S. G., B. F., supervision S. G. and B. F., validation E. E. K., writing – original draft E. E. K., writing – review and editing E. E. K., B. P., S. S., S. G., B. F.Conflicts of interest
There are no conflicts to declare.Acknowledgements
This research was funded by the Federal Ministry for Economic Affairs and Climate Action, grant number 273 EN, and The Scientific and Technological Research Council of Turkey under grant agreement 120N331. The APC was funded by the project “Sustainable recovery of rare earth elements (Nd, Pr, Dy) from spent magnets.” Elif Emil-Kaya would like to thank TUBITAK 2214-A – International Research Fellowship Programme for PhD Students.References
- K. T. Rim, Effects of rare earth elements on the environment and human health: a literature review, J. Toxicol. Environ. Health Sci., 2016, 8(3), 189–200 CrossRef.
- U. K. Mudali, M. Patil, R. Saravanabhavan and V. K. Saraswat, Review on E-waste Recycling: Part II—Technologies for Recovery of Rare Earth Metals, Trans. Indian Natl. Acad. Eng., 2021, 1–19 Search PubMed.
- L. Silvestri, A. Forcina, C. Silvestri and M. Traverso, Circularity potential of rare earths for sustainable mobility: Recent developments, challenges and future prospects, J. Cleaner Prod., 2021, 292, 126089 CrossRef CAS.
- E. Lewicka, K. Guzik and K. Galos, On the Possibilities of Critical Raw Materials Production from the EU's Primary Sources, Resources, 2021, 10(5), 50 CrossRef.
- D. Gielen and M. Lyons, Critical materials for the energy transition, Rare Earth Elem., 2022, 3–45 Search PubMed.
- K. Binnemans and P. T. Jones, Rare earths and the balance problem, J. Sustain. Metall., 2015, 1(1), 29–38 CrossRef.
- M. V. Reimer, H. Y. Schenk-Mathes, M. F. Hoffmann and T. Elwert, Recycling decisions in 2020, 2030, and 2040—when can substantial NdFeB extraction be expected in the EU, Metals, 2018, 8(11), 867 CrossRef.
- R. Schulze and M. Buchert, Estimates of global REE recycling potentials from NdFeB magnet material, Resour. Conserv. Recycl., 2016, 113, 12–27 CrossRef.
- Y. Yang, A. Walton, R. Sheridan, K. Güth, R. Gauß, O. Gutfleisch and K. Binnemans, REE recovery from end-of-life NdFeB permanent magnet scrap: a critical review, J. Sustain. Metall., 2017, 3(1), 122–149 CrossRef.
- S. Kruse, K. Raulf, T. Pretz and B. Friedrich, Influencing factors on the melting characteristics of NdFeB-Based production wastes for the recovery of rare earth compounds, J. Sustain. Metall., 2017, 3(1), 168–178 CrossRef.
- S. Kruse, K. Raulf, A. Trentmann, T. Pretz and B. Friedrich, Processing of grinding slurries arising from NdFeB magnet production, Chem. Ing. Tech., 2015, 87(11), 1589–1598 CrossRef CAS.
- E. G. Polyakov and A. S. Sibilev, Recycling rare-earth-metal wastes by pyrometallurgical methods, Metallurgist, 2015, 59(5), 368–373 CrossRef CAS.
- H. Chung, S. Stopic, E. Emil-Kaya, S. Gürmen and B. Friedrich, Recovery of Rare Earth Elements from Spent NdFeB-Magnets: Separation of Iron through Reductive Smelting of the Oxidized Material (Second Part), Metals, 2022, 12(10), 1615 CrossRef CAS.
- S. Stopic, B. Polat, H. Chung, E. Emil-Kaya, S. Smiljanić, S. Gürmen and B. Friedrich, Recovery of Rare Earth Elements through Spent NdFeB Magnet Oxidation (First Part), Metals, 2022, 12(9), 1464 CrossRef CAS.
- Y. Zhang, A. F. Gu, Z. Su, S. Liu, C. Anderson and T. Jiang, Hydrometallurgical Recovery of Rare Earth Elements from NdFeB Permanent Magnet Scrap: A Review, Metals, 2020, 10(6), 841 CrossRef CAS.
- E. Emil-Kaya, S. Stopic, S. Gürmen and B. Friedrich, Production of rare earth element oxide powders by solution combustion: a new approach for recycling of NdFeB magnets, RSC Adv., 2022, 12(48), 31478–31488 RSC.
- L. Omodara, S. Pitkäaho, E. M. Turpeinen, P. Saavalainen, K. Oravisjärvi and R. L. Keiski, Recycling and substitution of light rare earth elements, cerium, lanthanum, neodymium, and praseodymium from end-of-life applications-A review, J. Cleaner Prod., 2019, 236, 117573 CrossRef CAS.
- E. Uysal, S. Al, E. Emil-Kaya, S. Stopic, S. Gürmen and B. Friedrich, Hydrometallurgical recycling of waste NdFeB magnets: design of experiment, optimisation of low concentrations of sulphuric acid leaching and process analysis, Can. Metall. Q., 2022, 1–12 Search PubMed.
- A. Akcil, Y. A. Ibrahim, P. Meshram, S. Panda and A. Abhilash, Hydrometallurgical recycling strategies for recovery of rare earth elements from consumer electronic scraps: a review, J. Chem. Technol. Biotechnol., 2021, 1785–1797 CrossRef CAS.
- C. Tunsu, M. Petranikova, C. Ekberg and T. Retegan, A hydrometallurgical process for the recovery of rare earth elements from fluorescent lamp waste fractions, Sep. Purif. Technol., 2016, 161, 172–186 CrossRef CAS.
- S. Peelman, Z. H. Sun, J. Sietsma and Y. Yang, Leaching of rare earth elements: review of past and present technologies, Rare Earths Industry, 2016, 319–334 Search PubMed.
- A. Kumari, M. K. Sinha, S. Pramanik and S. K. Sahu, Recovery of rare earths from spent NdFeB magnets of wind turbine: Leaching and kinetic aspects, Waste Manage., 2018, 75, 486–498 CrossRef CAS.
- A. C. Ni'am, Y. F. Wang, S. W. Chen and S. J. You, Recovery of rare earth elements from waste permanent magnet (WPMs) via selective leaching using the Taguchi method, J. Taiwan Inst. Chem. Eng., 2019, 97, 137–145 CrossRef.
- Y. Jiang, Y. Deng, W. Xin and C. Guo, Oxidative Roasting–Selective Pressure Leaching Process for Rare Earth Recovery from NdFeB Magnet Scrap, Trans. Indian Inst. Met., 2020, 1–9 Search PubMed.
- H. S. Yoon, C. J. Kim, K. W. Chung, S. J. Lee, A. R. Joe, Y. H. Shin and J. G. Kim, Leaching kinetics of neodymium in sulfuric acid from E-scrap of NdFeB permanent magnet, Korean J. Chem. Eng., 2014, 31(4), 706–711 CrossRef CAS.
- F. Liu, A. Porvali, J. Wang, H. Wang, C. Peng, B. P. Wilson and M. Lundström, Recovery and separation of rare earths and boron from spent Nd-Fe-B magnets, Miner. Eng., 2020, 145, 106097 CrossRef CAS.
- F. Mao, N. Zhu, W. Zhu, B. Liu, P. Wu and Z. Dang, Efficient recovery of rare earth elements from discarded NdFeB magnets by mechanical activation coupled with acid leaching, Environ. Sci. Pollut. Res., 2021, 1–12 Search PubMed.
- J. E. Dutrizac and P. A. Riveros, The precipitation of hematite from ferric chloride media at atmospheric pressure, Metall. Mater. Trans. B, 1999, 30(6), 993–1001 CrossRef.
- T. C. Cheng, G. P. Demopoulos, Y. Shibachi and H. Masuda, The precipitation chemistry and performance of the Akita hematite process—an integrated laboratory and industrial scale study, Electrometall. Environ. Hydrometallurgy, 2013, 2, 1657–1674 Search PubMed.
| This journal is © The Royal Society of Chemistry 2023 |