DOI:
10.1039/D2RA05769G
(Paper)
RSC Adv., 2023,
13, 1312-1319
An efficient calcium-based sorbent for flue gas dry-desulfurization: promotion roles of nitrogen oxide and oxygen†
Received
13th September 2022
, Accepted 14th December 2022
First published on 5th January 2023
Abstract
The development of sorbents for flue gas desulfurization in a dry mode is essential to control emission of sulfur dioxide. Based on the novel concept of “treating waste with waste”, a low-cost and highly activated calcium-based sorbent (ACS) was prepared using coal fly ash, CaO and waste gypsum as the raw materials via the one-step incipient wetness impregnation method. Based on characterization using scanning electron microscopy and nitrogen adsorption–desorption, the ACS possessed a fibrous and netted structure with high porosity, which improved SO2 adsorption greatly. The SO2 adsorption capacity of ACS with coal fly ash/CaO/CaSO4 = 1/2/1 was high, up to 44.26 mg g−1, with 100% removal efficiency at 150 °C. In the absence of O2, SO2 was rapidly adsorbed on the sorbent to form CaSO3 according to in situ DRIFTS analysis, while when O2 was present in the flue gas, SO2/SO32− tended to be oxidized into SO42− species. Moreover, the presence of NO can further enhance the SO2 adsorption capacity of the ACS due to the formation of adsorbed NO2 or nitrate species with strong oxidizing properties. Therefore, the ACS can be considered as a sustainable sorbent with the advantage of employing fly ash for the removal of sulfur dioxide.
1. Introduction
Industry activity related haze problems have drawn more and more attention worldwide. Coke oven plants, as the dominant stationary pollution source, discharge massive amounts of air pollutants, mainly including SO2 and NOx.1–3 Currently, flue gas desulfurization (FGD) processes are widely applied for the elimination of SO2 emissions. According to the type of desulfurizer and the state of the resultant outflow, FGD methods can be classified into wet flue gas desulfurization, semi-dry flue gas desulfurization and dry flue gas desulfurization. In the wet-scrubbing technique,4 the overall reaction (1) occurs as follows:| | |
SO2(g) + CaCO3(s) + 0.5O2(g) + 2H2O(l) → CaSO4·2H2O(s) + CO2(g)
| (1) |
Despite its high efficiency, costly equipment investment requirements and easy scale formation causing pipe blockages have restrained the application of the wet-scrubbing technique. Besides, the desulfurization unit is usually installed in front of a denitrification unit in coke oven industrial practice.5 Generally, the operation temperature of wet FGD is around 45–60 °C,6 which is too low for low-temperature selective catalytic reduction (LT-SCR) flue gas denitrification technology.7 Consequently, more additional energy has to be consumed to heat the feed gas for SCR. Considering the temperature mismatch and energy consumption involved in the wet FGD process, dry and semi-dry FGD techniques are alternative effective approaches, particularly under low-concentration SO2 operating conditions. Compared with the wet-scrubbing method, dry and semi-dry FGD techniques cost less since less energy is required and no waste water is produced.4 Furthermore, with the development of circulating fluidized bed flue gas desulfurization technology, dry and semi-dry flue gas desulfurization technologies have been paid close attention in China.
Nevertheless, for dry and semi-dry FGD technologies, there is still enormous difficulties and challenges going from advanced process to practical industrial application. The primary subsistent problem is the unsatisfactory desulfurization efficiency. Nowadays, the main desulfurizers used in dry and semi-dry FGD technologies include activated coke desulfurizers,8–10 calcium desulfurizers11–14 and supported desulfurizers.15 Among the above desulfurizers, the calcium desulfurizer is the most common commercial sorbent in industrial application. In order to synthesize calcium-based sorbents with higher SO2 adsorption activity, most siliceous materials reported in previous research like coal fly ash,16–18 diatomite,19 oil palm ash20 and rice husk ash (RHA)21,22 can be activated with calcium oxide (CaO) or calcium hydroxide (Ca(OH)2). The siliceous materials are primarily composed of silica (SiO2) and alumina (Al2O3), which react with Ca(OH)2 to generate calcium aluminate silicate hydrate compounds ((CaO)x(Al2O3)y(SiO2)z(H2O)w). This reaction is the well-known “pozzolanic reaction”.23 Since the reaction products are generally amorphous with comparably high specific surface areas, the adsorption capacity of the sorbent for sulfur dioxide (SO2) is remarkably improved.13,24 Among the above-mentioned siliceous materials, fly ash as a typical industrial waste product has attracted much interest due to the fact that it contains abundant metal elements such as calcium, iron, aluminum, magnesium and others, which can enhance SO2 adsorption in flue gases. Indeed, fly ash is an excellent precursor to prepare low-cost and high-efficiency sorbents for treatment of environment pollutants.18 For instance, it was reported that the addition of fly ash solution to Ca(OH)2 could prepare an active material for SO2 removal.25 Additionally, the effect of the fly ash/Ca(OH)2 ratio and slurrying temperature on desulfurization efficiency was investigated. The increase of temperature could significantly enhance the utilization rate of calcium.26 Moreover, it was found that fly ash/Ca(OH)2 sorbents prepared in a Parr pressure reactor contributed to the removal of SO2.27 These results indicated that a sorbent prepared by mixing fly ash with Ca(OH)2 could show enhanced removal performance of SO2. However, an increase of Ca(OH)2 cannot increase the release rate of silica and alumina from fly ash, constraining the further improvement of desulfurization performance over fly ash/Ca(OH)2 sorbents. Hence, Ca(OH)2 was substituted with CaO to prepare sorbents since the exothermic reaction of CaO with water dramatically promotes the pozzolanic reaction. Furthermore, it was confirmed that the waste product gypsum (CaSO4) is a chemical activator incorporated in fly ash that contributes to the formation of mesoporous structure.28 Additionally, the presence of CaSO4 could improve the leaching rate of silica and alumina from the coal fly ash.17 Consequently, we designed a novel calcium-based sorbent consisting of coal fly ash, CaO and gypsum. Herein, a one-step incipient wetness impregnation method was applied to prepare a highly activated calcium-based sorbent from coal fly ash, CaO and gypsum. A series of sorbents with similar specific surface areas were prepared to study the effect of different raw material ratios on SO2 removal performance. By using characterization techniques such as X-ray diffraction (XRD), scanning electron microscopy (SEM) and nitrogen adsorption and desorption analysis, the structure and properties of the novel calcium-based sorbent were illuminated. Notably, the mechanism of SO2 adsorption on this desulfurizer along with the effect of O2 and NO on the desulfurization process was first investigated integrally via in situ diffuse reflectance infrared Fourier transform spectroscopy (DRIFTS) experiments. The research results contributed to the optimization of process conditions and the development of an efficient calcium-based sorbent with an optimal ratio, which has great significance for achieving the goal of ultra-low emission of coal-fired power plant flue gas.
2. Experimental
2.1 Sorbent preparation
The coal fly ash, which was provided by a coal-fired power plant of Henan Yulian Energy Group, China, was mixed with CaO and CaSO4 (Sinopharm) via a one-step incipient wetness impregnation method to synthesize the highly activated calcium-based sorbent at a low temperature (90 °C) in a hydration reactor. Cui et al.29 used the preparation technology of adsorbents to study the desulfurization mechanism of adsorbents prepared using high ratio circulating fly ash and lime. Based on this, appropriate amounts of coal fly ash, CaO and CaSO4 were dissolved in distilled water under vigorous stirring at 90 °C for 6 h and dried at 120 °C overnight. The obtained sorbents were denoted as ACS-1, ACS-2, ACS-3, ACS-4 and ACS-5 (Table S1†), respectively, with different ratios of fly ash/CaO/CaSO4. Before each test, the sample was crushed into fine particles with an approximately 40–60 mesh, small enough to eliminate the effects of inner diffusion resistance.
2.2 Physical and chemical properties analysis
The specific surface area, pore volume and pore size of the sorbents were determined by nitrogen adsorption at 77 K using a surface area analyzer (Quantachrome ASIQA3200-3, America). The surface area was calculated from the nitrogen adsorption–desorption isotherms, according to the Brunauer–Emmett–Teller (BET) equation. The pore size distribution was determined by the Barrett–Joyner–Halenda (BJH) method. The samples were degassed under vacuum at 150 °C for 12 h prior to measurement of the surface area and pore size distribution. The crystal structure of the samples was characterized by X-ray diffraction (XRD) using an XRD spectrometer (D8 Advance, Bruker, Germany) with Cu Kα (λ = 1.5056 Å) radiation, operated at 40 kV and 200 mA. In particular, the samples loaded on a sample holder at a depth of about 1 mm were tested over a 2θ range of 5–90° at a speed of 6° min−1. Thermogravimetric analysis (TGA) experiments were performed in a Thermogravimetric Analyser Q500 from TA Instruments to study the thermal decomposition behavior of the as-synthesized sorbents. The surface morphology and structure of the as-synthesized sorbents were imaged by scanning electron microscopy (SEM, Sirion 200). The sample treatment process was as follows: first, conductive tape was glued on the sample table, and then the powder sample was evenly sprinkled on the conductive glue. Then, the sample that did not stick was blown off with an ear washing ball. Finally, the samples were plated with platinum and then observed using the scanning electron microscope. The acceleration voltage was 10 kV. Fourier transform infrared (FTIR) spectra were recorded using a FT-IR spectrometer (PerkinElmer Frontier, America) at 4 cm−1 resolution with an accumulation of 32 scans by KBr optics and a TGS detector. The samples mixed with KBr powder were put into an agate milk bowl and ground evenly, and then loaded into a pressing mold to prepare the KBr sample. The whole operation was carried out under an infrared lamp to prevent moisture absorption. In situ DRIFTS spectra were recorded on a PE Frontier IR spectrometer equipped with a liquid-nitrogen-cooled MCT detector using a temperature-controlled DRIFTS chamber with ZnSe windows. Prior to each experiment, the sample was pretreated at 150 °C for 1 h in flowing N2 (50 mL min−1) to clean the sorbent surface for a background spectrum to be automatically generated. The reaction conditions were controlled as follows: 1000 mg m−3 SO2, and/or 750 mg m−3 NO and/or 8% O2 and pure N2 balance gas, and 200 mL min−1 total flow rate. All spectra were recorded by accumulating 32 scans with a resolution of 4 cm−1. For each experiment under different test conditions, a fresh sorbent was used.
2.3 Desulfurization performance tests
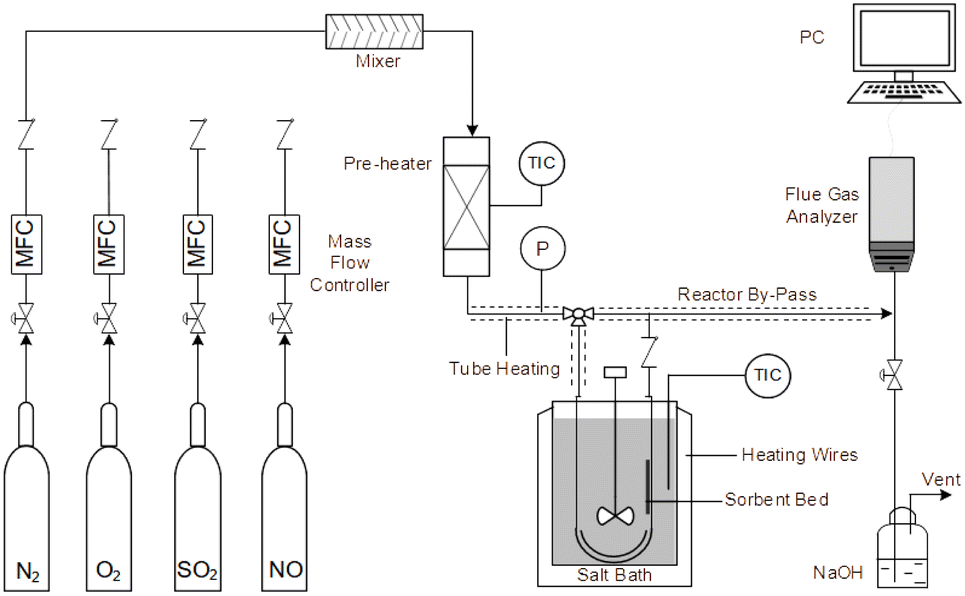
An experimental instrument was established to evaluate the desulfurization performance of the highly activated calcium-based sorbent under atmospheric pressure in the dry FGD process, as shown in Fig. 1. The fixed-bed reactor was composed of a U-shaped stainless steel (S31603) tube with an internal diameter of 6 mm and a total length of 1 m, immersed in a salt bath for temperature control. The sorbent (2 g) was packed in the center of the reactor supported by glass wool. For the avoidance of sorbent clumps causing flue gas short circuit, the sorbent bed was packed with a sorbent/silica sand ratio of 1/5 to obtain an isothermal bed. The flow rate of the feed gas (N2, O2, NO and SO2) was controlled by thermal mass flow controllers. The different gas was blended and preheated in a gas mixer to form the simulated flue gas. After stable working conditions were obtained, the bypass of the reactor was closed and the U-shaped tube desulfurization reactor was available for desulfurization experiments. The gas passed through the reactor at a total flow rate of 600 mL min−1. The content of feed gas and products was continuously monitored by a flue gas analyzer (Vario Plus; MRU, Germany). Besides, the instrument error was ±3 ppm. For each condition, the sorbent was purged with nitrogen for 1 h. The desulfurization activity was measured by SO2 conversion expressed by the following equation:30| |
 | (2) |
where SO2 in represents the concentration of SO2 at the inlet and SO2 out represents the concentration of SO2 at the outlet.
 |
| | Fig. 1 Experimental fixed-bed set-up for desulfurization. | |
Finally, the adsorption capacity of the sorbent for SO2 was calculated by using a SO2 adsorption penetration curve, whereby the following equation was adopted:31
| |
 | (3) |
where
q is the dynamic adsorption capacity (mg SO
2 (g sorbent)
−1),
Q is the total gas flow rate (m
3 min
−1),
C0 is the initial concentration (mg m
−3),
f(
t) is SO
2 conversion (%),
t is the adsorption time (min), and
m is the amount of sorbent (g).
3. Results and discussion
3.1 Desulfurization performance
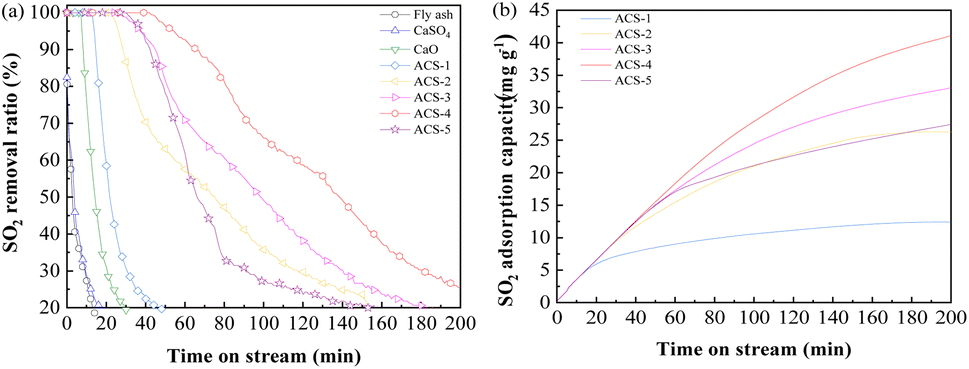
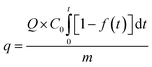
The desulfurization performance of all the as-synthesized sorbents and raw materials was tested in an isothermal fixed bed reactor as mentioned above. The activity tests were conducted by feeding 1000 mg m−3 SO2, 750 mg m−3 NO, 8% O2, and N2 as the balance gas at 150 °C with a gas hour space velocity (GHSV) of 12![[thin space (1/6-em)]](https://www.rsc.org/images/entities/char_2009.gif) 000 h−1. As Fig. 2(a) displays, CaSO4 and fly ash could hardly capture SO2, while CaO only maintained 100% SO2 removal ratio for 7 min, followed by rapid inactivation. Notably, the mixture of fly ash/CaO/CaSO4 showed distinctly improved desulfurization performance. Among the series of sorbents with different ratios of fly ash/CaO/CaSO4, ACS-4 showed the most outstanding SO2 elimination efficiency maintaining 100% SO2 removal for 43 min. Moreover, the deactivation rate of ACS-4 was significantly decreased compared with the other sorbents. At the time on stream of 120 min, SO2 removal dropped to around 25%. Besides, the dynamic adsorption amount of SO2 was calculated by using eqn (3), as shown in Fig. 2(b). Indeed, the SO2 adsorption capacities of the ACS with different fly ash/CaO/CaSO4 ratios followed the order of ACS-4 (44.26 mg g−1) > ACS-3 (33.85 mg g−1) > ACS-5 (28.21 mg g−1) > ACS-2 (26.28 mg g−1) > ACS-1 (12.42 mg g−1). In summary, the combination of fly ash/CaO/CaSO4 shows superior SO2 adsorption capacity compared with each single component and the optimal ratio of fly ash/CaO/CaSO4 is 1:2:1. Additionally, the SO2 adsorption capacity of various previously reported Ca-based sorbents is listed in Table 1. The SO2 adsorption amount of the sorbent prepared in this work (ACS-4) surpasses that of a majority of Ca-based sorbents except for the 50CaO/C Foam material. Nevertheless, the differences in SO2 adsorption capacity between ACS-4 and 50CaO/CFoam are insignificant. By contrast, the sorbent prepared in this work (ACS-4) presents considerable potential in future practical application due to its outstanding desulfurization performance and low cost.
000 h−1. As Fig. 2(a) displays, CaSO4 and fly ash could hardly capture SO2, while CaO only maintained 100% SO2 removal ratio for 7 min, followed by rapid inactivation. Notably, the mixture of fly ash/CaO/CaSO4 showed distinctly improved desulfurization performance. Among the series of sorbents with different ratios of fly ash/CaO/CaSO4, ACS-4 showed the most outstanding SO2 elimination efficiency maintaining 100% SO2 removal for 43 min. Moreover, the deactivation rate of ACS-4 was significantly decreased compared with the other sorbents. At the time on stream of 120 min, SO2 removal dropped to around 25%. Besides, the dynamic adsorption amount of SO2 was calculated by using eqn (3), as shown in Fig. 2(b). Indeed, the SO2 adsorption capacities of the ACS with different fly ash/CaO/CaSO4 ratios followed the order of ACS-4 (44.26 mg g−1) > ACS-3 (33.85 mg g−1) > ACS-5 (28.21 mg g−1) > ACS-2 (26.28 mg g−1) > ACS-1 (12.42 mg g−1). In summary, the combination of fly ash/CaO/CaSO4 shows superior SO2 adsorption capacity compared with each single component and the optimal ratio of fly ash/CaO/CaSO4 is 1:2:1. Additionally, the SO2 adsorption capacity of various previously reported Ca-based sorbents is listed in Table 1. The SO2 adsorption amount of the sorbent prepared in this work (ACS-4) surpasses that of a majority of Ca-based sorbents except for the 50CaO/C Foam material. Nevertheless, the differences in SO2 adsorption capacity between ACS-4 and 50CaO/CFoam are insignificant. By contrast, the sorbent prepared in this work (ACS-4) presents considerable potential in future practical application due to its outstanding desulfurization performance and low cost.
 |
| | Fig. 2 (a) Desulfurization activity of the different as-synthesized sorbents and raw single components (the reactant feed contains 1000 mg m−3 SO2, 750 mg m−3 NO, and 8% O2 balanced with N2 at a GHSV of 12000 h−1 and a temperature of 150 °C). (b) The SO2 adsorption capacity of the sorbents: SO2 accumulated adsorption capacity as a function of time. | |
Table 1 Comparison of adsorption amount between ACS-4 and various Ca-based sorbents reported previously
| Sorbent |
Adsorption amount (mg g−1) |
SBET, (m2 g−1) |
Ref. |
| RHA/CaO/CaSO4 |
17.14 |
65.3 |
7 |
| RHA/CaO/NaOH |
19.73 |
28.7 |
24 |
| CaL2 |
24.8 |
— |
32 |
| Calcium silicate |
38.2 |
174 |
31 |
| 50CaO/CFoam |
46.85 |
183.2 |
33 |
| ACS-4 |
44.26 |
31.43 |
This work |
3.2 Sorbent characterization
The pore structure parameters of the three raw materials and the as-synthesized sorbents are listed in Table 2. The specific surface area along with pore volume and average pore size of the active raw materials were extremely small, leading to poor desulfurization efficiency. Particularly, the pore volume of fly ash was only 0.003 cm3 g−1, indicating that fly ash has little pore structure. According to previous literature,34 the main chemical constituents of original fly ash are compounds mainly composed of amorphous SiO2 and Al2O3, which can be dissolved in alkaline solutions and then react with Ca2+. The reaction between fly ash and calcium hydroxide is known as a pozzolanic reaction and yields calcium aluminate silicate hydrate compounds that are fibrous gels that have improved surface areas, pore volumes and hierarchical networks. In contrast, the specific surface area, pore volume and the average pore size of the prepared ACS was markedly increased in comparison to the original materials, which suggested that the hydration reaction process had a positive influence on the surface area of the sorbent. It was speculated that the heat released during the hydration reaction greatly swelled the inner pores, causing the increase of specific surface area. Additionally, the nitrogen adsorption–desorption isotherms and pore diameter distributions of the ACS are illustrated in Fig. S1.† All of the sorbents revealed typical Langmuir IV isotherm curves with a type H3 hysteresis loop, indicating the existence of slit-like mesopores in aggregates.18,19 The pore size distributions of all the ACSs further verified the existence of mesopores (2–50 nm). Among them, the pore diameter distribution of ACS-4 was most concentrated and homogeneous (around 30 nm), which may provide abundant adsorption active sites for desulfurization reaction. In conclusion, the combination reaction of the three raw components increased the specific surface area of the ACS, which facilitated the desulfurization reaction compared with the single components. ACS-4 with the biggest specific surface area, pore volume and average pore size presented the most outstanding desulfurization performance.
Table 2 Pore structure parameters of the samples
| Samples |
SBET, (m2 g−1) |
Vp, (cm3 g−1) |
dp, (nm) |
| Fly ash |
1.45 |
0.003 |
6.89 |
| CaO |
4.21 |
0.011 |
9.94 |
| CaSO4 |
1.65 |
0.045 |
10.83 |
| ACS-1 |
28.49 |
0.116 |
16.34 |
| ACS-2 |
28.59 |
0.158 |
22.08 |
| ACS-3 |
29.29 |
0.139 |
18.99 |
| ACS-4 |
31.43 |
0.176 |
22.34 |
| ACS-5 |
21.24 |
0.111 |
20.93 |
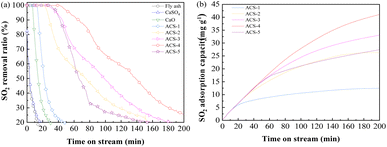
Fig. 3 displays the XRD patterns of fresh ACS-4, CaSO4, CaO and fly ash. Among them, the fly ash was provided by a domestic coal-fired power plant. The major chemical composition of fly ash is shown in Table S2,† and it was characterized by the X-ray fluorescence (XRF) method. The weak diffraction peak of fly ash at 2θ = 26.5° was indexed to quartz (SiO2). Although fly ash is an essentially vitreous material with numerous amorphous structures, it also contained a small amount of SiO2 crystalline phases. In addition, peaks of CaO and CaSO4 closely matched the corresponding standard PDF database. Notably, the strong diffraction peaks of ACS-4 at 2θ = 28.66°, 34.09°, 47.12°, 50.79°, 54.34°, 56.25°, 62.54° and 64.23° were attributed to Ca(OH)2 (JCPDS PDF No. 36-1248),35 and the other major diffraction peaks at 2θ = 9.93°,18.02° and 19.76° corresponded well with a Ca2Al3Si9O36·8H2O standard (#39-1381).13 Thus, the diffraction patterns changed appreciably after activation of the original fly ash with CaO/CaSO4. The major phase of the ACS-4 material was calcium aluminate silicate hydrate and calcium hydroxide (Ca(OH)2) with no presence of CaO, CaSO4 and SiO2. The new component in ACS-4 was considered to be formed in the fly ash/CaO/CaSO4 hydration process during ACS preparation. It was further demonstrated that the occurrence of chemical reaction after the mixing of fly ash/CaO/CaSO4 resulted in the formation of calcium aluminate silicate hydrate and calcium hydroxide, dramatically increasing the surface area of the sorbents. Moreover, the XRD patterns of ACS-1, ACS-2, ACS-3 and ACS-5 were similar to that of ACS-4 (shown in Fig. S2†). Hence, the ACS material presents superior desulfurization performance compared with the raw individual components.
 |
| | Fig. 3 XRD patterns of the three raw materials and the fresh ACS-4. | |
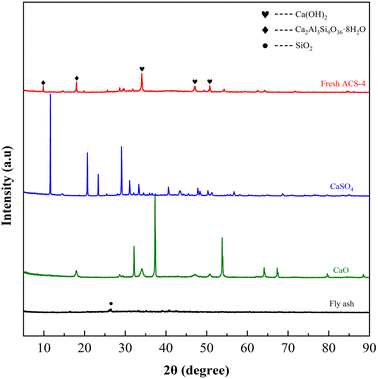
Furthermore, the SO2 adsorption active site in the ACS sorbents was investigated by XRD analysis. As shown in Fig. 4(a), the XRD patterns of fresh and used ACS-4 showed that no new crystal phase was generated in the desulfurization process, suggesting that SO2 adsorption species were highly dispersed on the surface of the sorbent with no crystallization. After the desulfurization process, peaks at 2θ = 9.93° and 19.76°, attributed to silicate hydrate, almost completely disappeared. Besides, the diffraction peak intensity of calcium hydroxide was weakened.
 |
| | Fig. 4 (a) XRD patterns of fresh ACS-4 and used ACS-4; (b) pore volume distributions of the fresh and used ACS-4. The ACS-4 morphology characterized by SEM: (c) fresh sorbent and (d) used sorbent. | |
It was inferred that the silicate hydrate compound and calcium hydroxide were converted to other chemical substances. Furthermore, the pore diameter distributions of ACS-4 before and after desulfurization are shown in Fig. 4(b). As shown in Table 3, the pore volume dropped from 0.176 to 0.094 cm3 g−1, indicating that SO2 adsorption species accumulated in the pore structure. Consequently, the sorbents were entirely inactive due to the consumption of adsorption active sites.
Table 3 Surface area and characteristic pore data of ACS-4 before and after SO2 adsorption
| Samples |
SBET, (m2 g−1) |
Vp, (cm3 g−1) |
dp, (nm) |
| ACS-4 |
31.43 |
0.176 |
22.34 |
| ACS-4-used |
18.13 |
0.094 |
20.78 |
The top surface morphologies of fresh ACS-4 and used ACS-4 were observed using SEM. As shown in Fig. 4(c), the porous fiber-like and network structure displayed an ordered microscopic pore structure, which provided a sufficient buffer space for SO2 adsorption reaction and significantly improved SO2 diffusion and transformation. Fly ash is typically composed of spherical particles, as shown in Fig. S3.† In addition, Fig. S4† contains the SEM images of fresh ACS-1, ACS-2, ACS-3 and ACS-5, all of which displayed analogous surface morphologies. As shown in Fig. 4(d), ACS-4 was crushed into smaller particles when used in the reactor. Further, during the adsorption of SO2 molecules, calcium sulfate and calcium sulfite formed, leading to clogging of the channel. It could be observed that the porous fiber-like and network structure of the sorbent was no longer discernible. Furthermore, the thermal stability of the ACS materials was detected with thermogravimetric analysis from 50 °C to 800 °C in an air atmosphere (Fig. S5†). All the samples presented a prominent weight loss peak at around 700 °C, ascribed to the decomposition of the ACS. From 50 to 700 °C, the weight loss of all samples was constant and slow, due to the release of water in the structure. As a result, the ACS remained stable at the practical desulfurization temperature of 150 °C.
3.3 Desulfurization mechanism
3.3.1 Influence of O2 on SO2 adsorption. To investigate the adsorption behavior and species accumulated on the sorbents, in situ DRIFTS analysis of SO2 adsorption on ACS-4 in the absence of O2 was conducted. Fig. 5(a) shows the variation of the DRIFTS spectra over time with ACS-4 exposed to SO2/N2 at 150 °C. Four prominent bands at 1376, 1346, 1130 and 980 cm−1 were detected during the SO2 adsorption process. The bands at 1346 and 1376 cm−1 could be assigned to gaseous or adsorbed SO2,36 confirming that some SO2 was adsorbed directly in the form of SO2 molecules. The relatively weak absorption band observed at 1130 cm−1 was assigned to SO42− (sulfate) asymmetric stretching.37 It was speculated that surface adsorbed oxygen species on ACS-4 oxidize SO2 to SO42−. Besides, the vibration absorption peak at 980 cm−1, ascribed to SO32− (sulfite),38 grew increasingly strong over time. It resulted from the adsorbed SO2 reacting with H2O/OH− in ACS-4 to generate a large amount of sulfite species.
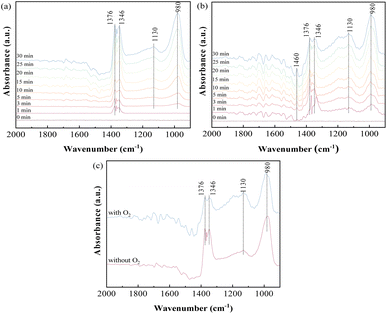 |
| | Fig. 5 In situ DRIFTS spectra of ACS-4 (a) exposed to 1000 mg m−3 SO2 at 150 °C for various times; (b) exposed to 1000 mg m−3 SO2 and 8% O2 at 150 °C for various times; (c) comparison spectra at 30 min under the condition of the presence or absence of O2. | |
To further explore the influence of O2 on SO2 removal, the desulfurization reaction was carried out for 30 min in the presence of O2. As shown in Fig. 5(b), bands at 1460, 1376, 1346, 1130 and 980 cm−1 were detected, and the intensity of all peaks increased over time. Notably, the band at 1460 cm−1 could be assigned to SO3 molecules adsorbed on the surface of a metal ion by van der Waals force.39 Different from SO2 adsorption in the absence of O2, the intensity of the absorption band at 1130 cm−1 (assigned to SO42−) increased more rapidly, suggesting that the presence of O2 promoted the formation of SO42− species. When the sample was treated with SO2 and O2, the gaseous or adsorbed SO2 species could still exist, but the intensity of these bands (1346 and 1376 cm−1) was weaker than the band intensity shown in Fig. 5(a).40 In addition, the peak intensity at 1130 cm−1 increased and that at 980 cm−1 decreased simultaneously with O2 addition. For a clearer comparison of the effects of O2 on SO2 removal, the spectra of SO2 adsorption in the presence and absence of O2 for 30 minutes are shown separately in Fig. 5(c). The results indicate that SO32− derived from CaSO3 was oxidized to sulfate by the oxygen. In the presence of oxygen, the peak areas of SO32− and SO42− increased faster than in the absence of oxygen with increasing reaction time, indicating that oxygen enhanced the reaction of sulfur dioxide with the calcium-based sorbent. In summary, both physical and chemical adsorption occurred in the desulfurization process with SO2/O2 as the feed gas.
3.3.2 Influence of NO on SO2 adsorption. In consideration of NO as one of the major constituents present under practical conditions, the adsorption behavior of SO2/NO/O2 as the feed gas on ACS-4 was monitored. Firstly, NO adsorption in the absence and presence of O2 was investigated. Fig. 6(a) illustrates that NO was adsorbed weakly on the surface of ACS-4 after ACS-4 was purged with NO for 30 min. With 8% O2 included, evident bands at 1639, 1603, 1386, 1358, 1251 and 1081 cm−1 were observed. The bands at 1629 and 1603 cm−1 were attributed to gaseous or adsorbed O-bound-NO2,41 demonstrating that nitric oxide was oxidized to nitrogen dioxide by oxygen. Since NO is not able to be oxidized into NO2 by O2 without catalysts at 150 °C,42 it was inferred that the presence of OH/HO2 radicals facilitated NO conversion into NO2, as reported previously.34 Besides, the peak at around 1251 cm−1 was attributed to nitrite species,43 and the peaks at 1386 cm−1, 1358 cm−1 and 1081 cm−1 were related to the vibration of surface nitrate species.44,45 Hence, generated NO2 could be converted to calcium nitrite (Ca(NO2)2) and calcium nitrate (Ca(NO3)2) by the following equation:| | |
2Ca(OH)2(s) + 4NO2(g) → Ca(NO3)2(s) + Ca(NO2)2(s) + 2H2O(l)
| (4) |
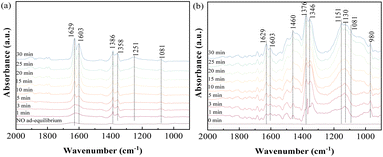 |
| | Fig. 6 In situ DRIFTS spectra of ACS-4 (a) in a flow of 750 mg m−3 NO before and after adding 8% O2 at 150 °C; (b) in a flow of 1000 mg m−3 SO2, 750 mg m−3 NO and 8% O2 at 150 °C. | |
Furthermore, SO2/NO/O2 co-adsorption behavior was studied using in situ DRIFTS experiments. As shown in Fig. 7(b), the two bands at 1629 and 1603 cm−1, indexed to gaseous or adsorbed O-bound-NO2, were obviously weakened. This suggested that generated NO2 was involved in SO2 removal as a strong oxidant. The peaks at 1376 and 1346 cm−1 could be assigned to adsorbed SO3 molecules. The intensity of the wide bands at 1151 and 1130 cm−1, ascribed to SO42− species, was rapidly enhanced during the experiment. Meanwhile, the peak of SO42− became more intense and the peak of SO32− was weakened in the presence of NO and O2. The increase of the SO42− peak and decrease of the SO32− peak were attributed to the oxidizing effect of NO. Therefore, it was suggested that NO2 was a more powerful oxidant compared with O2, so it reacted with the SO2 efficiently at 150 °C. As a result, the presence of O2 and NO in the feed gas was found to be beneficial to produce sulfate salts instead of sulfite salts as the final product in the desulfurization reaction.
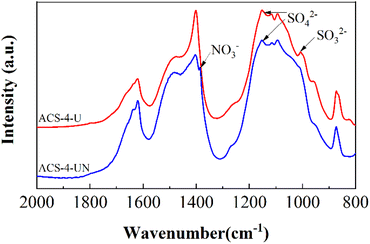 |
| | Fig. 7 FTIR spectra of ACS-4-U (without NO) and ACS-4-UN (with 750 mg m3 NO). | |
3.4 FTIR analysis
FTIR spectra of the used sorbent in the absence and the presence of NO are shown in Fig. 7. Compared with ACS-4-U, ACS-4-UN exhibits a weak vibration band at around 1384 cm−1, which was assigned to nitrate species.45 Additionally, the peak at around 1004 cm−1, ascribed to SO32− species,13 disappeared after NO was involved. This further verified that NO can be adsorbed on the surface of ACS-4 and converted into NO3−/NO2− species. Meanwhile, the presence of NO enabled SO2/SO32− to be oxidized into SO42−, enhancing the SO2 removal efficiency significantly.
3.5 Possible reaction mechanism
Based on in situ DRIFTS and FTIR data, it was found that nitrite species (–NO2), sulfite species (–SO3), surface-adsorbed SO2 and SO3 species and adsorbed-NO2 species were the main reaction intermediates. In addition, both physical adsorption and chemical reaction were involved in the desulfurization process. Notably, NO played a considerably important role in the SO2 removal. Adsorbed-NO2 species, derived from NO, acted as a strong oxidizer for SO2/SO32−. Herein, a possible desulfurization mechanism was proposed, as illustrated in Scheme 1.
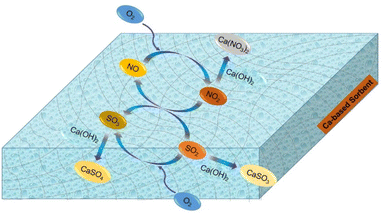 |
| | Scheme 1 Desulfurization reaction routes enhanced by the presence of NO and O2. | |
In dry flue gas desulfurization (FGD) processes, SO2 is combined with NO and O2 to form sulfur trioxide, which is a chemical reaction that can significantly boost the adsorption. Based on the above results, the mechanism of O2 and NO enhancing SO2 removal under dry conditions is summarized as follows in reactions (5)–(12).
| | |
SO2(ad) + Ca(OH)2(s) → CaSO3(s) + H2O(l)
| (6) |
| | |
SO2(ad) + 0.5 O2(g) → SO3(ad)
| (7) |
| | |
NO(ad) + 0.5 O2(g) → NO2(ad)
| (9) |
| | |
NO2(ad) + SO2(ad) → SO3(ad) + NO(g)
| (10) |
| | |
SO3(ad) + Ca(OH)2(s) → CaSO4(s) + H2O(l)
| (11) |
| | |
3NO2(ad) + Ca(OH)2(s) → Ca(NO3)2(s)+ NO(g) + H2O(l)
| (12) |
where (g) and (ad) denote the gaseous and adsorbed states of SO
2, NO, NO
2, and SO
3, respectively.
In accordance with the above chemical equations, O2 plays an important role in the formation of SO3. Compared with SO2, SO3 can more easily be adsorbed on the surface of the ACS since the sorbent is a material with strong basicity. Moreover, the presence of NO leads to the formation of NO2, which promotes the oxidation of SO2 into SO3. Finally, the adsorption active sites are mainly occupied by SO42− species, resulting in deactivation of the ACS.
4. Conclusions
Flue gas desulfurization (FGD) processes are well-established and prominent technologies for the reduction of SO2 in post-combustion stack gases emitted from coal-fired processes. In this work, a simple, convenient and green synthesis method was applied to prepare sorbents with high adsorption capabilities in dry FGD processes. Herein, the conclusions drawn are as follows.
Firstly, the high-value utilization of fly ash and gypsum was achieved. Based on our experimental results, the optimum proportion of ACS material for SO2 removal was coal fly ash/CaO/CaSO4 = 1:2:1. It was found that the capture of SO2 by the ACS with a specific surface area of 31.5 m2 g−1 was much higher than that of its raw materials with an adsorption capacity of 44.26 mg g−1, superior to the majority of calcium-based sorbents reported previously. This can be attributed to its relatively large specific surface area, abundant mesopore structure and uniform distribution of pore size. Besides, the newly formed crystalline phase (calcium aluminate silicate hydrate) after the mixing of fly ash, gypsum and CaO acts as active adsorption sites for SO2, enhancing desulfurization efficiency dramatically.
Therefore, ACS-4 is a valuable and high-performing substitute for conventional sorbents for SO2 capture. Notably, the impact of O2 and NO in the desulfurization process was elucidated, which is instructive for the adjustment and improvement of actual working conditions.
Conflicts of interest
There are no conflicts to declare.
Notes and references
- H. Zhang, J. Niu, Y. Guo and F. Cheng, J. Cleaner Prod., 2021, 280, 124375 CrossRef CAS.
- R. Chen, T. Zhang, Y. Guo, J. Wang, J. Wei and Q. Yu, Chem. Eng. J., 2021, 420, 127588 CrossRef CAS.
- C. Banerjee, S. Agarwal, P. S. Dash and A. Roy, Therm. Sci. Eng. Prog., 2021, 25, 101025 CrossRef CAS.
- Y. Mathieu, L. Tzanis, M. Soulard, J. Patarin, M. Vierling and M. Molière, Fuel Process. Technol., 2013, 114, 81–100 CrossRef CAS.
- H. Zhang and A. J. Khan Chowdhury, Nat., Environ. Pollut. Technol., 2019, 18, 1621–1625 CAS.
- R. del Valle-Zermeño, J. Formosa and J. M. Chimenos, Rev. Chem. Eng., 2015, 31, 303–327 Search PubMed.
- K. T. Lee, A. M. Mohtar, N. F. Zainudin, S. Bhatia and A. R. Mohamed, Fuel, 2005, 84, 143–151 CrossRef CAS.
- H. Tamon and M. Okazaki, Carbon, 1996, 34, 741–746 CrossRef CAS.
- L. Yang, X. Jiang, W. Jiang, P. Wang and Y. Jin, Energy Fuels, 2017, 31, 4556–4564 CrossRef CAS.
- W. Liao, X. Meng, L. Yao, W. Jiang and L. Yang, ACS omega, 2021, 6, 30949–30959 CrossRef CAS PubMed.
- L. Juan, F. Yu, H. Lihua, T. Deliang, C. Haiyan, N. Belzile and C. Yuwei, J. Hazard. Mater., 2020, 389, 121914 CrossRef CAS.
- T. Ishizuka, T. Yamamoto and T. Murayama, Energy Fuels, 2001, 15, 438–443 CrossRef CAS.
- K. T. Lee, A. R. Mohamed, S. Bhatia and K. H. Chu, Chem. Eng. J., 2005, 114, 171–177 CrossRef CAS.
- H. Tsuchiai and H. Nakamura, et al, Ind. Eng. Chem. Res., 1996, 35, 851–855 CrossRef CAS.
- N. A. Khan, Z. Hasan and S. H. Jhung, Chem.–Eur. J., 2014, 20, 376–380 CrossRef CAS.
- P. Maina, Proceedings of the Sustainable Research and Innovation Conference, 2022, vol. 35, pp. 140–149 Search PubMed.
- T. Ishizuka, H. Tsuchiai, T. Murayama, T. Tanaka and H. Hattori, Ind. Eng. Chem. Res., 2000, 39, 1390–1396 CrossRef CAS.
- G. Jun, Y. Sam and C. Nag, Appl. Sci., 2018, 8, 1116 CrossRef.
- N. Karatepe, A. Ersoy-Mericboyu and S. Küçükbayrak, Environ. Technol., 1999, 20, 377–385 CrossRef CAS.
- N. F. Zainudin, K. T. Lee, A. H. Kamaruddin, S. Bhatia and A. R. Mohamed, Sep. Purif. Technol., 2005, 45, 50–60 CrossRef CAS.
- Y. Wang, X. Han, M. Chen, S. Cui, X. Ma and L. Hao, Materials, 2020, 14, 68 CrossRef PubMed.
- N. N. Abd Malek and R. Laiman, Sci. Lett., 2018, 12, 63–76 Search PubMed.
- V. H. Dodson, Concrete admixtures, Springer, 1990, pp. 159–201 Search PubMed.
- I. Dahlan, K. T. Lee, A. H. Kamaruddin and A. R. Mohamed, Environ. Sci. Technol., 2008, 42, 1499–1504 CrossRef CAS.
- W. Jozewicz and G. T. Rochelle, Environ. Prog., 1986, 5, 219–224 CrossRef CAS.
- P. Davini, Fuel, 1996, 75, 713–716 CrossRef CAS.
- J. Fernandez, J. Renedo, A. Garea, J. Viguri and J. Irabien, Powder Technol., 1997, 94, 133–139 CrossRef CAS.
- H. Son, S. M. Park, J. H. Seo and H. K. Lee, Materials, 2019, 12, 1673 CrossRef CAS PubMed.
- M. Cui, F. Niu, N. Wang, J. Zhou, J. Wang and J. Li, Fuel, 2020, 277, 118051 CrossRef.
- B. Yang, S. Ma, R. Cui, S. Sun, J. Wang and S. Li, Chem. Eng. J., 2019, 359, 233–243 CrossRef CAS.
- F. Wang, Y. Zhang and Z. Mao, New J. Chem., 2020, 44, 11879–11886 RSC.
- D. Barpaga and M. D. LeVan, Microporous Mesoporous Mater., 2016, 221, 197–203 CrossRef CAS.
- Z. Ling, P. Wan, C. Yu, N. Xiao, J. Yang, Y. Long and J. Qiu, Chem. Eng. J., 2015, 259, 894–899 CrossRef CAS.
- W. Kurdowski, Cement and concrete chemistry, Springer Science & Business, 2014 Search PubMed.
- Z. Mirghiasi, F. Bakhtiari, E. Darezereshki and E. Esmaeilzadeh, J. Ind. Eng. Chem., 2014, 20, 113–117 CrossRef CAS.
- Y. Yu, J. Wang, J. Chen, X. Meng, Y. Chen and C. He, Ind. Eng. Chem. Res., 2014, 53, 16229–16234 CrossRef CAS.
- M. Yan, F. Chen, J. Zhang and M. Anpo, J. Phys. Chem. B, 2005, 109, 8673–8678 CrossRef CAS PubMed.
- T. Ishizuka, H. Kabashima, T. Yamaguchi, K. Tanabe and H. Hattori, Environ. Sci. Technol., 2000, 34, 2799–2803 CrossRef CAS.
- L. Wei, S. Cui, H. Guo, X. Ma and L. Zhang, J. Mol. Catal. A: Chem., 2016, 421, 102–108 CrossRef CAS.
- X. Dong, L. Huang, C. Hu, H. Zeng, Z. Lin, X. Wang, K. M. Ok and G. Zou, Angew. Chem., 2019, 131, 6598–6604 CrossRef.
- X. Wu, Q. Liang, D. Weng and Z. Lu, Catal. Commun., 2007, 8, 2110–2114 CrossRef CAS.
- N. Guillén-Hurtado, A. Bueno-López and A. García-García, Appl. Catal., A, 2012, 437, 166–172 CrossRef.
- J.-Y. Ye, J.-L. Lin, Z.-Y. Zhou, Y.-H. Hong, T. Sheng, M. Rauf and S.-G. Sun, J. Electroanal. Chem., 2018, 819, 495–501 CrossRef CAS.
- X. Feng, S. Zhang, R. Liu, J. Ma, X. Xu, J. Xu, X. Fang and X. Wang, Phys. Chem. Chem. Phys., 2022, 24, 3250–3258 RSC.
- X. Duan, D. Yuan, X. Wang and H. Xu, J. Sol-Gel Sci. Technol., 2005, 35, 221–224 CrossRef CAS.
|
| This journal is © The Royal Society of Chemistry 2023 |
Click here to see how this site uses Cookies. View our privacy policy here. 
 Open Access Article
 This Open Access Article is licensed under a Creative Commons Attribution-Non Commercial 3.0 Unported Licence
 *a
*a