 Open Access Article
Anchoring Co3O4 nanoparticles on conjugated polyimide ultrathin nanosheets: construction of a Z-scheme nano-heterostructure for enhanced photocatalytic performance†
Duoping Zhanga,
Chenghai Ma *a,
Zhiang Luoa,
Meitong Zhua,
Binhao Lia,
Lian Zhou
 b and
Guoyu Zhangb
aSchool of Chemical Engineering, Qinghai University, Xining, 810016, China. E-mail: chmaqhu@163.com
bNew Energy (Photovoltaic) Industry Research Center, Qinghai University, Xining 810016, China
First published on 4th January 2023
Abstract
Efficient utilization of solar energy for photocatalytic hydrogen production and degradation of organic pollutants is one of the most promising approaches to solve the energy shortage and environmental pollution. A series of Co3O4/sulfur-doped polyimide (CO/SPI) direct Z-scheme nano-heterostructure photocatalysts was successfully prepared via a facile green thermal treatment method. The effects of Co3O4 nanoparticles on the structure, morphology, and optoelectronic properties of CO/SPI composite samples were systematically characterized by different spectroscopic methods. Characterization results confirmed that Co3O4 nanoparticles as an acid oxide catalyst promoted the oxidation stripping of bulk SPI to form SPI ultrathin nanosheets. Thus, the Co3O4 nanoparticles were firmly embedded on SPI ultrathin nanosheets to construct a direct Z-type CO/SPI nanostructure junction. Therefore, the activity and cycle stability of photocatalytic water splitting for hydrogen production and organic pollutant degradation were greatly improved under solar light irradiation. In particular, the 0.5CO/SPI composite sample displayed the highest activity with an average production rate of 127.2 μmol g−1 h−1, which is nearly 13 times and 106 times higher than that of SPI and Co3O4. This work provides a new avenue for constructing efficient inorganic–organic nanoheterostructured Z-type photocatalysts and takes an important step towards the efficient utilization of renewable energy.
1. Introduction
With the increasing global energy shortage and environmental pollution problems,1–3 it is crucial to develop sustainable and environmentally friendly technologies. As a low-cost, high-efficiency, easy-to-operate, and environmentally friendly environmental purification technology, photocatalytic technology can not only degrade organic pollutants in water,4 but also photolyse water to generate hydrogen and oxygen.5 This strategy has significant advantages in using abundant solar energy to solve these intractable problems, and has attracted great attention from researchers.6,7 Nowadays, semiconductor photocatalytic materials play an important role in photocatalytic technologies that make full use of solar energy. Therefore, the research and development of novel photocatalysts have been widely favored by many researchers. Among a wide variety of photocatalysts, the conjugated polymer graphite carbon nitride (g-C3N4) was reported as a new type of polymer semiconductor photocatalytic material.8 Since then, g-C3N4 has inspired a large number of studies on polymer photocatalysis, and the research in this field has developed rapidly in the past decade.9–12Recently, Chu et al. discovered another novel organic conjugated polymeric polyimide photocatalyst, which was synthesized by a green thermal condensation of amine and dianhydride monomers under mild conditions.13 As a photocatalyst, PI is similar to other polymer semiconductor photocatalytic materials, and has the advantages of abundant sources, low cost, environmental friendliness, tunable structure, excellent photocatalytic activity, and stable chemical structure. However, PI still has the major shortcomings of low specific surface area and high carrier recombination rate as photocatalysts. Consequently, PI has been modified through various ways including co-monomer tuning,14,15 element doping (e.g. hyperbranched polymeric N-oxide and sulfur-doped polyimide),16,17 co-catalyst (e.g. MoO3/PI, ZnO/PI, and MoS2/PI),18–21 and solvo/hydrothermal method22,23 effectively to improve its photocatalytic activity. Although some achievements have been made in the modification of the photocatalytic properties of PI, its photocatalytic activity is still not high due to its low efficiency in the transport of photogenerated carriers and the separation of photogenerated electron–hole pairs. In general, reducing the dimensionality of the catalyst favors the transport of photogenerated charge carriers.24,25 Moreover, the construction of an inorganic–organic direct Z-type nanoheterojunction structure can not only greatly improve the separation efficiency of photogenerated electron and hole pairs, but also maintain the more negative reduction potential and more positive oxidation potential of the two catalysts, respectively.26–28 One of the modification methods for PI is sulfur doping.17 Although the visible light absorption of the sulfur-doped polyimide (SPI) was increased, the photocatalytic activity was not significantly improved due to the high recombination rate of photogenerated electrons and holes. In order to further effectively improve the transport and separation efficiency of photogenerated carriers, it is crucial to reduce the dimensions of photocatalytic materials and construct inorganic–organic Z-type nanostructures. Cobalt oxide (Co3O4), as a p-type transition metal oxide semiconductor,29,30 it is a potential semiconductor material for coupling with SPI to construct a heterojunction system because the band-gap edges of Co3O4 (ECB = 0.46 eV and EVB = 2.35 eV)31 match well with those of SPI (ECB = −0.98 eV and EVB = 1.60 eV).17 In particular, Co3O4 also has the advantages of low cost and low environmental risk.32,33 Therefore, Co3O4 is an optimal choice for the construction of a heterojunction with SPI composites to enhance the performance of the catalysts.
To the best of our knowledge, there is no relevant research report on combining SPI with Co3O4 to enhance its photocatalytic activity. Based on the above analysis and considerations, we synthesized a series of direct Z-type cobalt oxide nanoparticles/SPI ultrathin nanosheet (CO/SPI) composite photocatalytic materials by a facile and green method for the first time. During the preparation of CO/SPI composites, Co3O4 nanoparticle as an acid oxide catalyst promotes the oxidation stripping of bulk SPI to form SPI ultrathin nanosheets. Thus, Co3O4 nanoparticles are firmly embedded on the surface of SPI ultrathin nanosheets to form a CO/SPI composite photocatalyst for photocatalytic water splitting for hydrogen production and organic pollutant degradation. The effects of Co3O4 nanoparticles on the photocatalytic performance of CO/SPI composites were systematically investigated. The possible photocatalytic mechanism was also proposed under solar-light irradiation.
2. Material and methods
2.1. Synthesis of the photocatalyst
Melamine (MA) and pyromellitic dianhydride (PMDA) were purchased from Shanghai Macklin Biochemical Co., Ltd., whereas cobalt acetate tetrahydrate (Co(CH3COO)2·4H2O), sublimed sulfur (S4) were bought from Tianjin Dengke Chemical Reagent Co., Ltd. Triethanolamine (TEOA) was obtained from Sigma-Aldrich. All chemical reagents were used without further purification.Sulfur-doped polyimide (SPI) was synthesized according to a facile thermal polymerization method reported previously.17 Typically, 1.0 g of MA 1.7 g of PMDA, and 0.9 g of S4 were mixed and fully ground until the particles are fine and uniform. Then, the ground mixed powder is loaded into a porcelain boat and placed in a tubular furnace. It was heated to 325 °C at a heating rate of 2.5 °C min−1 in a nitrogen atmosphere and maintained for 240 min, and then cooled to room temperature at a cooling rate of 2.5 °C min−1. At last, the obtained crude SPI was washed, dried, and ground to obtain the required SPI photocatalyst.
Cobalt oxide (Co3O4) nanoparticles were prepared by a modified hydrothermal method. As shown in Scheme S1,† 0.5 g of Co(CH3COO)2·4H2O was dissolved in a certain amount of mixed solution of water and ethanol under stirring conditions.34 Then, 2.5 mL of ammonia (25%) was also slowly added under the magnetic stirring condition of 45 °C. The black Co3O4 nanoparticles were obtained after hydrothermal treatment at 80 °C for 3 hours, and further centrifugal washing and drying.
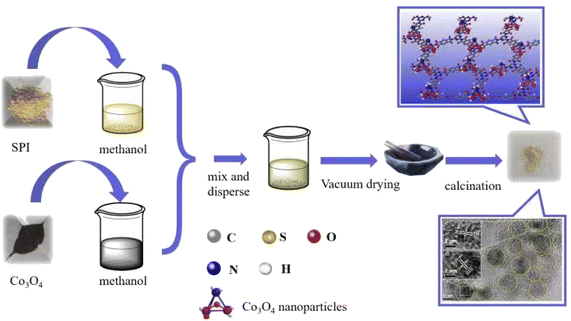
The preparation process of Catalyst CO/SPI composite is shown in Scheme 1. Firstly, the prepared Co3O4 nanoparticles were dispersed into 10 mL of methanol solution according to a certain proportion and treated with ultrasound for 30 minutes. At the same time, the prepared SPI powder was dispersed into 10 mL of methanol solution and it was sonicated for 30 minutes. Then the two dispersions were mixed and the mixed solution was dried in a water bath. After drying, it was moved to a vacuum oven to remove methanol. In order to enhance the interaction between Co3O4 nanoparticles and SPI matrix, the resulting mixture was treated at 150 °C in an air atmosphere for 2 hours. In this way, a series of 0.5 wt% Co3O4/SPI, 1.0 wt% Co3O4/SPI, 3.0 wt% Co3O4/SPI, 4.0 wt% Co3O4/SPI, and 5.0 wt% Co3O4/SPI composites with different cobalt oxide contents were successfully prepared and abbreviated as 0.5CO/SPI, 1.0CO/SPI, 30CO/SPI, 4.0CO/SPI, and 5.0CO/SPI, respectively.
2.2. Characterization
The crystal structures of the samples were analyzed by a Rigaku diffractometer using Cu Kα radiations, and the X-ray tube was operated at 40 kV and 40 mA. The Fourier Transform-IR (FT-IR) spectroscopy measurements were performed on a Nicolet 6700 spectrometer using the KBr pellet support. The scanning electron microscope (SEM) image was obtained on a JSM-6610 system. The transmission electron microscope (TEM), high-resolution transmission electron microscope (HRTEM), and the selected area electron diffraction (SAED) images were taken at a JEM2100 electron microscope. X-ray photoelectron spectroscopy (XPS) and valence band X-ray photoelectron spectroscopy (VBXPS) were performed using a PHI 5000 Versa Probe X-ray photoelectron spectrometer with monochromatized Al Kα X-ray radiation. The binding energies of all elements were calibrated by the C 1s peak at 284.6 eV. UV-vis diffuse reflection spectroscopy (DRS) was carried out on a Shimadzu UV-2600 spectrometer, and BaSO4 was used as the reference at room temperature. The photoluminescence (PL) spectra of the samples were collected by an Agilent MY15170004 spectrometer with an excitation wavelength of 350 nm. Electron spin resonance (ESR) spectra were obtained from a Bruker model EMXplus spectrometer.2.3. Electrochemical measurements
Photo-electrochemical measurements were performed using a standard three-electrode system using an electrochemical analyzer (Chenhua CHI 660D) with a xenon lamp as the auxiliary light source. In this system, the three electrodes are an Ag/AgCl reference electrode (RE), a Pt counter electrode (CE), and a working electrode (WE), respectively, and the electrolyte solution is a sodium sulfate solution (Na2SO4, 0.5 mol L−1, pH = 6.8). The working electrode was prepared with samples on fluorine-doped tin oxide (FTO) transparent conductive glass. Specifically, 15 mg of sample powder was dispersed in 1.5 mL of ethanol solution under stirring. And 55 μL of Nafion (25%) solution was also added as a binder. Thus, a uniform suspension was obtained after ultrasonic treatment for 40 minutes. Then, a certain amount of suspension was added dropwise onto the FTO glass surface with an area of 1 cm × 2 cm squares. After drying for 6 hours at room temperature, the prepared working electrode was put into an oven at 120 °C for 2 hours to make the sample and FTO glass bond more firmly. Mott–Schottky curves were measured under dark at 1.0 kHz frequencies, and the open circuit potential was 10 mV. Electrochemical impedance spectroscopy (EIS) plots were collected at frequency ranged from 200 kHz to 10 mHz EIS under open circuit voltage. The photocurrent experiments were carried out by using an electrochemical station (Chenhua CHI 660D) and the three-electrode configuration, which was equipped with a xenon lamp.2.4. Photocatalytic performance measurements
The photocatalytic hydrogen evaluation activities of the prepared catalyst samples were tested in a top-irradiation reaction vessel, which was connected to a glass enclosed gas circulation system and irradiated by an XL-300 W xenon lamp as the full arc light source. Typically, 50 mg of a photocatalyst powder sample was dispersed in a Pyrex glass reactor containing a 100 mL mixed solution of (CH2CH2OH)3N hole sacrificial agent/water (1![[thin space (1/6-em)]](https://www.rsc.org/images/entities/char_2009.gif) :
:![[thin space (1/6-em)]](https://www.rsc.org/images/entities/char_2009.gif) 9 by volume). At the same time, a certain amount of H2PtCl6 was added as the precursor of Pt, and 3 wt% Pt as a cocatalyst was photo deposited on the catalyst surface by irradiating the reactant solution under full-arc light (λ > 300 nm) for 1 h. The production of hydrogen gas was analyzed by on-line gas chromatograph (GC9790II, Fuli, TCD, Ar support).
9 by volume). At the same time, a certain amount of H2PtCl6 was added as the precursor of Pt, and 3 wt% Pt as a cocatalyst was photo deposited on the catalyst surface by irradiating the reactant solution under full-arc light (λ > 300 nm) for 1 h. The production of hydrogen gas was analyzed by on-line gas chromatograph (GC9790II, Fuli, TCD, Ar support).
Photocatalytic degradation of organic pollutants experiments were also carried out. In this experiment, methyl orange (MO) solution was used to simulate the organic pollutant. And XL-300 W xenon lamp was used to simulate the sunlight for photocatalytic degradation experiment. Typically, 100 mL of MO solution with the concentration of 4 mg L−1 was prepared and put into the photocatalytic reactor. Then 0.2 g of prepared SPI or CO/SPI composite photocatalytic material was added to the MO solution in the reactor. The circulating water system of the low-temperature thermostatic bath and the magnetic stirrer were turn on, respectively. To reach the adsorption–desorption equilibrium, it was stirred for 1 h in the dark. After taking out a mixed suspensions (3–4 mL) as initial sample, the xenon lamp (300 W) was turned on for photocatalytic degradation of MO. At each predetermined interval of 1 hour, 4 mL of the suspension was draw and centrifuged to remove most of the sample particles. Then the obtained solution was further filtered through MCE 0.45 μm and analyzed by testing its absorbance with an UV-vis spectrometer (Mepoda UV-1800) at 464 nm.
3. Results and discussions
3.1. Structure and morphology analysis
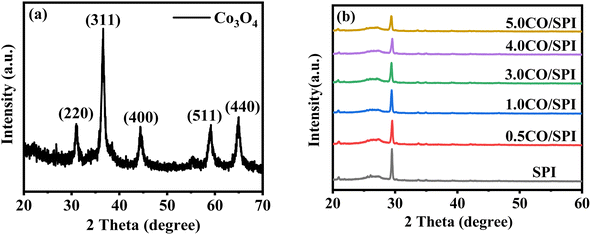
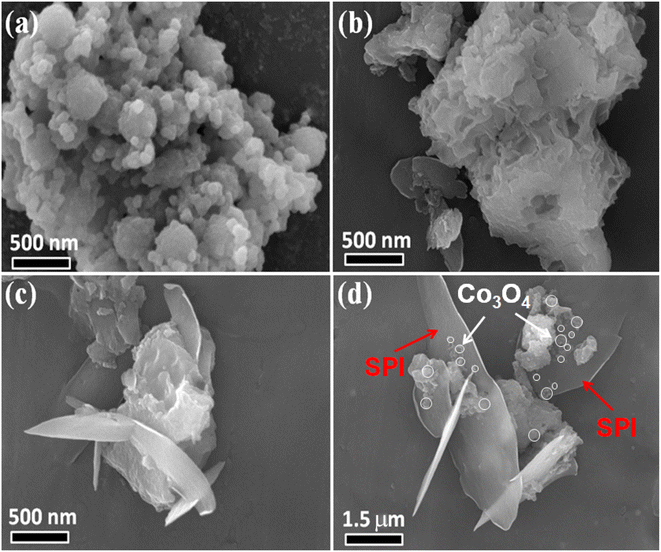
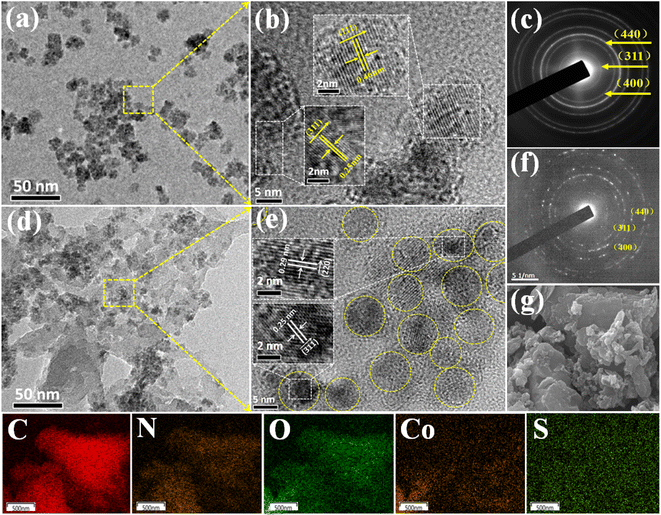
XRD was used to detect the crystal phase composition and structure of each prepared catalyst. Fig. 1 shows the XRD patterns of Co3O4, SPI and CO/SPI composites. As shown in Fig. 1a, the sharp diffraction peaks at 31.4, 36.9, 44.8, 59.3 and 65.4 can be clearly observed in the XRD spectra of Co3O4, which are related to the crystal planes of (220), (311), (400), (511) and (440) of standard phase Co3O4 (JCPDS no. 43-1003) (JCPDS no. 42-1467), respectively.35 Furthermore, there are no other diffraction peak, which indicated that all cobalt acetate tetrahydrate precursors have been converted to Co3O4, and the prepared Co3O4 has high purity and good crystallinity. From Fig. 1b, it can be seen that several characteristic diffraction peaks in the range of 20–30° appeared on the pattern of SPI, which is consistent with the XRD distinct peaks of SPI as previously reported.17 These characteristic diffraction peaks also appeared in the XRD patterns of a series of CO/SPI composite samples. Moreover, the positions of the peaks did not shift after the cobalt oxide nanoparticles were anchored on the SPI, indicating that the introduction of cobalt species did not change the crystal structure of the SPI. However, the strongest peak at 29.5° represents the polymerization degree of SPI, and the intensity of this peak gradually decreases with the increase of Co3O4 content. In contrast, the peak intensity at 27.4° for the π-conjugated two-dimensional (2D) frame stacking of SPI is slightly enhanced. This may be due to the fact that during the synthesis of CO/SPI composites, cobalt oxide nanoparticles act as acidic oxides to catalyze the oxidative exfoliation of SPI into small molecular oligomers, which are then re-polymerized to form 2D layered materials at 150 °C. Moreover, no characteristic diffraction peaks of Co3O4 were found in the CO/SPI composite by carefully comparing the XRD patterns of SPI, Co3O4, and 3.0CO/SPI composite as shown in Fig. S1.† This may be due to the small amount and high dispersion of the Co3O4 nanoparticles anchored on the SPI. These results are very similar to our previous study.21To determine the topographical and microstructure features of the Co3O4, SPI, and 3.0CO/SPI composite samples, SEM, HR-TEM, EDX and SAED measurements were performed. As can be seen from Fig. 2a and b, the cobalt oxide is in the form of nanoparticles, while SPI shows a porous layered shape. Interestingly, the SPI transformed from a porous layered to an ultrathin nanosheet morphology after combining with Co3O4 as shown in Fig. 2c and d, which is consistent with the XRD characterization analysis. Moreover, the ultrathin nanosheets are interspersed layer by layer, exposing more reaction sites, which is more conducive to the transport of charge carriers, thereby contributing to the improvement of photocatalytic activity. Fig. 3a shows the TEM image of Co3O4 nanoparticles. After the magnification of some of the cobalt oxide nanoparticles, clear lattice diffraction fringes were found. As displayed in Fig. 3b, the lattice fringe spaces are mainly 0.25 nm and 0.46 nm, corresponding to the (311) and the (111) crystal planes, respectively. The SAED image of cobalt oxide also shows that its main crystal planes are (311), (400) and (440) as displayed in Fig. 3c, 34 which are consistent with the crystal planes corresponding to the main XRD characteristic diffraction peaks of Co3O4 powder sample. From Fig. 3d, it can be obviously seen that some nanoparticles are embedded on the SPI. More importantly, many cobalt oxide particles with a particle size of about 6 nm were anchored to the SPI. And through precise measurement, it is found that the (311) and (220) crystal planes corresponding to the lattice diffraction fringe spaces of 0.25 nm and 0.29 nm, respectively, are dominant as shown in Fig. 3e. The SAED image of 3.0CO/SPI composite sample further illustrated that the crystal planes of Co3O4 on the SPI are (311), (400) and (440), respectively. Additionally, the SEM elemental mapping measurement was performed to determine the distributions of the C, N, Co, O, and S elements in 3.0CO/SPI. The percentage content of elements can be seen from Fig. S2.† And all of the elements were uniformly dispersed with in the as-prepared photocatalyst in Fig. 3g. These results are sufficient to demonstrate that the Co3O4 nanoparticles were indeed anchored to the SPI.
In addition, the FT-IR spectra of Co3O4, SPI, and CO/SPI composites samples are shown in Fig S3.† The peaks centered at 565 cm−1 and 654 cm−1 can be assigned to the Co(III)–O bond stretching vibration mode and O–Co–O bond bridging vibration of Co3O4, respectively.36 For a series of CO/SPI composite samples, it exhibits the same characteristic absorption peaks as SPI. Specifically, the peaks at 1772, 1725, and 725 cm−1 are derived from the asymmetric stretching, symmetric stretching, and bending vibration absorption peaks of C![[double bond, length as m-dash]](https://www.rsc.org/images/entities/char_e001.gif) O on the SPI five-membered imide ring of the matrix sample, respectively. And the peak located at 1376 cm−1 can be attributed to the C–N stretching vibration absorption peak on the five-membered imine ring.18 Moreover, the bands at 1308 cm−1 marked with red dotted lines are indicative of the character of aromatic C–N–C stretching and breathing modes in the triazine unit. The several absorption bands at 1640 and 1158 cm−1 contributed to the aromatic C–C and C–H bonds of benzene rings in dianhydride blocks. What's more, some characteristic vibrating peaks of the S–N bond in the range of 715–625 cm−1 are observed, such as 634 cm−1. These results fully indicated that the SPI structure was well synthesized and the introduction of cobalt oxide nanoparticles did not change its chemical skeleton.
O on the SPI five-membered imide ring of the matrix sample, respectively. And the peak located at 1376 cm−1 can be attributed to the C–N stretching vibration absorption peak on the five-membered imine ring.18 Moreover, the bands at 1308 cm−1 marked with red dotted lines are indicative of the character of aromatic C–N–C stretching and breathing modes in the triazine unit. The several absorption bands at 1640 and 1158 cm−1 contributed to the aromatic C–C and C–H bonds of benzene rings in dianhydride blocks. What's more, some characteristic vibrating peaks of the S–N bond in the range of 715–625 cm−1 are observed, such as 634 cm−1. These results fully indicated that the SPI structure was well synthesized and the introduction of cobalt oxide nanoparticles did not change its chemical skeleton.
The chemical state of the elements for SPI, Co3O4, and 3.0CO/SPI samples were further probed by XPS technology. The binding energies of all the elements are corrected by the C 1s peak at 284.6 eV, which is attributable to the sp2 C![[double bond, length as m-dash]](https://www.rsc.org/images/entities/char_e001.gif) C bond or the indeterminate carbon.37 The corresponding high resolution XPS spectra of C 1s, N 1s, Co 2p and O 1s of the prepared samples are shown in Fig. 4a–d, respectively. Obviously, the C 1s XPS spectra for SPI shown in Fig. 4a could be fitted into three peaks located at 284.6 eV, 286.6 eV, and 288.7 eV. The peaks centered at 286.6 eV and 288.7 eV could be assigned to the N–C–N bond and the C
C bond or the indeterminate carbon.37 The corresponding high resolution XPS spectra of C 1s, N 1s, Co 2p and O 1s of the prepared samples are shown in Fig. 4a–d, respectively. Obviously, the C 1s XPS spectra for SPI shown in Fig. 4a could be fitted into three peaks located at 284.6 eV, 286.6 eV, and 288.7 eV. The peaks centered at 286.6 eV and 288.7 eV could be assigned to the N–C–N bond and the C![[double bond, length as m-dash]](https://www.rsc.org/images/entities/char_e001.gif) O in the triazine rings of SPI, respectively. And the positions of these three peaks hardly changed in the XPS spectrum of the 3.0CO/SPI composite. It can also be observed from Fig. 5b that the N 1s peak centered at ∼397.5 eV corresponds to the sp2 N–C
O in the triazine rings of SPI, respectively. And the positions of these three peaks hardly changed in the XPS spectrum of the 3.0CO/SPI composite. It can also be observed from Fig. 5b that the N 1s peak centered at ∼397.5 eV corresponds to the sp2 N–C![[double bond, length as m-dash]](https://www.rsc.org/images/entities/char_e001.gif) N in the triazine rings of SPI as shown in Fig. 4b. The other two N 1s peaks located at 398.4 and 399.8 eV were attributed to the splitting of nitrogen peaks after the introduction of sulfur atoms into the five-membered polyimide ring.17 In the XPS spectrum of the 3.0CO/SPI composite, the binding energies of the three peaks of N 1s increased to 397.7, 398.7, and 400.0 eV, respectively. In addition, the four Co 2p peaks positioned at 779.1, 780.5, 794.8, and 796.5 eV were assigned to Co 2p1/2 (Co3+), Co 2p3/2 (Co2+), Co 2p1/2 (Co3+) and Co 2p3/2 (Co2+) for Co3O4 as depicted in Fig. 4c, respectively.38 It can be clearly seen that the binding energies of the Co 2p peaks associated with the 3.0CO/SPI composite have decreased and moved to 778.7, 779.5, 794.1, and 795.1 eV, respectively. In contrast, the N 1s binding energies of 3.0CO/SPI composite shifted 0.2, 0.3, and 0.4 eV to higher binding energy compared with SPI. These significant changes in binding energies may be attributed to the heterojunction constructed by the strong interaction between cobalt oxide and SPI. According to the previous report,39 the sp3-hybridized nitrogen atoms could act as electron donors to provide lone pairs of electrons to the unoccupied orbitals of transition metal atoms (M) through chemical coupling to form M(δ+)–N(δ−) bonding states. Similarly, it can be clearly observed in our 3.0CO/SPI composite that the binding energy of N 1s increased relative to SPI, while the binding energy of Co 2p decreased compared to Co3O4. This fully confirms that the nitrogen atoms of SPI and the cobalt atoms of cobalt oxide are involved in the strong interface electrons interaction. The strong interaction between the two semiconductors is very favorable for the construction of dense heterojunctions, thereby promoting the transport of photogenerated carriers and the enhancement of photocatalytic performance. However, there is no obvious shift in the binding energies of O 1s of SPI after combining with Co3O4 as shown in Fig. 4d. This may be attributed to the small amount of cobalt oxide nanoparticles anchored on the SPI and the high electronegativity of oxygen atom compared to the nitrogen atom.37
N in the triazine rings of SPI as shown in Fig. 4b. The other two N 1s peaks located at 398.4 and 399.8 eV were attributed to the splitting of nitrogen peaks after the introduction of sulfur atoms into the five-membered polyimide ring.17 In the XPS spectrum of the 3.0CO/SPI composite, the binding energies of the three peaks of N 1s increased to 397.7, 398.7, and 400.0 eV, respectively. In addition, the four Co 2p peaks positioned at 779.1, 780.5, 794.8, and 796.5 eV were assigned to Co 2p1/2 (Co3+), Co 2p3/2 (Co2+), Co 2p1/2 (Co3+) and Co 2p3/2 (Co2+) for Co3O4 as depicted in Fig. 4c, respectively.38 It can be clearly seen that the binding energies of the Co 2p peaks associated with the 3.0CO/SPI composite have decreased and moved to 778.7, 779.5, 794.1, and 795.1 eV, respectively. In contrast, the N 1s binding energies of 3.0CO/SPI composite shifted 0.2, 0.3, and 0.4 eV to higher binding energy compared with SPI. These significant changes in binding energies may be attributed to the heterojunction constructed by the strong interaction between cobalt oxide and SPI. According to the previous report,39 the sp3-hybridized nitrogen atoms could act as electron donors to provide lone pairs of electrons to the unoccupied orbitals of transition metal atoms (M) through chemical coupling to form M(δ+)–N(δ−) bonding states. Similarly, it can be clearly observed in our 3.0CO/SPI composite that the binding energy of N 1s increased relative to SPI, while the binding energy of Co 2p decreased compared to Co3O4. This fully confirms that the nitrogen atoms of SPI and the cobalt atoms of cobalt oxide are involved in the strong interface electrons interaction. The strong interaction between the two semiconductors is very favorable for the construction of dense heterojunctions, thereby promoting the transport of photogenerated carriers and the enhancement of photocatalytic performance. However, there is no obvious shift in the binding energies of O 1s of SPI after combining with Co3O4 as shown in Fig. 4d. This may be attributed to the small amount of cobalt oxide nanoparticles anchored on the SPI and the high electronegativity of oxygen atom compared to the nitrogen atom.37
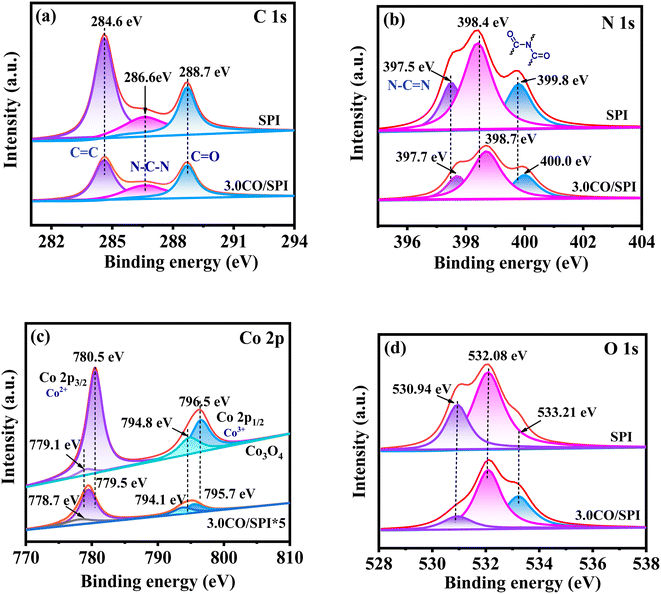 | ||
| Fig. 4 XPS spectra for (a) C 1s, (b) N 1s, (c) Co 2p, and (d) O 1s of SPI, Co3O4, and 3.0CO/SPI composite. | ||
3.2. Optical and electronic properties
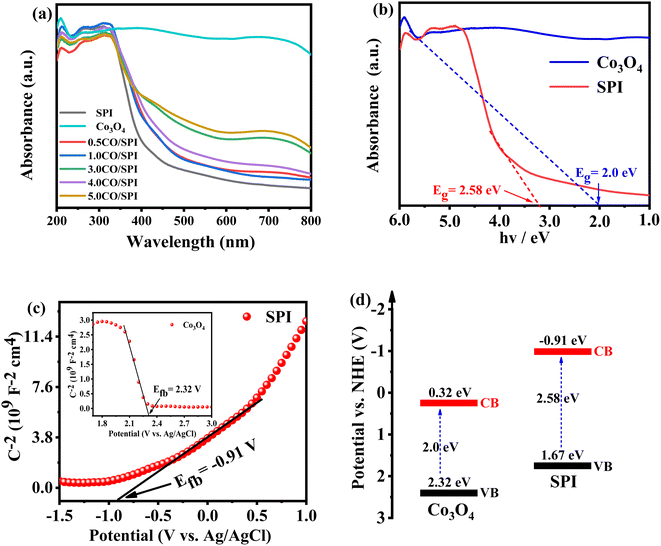
UV-vis diffuse reflectance spectroscopy (DRS) was used to evaluate the light collecting properties of Co3O4, SPI, and CO/SPI composites samples. As shown in Fig. 5a, Co3O4 displays strong absorption in the whole light range from 200 to 800 nm, and all of the CO/SPI composites exhibits enhanced absorption for visible light under the introduction of Co3O4 than SPI. Moreover, the absorption of visible light was significantly enhanced with the increase of cobalt oxide nanoparticles content. The enhancement of visible light absorption is beneficial to the efficient utilization of sunlight and the improvement of the photocatalytic activity of semiconductor materials. Fig. 5b shows the UV-vis absorption spectra of Co3O4 and SPI. Compared with pure SPI, Co3O4 shows a strong absorption tail at the wavelength of 200–800 nm, which is attributed to its black.40 It can be clearly seen that the band gaps of Co3O4 and SPI can be estimated to be 2.0 and 2.58 eV, respectively, which are from the intercept on the wavelength axis for a tangent line drawn in the UV-vis spectra of the samples.Mott–Schottky curves were used to evaluate the flat-band potential (Efb) of Co3O4 and SPI in 0.5 M Na2SO4 electrolyte.41 As we all know, the slope of the Mott–Schottky curve is negative, indicating that it is a p-type semiconductor, while the positive slope is an n-type semiconductor.42 As displayed in Fig. 5c, it can be clearly observed that Co3O4 is a p-type semiconductor, while SPI is an n-type semiconductor. The flat band potential (Efb) of Co3O4 and SPI are 2.32 V and −0.91 V versus Ag/AgCl in Fig. 5c, respectively. The Fermi level of the SPI is located near the conduction band (CB) while that of Co3O4 is located near the valence band (VB).42 Therefore, the VB of Co3O4 and the CB of SPI potentials are approximately equal to 2.32 and −0.91 eV, respectively. According to the data of the band gap (in Fig. 5b) and the formula for band gap (Eg = VB − CB), it is obvious that the CB of Co3O4 and the VB of SPI potentials are about 0.32 and 1.67 eV, respectively. In this way, the band structure of the CO/SPI composite was obtained as shown in Fig. 5d.
Additionally, photoluminescence (PL) spectroscopy was used to investigate the separation and recombination of the photogenerated electron–hole pairs, which are key factors affecting the photocatalytic reaction efficiency. The PL spectra of the as-prepared SPI, 1.0CO/SPI, 3.0CO/SPI, 5.0CO/SPI, and Co3O4 were shown in Fig. S4.† It can be obviously seen that pure SPI presented the highest PL intensity, suggesting the highest rapid recombination rate of the electron–hole pairs among these catalysts. In comparison with pure SPI, all of the 1.0CO/SPI, 3.0CO/SPI, and 5.0CO/SPI composites samples exhibited weaker PL emission intensities, which further proved that the recombination of photogenerated electrons and holes is effectively suppressed in the CO/SPI composite system.
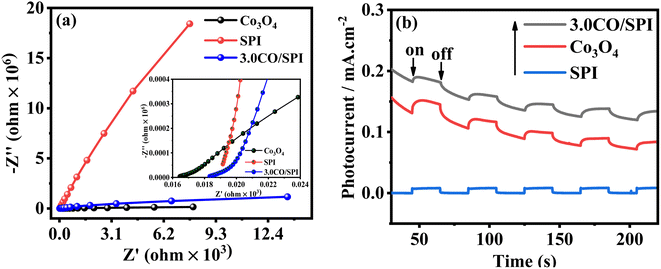
Moreover, the electrochemical impedance spectroscopy (EIS) measurements were further carried out to study the interfacial charge transfer of the electrode materials. Fig. 6a displays the EIS Nyquist plots about Co3O4, SPI, and 3.0CO/SPI composite samples in 0.5 M Na2SO4 electrolyte in dark. It can be clearly observed that the three impedance spectra were composed of a semicircle arc at the high-frequency range and a straight line at the low-frequency region. As previously reported in the literature43 the high-frequency range of the Nyquist plots was associated with the charge transfer limiting process, which can be ascribed to the double-layer capacitance (Cdl) in parallel with the charge transfer resistance (Rct) at the contact interface between the electrolyte solution and the electrode materials. Especially, the insert in Fig. 8a presented a Warburg behavior characteristic of a transmission line, which can be obviously observed in the high-frequency range of EIS spectra for the Co3O4, SPI, and 3.0CO/SPI composite.44 As we know, the Warburg behavior is diffusion resistance of electrolyte ions in the electrode material, which may be induced by electrode surface roughness.45 Obviously, the EIS Nyquist plot of the 3.0CO/SPI composite showed the superior electrical conductivity of the CO/SPI composite photocatalysts compared with SPI in the non-photoexcited state.43 Thus, the result fully verifies the fast interfacial charge transport between Co3O4 and SPI. To further demonstrate the improved charge transfer and separation efficiency of photogenerated electron–hole pairs, the transient photocurrent–time (i–t) curves of SPI, Co3O4, and 3.0CO/SPI composite were collected through several switching cycles under intermittent irradiation. As shown in Fig. 6b, it can be observed that the 3.0CO/SPI composite sample illustrated the highest photocurrent intensities among SPI, Co3O4, and 3.0CO/SPI composite samples. Moreover, we have amplified part of the photocurrent corresponding curve, and found that the photocurrent intensity of the composite is significantly enhanced relative to SPI and cobalt oxide as shown in Fig. S5.† This result is more convincing for the improvement of charge transfer and the effective suppression of the recombination rate of photogenerated electrons and holes. The above results are in good agreement with the photocatalytic activities of all prepared samples.
3.3. Photocatalytic activity and mechanism
In order to evaluate the effect of in situ crystallization of Co3O4 nanoparticles on the surface of SPI on its photocatalytic hydrogen production activity, we randomly selected 0.5CO/SPI samples and compared the photocatalytic activities with SPI and cobalt oxide. So, the photocatalytic hydrogen evolution activities of the SPI, Co3O4, and 0.5CO/SPI composite samples from water/triethanolamine (9![[thin space (1/6-em)]](https://www.rsc.org/images/entities/char_2009.gif) :
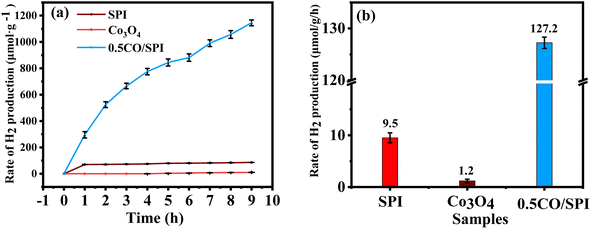
:![[thin space (1/6-em)]](https://www.rsc.org/images/entities/char_2009.gif) 1 by volume) mixture were tested by using triethanolamine as a hole sacrificial reagent. As shown in Fig. 7a, there is no hydrogen generation over the Co3O4 nanoparticles and only a small amount of H2 evolution over SPI under solar light irradiation. Surprisingly, the photocatalytic hydrogen production activity of 0.5CO/SPI was significantly improved by in situ crystal growth of 0.5 wt% Co3O4 nanoparticles, reaching 1146 μmol g−1, which was 13 times higher than that of SPI. The corresponding H2 production rates of the samples are also displayed in Fig. 7b. It shows the 0.5CO/SPI sample exhibits a dramatic improvement in H2 evolution compared to pure SPI and Co3O4. The corresponding H2 generation average rates are 127.2 μmol h−1 g−1, 9.5 μmol h−1 g−1, and 1.2 μmol h−1 g−1 for the 0.5CO/SPI composite SPI, and Co3O4 samples, respectively. The 0.5CO/SPI composite sample displayed the highest activity with an average production rate of 127.2 μmol h−1 g−1, which is nearly 13 times and 106 times higher than that of SPI and Co3O4. In addition, the composite of Co3O4@g-C3N4/CNFs exhibited a hydrogen production rate of 67.17 μmol g−1 h−1 in previous relevant literature.46 Thus the hydrogen production activity of the 0.5CO/SPI composite sample was nearly twice as high as that reported in the literature, indicating that the materials in this study showed a dramatic improvement in hydrogen production performance. These dramatic improvements may be attributed to the dense contact interface and efficient separation of photogenerated electron–hole pairs between Co3O4 nanoparticles and SPI ultrathin nanosheets.
1 by volume) mixture were tested by using triethanolamine as a hole sacrificial reagent. As shown in Fig. 7a, there is no hydrogen generation over the Co3O4 nanoparticles and only a small amount of H2 evolution over SPI under solar light irradiation. Surprisingly, the photocatalytic hydrogen production activity of 0.5CO/SPI was significantly improved by in situ crystal growth of 0.5 wt% Co3O4 nanoparticles, reaching 1146 μmol g−1, which was 13 times higher than that of SPI. The corresponding H2 production rates of the samples are also displayed in Fig. 7b. It shows the 0.5CO/SPI sample exhibits a dramatic improvement in H2 evolution compared to pure SPI and Co3O4. The corresponding H2 generation average rates are 127.2 μmol h−1 g−1, 9.5 μmol h−1 g−1, and 1.2 μmol h−1 g−1 for the 0.5CO/SPI composite SPI, and Co3O4 samples, respectively. The 0.5CO/SPI composite sample displayed the highest activity with an average production rate of 127.2 μmol h−1 g−1, which is nearly 13 times and 106 times higher than that of SPI and Co3O4. In addition, the composite of Co3O4@g-C3N4/CNFs exhibited a hydrogen production rate of 67.17 μmol g−1 h−1 in previous relevant literature.46 Thus the hydrogen production activity of the 0.5CO/SPI composite sample was nearly twice as high as that reported in the literature, indicating that the materials in this study showed a dramatic improvement in hydrogen production performance. These dramatic improvements may be attributed to the dense contact interface and efficient separation of photogenerated electron–hole pairs between Co3O4 nanoparticles and SPI ultrathin nanosheets.
To further verify that the addition of Co3O4 nanoparticles can effectively improve the photocatalytic activity of pure SPI, we conducted photocatalytic degradation activity experiments on different proportions of CO/SPI composites. Due to the strong stability caused by the complex chemical structure of methyl orange (MO), MO was used as the degradation target organic pollutant in the photocatalytic activity testing experiments. From Fig. 8a, it is not difficult to find that MO was hardly decomposed by the 3.0CO/SPI composite in the dark. Similarly, the photolysis activity of MO was also very weak in the absence of a photocatalyst under full arc light irradiation even for 7 h owing to the stable structure of MO. The photocatalytic degradation activities of a series of samples were obtained only in the presence of a photocatalyst and light irradiation. These results are sufficient to prove that the degradation of MO by the prepared samples is indeed solar light-driven. Remarkably, after Co3O4 nanoparticles were anchored on the SPI, the photocatalytic degradation MO activities of all the CO/SPI composites were significantly improved relative to the base material SPI. This phenomenon indicated that the loaded Co3O4 on SPI not only enhanced the absorption for visible light of SPI but also improved the carrier transfer of SPI. Moreover, with the increase of Co3O4 content, the photocatalytic activities of the composites gradually enhanced, reaching the highest for the 3.0CO/SPI sample. If the content of Co3O4 nanoparticles was further increased, the activities of the composites showed a downward trend. This may be due to the shading effect of excessive black Co3O4 nanoparticles on the surface of SPI, which weakens the absorption of light by the subject material SPI itself, resulting in a decrease in photocatalytic activity. In addition, the photocatalytic degradation efficiencies of MO for SPI and CO/SPI composites samples can also be seen from Fig. 8b. The 3.0CO/SPI sample indeed exhibits the highest photocatalytic degradation efficiency of MO of 98.6%, which is about 300% higher than that of pure SPI. A series of CO/SPI composites showed better photocatalytic activity for MO degradation than SPI, and the 3.0CO/SPI composite sample displayed the highest activity. In particular, the 3.0CO/SPI composite sample exhibited excellent degradation efficiency compared to that reported in the literature.47 However, there was no significant difference in MO degradation activity between 3.0CO/SPI, 4.0CO/SPI, and 5.0CO/SPI. This phenomenon may be caused by the fact that the photocatalytic MO degradation activity of 1.0CO/SPI composite has reached the highest level, and the addition of too much Co3O4 is not conducive to the improvement of the activity, and there is little difference in the contents of cobalt oxide in the 3.0CO/SPI, 4.0CO/SPI, and 5.0CO/SPI samples.
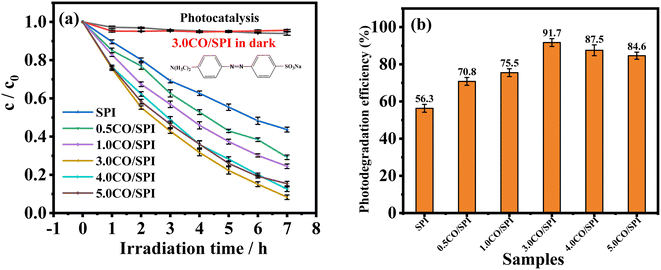 | ||
| Fig. 8 (a) Comparison of the photocatalytic degradation of MO over different catalysts under full arc light (λ > 300 nm); (b) photocatalytic degradation rate of SPI and CO/SPI composites. | ||
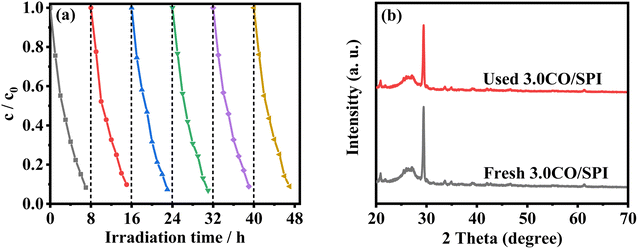
To evaluate the photocatalytic stability of the catalysts, six cycle experiments were carried out, each cycle for 8 hours. As illustrated in Fig. 9a, the photocatalytic degradation MO activity of the 3.0CO/SPI sample hardly weakened after 48 h of simulated sunlight irradiation. Moreover, it can be clearly observed from Fig. 9b that the XRD characteristic diffraction peak positions of the 3.0CO/SPI composite photocatalyst after the photocatalytic cycling reaction do not have any changes compared with those before the reaction. These results fully confirmed the excellent photocatalytic cycling stability of the CO/SPI composite, which may be attributed to the strong interfacial interaction between Co3O4 nanoparticle and SPI nanosheet.
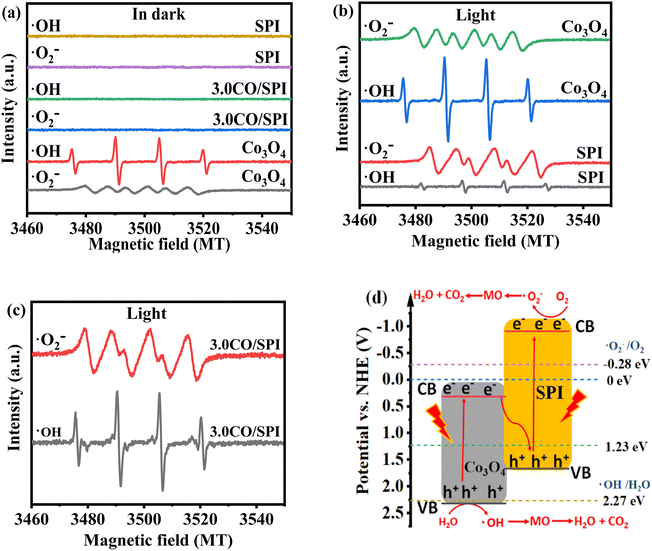
The exploration of the photocatalytic mechanism is crucial for the research and development of new photocatalytic materials. As we know, photogenerated holes (h+) can oxidize water (H2O) to generate hydroxyl radicals (˙OH), while photogenerated electrons (e−) can reduce oxygen (O2) to generate superoxide radicals (˙O2−).48 Moreover, both ˙OH and ˙O2− have strong oxidizing ability, which are the main active species for photocatalytic degradation of organic pollutants. To investigate the transport and separation mechanism of photogenerated carriers in the CO/SPI composite material system, ESR spin-trapping tests were performed on Co3O4, SPI and 3.0CO/SPI samples. Using 5,5-dimethyl1-pyrroline N-oxide (DMPO) as a spin trap, ESR spectra of the prepared samples were obtained in methanol solution (for DMPO–˙O2−) and aqueous solution (for DMPO–˙OH),49 respectively. As displayed in Fig. 10a, no signals of DMPO–˙OH and DMPO–˙O2− were detected from SPI, and 3.0CO/SPI hybrid samples in dark. Meanwhile, for cobalt oxide, the signals of a very weak ˙O2− and a strong ˙OH can be observed in the absence of light, which may be related to the strong oxidation ability caused by the low valence band (VB) position (2.32 eV) of cobalt oxide. However, it can be clearly seen from Fig. 10b that the strong signals of DMPO–˙OH and DMPO–˙O2− were detected from Co3O4 and SPI under light irradiation, respectively. At the same time, only the very weak signals of ˙O2− and ˙OH were collected in the Co3O4 and SPI samples under the same condition, respectively. These are attributed to the strong reducing and oxidizing powers resulted by the higher conduction band (CB) position (−0.91 eV) of SPI and the lower valence band (VB) position (2.32 eV) of Co3O4, respectively. More interestingly, very strong signals of DMPO–˙OH and DMPO–˙O2− were detected simultaneously in the 3.0CO/SPI composite sample as shown in Fig. 10c, which may be mainly attributed to the Z-type heterojunction structure formed between Co3O4 and SPI based on the strong interaction. If a traditional type-II heterojunction50 was formed between Co3O4 and SPI (in Fig. S6†), the photogenerated electrons were transferred from the CB of SPI to the CB of Co3O4, and the photogenerated holes of SPI were transferred from the VB of Co3O4 to the VB of SPI. In this way, since the lower CB position of Co3O4 and the higher VB position of SPI determine the weak reduction ability of the photogenerated electron and oxidation ability of the photogenerated hole, thus the strong signals of DMPO–˙OH and DMPO–˙O2− cannot be detected in the 3.0CO/SPI composite sample. Therefore, there should be a direct Z-scheme route of the photogenerated carriers transferring in the intimate contact interface between Co3O4 and SPI.51 As shown in Fig. 10d, both Co3O4 and SPI were excited to yield photogenerated electron (e−)/hole (h+) pairs under solar light irradiation. Then the photogenerated e− on the CB of Co3O4 easily recombine with the photogenerated h+ in the VB of SPI, leading to a large number of more active photoexcited e− and h+ remaining in the CB of SPI and VB of Co3O4, respectively. The h+ remaining in the VB of Co3O4 can react with H2O to yield ˙OH. while the left behind e− in the CB of SPI can easily be captured by O2 to form ˙O2−. And MO is easily oxidized to form small inorganic molecules, such as CO2, H2O, and so on.52,53 This possible photocatalytic mechanism of the CO/SPI composite can also be described as follows (steps 1–5). Thus, the efficient photocatalytic degradation of MO by direct Z-type nanoheterostructured CO/SPI composite photocatalysts proceeds smoothly under the driving of solar light.
| Co3O4 + hv → e− + h+ | (1) |
| SPI + hv → e− + h+ | (2) |
| h+ (Co3O4) + OH− → ˙OH | (3) |
| e− (SPI) + O2 → ˙O2− | (4) |
| ˙O2−/˙OH/h+ + MO → degradation intermediates → CO2 + H2O | (5) |
4. Conclusions
In summary, we have demonstrated a facile green thermal treatment method for fabrication of CO/SPI composite powder photocatalysts. The Co3O4 nanoparticles were firmly embedded on SPI ultrathin nanosheets to construct a direct Z-type CO/SPI nanostructure photocatalysts. Thus, the light absorption and the separation of photogenerated electron–hole pairs for CO/SPI composite were greatly improved. And it significantly facilitated enhancement of the activity and cycle stability of photocatalytic water splitting for hydrogen production and organic pollutant degradation under solar light irradiation.Conflicts of interest
There are no conflicts to declare.Acknowledgements
This work was supported by the National Natural Science Foundation of China [grant number 21862017] and the Applied Basic Research Plan of Qinghai Province [grant number 2020-ZJ-722 and 2021-ZJ-722]. We thank the Analysis Center of Qinghai University and the Modern Analysis Center of Nanjing University for samples characterization.Notes and references
- C. Li, T. Lin, Y. Chen, Y. Yan and Z. Xu, J. Cleaner Prod., 2022, 368, 133183 CrossRef.
- Z. Zeng, Y. Chen, X. Zhu and L. Yu, Chin. Chem. Lett., 2023, 34(2), 107728 CrossRef.
- S. Chu and A. Majumdar, Nature, 2012, 488, 294–303 CrossRef PubMed.
- L. Xue, M. li, L. Liu, Y. Hu, B. Cui and Y. Du, J. Alloys Compd., 2022, 919(25), 165848 CrossRef.
- G. Wei, F. Niu, Z. Wang, X. Liu, S. Feng, K. Hu, X. Gong and J. Hua, Mater. Today Chem., 2022, 26, 101075 CrossRef.
- K. Mannepalli, K. Vinoth, S. K. Mohapatra, R. Rahul, D. P. Gangodkar, A. Madduri, M. Ravichandran, R. Sathyamurthy and V. Mohanavel, Energy Rep., 2022, 8, 836–846 CrossRef.
- Ch. M. S. Kumar, S. Singh, M. K. Gupta, Y. M. Nimdeo, R. Raushan, A. v. Deorankar, T. M. A. Kumar, P. K. Rout, C. S. Chanotiya, V. D. Pakhale and A. D. Nannaware, Sustain. Energy Technol. Assess., 2023, 55, 102905 Search PubMed.
- X. Wang, K. Maeda, A. Thomas, K. Takanabe, G. Xin, J. M. Carlsson, K. Domen and M. Antonietti, Nat. Mater., 2009, 8, 76–80 CrossRef CAS.
- Z. Zhou, Y. Zhang, Y. Shen, S. Liu and Y. Zhang, Chem. Soc. Rev., 2018, 47, 2298–2321 RSC.
- Y. Wang, A. Vogel, M. Sachs, R. S. Sprick, L. Wilbraham, S. J. A. Moniz, R. Godin, M. A. Zwijnenburg, J. R. Durrant, A. I. Cooper and J. Tang, Nat. Energy, 2019, 4, 746–760 CrossRef CAS.
- C. Dai and B. Liu, Energy Environ. Sci., 2020, 13, 24 RSC.
- H. Yu, Y. Hong, X. Zeng, J. Wei, F. Wang and M. Liu, Mater. Today Sustain., 2022, 100267 Search PubMed.
- S. Chu, Y. Wang, Y. Guo, P. Zhou, H. Yu, L. Luo, F. Kong and Z. Zou, J. Mater. Chem., 2012, 22, 15519–15521 RSC.
- S. Chu, Y. Wang, Y. Guo, J. Feng, C. Wang, W. Luo, X. Fan and Z. Zou, ACS Catal., 2013, 3, 912–919 CrossRef CAS.
- S. Chu, C. Wang, Y. Yang, Y. Wang and Z. Zou, RSC Adv., 2014, 4, 57153–57158 RSC.
- J. Yang, S. Chu, Y. Guo, L. Luo, F. Kong, Y. Wang and Z. Zou, Chem. Commun., 2012, 48, 3533–3535 RSC.
- C. Wang, Y. Guo, Y. Yang, S. Chu, C. Zhou, Y. Wang and Z. Zou, ACS Appl. Mater. Interfaces, 2014, 6, 4321–4328 CrossRef CAS PubMed.
- C. Ma, J. Zhou, H. Zhu, W. Yang, J. Liu, Y. Wang and Z. Zou, ACS Appl. Mater. Interfaces, 2015, 7, 14636–14637 Search PubMed.
- J. Y. Li, X. Jiang, L. Lin, J. J. Zhou, G. S. Xu and Y. P. Yuan, J. Mol. Catal. A: Chem., 2015, 406, 46–50 CrossRef.
- C. Ma, J. Zhou, Z. Cui, Y. Wang and Z. Zou, Sol. Energy Mater. Sol. Cells, 2016, 150, 102–111 CrossRef.
- C. Ma, H. Zhu, J. Zhou, Z. Cui, T. Liu, Y. Wang, Y. Wang and Z. Zou, Dalton Trans., 2017, 46, 3877–3886 RSC.
- J. Zhou, Y. Lei, C. Ma, W. Lv, N. Li, Y. Wang, H. Xu and Z. Zou, Chem. Commun., 2017, 53, 10536–10539 RSC.
- C. Zhao, C. Xiong, X. Liu, M. Qiao, Z. Li, T. Yuan, J. Wang, Y. Qu, X. Q. Wang, F. Zhou, Q. Xu, S. Wang, M. Chen, W. Wang, Y. Li, T. Yao, Y. Wu and Y. Li, Chem. Commun., 2019, 55, 2285–2288 RSC.
- S. Yang, Y. Gong, J. Zhang, L. Zhan, L. Ma, Z. Fang, R. Vajtai, X. Wang and P. M. Ajayan, Adv. Mater., 2013, 25, 2452–2456 CrossRef CAS PubMed.
- Y. Sang, Z. Zhao, M. Zhao, P. Hao, Y. Leng and H. Liu, Adv. Mater., 2015, 27, 363–369 CrossRef CAS PubMed.
- H. Li, W. Tu, Y. Zhou and Z. Zou, Adv. Sci., 2016, 3, 1500389 CrossRef PubMed.
- M. Zhang, M. Lu, Z. L. Lang, J. Liu, M. Liu, J. N. Chang, L. Y. Li, L. J. Shang, M. Wang, S. L. Li and Y. Q. Lan, Angew. Chem., Int. Ed., 2020, 59, 6500–6506 CrossRef CAS.
- B. Wang, J. Zhao, H. Chen, Y. X. Weng, H. Tang, Z. Chen, W. Zhu, Y. She, J. Xia and H. Li, Appl. Catal., B, 2021, 293, 120182 CrossRef CAS.
- J. Gao, B. Jiang, C. Ni, Y. Qi and X. Bi, Chem. Eng. J., 2019, 382, 123034 CrossRef.
- I. Rabani, R. Zafar, K. Subalakshmi, H. S. Kim, C. Bathula and Y. S. Seo, J. Hazard. Mater., 2021, 407(5), 124360 CrossRef CAS PubMed.
- C. Jin, M. Wang, Z. Li, J. Kang, Y. Zhao, J. Han and Z. Wu, Chem. Eng. J., 2020, 398, 125569 CrossRef CAS.
- C. Han, L. Ge, C. Chen, Y. Li, X. Xiao, Y. Zhang and L. Guo, Appl. Catal., B, 2014, 147, 546–553 CrossRef CAS.
- J. Yang, M. Wang, S. Zhao, Y. Liu, W. Zhang, B. Wu and Q. Liu, Int. J. Hydrogen Energy, 2019, 44, 870–879 CrossRef CAS.
- J. Zhang, M. Grzelczak, Y. Hou, K. Maeda, K. Domen, X. Fu, M. Antonietti and X. Wang, Chem. Sci., 2012, 3, 443–446 RSC.
- J. Gao, B. Jiang, C. Ni, Y. Qi and X. Bi, Chem. Eng. J., 2020, 382, 123034 CrossRef CAS.
- Y. Wang, J. Huang, J. Cao, G. Li and Z. Zhang, Surf. Rev. Lett., 2017, 24, 1750057 CrossRef.
- Y. Hu, X. Hao, Z. Cui, J. Zhou, S. Chu, Y. Wang and Z. Zou, Appl. Catal., B, 2020, 260, 118131 CrossRef CAS.
- W. Xiang, Q. Ji, C. Xu, Y. Guo, Y. Liu, D. Sun, W. Zhou, Z. Xu, C. Qi, S. Yang, S. Li, C. Sun and H. He, Appl. Catal., B, 2021, 285, 119847 CrossRef CAS.
- C. Li, Y. Du, D. Wang, S. Yin, W. Tu, Z. Chen, M. Kraft, G. Chen and R. Xu, Adv. Funct. Mater., 2017, 27, 1604328 CrossRef.
- X. Zhu, H. Ji, J. Yi, J. Yang, X. She, P. Ding, L. Li, J. Deng, J. Qian, H. Xu and H. Li, Ind. Eng. Chem. Res., 2018, 57, 17394–17400 CrossRef.
- L. Yang, J. Liu, L. Yang, M. Zhang, H. Zhu, F. Wang and J. Yin, Renewable Energy, 2020, 145, 691–698 CrossRef.
- P. Suyana, P. Ganguly, B. N. Nair, A. P. Mohamed, K. G. K. Warrier and U. S. Hareesh, Environ. Sci.: Nano, 2017, 4, 212–221 RSC.
- X. Du, T. Ling, M. Wu and X. Du, Semicond. Sci. Technol., 2012, 27, 055017 CrossRef.
- Z. A. Lan, G. Zhang and X. Wang, Appl. Catal., B, 2016, 192, 116–125 CrossRef.
- F. Fabregat-Santiago, J. Bisquert, G. Garcia-Belmonte, G. Boschloo and A. Hagfeldt, Sol. Energy Mater. Sol. Cells, 2005, 87, 117–131 CrossRef.
- R. He, H. Liang, C. Li and J. Bai, Colloids Surf., A, 2020, 586, 124200 CrossRef.
- L. Chen, M. Zhang, J. Wu, X. Zheng, S. Liao, B. Ou and L. Tian, J. Alloys Compd., 2022, 927, 167047 CrossRef.
- X. Zhou, B. Jin, R. Chen, F. Peng and Y. Fang, Mater. Res. Bull., 2013, 48, 1447–1452 CrossRef.
- S. Ge and L. Zhang, Environ. Sci. Technol., 2011, 45, 3027–3033 CrossRef PubMed.
- H. Wang, X. Li, X. Zhao, C. Li, X. Song, P. Zhang and P. Huo, Chin. J. Catal., 2022, 43, 178–214 CrossRef.
- R. Shen, L. Zhang, X. Chen, M. Jaroniec, N. Li and X. Li, Appl. Catal., B, 2020, 266, 118619 CrossRef.
- C. Bie, H. Yu, B. Cheng, W. Ho, J. Fan and J. Yu, Adv. Mater., 2021, 33, 2003521 CrossRef PubMed.
- S. Li, C. Wang, M. Cai, F. Yang, Y. Liu, J. Chen, P. Zhang, X. Li and X. Chen, Chem. Eng. J., 2022, 428, 131158 CrossRef.
Footnote |
| † Electronic supplementary information (ESI) available. See DOI: https://doi.org/10.1039/d2ra06823k |
| This journal is © The Royal Society of Chemistry 2023 |

