DOI:
10.1039/D2RA06513D
(Paper)
RSC Adv., 2023,
13, 1-13
Amine-functionalized MOF-derived carbon materials for efficient removal of Congo red dye from aqueous solutions: simulation and adsorption studies
Received
15th October 2022
, Accepted 10th December 2022
First published on 19th December 2022
Abstract
In this study, a novel polyethyleneimine (PEI) modified MOF-derived carbon adsorbent (PEI@MDC) was proposed, which exhibited significant adsorption capacity for Congo Red (CR) in aqueous solutions. FT-IR and XPS results showed that PEI was successfully grafted onto MDC, increasing the content of amine groups on the surface of MDC. The adsorption process conformed to the Langmuir isotherm adsorption model and pseudo-second-order kinetic equation, indicating that the adsorption of CR on PEI@MDC was covered by a single layer, and the adsorption process was controlled by chemical processes. According to the Langmuir model, the maximum adsorption capacity at 30 °C was 1723.86 mg g−1. Hydrogen bonding and electrostatic interactions between CR and PEI@MDC surface functional groups were the main mechanisms controlling the adsorption process. After five adsorption–desorption cycles, PEI@MDC still showed a high adsorption capacity for CR, indicating that the adsorbent had an excellent regeneration ability.
1. Introduction
With the rapid development of industry, wastewater pollution has become a worldwide environmental problem. Dyes released from textile and paper mills are the most common pollutants in wastewater, and their release and accumulation may have teratogenic, carcinogenic and mutagenic effects on humans and aquatic organisms.1,2 Congo Red (CR) is a prevalent anionic synthetic dye that can pose serious threats to aquatic ecosystems and human health even at low concentrations, such as inhibition of plant growth, carcinogenicity, and kidney disease. CR is difficult to degrade under natural conditions due to its complex and stable aromatic molecular structure. Consequently, there is an urgent need to remove CR from aqueous solutions.
For this purpose, various technologies such as electroflocculation, membrane filtration, ultrafiltration, photodegradation and adsorption were adopted.3–8 Among them, adsorption is considered to have great potential for industrial applications, thanks mainly to its numerous advantages such as economic viability, high efficiency, ease of operation and low secondary pollution. Carbon materials such as activated carbon, biochar and carbon nanotubes are often used in water treatment, but lack reproducibility and designability results in poor adsorption capacity.9
Recently, MOF-derived carbons (MDCs), a class of derived carbon materials obtained through the pyrolysis of metal–organic frameworks (MOFs), have attracted a great deal of attention from researchers.10,11 Most MOFs are less stable and tend to self-decompose in the aqueous phase, limiting their use in the removal of environmental pollutants. Unlike MOFs, MDCs have good thermal/chemical stability, variable surface chemistry and ease of surface modification, making them superior for the adsorption of a wide range of pollutants in water.10–12 However, due to the limited active functional groups on pure MDC, its adsorption performance needs to be further improved. In order to improve the adsorption capacity of carbon-based adsorbents, it is important to introduce sufficient functional groups on the surface of the carbon material for the target material.13 Many studies have shown that the construction of adsorbents rich in amine functional groups will provide important assistance in the removal of organic dyes.14,15
Polyethylenimine (PEI) is a hydrophilic polymer with high cationic charge density and abundant active amine groups (–NH2,–NH–, N–) on the main and branch chains, which can adsorb anionic dyes through electrostatic interaction or hydrogen bond.16,17 As PEI is water-soluble, this greatly limits its practical application as an adsorbent, so it is often modified on the surface of the material to prepare PEI-containing composite adsorbents. For example, PEI-modified magnetic chitosan (Fe3O4/CS-PEI) adsorbents have been used for CR removal.18 PEI was also used to prepare modified MOFs composites (PEI@NH2-MIL-101) which showed excellent dye removal performance for Methyl Orange (MO, 89.4%) and Direct Red 80 (DR80, 99.8%).19
The aim of this study was to develop a polyethyleneimine-modified MOF-derived carbon adsorbent (PEI@MDC). It was thought to combine the excellent physicochemical properties of MDC with the special dual properties of the abundant amine functional groups from PEI, promising efficient removal of the anionic dye Congo Red (CR). To our knowledge, there are few reports of PEI-modified MDC adsorbents for dye adsorption. Various characterisation techniques were used to characterize the characterization of the structure and physicochemical properties of PEI@MDC. In addition, the influencing factors such as solution pH, initial concentration and temperature, and coexisting ions were investigated through batch adsorption experiments, and the adsorption isotherms, kinetics and thermodynamics of the adsorption process were studied, and the adsorption mechanism was proposed. Finally, the recovery performance of the adsorbent was determined by regeneration experiments of the adsorbent.
2. Materials and experimental methods
2.1. Materials
Aluminium nitrate nonahydrate (Al (NO3)3·9H2O, >99.0%) and 1,2,4,5-benzenetetracarboxylic acid (H4BTEC, >99.0%) and polyethyleneimine (PEI, MW: 600 Da, 99%) were purchased from Macklin's Biochemical Technology Lt, (China). Congo Red (CR) was purchased from Sinopharm Chemical Reagent Co, (China). NaOH (AR, ≥96.0%), HCl (AR, 36–38%), and ethanol (AR, ≥99.7%) were purchased from Cologne Chemicals Ltd, (China).
2.2. Synthesis of MOF (MIL-121) precursors
MIL-121 powder was synthesized by hydrothermal method.20 Specifically, 4.8 g (12.8 mmol) of Al (NO3)3·9H2O and 1.6 g (6.4 mmol) of H4BTEC were dispersed in deionised water (20 mL) and stirred continuously at room temperature for 2 hours. The mixture was transferred to a 100 mL Teflon-lined autoclave, sealed and stored in a vacuum oven at 180 °C for 48 hours. The resulting precipitate was separated by centrifugation and washed 3 times with deionised water and ethanol to remove residues. Finally, the precipitate was dried at 80 °C for 10 hours.
2.3. Preparation of MDC
MOF-derived carbon (MDC) materials were prepared by direct pyrolysis of MIL-121 precursors. The 1 g MIL-121 samples were placed in a quartz boat and carbonized in a tube furnace at 500 °C under a stream of nitrogen at a heating rate of 5 °C min−1 for 5 hours.
2.4. Synthesis of PEI@MDC
PEI@MDC was synthesized by the wet-impregnated method.21 Specifically, 0.15 g of PEI samples were dissolved in 5 mL of anhydrous methanol and stirred for 1 h, then 0.5 g of MDC samples were added to the methanol solution containing PEI, and the stirring was continued for 12 hours. The resulting samples were washed several times with methanol to remove residuals. Finally, the powders were dried in a vacuum oven at 60 °C overnight and kept in a desiccator until use.
2.5. Characterisation of materials
The morphology of the samples was characterized by a scanning electron microscope (Gemini 300, Germany). XRD profiles of the samples were measured using an X-ray powder diffractometer (Rigaku D/MAX 2500 V, Japan) with Cu Kα radiation by a step-scanning method in the range of 2θ = 5–80°. The weight change of the hydrothermal product was measured as a function of calcination temperature over a temperature range of approximately 30–800 °C using a thermogravimetric (TG) analyzer (TGA400, PerkinElmer, USA). The surface area and porosity of the materials were determined by nitrogen adsorption/desorption and BET method using ASAP 2020 Surface area and porosity analyzer (Micromeritics, USA) at 77.3 K. Before the adsorption experiment, samples were degassed at 120 °C under vacuum for 12 h, the Brunauer–Emmett–Teller (BET) method was used to calculate the specific surface area and Barrett–Joyner–Halenda (BJH) model was used to generate the pore size distribution curves. The surface functional groups of the materials were identified by Fourier transform infrared spectroscopy (FTIR, IRTracer-100, Shimadzu, Japan) in the wavelength range of 400–4000 cm−1. X-ray photoelectron spectroscopy (XPS, ThermoFisher KAlpha, USA) was used to analyze the composition and chemical state of the prepared samples. The charge distribution on the material surface was measured using a zeta potentiometer (Zetasizer, NANO ZS90, UK).
2.6. Dye adsorption experiments
Batch adsorption experiments were performed in Erlenmeyer flasks containing 50 mL of CR solution. The sealed Erlenmeyer flask was then placed in a thermostatic shaker with a preset temperature and oscillated at a constant speed of 150 rpm for adsorption experiments. The influence of the main factors on CR removal during the adsorption process were investigated, including grafting amount of PEI (0–0.25 g), dosage of adsorbent (0.1–0.5 g L−1), initial CR concentration (600, 700 and 800 mg L−1), contact time (0–360 min), pH value (4–12) and temperature (20–60 °C). The pH value of the solution was adjusted by using 0.1 mol L−1 HCl or 0.1 mol L−1 NaOH. In the experiment on the influence of coexisting ions, 0.5 mL of 0.1 M salt solution (NaOH, NaCl, Na2SO4, Na2CO3) was added to CR solution with the initial concentration of 700 mg L−1, respectively, to study the effect of coexisting ions on the removal efficiency of CR. The CR solution before and after adsorption were filtered through a 0.45 μm membrane filter, and the absorbance was measured at 498 nm using a UV-vis spectrophotometer (UV-2550, Shimadzu, Japan).
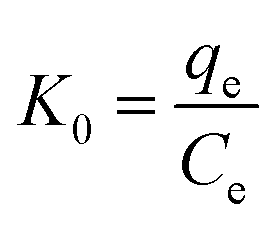
The equilibrium adsorption capacity is calculated as follows:
| |
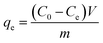 | (1) |
The adsorption removal rate is calculated as follows:
| |
 | (2) |
where
qe (mg g
−1) is the adsorption capacity at equilibrium,
C0 (mg L
−1) is the initial concentration of CR,
Ce (mg L
−1) is the adsorbate concentration of CR at equilibrium,
V (L) is the solution volume and
m (g) is the adsorbent mass. All batches of experiments were conducted in triplicate and the results were averaged.
2.7. Regeneration experiments
Excellent adsorbent materials should have superior reusability. 20 mg of PEI@MDC samples were separately dispersed in 50 mL CR dye solution with an initial concentration of 700 mg L−1 for regeneration experiments. After each cyclic adsorption experiment, the PEI@MDC samples were collected by centrifugal separation. 0.1 mol L−1 NaOH was selected as the desorption solution. The adsorbed saturated PEI@MDC samples were immersed in 50 mL desorbing solution, stirred for 12 hours, then PEI@MDC samples were separated and washed several times with ethanol. Finally, the collected PEI@MDC samples were dried at 80 °C for 12 hours. The removal rate of CR was measured in each cycle.
3. Results and discussion
3.1. Morphology and structure analysis of PEI@MDC
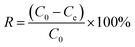
The morphologies of MIL-121, MDC and PEI@MDC were shown in the SEM micrographs in Fig. 1. In Fig. 1(a), the pristine MIL-121 had a regular rod-like morphology with a dense structure without any visible pores, which was consistent with reports in previous studies.22 As shown in Fig. 1(b), the MDC formed after elevated-temperature carbonization of MIL-121 had numerous cracks and pores. From Fig. 1(c), it could be seen that after PEI modification, the morphology regularity and integrity of PEI@MDC decreased slightly, the surface roughness increased, and the pores became less visible. This was because PEI filled the pore structure of the original MDC. In addition, the corresponding EDX mapped images of the prepared PEI@MDC adsorbent showed the presence of O, Al, C and N elements (Fig. 1(d–g)).
 |
| | Fig. 1 (a) SEM images of pristine MIL-121; (b) MDC; (c) PEI@MDC; (d–g) EDX mapping images (O, Al, C, N) of PEI@MDC. | |
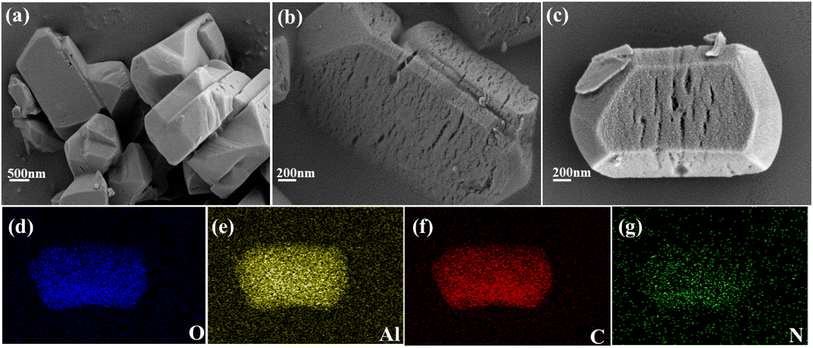
Fig. 2(a) displayed the XRD patterns of pristine MIL-121, MDC, and PEI@MDC. The diffraction peaks of MIL-121 were in good agreement with those reported in related reports, indicating that MIL-121 was successfully prepared.22 In MDC and PEI@MDC, broad and strong diffraction peaks at 2θ = 25° and 43° correspond to the (002) and (100) crystal planes, respectively, indicating the formation of graphitic carbon structures.23,24 The XRD pattern of PEI@MDC was similar to unmodified MDC and no other crystal diffraction peaks appeared. It was speculated that PEI only modulates the structural properties of the MDC surface and didn't produce crystalline species. However, the diffraction peak intensity of PEI@MDC was slightly reduced, which was attributed to the PEI species filling the surface and pores of MDC.17
 |
| | Fig. 2 (a) XRD patterns of MIL-121, MDC and PEI@MDC; (b) TGA curves of MDC and PEI@MDC; (c) nitrogen adsorption–desorption isotherms; (d) pore distribution. | |
Three main stages of weightlessness could be observed in the TGA curves of MDC and PEI@MDC in Fig. 2(b). The first stage of weight loss below 100 °C could be attributed to the evaporation of saturated water.25,26 The rapid drop of PEI@MDC in the second stage (100–450 °C) indicated the thermal decomposition of PEI groups with a loss of 34.83 wt%.27 Moreover, in the same temperature range, the MDC had only 8.63 wt% weight loss due to the decomposition of the organic matter. The third stage was from 450 °C to 800 °C, which is related to the further decomposition of organics mainly on MDC and PEI@MDC. Notably, the residue yields of MDC and PEI@MDC were 55.86 wt% and 46.40 wt%, respectively. Therefore, the mass of PEI in PEI@MDC was estimated to be about 9.46 wt%. Overall, PEI@MDC had excellent stability as an adsorbent.
Fig. 2(c and d) showed the adsorption–desorption isotherms and pore size distributions for MDC and PEI@MDC. As shown in Fig. 2(c), according to the IUPAC classification, the isotherms of both samples were type IV curves with H3 hysteresis loops according to the IUPAC classification, which signified the presence of mesopores in MDC and PEI@MDC.28 It could be observed in Fig. 2(d) that both MDC and PEI@MDC had hierarchical structures of micropores and mesopores. Among them, the pore diameter of PEI@MDC was mainly distributed in 30–180 Å (3–18 nm), which further confirmed the existence of mesoporous structure in PEI@MDC. As shown in Table 1, compared with MDC, the specific surface area, pore volume and average pore size of PEI@MDC were significantly reduced from 346.79 m2 g−1 to 254.16 m2 g−1, from 0.504 cm3 g−1 to 0.352 cm3 g−1, and from 61.8 Å (6.18 nm) to 50.2 Å (5.02 nm). From these data, it was evident that the modification of MDC with PEI results in partial deformation of the ordered nanopores structure of the MDC, resulting in a decrease in BET surface area, pore volume, and average pore diameter. The reduction of these parameters was attributed to PEI groups filling or covering the interior or surface of the MDC.29
Table 1 Textural properties of MDC and PEI@MDC
| Samples |
BET surface area (m2 g−1) |
Total pore volume (cm3 g−1) |
Pore diameter (Å) |
| MDC |
346.79 |
0.504 |
61.8 |
| PEI@MDC |
254.16 |
0.352 |
50.2 |
3.2. Functional group and potential analysis of PEI@MDC
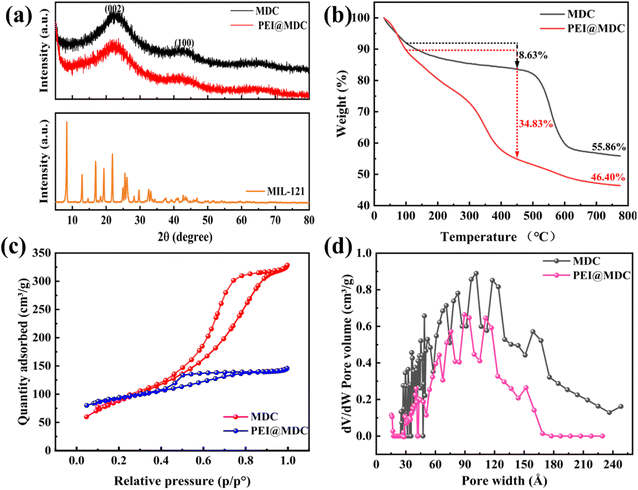
The FT-IR spectra of MDC and PEI@MDC were shown in Fig. 3(a). In the FT-IR spectrum of MDC, a broad band around at 3440 cm−1 belonged to O–H stretching vibration.30 The peaks at 1600, 1428 and 1000 cm−1 were caused by tensile vibrations of the carboxyl groups.30,31 These results suggested that the hydroxyl and carboxyl groups existed on the surface of MDC, which was important for the grafting of PEI. For PEI@MDC, however, the broadband at about 3440 cm−1 corresponds to the overlap of –OH and N–H.32 Compared with MDC, several fresh peaks appeared in PEI@MDC, indicating that PEI was successfully grafted onto MDC. The peaks at 2927 cm−1 and 2853 cm−1 were attributed to asymmetric and symmetric stretching vibrations of the C–H bonds in the PEI molecules.33 The peaks at 1575 cm−1 and 1458 cm−1 were due to bending vibrations of N–H bonds in PEI.34 Meanwhile, the peaks at 1350 and 1100 cm−1 were attributed to the stretching vibrations of C–N bonds.35 Notably, in the FT-IR spectrum of PEI@MDC, the peaks at 1600, 1425 and 1000 cm−1 disappeared. However, the new band at 1658 cm−1 belonged to the C![[double bond, length as m-dash]](https://www.rsc.org/images/entities/char_e001.gif) O in the amide group (–CONH–), while the amide group could be produced by amidation between the –COOH group on MDC and the –NH group from PEI.36 The above results showed that PEI grafted to MDC was bonded by different chemical bonds: (1) the amine group of PEI formed hydrogen bonds with the hydroxyl group of MDC; (2) the amide bond between the primary amine of PEI and the carboxyl group of MDC.32
O in the amide group (–CONH–), while the amide group could be produced by amidation between the –COOH group on MDC and the –NH group from PEI.36 The above results showed that PEI grafted to MDC was bonded by different chemical bonds: (1) the amine group of PEI formed hydrogen bonds with the hydroxyl group of MDC; (2) the amide bond between the primary amine of PEI and the carboxyl group of MDC.32
 |
| | Fig. 3 (a) FT-IR; (b) XPS survey; (c) C 1s spectra; (d) zeta potential. | |
The compositions of the MDC and PEI@MDC were investigated using XPS, and the results were displayed in Fig. 3(b and c). The full-scale spectra (Fig. 3(b) and Table 2) indicated the presence of C, O, N and Al elements in MDC and PEI@MDC. Compared with MDC, the N 1s peak of PEI@MDC was substantially enhanced, demonstrating that the grafting of PEI was successful (Fig. 3(b)). The C 1s spectra of MDC and PEI@MDC were shown in Fig. 3(c). For unmodified MDC, the C 1s curve consists of three fitted peaks, including C–C/CC, C–O and CO, with binding energies of 283.9, 284.6, and 288.5 eV, respectively.37 While the C 1s peak of PEI@MDC could be deconvoluted into four main components, and the binding energy peaks were concentrated at 283.8, 284.8, 286.0 and 288.1 eV, corresponding to C–C/CC, C–N/CN, C–O and CO, respectively.38 It was obvious that a new C–N/CN fitting peak appeared after PEI modification, which was consistent with the FTIR results. Compared with MDC, chemical shifts of C–O and CO were observed in the spectra of PEI@MDC, which were caused by the binding of PEI and oxygen-containing functional groups.39 The elementals further revealed the N and O contents on MDC and PEI@MDC (Table 2). Obviously, after grafting PEI, the O content decreased to 16.70%, and the N content increased to 6.85%, indicating that the O-containing groups were partially substituted by N-containing functional groups. In addition, elemental analysis showed that the nitrogen content of PEI@MDC increased by 6.28%. The appearance of C–N/CN peaks and N 1s peaks again indicated that PEI was successfully grafted onto MDC.
Table 2 Elemental composition of MDC and PEI@MDC of samples analyzed by XPS
| Samples |
Elemental atomic concentration (wt%) |
| Al |
O |
C |
N |
| MDC |
9.10 |
28.04 |
62.29 |
0.57 |
| PEI@MDC |
2.14 |
16.70 |
74.31 |
6.85 |
The surface charges of adsorbents can effectively influence their interfacial interactions with adsorbates. Fig. 3(d) showed the surface zeta potential of MDC and PEI@MDC as a function of different pH values. The results showed that the point of zero charge (pHpzc) of the MDC was significantly altered after the PEI modification. The pHpzc of MDC was found to be 7.5, while the pHpzc of PEI@MDC was approximately 11.6, indicating that the PEI functionalisation process shifts the surface charge of the original MDC from negative to positive over the entire pH range of 7.5–11.6. This was because the amine group (–NH or –NH2) of PEI easily adsorbed cations (H+) and displayed a positive charge on the surface, resulting in a significant increase in the zeta potential of MDC.35 It was evident that PEI@MDC maintained a net positive charge over a wide pH range from 2 to 11.6 and reached a peak at pH = 6, while CR had a strong negative charge in solution, which favored the adsorption of CR by PEI@MDC via electrostatic interactions.40
3.3. Adsorption experiments
3.3.1. Effect of grafting amount of PEI on adsorption. To verify the effect of the grafting amount of PEI on the properties of the material, while keeping other conditions unchanged, the amount of PEI (0 g, 0.05 g, 0.15 g, 0.25 g) was changed to obtain PEI@MDC with different grafting amounts. As shown in Fig. 4(a), PEI modification significantly improved the adsorption performance of MDC. The adsorption capacity of CR increased with the addition of PEI, and the maximum adsorption capacity was reached when the PEI content was 0.15 g. Compared with pure MDC, the adsorption capacity was increased by about 2.06 times. According to the previous analysis of zeta potential, the electrostatic attraction between negatively charged CR and positively charged PEI@MDC might play a role in the adsorption of CR. Therefore, the increased graft amount of PEI is conducive to the enhancement of the hydrogen bond and electrostatic interaction between CR and PEI@MDC, which may be the reason for the improved adsorption capacity of modified MDC. However, as the addition amount of PEI continued to increase to 0.25 g, the adsorption capacity of PEI@MDC decreased instead. This might be due to excessive accumulation of PEI, leading to a decrease in the effective adsorption sites (amines or imines) exposed by the adsorbent.41 Therefore, these two conflicting factors determined that the PEI addition of 0.15 g exhibited the highest adsorption capacity. Hence, the adsorbent (PEI@MDC) with a PEI grafting amount of 0.15 g was selected as the optimal adsorbent and used for subsequent experiments.
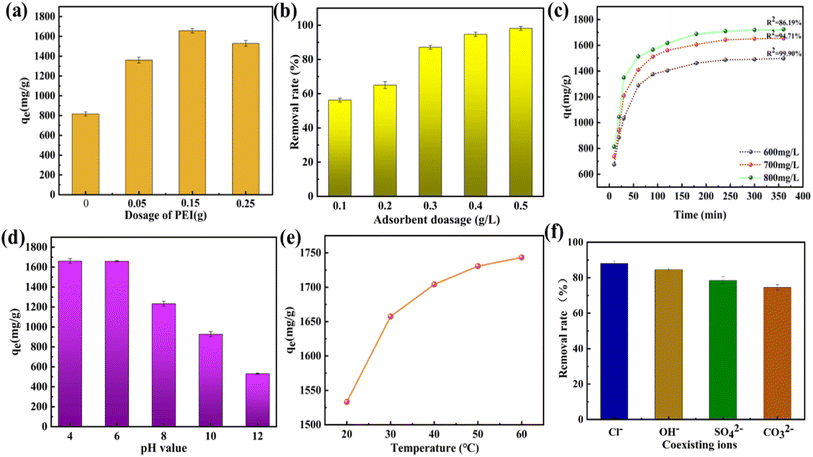 |
| | Fig. 4 Adsorption capacity of PEI@MDC for CR under various parameters: (a) dosage of PEI (adsorption conditions: m = 0.4 g L−1, pH = 6, C0 = 700 mg L−1, T = 30 °C and t = 360 min). (b) Adsorbent dosage (adsorption conditions: pH = 6, C0 = 700 mg L−1, T = 30 °C and t = 360 min). (c) Initial concentration and contact time (adsorption conditions: m = 0.4 g L−1, pH = 6, C0 = 600–800 mg L−1, T = 30 °C and t = 360 min). (d) Effect of pH (adsorption conditions: m = 0.4 g L−1, pH = 4–12, C0 = 700 mg L−1, T = 30 °C and t = 360 min). (e) Effect of temperature (adsorption conditions: m = 0.4g L−1, pH = 6, C0 = 700 mg L−1 and t = 360 min). (f) Effect of co-existing ions (adsorption conditions: m = 0.4g L−1, pH = 6, T = 30 °C and t = 360 min). | |
3.3.2. Effect of adsorbent dosage. Proper selection of the initial adsorbent dosage is critical because the available surface area and binding sites can affect the adsorption efficiency. The effect of PEI@MDC dosage (0.1–0.5 g L−1) on CR removal from aqueous solution was shown in Fig. 4(b). The results showed that the removal rate of CR increased from 56.24% to 94.71% with the increase of adsorbent dosage to 0.4g L−1. However, the removal rate of PEI@MDC did not increase significantly when the dosage of PEI@MDC exceeded 0.4 g L−1, because the excessive dosage of PEI@MDC would lead to the formation of excessive active sites. Moreover, most of the active sites were still vacant at high adsorbent dosage, which not only reduced their utilization, but also led to waste of resources. Considering the economic principle of practical application, we chose 0.4 g L−1 as the optimal dosage of PEI@MDC.
3.3.3. Effect of contact time and initial concentration. Fig. 4(c) showed the effect of contact time and initial CR concentration on CR adsorption. The results showed that the adsorption capacity of PEI@MDC for CR increased rapidly in the first 60 min, but the increase rate was slower as the adsorption process proceeded, which may be due to the fact that initial adsorption stage, all the vacancies on the adsorbent surface were available for the fast attachment of dye molecules. As the process continues, the number of vacancies decreases and there was repulsion between the molecules attached to the adsorbent and the adsorbate. Finally, the adsorption equilibrium stage was reached, when the adsorption and desorption rates were equal, and no significant increase in the amount of adsorption was observed. At different initial CR concentrations, all adsorption experiments reached equilibrium around 360 min, with adsorption capacities of 1498.53, 1657.50 and 1723.84 mg g−1, respectively. It could be seen that the removal percentage of CR (from 99.90% to 86.19%) decreased with increasing initial dye concentration. This was due to the fact that when the initial concentration of the dye is low, the adsorbent active sites were sufficient to adsorb a relatively small number of dye molecules. Conversely, when the initial concentration of dye was high, the fixed number of active sites on the adsorbent could not remove increased dye molecules. Therefore, the proportion of dye molecules remaining in the solution increased, resulting in a decrease in the dye removal rate.
3.3.4. Effect of pH. The pH of the initial solution has a crucial impact on the adsorption process by changing the surface charge state on the adsorbent and the degree of deprotonation/protonation of functional groups.42 The effect of pH value on the adsorption capacity of CR was shown in Fig. 4(d). As the pH increased from 4 to 12, the adsorption capacity of CR subsequently decreased from 1661.13 mg g−1 to 534.24 mg g−1 and the adsorption capacity at pH = 6 (1657.50 mg g−1 ) was close to that at pH = 4. This was due to the presence of high concentrations of H+ at lower pH values (pH = 4–6), which enhanced the electrostatic interaction between protonated amine groups (–NH3+ and –NH2+) and sulfonate groups (SO3−) on the surface of PEI@MDC, thereby enhancing the adsorption capacity of CR.43 With the increase of pH (pH = 6–12), the protonation ability of the amine group weakened and the electrostatic interaction decreased, resulting in a decrease in the adsorption capacity of PEI@MDC. Due to the negative charge on the surface of PEI@MDC (pHpzc > 11.6), the adsorption capacity of CR reached a minimum value at pH = 12. In addition, the presence of excess hydroxyl ions in solution would compete with CR dye molecules, which was also responsible for the reduced adsorption capacity. Since we considered that it was more economical to study adsorption behavior close to neutral pH, we chose pH = 6 as the optimal pH for experiments.
3.3.5. Effect of temperature. During the adsorption process, the temperature will affect the diffusion of dye molecules at the interface of the outer boundary layer of the dye and in the pores of the adsorbent. As shown in Fig. 4(e), when all other conditions were kept constant, increasing the temperature increased the adsorption capacity of CR on PEI@MDC. As the temperature increased from 20 °C to 60 °C, the adsorption capacity of CR increased from 1533.12 mg g−1 to 1743.34 mg g−1, indicating the endothermic nature of the process.
3.3.6. Effect of co-existing ions. In actual dye wastewater there is usually a large amount of salt which can affect the adsorption performance. Therefore, the effect of co-existing ions such as OH−, Cl−, SO42− and CO32− on the removal rate of CR was investigated. The results observed in Fig. 4(f) showed that the removal of CR decreases in the order of Cl− > OH− > SO42− > CO32−, with the lowest removal efficiency for CO32− containing ions. The competitive effect of the coexisting ions was therefore in the order CO32− > SO42− > OH− > Cl−, implying that CO32− was more competitive with the other anions. In this experiment, the divalent ion had a stronger competitive effect than the monovalent anion, probably because the divalent ion had a greater ionic potential than the monovalent ion.44,45
3.4. Process modelling
3.4.1. Adsorption kinetics. Adsorption kinetic models are widely used to explain the adsorption process and adsorption mechanism. The commonly used adsorption kinetic models include the pseudo-first-order kinetic model, pseudo-second-order kinetic model and intraparticle diffusion model. The pseudo-first-order kinetic model indicates that the adsorption is controlled by interfacial mass transfer, while the pseudo-second-order kinetic model indicates that the adsorption process is controlled by interfacial chemical interactions.46The pseudo-first-order kinetic model can be described by eqn (3):
| | |
ln(qe − qt) = lnqe − k1t
| (3) |
where
k1 is the rate constant of the pseudo-first-order reaction, min
−1;
t is the adsorption time, min;
qt is the adsorption capacity at time
t, mg g
−1;
qe is the adsorption capacity of the adsorption equilibrium, mg g
−1.
The pseudo-second-order kinetic model is as follows (eqn (4))
| |
 | (4) |
where
k2 is the rate constant of the quasi-second-order reaction, (g mg
−1 min
−1).
The intraparticle diffusion model describes the entire diffusion process of the adsorbate inside the adsorbent particle, which can be expressed by the following formula:47
where
kid (mg (g
−1 min
−0.5)) is the intraparticle diffusion rate constant;
C (mg g
−1) is the intercept of the linear plot of
qt versus t0.5. If
C = 0, the intraparticle diffusion is the only control step, otherwise, indicating that the adsorption process is controlled by multiple steps.
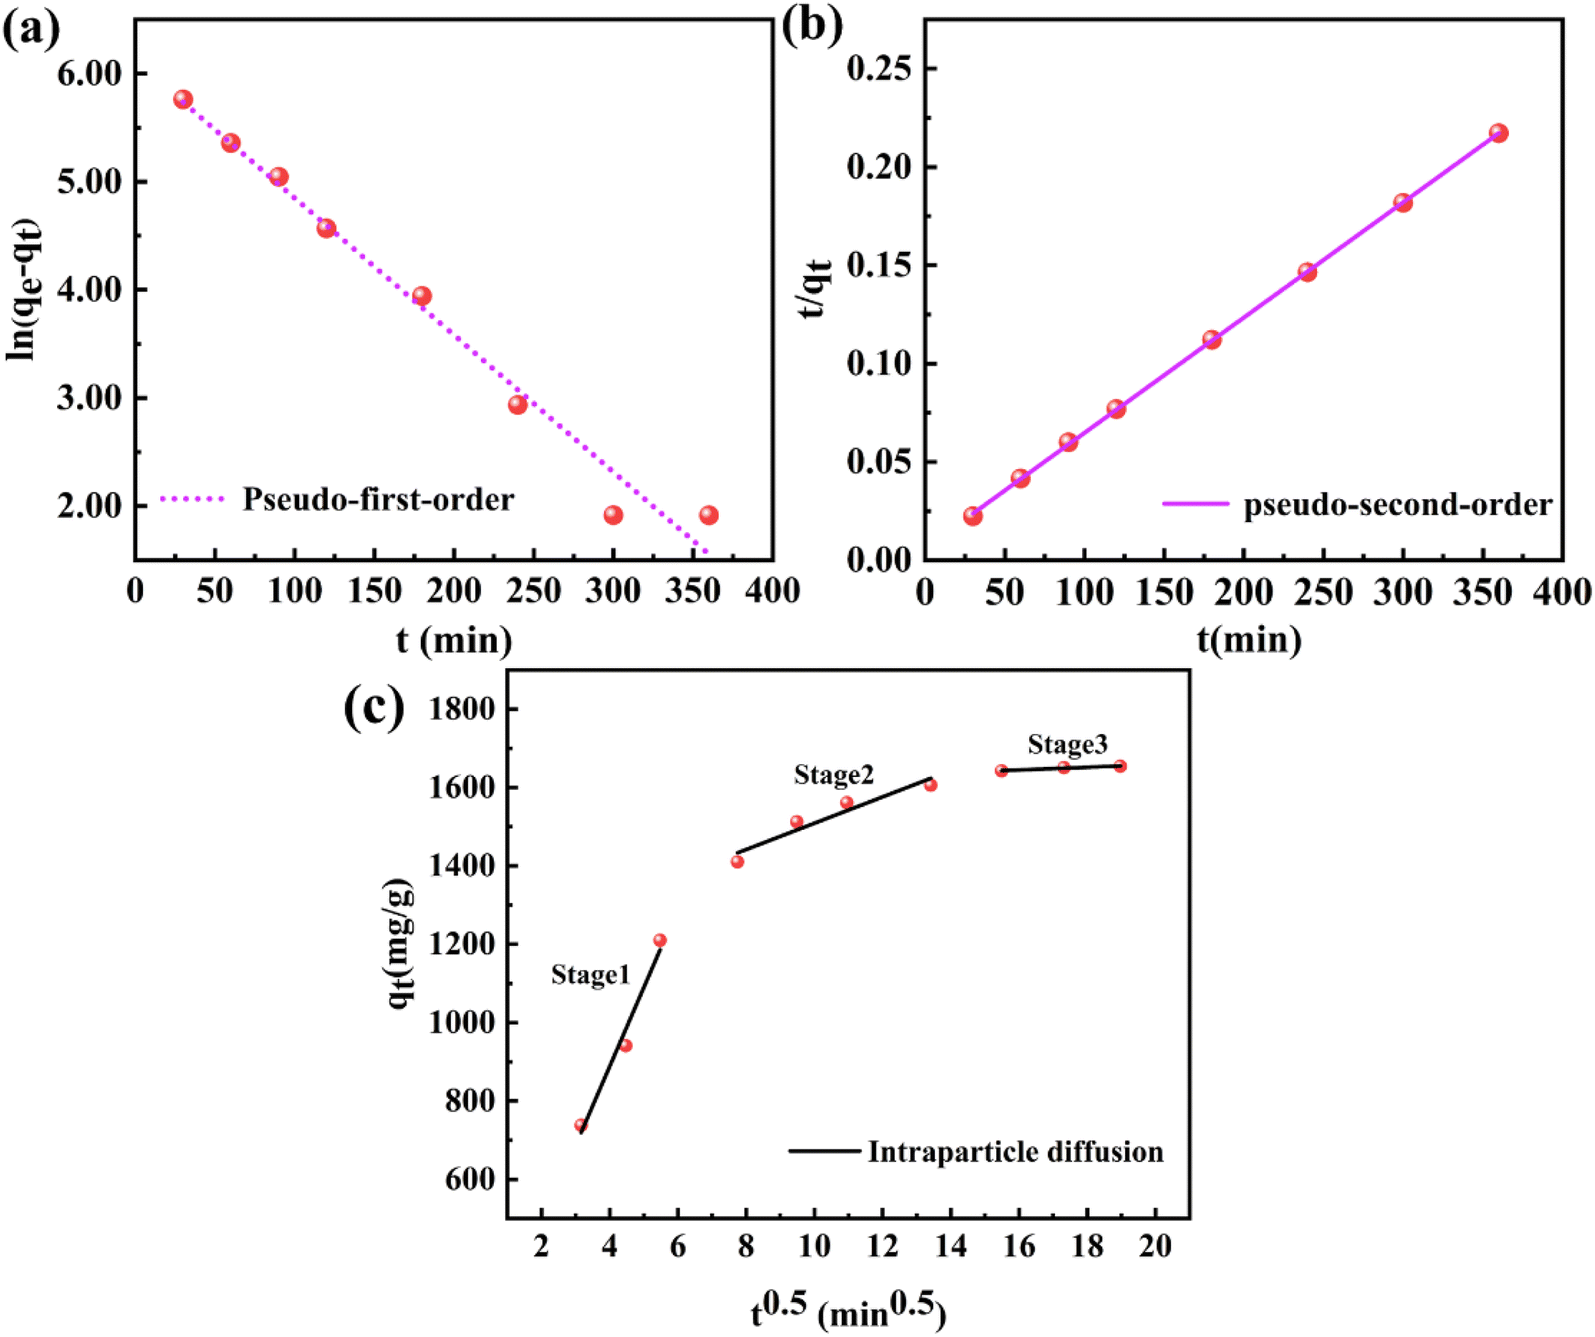
Fig. 5(a–c) showed the linear fitting results of the three models, and the fitting parameters were shown in Table 3. As shown in Fig. 5(a and b) and Table 3, the pseudo-second-order model fitted better than the pseudo-first-order model, and the correlation coefficients (R2) of the pseudo-second-order kinetic model were higher than that of the pseudo-first-order kinetic model. In addition, the calculated value (qe, cal) of the pseudo-second-order kinetic model was very close to the measured value (qe, exp), which further indicated that the pseudo-second-order kinetic model was more suitable for describing the adsorption of CR on PEI@MDC. Therefore, the adsorption of CR by PEI@MDC was likely to be dominated by chemisorption.29,48
 |
| | Fig. 5 Adsorption kinetics: (a) pseudo-first-order kinetic model; (b) pseudo-second-order kinetic model; (c) intraparticle diffusion model (adsorption conditions: m = 0.4 g L−1, pH = 6, C0 = 700 mg L−1, T = 30 °C and t = 360 min). | |
Table 3 Kinetic parameters for CR adsorption on PEI@MDC obtained by pseudo-first-order, pseudo-second-order kinetics and intraparticle diffusion models
| Kinetic models |
Parameters |
|
| |
qe, exp (mg g−1) |
1657.50 |
| Pseudo-first-order model |
qe, cal (mg g−1) |
453.02 |
| k1 (min−1) |
0.012 |
| R2 |
0.979 |
| Pseudo-second-order model |
qe, cal (mg g−1) |
1662.89 |
| k2 (g mg−1 min−1) |
0.006 |
| R2 |
0.999 |
| Intraparticle diffusion model |
Kd1 (mg g−1 min−0.5) |
0.012 |
| C1 (mg g−1) |
99.54 |
| R2 |
0.951 |
| Kd2 (mg g−1 min−0.5) |
27.26 |
| C2 (mg g−1) |
1246.73 |
| R2 |
0.982 |
| Kd3 (mg g−1 min−0.5) |
3.46 |
| C3 (mg g−1) |
1600.36 |
| R2 |
0.935 |
Since the pseudo-first-order model and the pseudo-second-order model were not sufficient to reveal the adsorption mechanism, the in-particle diffusion model was used to study the adsorption mechanism. As shown in Fig. 5(c), three independent linear regions were observed in all curves, implying that the adsorption process occurred in more than one mechanism. The first stage corresponded to external diffusion and transient adsorption with a high adsorption rate. In this stage, CR passed through the liquid film around PEI@MDC, attached to the surface of PEI@MDC, and then electrostatically interacted with amine groups/imine groups on the surface of PEI@MDC. The second stage was for particles internal diffusion, that was, CR molecules entered the adsorbent pores through internal diffusion or intrapore diffusion. The third stage was the equilibrium stage, the adsorption process gradually slowed down and finally reached equilibrium. Furthermore, the linear plots fitted by the intraparticle diffusion model deviate from the origin and showed a multilinear relationship. As shown in Table 3, C ≠ 0 (C1, C2, C3). These results suggested that the adsorption process involves intraparticle diffusion, but it is not the only rate control step.49 In summary, the process of CR adsorbed on PEI@MDC was dominated by chemical adsorption and assisted by intra-particle diffusion.
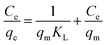
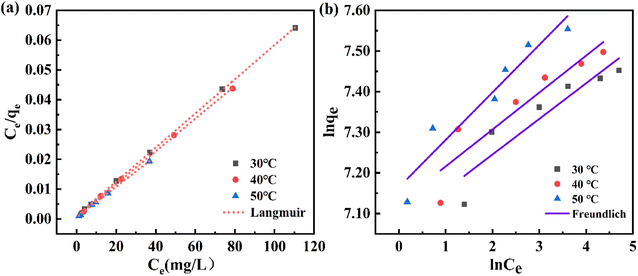
3.4.2. Adsorption isotherms. Adsorption isotherms were determined using a series of CR solutions with initial concentrations ranging from 500 to 800 mg L−1. Langmuir and Freundlich isotherm models are commonly used to analyze adsorption behavior. The Langmuir model (eqn (6)) assumes a monolayer adsorption on a surface with the same active sites, containing a limited number of adsorption sites, and no migration of adsorbates on the surface.50,51 The Langmuir model also involves calculating the RL value according to eqn (7).| |
 | (6) |
| |
 | (7) |
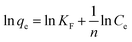
where Ce (mg L−1) is the equilibrium concentration of CR, C0 is the initial concentration of CR (mg L−1), qm (mg g−1) is the maximum adsorption capacity per unit mass of adsorbent, qe (mg g−1) is the adsorption capacity at equilibrium, and KL (L mg−1) is Langmuir constant.The Freundlich adsorption isotherm model assumes that adsorption occurs on the surface inhomogeneity of the adsorbent and is suitable for monolayer and multilayer surfaces with surface energy distributions.52 The Freundlich isotherm can be described by eqn (8):
| |
 | (8) |
where
KF (mg g
−1 (L mg
−1)
1/n) and
n are the Freundlich constants for adsorption capacity and strength, respectively.
As shown in Fig. 6(a and b), compared with the Freundlich isotherm, the Langmuir isotherm fitted the experimental data better, indicating that the Langmuir model was more suitable for describing the adsorption process of CR on PEI@MDC. Meanwhile, by comparing the correlation coefficient (R2), it was found that the Langmuir isotherm model had a larger R2 (R2 > 999) than Freundlich isotherm model (Table 4), which indicated that the adsorption of CR on PEI@MDC was a uniform monolayer adsorption behavior. The RL values reflect various properties of the adsorption system and can be unfavorable (RL > 1), linear (RL = 1), favorable (0 < RL < 1), or irreversible (RL = 0).53 The calculated RL was close to 0 (0 < RL < 1), indicating that the adsorption process of CR on PEI@MDC was favorable and irreversible to a certain extent.54 In addition, with the increase of temperature, the KL and KF values gradually increased, indicating that the adsorption was a heat-absorbing reaction, and high temperature is favorable for the reaction (Table 4). In Table 5, the maximum adsorption capacities of CR on different solid adsorbents were summarised. In this work, the maximum adsorption capacity of CR at 30 °C was 1723.86 mg g−1 based on the Langmuir model. This value was higher than most of the reported results, except for the use of GO/Ni-MOFs as adsorbents, which indicated the superiority of PEI@MDC for CR removal.
 |
| | Fig. 6 Adsorption isotherm: (a) Langmuir; (b) Freundlich (adsorption conditions: m = 0.4g L−1, pH = 6, T = 30–50 °C and t = 360 min). | |
Table 4 Isotherm parameters of CR adsorption onto PEI@MDC
| Temperature (°C) |
qe, exp (mg g−1) |
Langmuir model |
Freundlich model |
| qm (mg g−1) |
KL (L mg−1) |
RL |
R2 |
KF (mg g −1(L mg−1) 1/n) |
1/n |
R2 |
| 30 °C |
1723.86 |
1718.56 |
0.580 |
0.0020 |
0.9999 |
1176.03 |
0.0876 |
0.8571 |
| 40 °C |
1802.87 |
1796.35 |
0.693 |
0.0018 |
0.9997 |
1242.65 |
0.0909 |
0.8632 |
| 50 °C |
1907.81 |
1905.10 |
1.051 |
0.0008 |
0.9991 |
1292.58 |
0.1169 |
0.9194 |
Table 5 Comparison of CR adsorption with the previously reported results on other solid-phase adsorbents
| Solid-phase adsorbents |
Adsorption capacity (mg g−1) |
Ref. |
| GO/Ni-MOFs |
2489 |
55 |
| PEI@MDC |
1723.86 |
This work |
| Mn-UiO-66@GO-NH2 |
1265.8 |
14 |
| NH2-MIL-101(Cr) |
1206 |
56 |
| Ce(III)-doped UiO-66 |
826.7 |
57 |
| RGO/NH2-MIL-68(Al) |
474 |
58 |
| N-doped magnetic carbon aerogel |
431 |
59 |
| MOF-5/Cu |
357.4 |
60 |
| ACWNS |
224.4 |
61 |
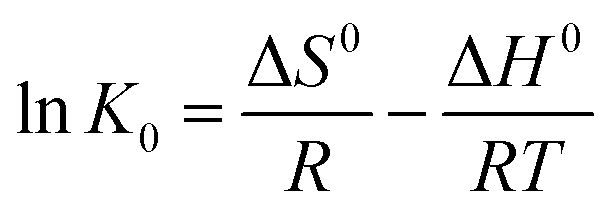
3.4.3. Adsorption thermodynamics. By calculating the thermodynamic parameters of the adsorption system such as Gibbs free energy, enthalpy change and entropy change, the adsorption thermodynamic behavior of PEI@MDC on CR was elucidated. Thermodynamic experiments were carried out at 30, 40, and 50 °C with an initial CR concentration of 700 mg L−1, an adsorbent dosage of 0.4 g L−1, a pH of 6, and a contact time of 360 min. The relevant thermodynamic parameters were calculated using the following Van't Hoff equation:| |
 | (9) |
| |
ΔG0 = −RTln![[thin space (1/6-em)]](https://www.rsc.org/images/entities/char_2009.gif) K0 K0
| (10) |
| |
 | (11) |
where ΔG0 (kJ mol−1) is the Gibbs free energy, ΔH0 (kJ mol−1) is the enthalpy change, ΔS0 [J (mol−1 K−1)] is the entropy change where K0 is the ratio of qe to Ce at a certain temperature, T is the adsorption distribution coefficient at this temperature; R (8.314 J (mol−1 K−1)) is the molar gas constant; T (K) is the temperature.The calculation results of thermodynamic parameters were summarized in Table 6. Negative values of ΔG0 (−9.26, −11.04, −13.17 kJ mol−1) at all temperatures indicated the spontaneity of the adsorption process. The values of ΔH0 > 0 indicated that the increase in temperature was favorable for the adsorption process, which confirmed the endothermic nature of CR adsorption by PEI@MDC. Meanwhile, the ΔS0 > 0 of this process indicated that the adsorption of CR on PEI@MDC was an entropy-increasing process.
Table 6 Thermodynamic parameters of CR adsorption onto PEI@MDC
| Sample dye |
Temperature (°C) |
ΔG0 (kJ mol−1) |
ΔH0 (kJ mol−1) |
ΔS0 [J (mol−1 K−1)] |
| CR |
30 °C |
−9.26 |
65.32 |
246.92 |
| 40 °C |
−11.04 |
| 50 °C |
−13.17 |
3.4.4. Mechanism analysis through XPS. The adsorption process usually depends on the functional groups located on the surface of the adsorbent. The chemical composition of PEI@MDC before and after adsorption of CR was characterized by XPS analysis to understand the removal mechanism of CR. As shown in Fig. 7(a), in the XPS curve of PEI@MDC/CR, a new S 2p signal from the sulfonic acid group (SO3−) of CR with a binding energy of 166.3 eV could be observed, which confirmed that CR had been successfully adsorbed onto PEI@MDC. For PEI@MDC (before adsorption), the high-resolution XPS curve fitted to the N 1s peak exhibits two binding energies centered at 399.9 and 398.0 eV, corresponding to –NH2 and –N, respectively (Fig. 7(b)). While the high-resolution XPS curve fitted to the N 1s peak at PEI@MDC/CR (after adsorption) could observe a different peak at 401.0 eV, which corresponded to the protonated –NH2+–/–NH3+ (Fig. 7(c)). It was shown that the electrostatic attraction between the protonated amine group from PEI@MDC and the sulfonic acid group (SO3−) from CR was an important driving force for the adsorption of CR. Meanwhile, after CR adsorption, the peaks of –N and –NH–/–NH2 shifted from 398.0 eV and 399.9 eV to 399.0 eV and 400.1 eV, respectively. It was speculated that the hydrogen bond interaction formed between the NH2 on the CR molecule and the –OH on the PEI@MDC, which reduced the electron cloud density and increased the binding energy.41,62 Based on the above analysis, the possible mechanism of CR adsorption by PEI@MDC was shown in Fig. 7(d).
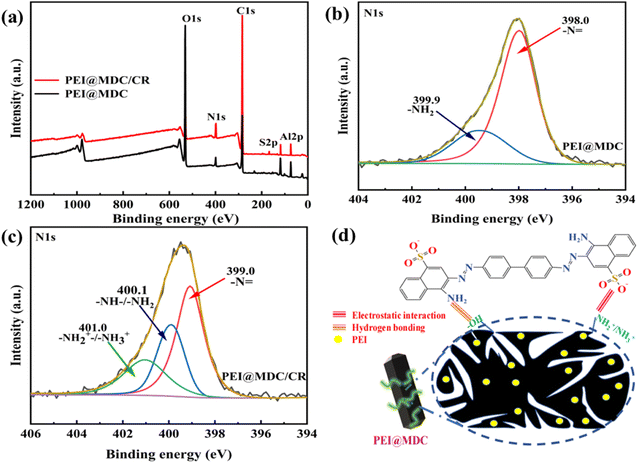 |
| | Fig. 7 (a) XPS survey of PEI@MDC before and after adsorption of CR; (b) N 1s spectra of PEI@MDC; (c) N 1s spectra of PEI@MDC/CR; (d) adsorption mechanism. | |
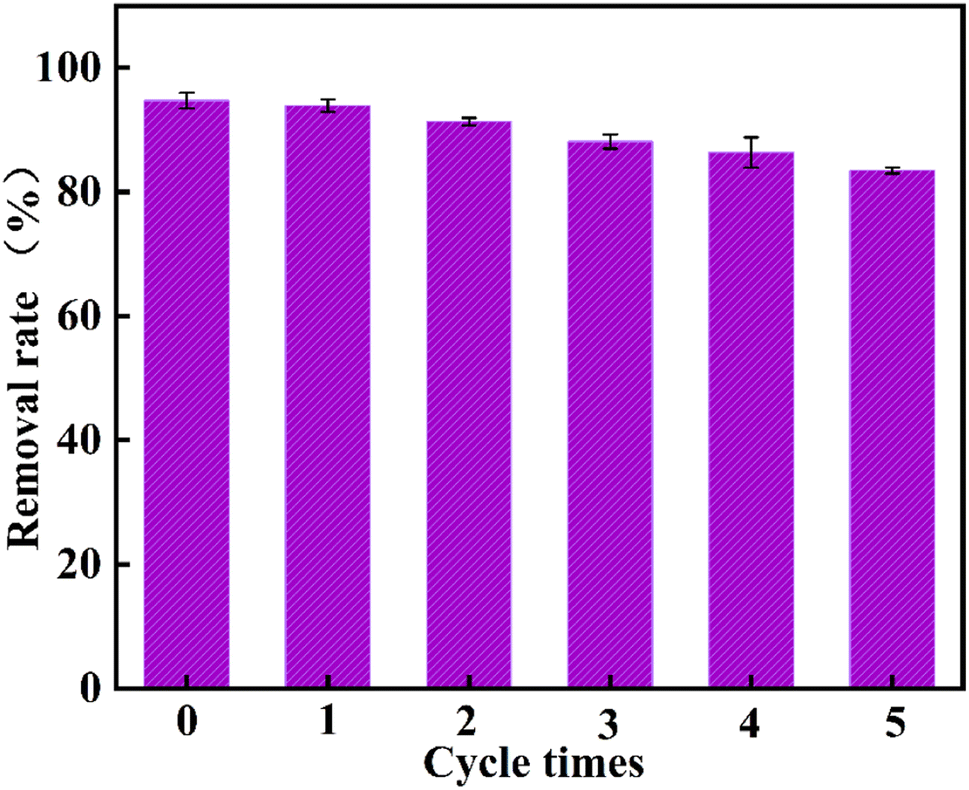
3.4.5. Regeneration performance. The reusability of adsorbents is one of the important factors in practical applications. The recycling performance of CR dyes adsorbed on PEI@MDC was investigated by adsorption–desorption regeneration experiments. As shown in Fig. 8, after five adsorption–desorption cycles of PEI@MDC, the removal rate of CR decreased slightly, from 94.71% to 83.42%. The slight reduction in removal rate was due to the fact that some CR molecules were tightly adsorbed on the adsorbent and could not be desorbed completely. Overall, PEI@MDC has a good recovery capacity and can be reused for the removal of CR from dye wastewater.
 |
| | Fig. 8 Reusability of PEI@MDC in the cyclic removal of CR (adsorption conditions: pH = 6, C0 = 700 mg L−1, m = 0.4 g L−1, T = 30 °C and t = 360 min). | |
4. Conclusions
To sum up, polyethyleneimine-modified MOF-derived carbon (PEI@MDC) is an easily recoverable and highly efficient adsorbent for Congo red. The increase in positive charge of PEI@MDC due to the presence of protonated amine groups played a key role in providing more adsorption sites for enhanced adsorption. Batch adsorption experiments revealed the improvement of adsorption capacity by 2.03 times over the virgin MDC. The adsorption process can be described by Langmuir and pseudo-second order kinetic models. Adsorption capacity up to 1723.86 mg g−1 at 30 °C. Mechanism analysis showed that electrostatic interaction and hydrogen bonding dominated the adsorption process. The removal rate of PEI@MDC remained at 83.42% after five cycles of regeneration, showing excellent regeneration performance. In conclusion, PEI@MDC can be used as an efficient and renewable adsorbent for the treatment of CR dye wastewater.
Author contributions
Na Hu: investigation, data curation, formal analysis, writing-original draft, writing review & editing, visualization. Junzhe Yu: writing review, editing, visualization. Liran Hou: conceptualization, methodology, visualization, writing-review & editing. Changrong Shi: formal analysis, validation. Fangxue Hang: supervision, conceptualization, methodology, visualization, writing-review & editing. Caifeng Xie: visualization, supervision, project administration, funding acquisition, writing-review & editing. Kai Li: supervision, conceptualization, methodology, formal analysis.
Conflicts of interest
The authors declare that they have no known competing financial interests or personal relationships that could have appeared to influence the work reported in this paper.
Acknowledgements
This financial support from the National Key R&D Program of China (2021YFE0114400), the Research program of Agriculture Research System of China (CARS-17), and the Natural Science Foundation of China (32160570) were acknowledged.
References
- E. Motamedi, K. Kavousi, S. F. S. Motahar, M. R. Ghaffari, A. S. A. Mamaghani, G. H. Salekdeh and S. Ariaeenejad, Bioresour. Technol., 2021, 337, 125468 CrossRef CAS PubMed.
- D. Ranjbar, M. Raeiszadeh, L. Lewis, M. J. MacLachlan and S. G. Hatzikiriakos, Cellulose, 2020, 27, 3211–3232 CrossRef CAS.
- A. Akhtar, Z. Aslam, A. Asghar, M. M. Bello and A. A. A. Raman, J. Environ. Chem. Eng., 2020, 8, 104055 CrossRef CAS.
- Y. Zhang, W. Yu, R. Li, Y. Xu, L. Shen, H. Lin, B.-Q. Liao and G. Wu, Sep. Purif. Technol., 2019, 211, 368–376 CrossRef CAS.
- W. Huang, J. Chen, Y. Hu and L. Zhang, Electrochim. Acta, 2018, 260, 196–203 CrossRef CAS.
- J. Kaushik, Himanshi, V. Kumar, K. M. Tripathi and S. K. Sonkar, Chemosphere, 2022, 287, 132225 CrossRef CAS PubMed.
- K. Alsamhary, N. M. Al-Enazi, E. Alhomaidi and S. Alwakeel, Environ. Res., 2022, 207, 112172 CrossRef CAS PubMed.
- C. Aoopngan, J. Nonkumwong, S. Phumying, W. Promjantuek, S. Maensiri, P. Noisa, S. Pinitsoontorn, S. Ananta and L. Srisombat, ACS Appl. Nano Mater., 2019, 2, 5329–5341 CrossRef CAS.
- W. Bi, G. Wang and X. Hu, Colloids Surf., A, 2022, 652, 129758 CrossRef CAS.
- J. Ding, Y. Tang, S. Zheng, S. Zhang, H. Xue, Q. Kong and H. Pang, Nano Res., 2022, 15, 6793–6818 CrossRef CAS.
- F. Marpaung, M. Kim, J. H. Khan, K. Konstantinov, Y. Yamauchi, M. S. A. Hossain, J. Na and J. Kim, Chem.–Asian J., 2019, 14, 1331–1343 CrossRef CAS PubMed.
- Y. Luo, G. Huang, Y. Li, Y. Yao, J. Huang, P. Zhang, S. Ren, J. Shen and Z. Zhang, Sci. Total Environ., 2023, 857, 159279 CrossRef CAS PubMed.
- M. A. Hossain, M. M. H. Mondol and S. H. Jhung, Chemosphere, 2022, 303, 134890 CrossRef CAS PubMed.
- A. S. Eltaweil, H. M. Elshishini, Z. F. Ghatass and G. M. Elsubruiti, Powder Technol., 2021, 379, 407–416 CrossRef CAS.
- E. M. Abd El-Monaem, M. M. Abd El-Latif, A. S. Eltaweil and G. M. El-Subruiti, Nano, 2021, 16, 2150039 CrossRef.
- Q. Huang, M. Liu, J. Zhao, J. Chen, G. Zeng, H. Huang, J. Tian, Y. Wen, X. Zhang and Y. Wei, Appl. Surf. Sci., 2018, 427, 535–544 CrossRef CAS.
- X. Quan, Z. Sun, H. Meng, Y. Han, J. Wu, J. Xu, Y. Xu and X. Zhang, J. Solid State Chem., 2019, 270, 231–241 CrossRef CAS.
- L. You, C. Huang, F. Lu, A. Wang, X. Liu and Q. Zhang, Int. J. Biol. Macromol., 2018, 107, 1620–1628 CrossRef CAS PubMed.
- J. Wang, Y. Liu, X. Guo, H. Qu, R. Chang and J. Ma, ACS Omega, 2020, 5, 32286–32294 CrossRef CAS PubMed.
- S. Chen, S. Mukherjee, B. E. G. Lucier, Y. Guo, Y. T. A. Wong, V. V. Terskikh, M. J. Zaworotko and Y. Huang, J. Am. Chem. Soc., 2019, 141, 14257–14271 CrossRef CAS PubMed.
- S. Salehi and M. Anbia, Appl. Organomet. Chem., 2018, 32, e4390 CrossRef.
- H. Ma, Y. Yang, F. Yin, X.-F. Zhang, J. Qiu and J. Yao, J. Cleaner Prod., 2022, 333, 130229 CrossRef CAS.
- H. Tian, J. Wu, W. Zhang, S. Yang, F. Li, Y. Qi, R. Zhou, X. Qi, L. Zhao and X. Wang, Chem. Eng. J., 2017, 313, 1051–1060 CrossRef CAS.
- J. Wu, S. Yang, Q. Liu, P. He, H. Tian, J. Ren, Z. Guan, T. Hu, B. Ni and C. Zhang, Environ. Sci. Technol., 2016, 50, 5370–5378 CrossRef CAS PubMed.
- M. Vakili, S. Deng, T. Li, W. Wang, W. Wang and G. Yu, Chem. Eng. J., 2018, 347, 782–790 CrossRef CAS.
- A. S. Eltaweil, E. M. Abd El-Monaem, G. M. El-Subruiti, M. M. Abd El-Latif and A. M. Omer, RSC Adv., 2020, 10, 19008–19019 RSC.
- X. Zhang, Y. Li and Y. Hou, Int. J. Biol. Macromol., 2019, 141, 1102–1110 CrossRef CAS PubMed.
- S. Chen, J. Wang, Z. Wu, Q. Deng, W. Tu, G. Dai, Z. Zeng and S. Deng, J. Colloid Interface Sci., 2018, 523, 110–120 CrossRef CAS PubMed.
- C. Liang, L. Zhao, L. Qiao and K. Du, J. Hazard. Mater., 2022, 425, 127886 CrossRef CAS PubMed.
- Z. Wang, C. W. Wu, Z. Zhang, Y. Chen, W. Y. Deng and W. Q. Chen, J. Mater. Sci., 2021, 56, 15684–15697 CrossRef CAS.
- F. Meng, M. Song, Y. Wei and Y. Wang, Environ. Sci. Pollut. Res., 2019, 26, 7195–7204 CrossRef CAS PubMed.
- X. Wang, J. Feng, Y. Cai, M. Fang, M. Kong, A. Alsaedi, T. Hayat and X. Tan, Sci. Total Environ., 2020, 708, 134575 CrossRef CAS PubMed.
- J. Geng, Y. Yin, Q. Liang, Z. Zhu and H. Luo, Chem. Eng. J., 2019, 361, 1497–1510 CrossRef CAS.
- Y. Shang, G. Zhu, D. Yan, Q. Liu, T. Gao and G. Zhou, J. Taiwan Inst. Chem. Eng., 2021, 119, 52–59 CrossRef CAS.
- X. Xie, H. Gao, X. Luo, T. Su, Y. Zhang and Z. Qin, J. Environ. Chem. Eng., 2019, 7, 103183 CrossRef.
- W. Wang, Y. Zhang, F. Li, Y. Chen, S. M. M. Rostami, S. S. Hosseini and L. Shao, J. Membr. Sci., 2022, 658, 120703 CrossRef CAS.
- H. Karimi, M. A. Heidari, H. B. M. Emrooz and M. Shokouhimehr, Diamond Relat. Mater., 2020, 108, 107999 CrossRef CAS.
- M. Usman, L. Pan, M. Asif and Z. Mahmood, J. Mater. Res., 2015, 30, 3192–3200 CrossRef CAS.
- Y. Qian, Y. Yuan, H. Wang, H. Liu, J. Zhang, S. Shi, Z. Guo and N. Wang, J. Mater. Chem. A, 2018, 6, 24676–24685 RSC.
- Y. Zhang, K. Xia, X. Liu, Z. Chen, H. Du and X. Zhang, J. Taiwan Inst. Chem. Eng., 2019, 102, 1–8 CrossRef CAS.
- Y. Liu, S. Zhou, R. Liu, M. Chen, J. Xu, M. Liao, J. Mei and L. Yang, Sep. Purif. Technol., 2022, 298, 121625 CrossRef CAS.
- D.-M. Guo, Q.-D. An, R. Li, Z.-Y. Xiao and S.-R. Zhai, Colloids Surf., A, 2018, 555, 150–160 CrossRef CAS.
- S. Du, L. Wang, N. Xue, M. Pei, W. Sui and W. Guo, J. Solid State Chem., 2017, 252, 152–157 CrossRef CAS.
- Y. Chen, C. Jing, X. Zhang, D. Jiang, X. Liu, B. Dong, L. Feng, S. Li and Y. Zhang, J. Colloid Interface Sci., 2019, 548, 100–109 CrossRef CAS PubMed.
- G. Y. A. El-Reesh, A. A. Farghali, M. Taha and R. K. Mahmoud, Sci. Rep., 2020, 10, 587 CrossRef PubMed.
- Y. Xu and B. Chen, J. Soils Sediments, 2015, 15, 60–70 CrossRef CAS.
- Q. Wang, Y. Tian, L. Kong, J. Zhang, W. Zuo, Y. Li and G. Cai, Chem. Eng. J., 2021, 425, 131722 CrossRef CAS.
- S. Zhao, Y. Wen, C. Du, T. Tang and D. Kang, Chem. Eng. J., 2020, 402, 126180 CrossRef CAS.
- R. Zhao, X. Li, B. Sun, Y. Li, Y. Li, R. Yang and C. Wang, J. Mater. Chem. A, 2017, 5, 1133–1144 RSC.
- S. Tangtubtim and S. Saikrasun, Appl. Surf. Sci., 2019, 467, 596–607 CrossRef.
- N. Nasuha, B. H. Hameed and A. T. M. Din, J. Hazard. Mater., 2010, 175, 126–132 CrossRef CAS PubMed.
- M. Ozacar and I. A. Sengil, J. Hazard. Mater., 2003, 98, 211–224 CrossRef CAS PubMed.
- D. Xie, Y. Gu, H. Wang, Y. Wang, W. Qin, G. Wang, H. Zhang and Y. Zhang, J. Colloid Interface Sci., 2019, 542, 269–280 CrossRef CAS PubMed.
- D. Yan, F. Li, B. Sun, Y. Wang, Q. Liu, T. Gao and G. Zhou, J. Appl. Polym. Sci., 2022, 139, 52050 CrossRef CAS.
- S. Zhao, D. Chen, F. Wei, N. Chen, Z. Liang and Y. Luo, Ultrason. Sonochem., 2017, 39, 845–852 CrossRef CAS PubMed.
- Y. Tan, Z. Sun, H. Meng, Y. Han, J. Wu, J. Xu, Y. Xu and X. Zhang, Powder Technol., 2019, 356, 162–169 CrossRef CAS.
- J.-M. Yang, B.-C. Yang, Y. Zhang, R.-N. Yang, S.-S. Ji, Q. Wang, S. Quan and R.-Z. Zhang, Microporous Mesoporous Mater., 2020, 292, 109764 CrossRef CAS.
- Z. Wu, X. Yuan, H. Zhong, H. Wang, L. Jiang, G. Zeng, H. Wang, Z. Liu and Y. Li, J. Mol. Liq., 2017, 247, 215–229 CrossRef CAS.
- S. Zhai, R. Chen, J. Liu, J. Xu and H. Jiang, J. Taiwan Inst. Chem. Eng., 2021, 120, 161–168 CrossRef CAS.
- S. H. Mosavi, R. Zare-Dorabei and M. Bereyhi, Chemistryselect, 2021, 6, 4432–4439 CrossRef CAS.
- E. Dovi, A. A. Aryee, A. N. Kani, F. M. Mpatani, J. Li, Z. Li, L. Qu and R. Han, J. Environ. Chem. Eng., 2021, 9, 106301 CrossRef CAS.
- Y. Zhang, Z. Wang, W. Lin, H. Sun, L. Wu and S. Chen, J. Membr. Sci., 2013, 446, 164–170 CrossRef CAS.
|
| This journal is © The Royal Society of Chemistry 2023 |
Click here to see how this site uses Cookies. View our privacy policy here. 
 Open Access Article
 This Open Access Article is licensed under a Creative Commons Attribution-Non Commercial 3.0 Unported Licence
 a,
Junzhe Yu
a,
Junzhe Yu