
 Open Access Article
 This Open Access Article is licensed under a Creative Commons Attribution-Non Commercial 3.0 Unported Licence
Systematic radical species control by electron push–pull substitution in the perylene-based D–π–A compounds†
Mina Ahn‡
a,
Soyoon Lee‡a,
Min-Ji Kima,
Minjung Chaea,
Dae Won Chob and
Kyung-Ryang Wee *a
*a
aDepartment of Chemistry and Institute of Natural Science, Daegu University, Gyeongsan 38453, Republic of Korea. E-mail: krwee@daegu.ac.kr
bDepartment of Chemistry, Yeungnam University, Gyeongsan, Gyeongbuk 38541, Republic of Korea
First published on 13th January 2023
Abstract
Organic radical materials have been mainly reported on the stabilization of radical species because of their high energy and reactivity, while design strategies for controlling radical species beyond stabilization have remained challenging. Here, we report the electronic push–pull control spanning the neutral to the radical state of a series of perylene-based donor–π–acceptors (D–π–A). By introducing electron-withdrawing and -donating R groups to the donor of D–π–A, the observed intramolecular interactions controllable at the HOMO level led to the exploration of radical species. D–π–A with redox-active sites was transformed to (D–π–A)˙+ and (D–π–A)˙− in response to an external electrical stimulus under stabilization by perylene, resulting in new absorption peaks. In particular, the increasing absorption peaks of (D–π–A)˙+ showed a spectral shift and intensity change according to the R group, unlike those of (D–π–A)˙−. These experimental results support that the DFT/TD-DFT data suggests the radical cationic SOMO level variability. As a result, we provide a strategy for controlling the systematic radical species using the electron push–pull effect.
Introduction
Over the past few years, there has been a steadily growing interest in stable organic radicals and radical ions because of their intriguing electronic, optical, and magnetic properties.1–6 Radical species with fascinating optoelectronic properties have led to manifold applications ranging from information storage,7 fluorescence probes,8,9 chemical sensors,10,11 organic electronic devices,12,13 or photovoltaics.14–16 These considerable advances have equally required radical generation efficiency, kinetics and stability. However, it is prevalent for radical species to revert to neutral species or decompose into other species when exposed to air due to the inherent high energy/reactivity of the radical species.17,18 One of the notable strategies to mitigate this challenge is the use of electron delocalized π-conjugated systems that are advantageous for redox-activity.19,20Perylene, an important class of rylene dyes, is a promising candidate for generating organic radicals because of the exceptional stability by the extended planar π-conjugated system21 and the formation of spectroscopically characteristic radical species.22 Under the ever-increasing academic interest in perylene-based radical species, numerous research achievements have highlighted the stability of the chemically, electrochemically, or photochemically generated radical species.23 Their experimental examples to enhance the stability notice that it is critical to isolate the electrons in radicals and radical ions where unpaired electrons are delocalized. Regarding spontaneous electron isolation, perylene radical anions can be isolated by endowing higher electron affinity, whereas perylene radical cations are comparatively unstable because of their high reactivity. Most recently, new perspectives show that perylene π-bridges, substituted with donor and acceptor, equally delocalize radical cations and anions in D–π–A type system.24 This asymmetric π-conjugated radicaloid system has improved the stability of radicals and had a tremendous impact on the potential applications of true ambipolar bulk and molecular conductors. Despite these interesting and fundamental investigations, to the best of our knowledge, fine-tuning the radical properties of perylene derivatives remains an area to be explored, as there are no reports yet.
To address this task, the D–π–A type system incorporating an electron donor (D) and an electron acceptor (A) into the perylene (Peri) used as a π-bridge is reasonable. A series of perylene-based D–π–A compounds were designed in such a way that connects two redox-active terminal moieties, either oxidable donor or reducible acceptor, to induce asymmetric radicaloid character. The perylene π-bridge inserted between the donor and the acceptor prevented the formation of a perylene dimer25,26 and the high reactivity27 of the radical cation by the 3,9-position substitution of the perylene, thereby facilitating the exploration of the isolated radical anions and radical cations. As the redox sites, 2,4,6-triphenyl-1,3,5-triazine (TRZ) and diphenylamine (DPA) are well-known strong electron acceptors and donors,28–31 which are favorable to the formation of isolated radical anionic and cationic species. To clarify the electron push–pull effect in D–π–A system and fine-tune the radical species, para-positional functionalization of DPA donor with electron-withdrawing and -donating R groups (R = F, H, Me, and OMe) was performed. This strategy was motivated by the quest to compare and analyze the tendency of radical species to be sensitive to electron push–pull effect by further extending from neutral to radical species.
Herein, we are interested in developing the perylene-based D–π–A type equipped with a radicaloid system and examining the substituent effects on both neutral and radical species. Typically, the neutral species D–π–A system resulted in an intramolecular charge transfer (ICT) from the donor to the acceptor moiety. The photophysical and electrochemical properties of the target compound 3a–3d confirmed that the R group attached to the DPA donor controls the highest occupied molecular orbital (HOMO) level in the D–π–A system to fine-tune the ICT electronic interaction and efficiency, which were examined experimentally and theoretically. Under different external electric bias, the neutral species D–π–A was converted to the radical species (D–π–A)˙+ and (D–π–A)˙– through oxidation and reduction processes, respectively. Spectroelectrochemical (SEC) investigations have shown the radical properties that can be controlled by the electron push–pull effect of the R group by simultaneously characterizing photochemical and electronic properties of radical species. The doublet state DFT/TD-DFT calculations rationalize the radical-based intramolecular electronic effect by the substituent, supporting the SEC experimental results. Furthermore, with regard to the redox active molecular design strategy, the Hammett plot serves as a predictive tool for controlling the singly occupied molecular orbital (SOMO) level of radical species with substituents.
Results and discussion
Synthesis
Scheme 1 presents the synthetic procedures for a series of perylene-based D–π–A compounds, DPA(R)–Peri–TRZ, 3-bis(N,N-bis(4′-(R)-phenyl)amino)-9-(2,4,6-triphenyl-1,3,5-triazine)perylene (R: F (3a), H (3b), Me (3c), and OMe (3d)). As a first step, 3-(p-(R)-diphenylamino)perylene (1) (R: F (1a), H (1b), Me (1c), OMe (1d)), were prepared using previously reported procedures.32,33 3-Bis(N,N-bis(4′-(R)-phenyl)amino)-9-bromoperylene (2) was then synthesized by bromination using N-bromosuccinimide and used without further purification. Finally, the perylene-based D–π–A compounds were synthesized using a modified Suzuki–Miyaura cross-coupling reaction with 3-bis(N,N-bis(4′-(R)-phenyl)amino)-9-bromoperylene (2) with 1 molar ratios of 2,4-diphenyl-6-(4-(4,4,5,5-tetramethyl-1,3,2-dioxaborolan-2-yl)phenyl)-1,3,5-triazine. In particular, DPA(R)–Peri–TRZ (3a–3d) was prepared in the presence of 5 mol% Pd(PPh3)4 as a catalyst and excess amounts of K2CO3, producing an orange or red powder in toluene with a yield of 50–83%. All the compounds were purified by silica gel column chromatograph using dichloromethane (DCM)/n-Hexane and EA (ethyl acetate)/n-Hexane mixture eluents and further purified by recrystallizations for high purity. The molecular structure of all compounds was characterized by 1H- and 13C{1H}-NMR spectroscopy (Fig. S1–S8†), elemental analysis, and mass spectrometry (Fig. S9†). The experimental section and the ESI† provide the detailed synthetic procedures and characterization data. | ||
| Scheme 1 Synthetic route to DPA(R)–Peri–TRZ. Reagents and conditions: (i) NBS, anhydrous THF, 24 h, r.t. (ii) Pd(dba)3, Xantphos, NaOt-Bu, toluene, reflux, 24 h. (iii) Pd(PPh3)4, K2CO3, Toluene/H2O, reflux, 24 h. | ||
Neutral species studies
![[thin space (1/6-em)]](https://www.rsc.org/images/entities/char_2009.gif) 876–411634 cm−1 M−1), high-energy absorption at 250–340 nm (Fig. S10A†), which is due mainly to the π–π* transitions of the DPA, Peri, and TRZ moieties (Fig. S10B†), respectively. Furthermore, as shown in Fig. 1A and S10A,† 3a–3d showed an ICT transition of a broad, relatively weak (molar absorption coefficient at 131526–174895 cm−1 M−1), and low-energy absorption at 360–500 nm, which means an intramolecular interaction in the ground state. The introduction of substituents at the para-position of DPA affected the molar absorption coefficient and spectral shift of the ICT transition. The molar absorption coefficient of the ICT band was relatively more tunable by the substituents compared to that of the LE band, which means that the electron push–pull substituent effect has a significant influence on the ICT transition. In particular, the ICT band of the 3a–3d exhibits the two absorption bands at 375–430 nm and 470–500 nm. The ICT band of the shorter wavelength shows the progressively increasing molar absorption coefficient with increasing electron-donating power of the substituents, without a spectral shift. The ICT band of the longer wavelength was red-shifted in the order of 3a < 3b < 3c < 3d, with a gradual decrease in the molar absorption coefficient. These results suggest two types of ICT bands in the ground state, which was further supported by density functional theory (DFT) calculations and time-dependent DFT (TD-DFT) calculations. In particular, the results of TD-DFT calculations confirm the two main ICT transitions of 3a–3d (Fig. S22–S25, Tables S5, S7, S9 and S11†). The main ICT transition in the longer-wavelength region occurs from the Peri–DPA delocalized HOMO to the TRZ delocalized LUMO. The main ICT transition in the shorter-wavelength region also occurs from the Peri–DPA delocalized HOMO−1 to the TRZ delocalized LUMO. From the orbital distribution (Fig. S21†), the Peri–DPA delocalization of HOMO and HOMO−1 was generally similar but showed differences in distribution according to the electron donating properties of the substituents. As the electron-donation propensity increases, among the Peri–DPA delocalization, the HOMO orbital distribution is partially transferred from perylene to DPA. On the other hand, the HOMO−1 orbital distribution is partially transferred from DPA to perylene. These differences in the two main ICT theoretical absorptions manifested as a larger spectral shift in the HOMO to LUMO transition and larger oscillator strength in the HOMO−1 to LUMO transition, compared to the experimental values (Fig. S22–S25†). Therefore, the TD-DFT results show that 3a–3d have two types of ICT transitions, which are consistent with the steady-state spectroscopy results.
876–411634 cm−1 M−1), high-energy absorption at 250–340 nm (Fig. S10A†), which is due mainly to the π–π* transitions of the DPA, Peri, and TRZ moieties (Fig. S10B†), respectively. Furthermore, as shown in Fig. 1A and S10A,† 3a–3d showed an ICT transition of a broad, relatively weak (molar absorption coefficient at 131526–174895 cm−1 M−1), and low-energy absorption at 360–500 nm, which means an intramolecular interaction in the ground state. The introduction of substituents at the para-position of DPA affected the molar absorption coefficient and spectral shift of the ICT transition. The molar absorption coefficient of the ICT band was relatively more tunable by the substituents compared to that of the LE band, which means that the electron push–pull substituent effect has a significant influence on the ICT transition. In particular, the ICT band of the 3a–3d exhibits the two absorption bands at 375–430 nm and 470–500 nm. The ICT band of the shorter wavelength shows the progressively increasing molar absorption coefficient with increasing electron-donating power of the substituents, without a spectral shift. The ICT band of the longer wavelength was red-shifted in the order of 3a < 3b < 3c < 3d, with a gradual decrease in the molar absorption coefficient. These results suggest two types of ICT bands in the ground state, which was further supported by density functional theory (DFT) calculations and time-dependent DFT (TD-DFT) calculations. In particular, the results of TD-DFT calculations confirm the two main ICT transitions of 3a–3d (Fig. S22–S25, Tables S5, S7, S9 and S11†). The main ICT transition in the longer-wavelength region occurs from the Peri–DPA delocalized HOMO to the TRZ delocalized LUMO. The main ICT transition in the shorter-wavelength region also occurs from the Peri–DPA delocalized HOMO−1 to the TRZ delocalized LUMO. From the orbital distribution (Fig. S21†), the Peri–DPA delocalization of HOMO and HOMO−1 was generally similar but showed differences in distribution according to the electron donating properties of the substituents. As the electron-donation propensity increases, among the Peri–DPA delocalization, the HOMO orbital distribution is partially transferred from perylene to DPA. On the other hand, the HOMO−1 orbital distribution is partially transferred from DPA to perylene. These differences in the two main ICT theoretical absorptions manifested as a larger spectral shift in the HOMO to LUMO transition and larger oscillator strength in the HOMO−1 to LUMO transition, compared to the experimental values (Fig. S22–S25†). Therefore, the TD-DFT results show that 3a–3d have two types of ICT transitions, which are consistent with the steady-state spectroscopy results.
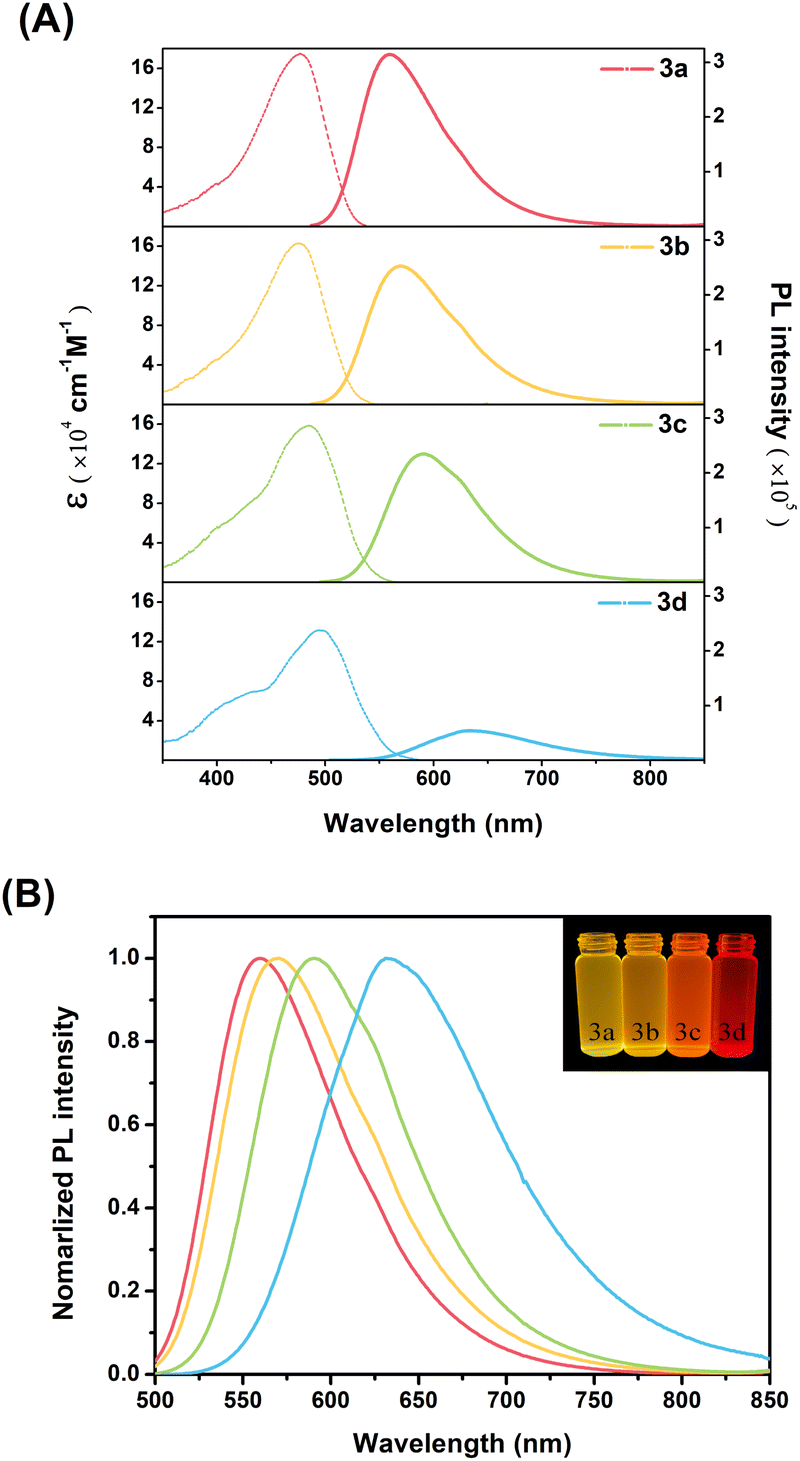 | ||
| Fig. 1 (A) UV-vis absorption (left) and emission (right) spectra of compounds 3a–3d in DCM solution at 1 μM. (B) Normalized emission spectra of compounds 3a–3d (Inset: fluorescence photographs of 3a–3d in DCM solvent under the irradiation of 365 nm UV light). | ||
| Compounds | λabsmax (nm) | λPLmax (nm) | Stokes Shift (cm−1) | ϕFc | τFd (ns) | kre × 108 (s−1) | knre × 108 (s−1) | krad/knr |
|---|---|---|---|---|---|---|---|---|
| sola | sola/filmb | sola | ||||||
| a Absorption and emission maximum for the lowest energy band in DCM at room temperature (RT).b Measured in thin films.c Fluorescence quantum yields, with perylene as the standard (ϕF = 94%, in n-Hexane), in DCM at RT.d Fluorescence lifetime in DCM.e Values of kr and knr were calculated according to using krad = ϕF/τF and knr = (1/τF) − krad. | ||||||||
| 3a | 477 | 559/558 | 3075 | 0.96 | 4.00 | 2.40 | 0.10 | 24.0 |
| 3b | 474 | 570/571 | 3553 | 0.89 | 4.23 | 2.10 | 0.26 | 8.08 |
| 3c | 485 | 590/585 | 3669 | 0.82 | 5.26 | 1.55 | 0.34 | 4.55 |
| 3d | 494 | 632/631 | 4420 | 0.27 | 4.19 | 0.64 | 1.74 | 0.37 |
Similar to the ICT absorption spectra, the emission spectra of DPA(R)–Peri–TRZ compounds are also strongly dependent on the electron-donating/withdrawing nature of the substituent. As shown in Fig. 1B, the emission maxima of 3a–3d in a DCM solution ranged from (559 to 632) nm, showing emission profiles from yellow to red. In addition, all compounds exhibited highly solvatochromic emission compared to the ground state with little solvent effect, which exhibited spectra shift with increasing solvent polarity from n-Hexane to acetonitrile (ACN) (Table S1, Fig. S12, and S13†). The dependency of the emission maxima on the substituents in combination with the strong solvatochromism of each compound means that 3a–3d have an ICT state in the excited state. Considering the ICT character of the ground and excited state, the substituent effect of 3a–3d is related to the Stokes shifts. A sequential increase in Stokes shifts was observed with substitution from electron-withdrawing groups (EWGs) to electron-donating groups (EDGs). Changes in the Stokes shifts on substituent effects was observed in various solvents, including DCM, which can be explained by a large change in the molecular dipole moment in the excited state. Therefore, the ICT process was evaluated further by the relationship between the Stokes shifts in various solvents and the Lippert–Mataga equation. Using the slope values in Lippert–Mataga equation, the estimated dipole moment change (Δμ) for 3a–3d was 35.1, 36.6, 43.1, and 46.8 D, respectively (Table S2†). The Δμ values increased gradually with increasing electron-donating power of the substituents, which correlates with the sloping trend of the Lippert–Mataga plot. As shown in Fig. S14 and S15,† its slope appears steeper in the order of 3a < 3b < 3c < 3d, indicating that the dipolar structure affected by the substituent is favorable for ICT control.
The fluorescence quantum yields (ΦF) of 3a–3d range from 27–96%, indicating a significant decrease with increasing electron-donating power of the substituents. The fluorescence lifetimes (τF) decay with a single exponential function, with a fitting value of 4–5 ns in DCM (Fig. S16†). These results can be explained by the radiative and nonradiative decay rate constants (kr and knr) using the relationship between the ΦF and τF values. The kr value decreased gradually with increasing electron-donating ability of the substituent, while the knr value increased rapidly, resulting in a very low ΦF value. According to the energy gap law, this trend means that the ICT excited state relaxed by the electron-donating group facilitates fast nonradiative decay. To understand the intermolecular interactions in the steady-state properties, the obtained emission spectra in the thin film (Fig. S11† left) exhibited red-shifts as compared to spectra obtained in n-Hexane (Fig. S11† right), suggesting that these molecules formed J-aggregates.34
| Compounds | HOMOa (eV) | LUMOb (eV) | Eexg (eV) | HOMOc (eV) | LUMOc (eV) | Ecalg (eV) |
|---|---|---|---|---|---|---|
| a EHOMO (eV) = −e(EOXonset + 5.2).b ELUMO (eV) = −e(Eredonset + 5.3).c Obtained by DFT calculation. | ||||||
| 3a | −5.94 | −3.89 | 2.05 | −4.88 | −2.19 | 2.69 |
| 3b | −5.93 | −3.90 | 2.03 | −4.79 | −2.12 | 2.67 |
| 3c | −5.86 | −3.89 | 1.97 | −4.70 | −2.09 | 2.61 |
| 3d | −5.78 | −3.87 | 1.91 | −4.55 | −2.05 | 2.50 |
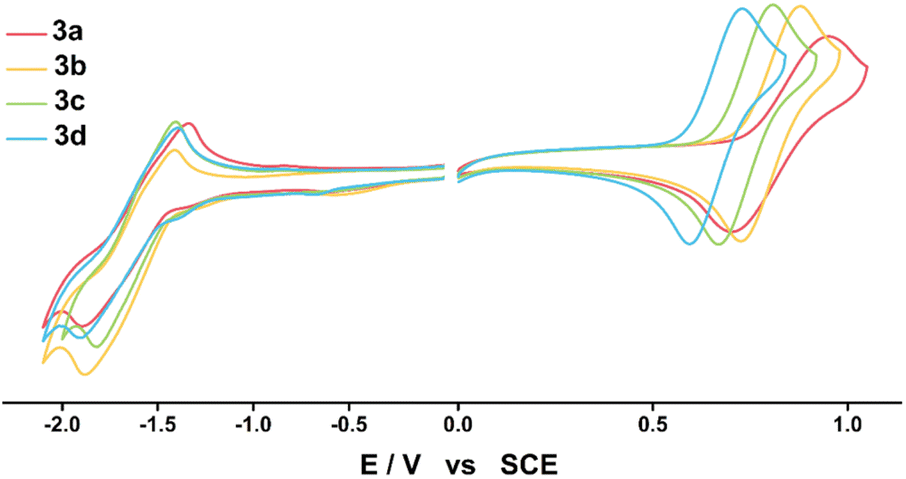 | ||
| Fig. 2 Cyclic voltammograms of 3a–3d in DCM (left) and in THF (right) recorded at room temperature under argon atmosphere (1 mM/0.1 M TBAP/50 mV s−1). | ||
The experimental and calculated EHOMO and ELUMO values were obtained through the above onset potential, with the energy level of the ferrocene/ferrocenium redox couple set to −5.2 eV vs. DCM and −5.3 eV vs. THF,35 considering the solvent condition. The experimental EHOMO and ELUMO values were −5.86 ± 0.08 eV and −3.89 ± 0.02 eV, and the calculated EHOMO and ELUMO values were −4.70 ± 0.18 eV and −2.12 ± 0.07 eV; the experimental values were lower than the calculated EHOMO and ELUMO values for all compounds, but the tendencies were similar. The EHOMO values were influenced more by the electron push–pull substituent effect than the ELUMO values (Fig. S17†). The experimentally estimated ELUMO values were similar for all compounds due to the same triazine acceptor, indicating that the LUMO levels are mainly determined by the electron acceptor rather than the electron donor. In addition, the experimentally determined bandgaps (Eexg) were 2.05, 2.03, 1.97, and 1.91 eV for 3a–3d, respectively, showing that the bandgaps widen as the electron-withdrawing property of the substituents increase. The theoretically determined bandgaps (Ecalg) for 3a–3d from DFT calculations were 2.69, 2.67, 2.61, and 2.50 eV, respectively, and this trend agreed well with experimental bandgaps. These results show that an increase in the electron-donating ability destabilizes the HOMO levels more than the LUMO levels, thereby narrowing the bandgap and causing a red-shift from 3a to 3d in the ICT absorption spectra. Encouraged by the reversible and adjustable HOMO energy level of the electrochemical process for neutral species DPA(R)–Peri–TRZ, the radical species of 3a–3d were expected to exhibit electron push–pull effects, which will be discussed further in a later section.
Radical species studies
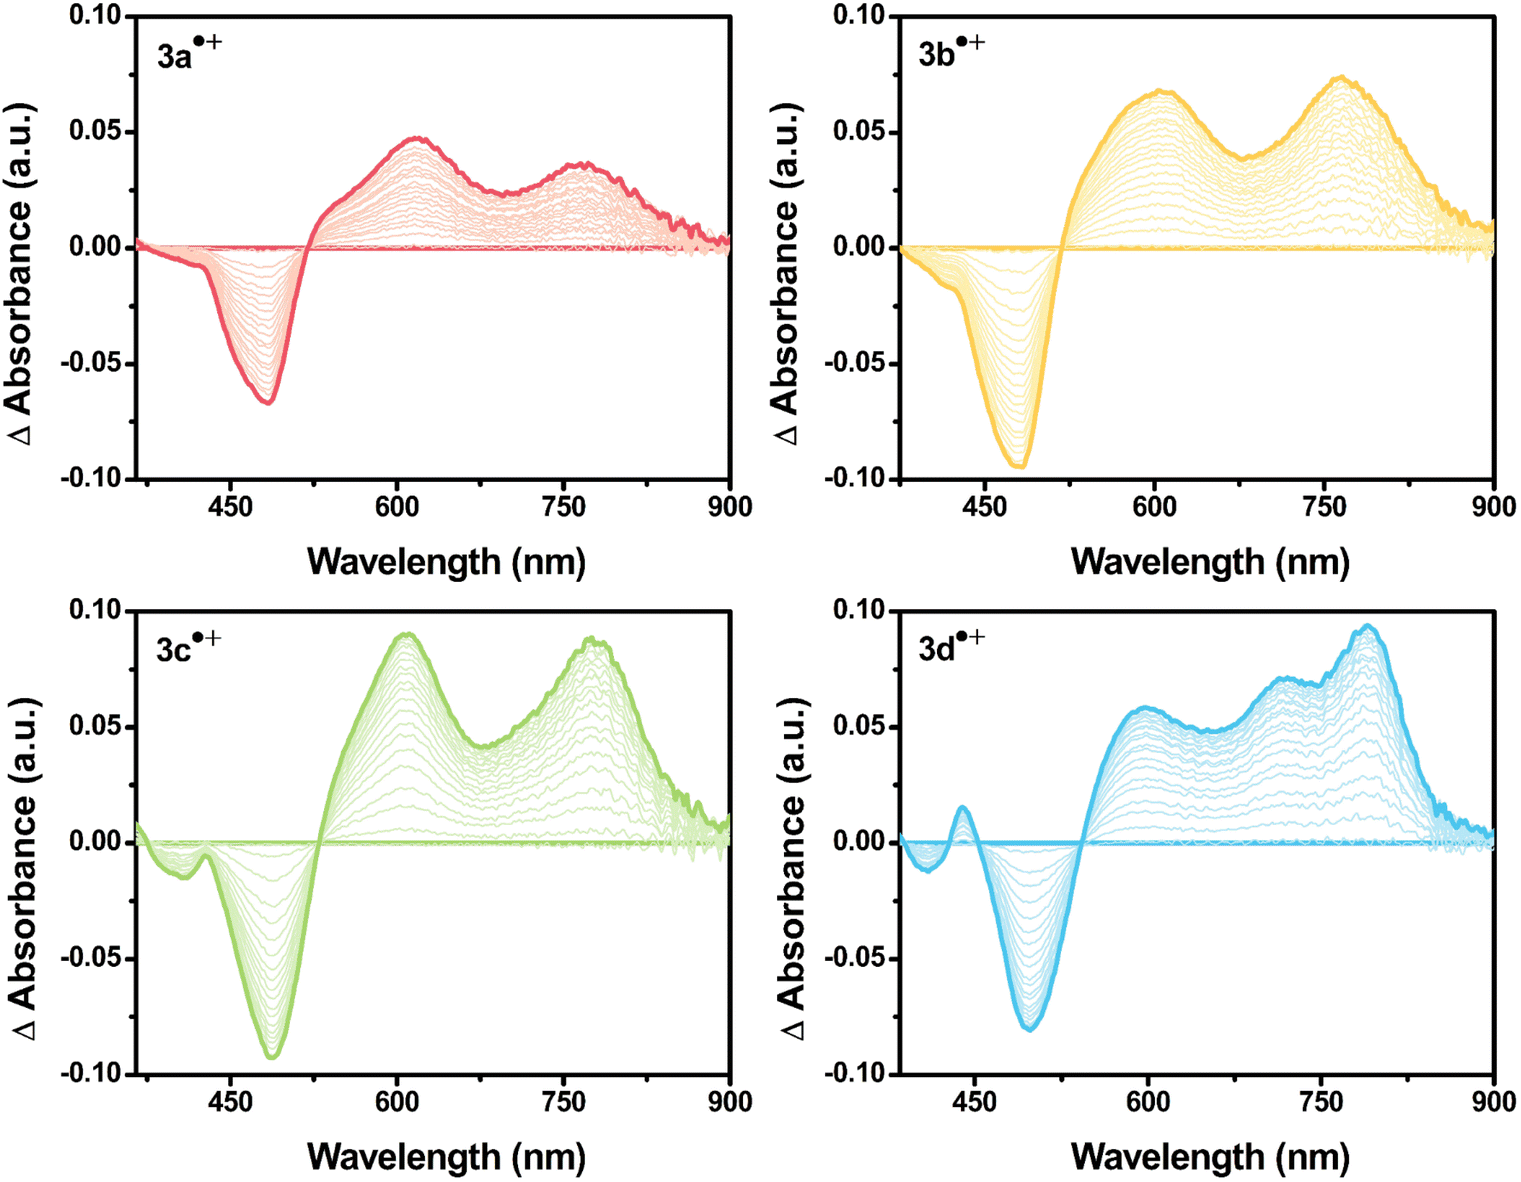 | ||
| Fig. 3 UV-vis absorption spectral change of 3a˙+–3d˙+ formed during the electrochemical oxidation from neutral to radical cation (0.1 mM/0.1 M TBAP/DCM). | ||
Upon applying positive potentials, the spectral changes were observed in the visible region resulting from the oxidation of DPA(R)–Peri–TRZ to (DPA(R)–Peri–TRZ)˙+. As the positive potential (0.95 V) was applied to 3a, (0.88 V) to 3b, (0.81 V) to 3c, and (0.75 V) to 3d, progressive disappearance between 360–540 nm was observed, giving way to an increase in new absorptions in the range of 550–850 nm through the isosbestic points. Hence, a gradual decrease in ICT absorption and concomitant strong radical species visible absorption in the long-wavelength region appeared when 3a–3d was subjected to one-electron oxidation (Fig. S19†). In addition, the occurrence of isosbestic points in multiple wavelengths confirmed the coexistence of only the perylene-based D–π–A dyes and the radical cationic species electrochemically generated and the stability of the radical cationic species.38 For the newly generated broad absorption peak upon mono-oxidation, the peak at around 550–740 nm was attributed to overlaps of typical local perylene radical cation39,40 (Peri˙+) and triarylamine radical cation41,42 (TAA(R)˙+), and the peak at around 740–850 nm was attributed to delocalized diarylamine perylene radical cation (DPA(R)–Peri)˙+ (Fig. 3 and S20†). The substituent effects of the R group attached to the DPA donor influence the rising absorption peaks of the localized Peri˙+ and TAA(R)˙+ mixed species and the delocalized (DPA(R)–Peri)˙+ species. The rising peak of (DPA(R)–Peri)˙+, which appears upon the oxidation of 3a–3d, led to a spectral shift and an increase in ΔAbs according to the change from EWG to EDG. The ΔAbs intensities were determined by the interval between the 0 s and 60 s time points based on the time point of 60 s showing the greatest ΔAbs under a constant potential for 60 s. All (DPA(R)–Peri)˙+ peaks exhibited the characteristic spectral red-shift in the order of 3a˙+ (765 nm) < 3b˙+ (766 nm) < 3c˙+ (776 nm) < 3d˙+ (791 nm). The ΔAbs intensities of that wavelength for each were 0.036, 0.074, 0.089, and 0.094 for 3a˙+–3d˙+, showing a progressively increasing trend that is in good agreement with the substituent effect (Fig. 4 top). This is because the stabilization of DPA(R)˙+ by the electron push–pull effect equipped with a delocalization system to perylene accelerates the formation of radical species. In contrast to the (DPA(R)–Peri)˙+ absorption, the trend for the rising peak of the overlapping Peri˙+ and TAA(R)˙+ absorption is unclear, given that it exhibits neither a gradual spectral shift nor an increase in ΔAbs within the influence of the introduced substituents. For 3a˙+–3c˙+, the peak positions of the overlapped absorption mix of Peri˙+ and TAA(R)˙+ were 621, 616, and 612 nm and the ΔAbs intensities for each position were 0.047, 0.067, and 0.090. In contrast to the 3a˙+–3c˙+, for 3d˙+, the spectral shape with overlapping absorptions of the Peri˙+ and TAA(R)˙+ was different in the 590–725 nm range. The ΔAbs intensities for each position within the 590–725 nm range were 0.058 and 0.071, which, unlike the (DPA(R)–Peri)˙+ absorption properties, did not fit well with the overall electron push–pull trend (Fig. 4 bottom). These unexpected absorption properties for 3d˙+ were extrapolated to arise from the nitrogen radical cation (N˙+) from the donor, which is affected by the substituted OMe donor group. This suggests that compared to the 3a˙+–3c˙+, the distinctive spectral properties of 3d˙+ induce a deviation from the trend for the electronic effect to the R group going from EWG to EDG.
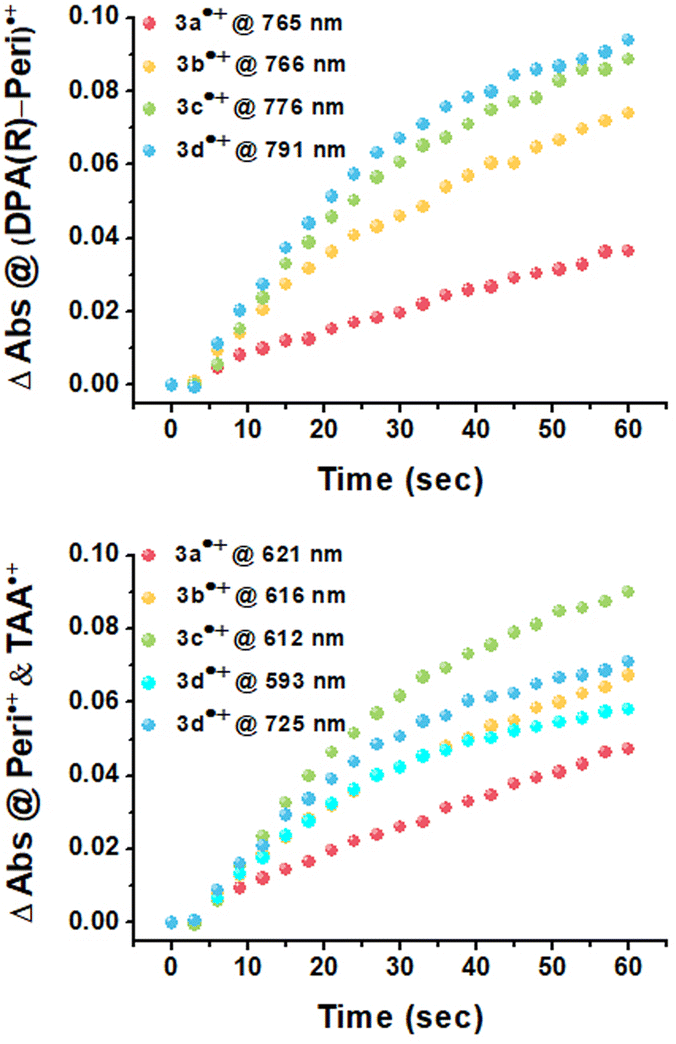 | ||
| Fig. 4 Formation kinetics for (DPA(R)–Peri)˙+ absorption (top) and overlapped Peri˙+ and TAA(R)˙+ absorption (bottom) of 3a˙+–3d˙+. | ||
Theoretical investigations
The overall trend for 3a˙+–3d˙+ were further supplemented by DFT and TD-DFT calculations to corroborate the radical-based electronic effect induced by the R group. The ωB97XD DFT method provided some useful qualitative insights rather than quantitative analysis of experimental results. The simulated UV-vis absorption spectra of radical species reproduce the experimentally observed bands of SEC (Fig. S26–S33, Table S14, S16, S18, S20, S23, S25, S27, and S29†). The simulated absorption spectra for 3a˙+–3d˙+ were reproduced at approximately 630–650 nm for overlapped Peri˙+ and TAA(R)˙+ and approximately 930–1090 nm for (DPA(R)–Peri)˙+ (Table 3). For 3a˙+–3d˙+, the absorption band from 630–650 nm primarily involved the SOMO(A) → LUMO(A) transition that moved from (N–Peri)˙+ to Peri˙+ as the electron escaped from Peri and TAA(R) (Fig. S34†). For the absorption band from 930–1090 nm, 3a˙+ and 3b˙+ primarily involved the HOMO–2(B) → SOMO(B) and HOMO–1(B) → SOMO(B) transitions, respectively, and both transitions move from TRZ to (N–Peri)˙+ as the electron exits DPA(R)–Peri (Fig. 5). In contrast, 3c˙+ and 3d˙+ with electron donating group mainly involved the HOMO(B) → SOMO(B) transitions, which moved from (DPA–Peri)˙+ to (N–Peri)˙+ as the electron escaped from DPA–Peri (Fig. 5). Interestingly, the SOMO(A) and SOMO(B) of the 3d˙+ are more expanded to the DPA donor containing an oxygen atom, unlike 3a˙+–3c˙+. Overall, the transition origin of 3a˙+–3d˙+ indicates that the electronic effect between DPA and Peri is influenced indirectly by the R group bound to DPA, leading to fine control of the SEC absorption properties following the substituent effect. Based on the rationale that the transition origin of radical cationic species is affected by substituent effects directly or indirectly, further calculations for the transition of radical anionic species were performed. The simulated absorption spectra for 3a˙−–3d˙− were reproduced at approximately 680 nm for (Peri–TRZ)˙−. These absorption bands mainly involved the HOMO(B) → LUMO+1(B) transition that moved from Peri˙− to Peri˙− and to some TRZ˙− as the electron is added to (Peri–TRZ)˙− (Fig. S35†). As a result, the transition origin of the radical anionic species is generally similar due to the insignificant effect of the electron push–pull effect on the introduced R group. This further supports that radical anionic species, in contrast to radical cationic species, exert only a minor influence on the R group effect. This is also demonstrated by a comparison of the DFT spin density calculations, where the 3a˙+–3d˙+ are delocalized mainly in the DPA(R)–Peri, whereas the 3a˙−–3d˙− are delocalized in the Peri–TRZ excluding the DPA and R group (Fig. S36†). Expanding from this point of view, the interpretation of the transition of radical species to the excited state suggests that the introduction of substituents is key to the fine control of radical species. Therefore, the radical cationic/anionic properties can be modulated by introducing the substituents into the donors/acceptors, which are redox centers, respectively.| Compounds | λabsmaxa (nm) | λabsmaxb (nm) | λcalcdmaxc (oscillator strength) (nm) | λcalcdmax d (oscillator strength) (nm) | Most dominant contributions c | Most dominant contributions d |
|---|---|---|---|---|---|---|
| a Experimental absorption maximum for the localized Peri˙+ and TAA(R)˙+ mixed band in DCM at room temperature (RT).b Experimental absorption maximum for the delocalized (DPA(R)–Peri)˙+ band in DCM at room temperature (RT).c Calculated absorption maximum for the localized Peri˙+ and TAA(R)˙+ mixed band in vacuum.d Calculated absorption maximum for the delocalized (DPA(R)–Peri)˙+ band in vacuum. | ||||||
| 3a˙+ | 621 | 765 | 640 (0.3426) | 943 (0.3097) | SOMO(A) → LUMO(A) | HOMO–2(B) → SOMO(B) |
| 3b˙+ | 616 | 766 | 637 (0.3463) | 932 (0.3019) | SOMO(A) → LUMO(A) | HOMO–1(B) → SOMO(B) |
| 3c˙+ | 612 | 776 | 639 (0.3358) | 975 (0.3301) | SOMO(A) → LUMO(A) | HOMO(B) → SOMO(B) |
| 3d˙+ | 593, 725 | 791 | 648 (0.2803) | 1085 (0.3624) | SOMO(A) → LUMO(A) | HOMO(B) → SOMO(B) |
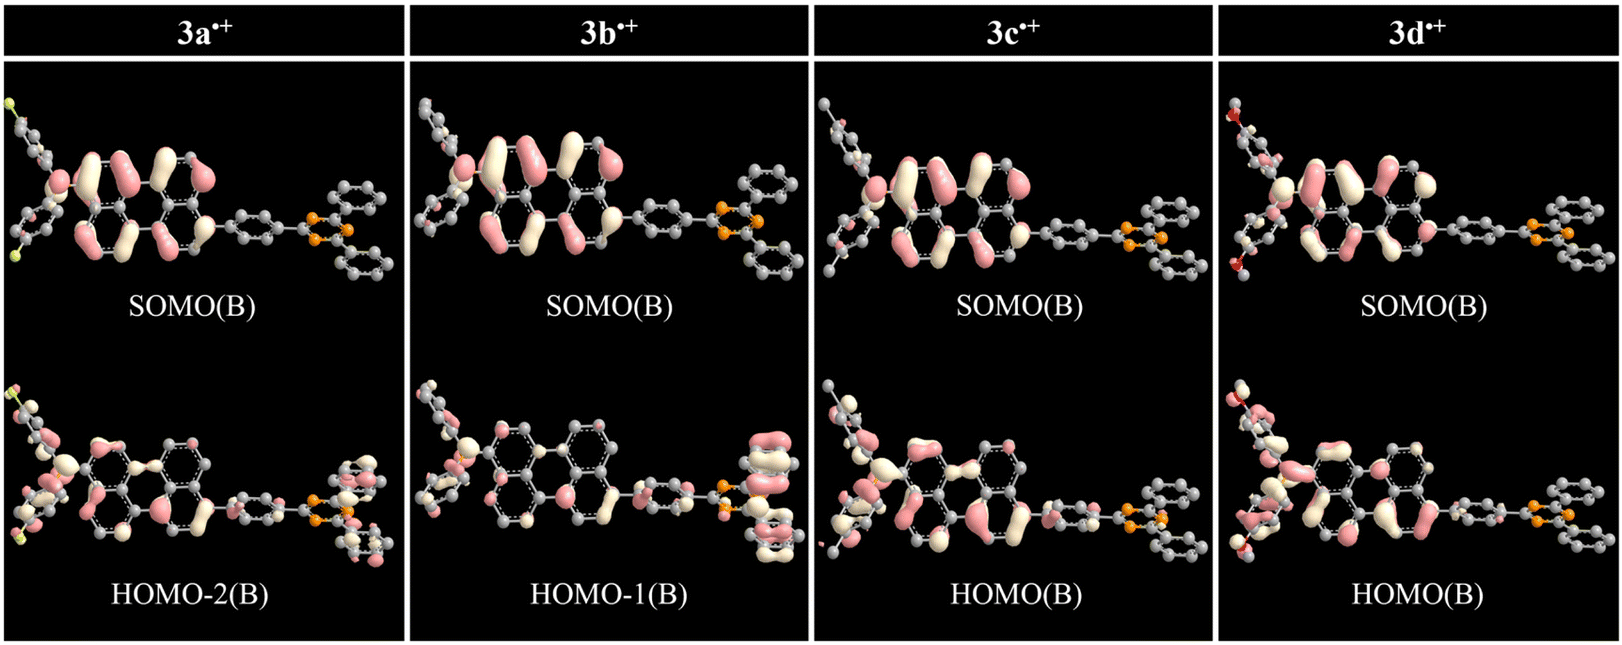 | ||
| Fig. 5 Frontier orbital distributions and transition origin of 3a˙+–3d˙+ calculated by DFT/ωB97XD/6-31+G(d). | ||
The redox-activity of the radical species induced by perylene-based D–π–A involved in the vertical ionization potential (IP) and vertical electron affinity (EA). The changes in the value of IP and EA, especially large changes in the case of IP, explicitly show substituent effects on radical cationic species generated by oxidation (Table S30†). More specifically, to visually distinguish the molecular orbital diagrams and energy level of radical species, the calculated SOMO energy level in the radical cationic/anionic species was compared depending on substituent effects. A clear relationship was observed between the SOMO energy levels and the Hammett constants of the substituents (σp). As shown in Fig. 6, compared to the radical anionic SOMO energy level, the radical cationic SOMO energy level had a large change in slope. This indicates that the radical cationic SOMO energy level is more sensitive to the electron push–pull effect of the substituents than the radical anionic SOMO energy level. In addition, the derived SOMO orbital distribution shows that the radical species are stabilized by the extended π-conjugation with perylene. In particular, the radical cationic SOMO orbital is distributed on (N–Peri)˙+ and the radical anionic SOMO orbital is distributed on (Peri–TRZ)˙−, so that unstable N˙+ and TRZ˙− are stabilized by delocalization to perylene. These computational predictions provide important insights into the range of the SOMO level variability in radical cationic/anionic species with substituent groups.
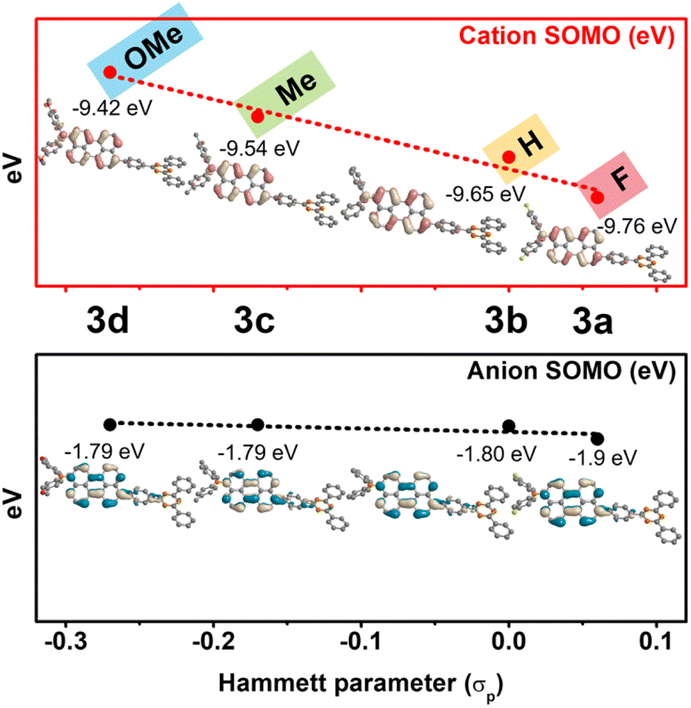 | ||
| Fig. 6 Correlation diagram for the SOMO energy level versus the Hammett constants on 3a˙+–3d˙+ (red) and 3a˙−–3d˙− (black). | ||
Conclusions
The donor–π–acceptor (D–π–A) structure compound using perylene as a π-bridge was designed to fully investigate the substituent effects on both neutral and radical species. The compounds, DPA(R)–Peri–TRZ (R = F, H, Me, and OMe), 3a–3d were synthesized using the oxidable substituted donors (diphenylamine (DPA), R = F, H, Me, and OMe) and reducible acceptor (2,4,6-triphenyl-1,3,5-triazine (TRZ)) to derive the redox properties. First, the properties of the neutral species were investigated, followed by radical species. For the neutral species DPA(R)–Peri–TRZ, the ICT properties and HOMO–LUMO band gap was controlled effectively by the substituents. In particular, the adjusted bandgap by changing the HOMO level allowed an examination of the effect of substituents on radical species. The SEC studies were performed by electrochemically inducing the two radical species: radical cationic species (DPA(R)–Peri–TRZ)˙+ through oxidation and anionic species (DPA(R)–Peri–TRZ)˙− through reduction could be observed. The radical anionic species generated from the acceptor showed no significant change according to the substituent, but the radical cationic species generated from the donor showed a spectral shift and an increase in Δabsorbance from the electron-withdrawing group (F) to -donating group (OMe). Radical species, 3a˙+–3d˙+, showed new absorptions not seen in the absorption spectra of the neutral species.The effects of controlling the substituents, including neutral to radical species, were verified experimentally and theoretically. Moreover, the trends of both experimental and theoretical data were consistent. As a result of comparative analysis of the transition origin of the absorption peak newly appearing during radical formation through the doublet state calculation, it has been suggested that the properties of the radical species may also be finely tuned through substituent effects at the molecular level. The Hammett correlation presented here provides a means to predict the impact of the substituent in tuning the SOMO level on the radical-based electronic properties. Further exploration of excited states is currently underway based on molecular properties observed in DPA(R)–Peri–TRZ, and it is anticipated that our findings will contribute to the diversification of controllable radical substances.
Experimental section
General
Based on standard Schlenk techniques, all of the synthesis experimental procedures were performed under a dry argon condition. Reagents and solvents were purchased from commercial sources and used as received without further purification, unless otherwise stated. All steps of synthesis were monitored using thin layer chromatography (TLC) on silica gel-precoated glass plates. Flash column chromatography was performed with silica gel 60 G (230–400 mesh). The synthesized compounds were characterized by 1H-NMR or 13C{1H}-NMR, and elemental analysis. The 1H and proton-decoupled 13C spectra were recorded on a Bruker500 spectrometer operating at 500 and 125 MHz, respectively, and all proton and carbon chemical shifts were measured relative to internal residual chloroform (99.5% CDCl3) from the lock solvent. The elemental analyses (C, H, N, O) were performed using Thermo Fisher Scientific Flash 2000 series analyzer. The GC-MS analysis was performed using a highly sensitive Gas Chromatograph/Mass Selective Detector spectrometer (Agilent, 7890B–5977B GC/MSD). The 3-bromoperylene,43 N,N-bis(4′-fluorophenyl)amino44 (1a), diphenylamine44 (1b), N,N-bis(4′-methylphenyl)amino44 (1c), and N,N-bis(4′-methoxyphenyl)amino44 (1d) were prepared based on the previously published method.:1, 75 mL) was refluxed under argon at 110 °C for overnight. After cooling to RT, deionized water (50 mL) was poured, and organic layer was separated using a separating funnel. The water layer was washed using DCM (×3) for the extracted remained organic residue. After combined all of the organic solvents, the organic layer was dried over anhydrous MgSO4, and then filtered off. The solvent was removed under reduced pressure, and the residue was purified by silica gel column chromatography using DCM/n-Hexane mixture eluent. Finally, 3-(2,4,6-triphenyl-1,3,5-triazine)-9-bis(N,N-bis(4′-(R)-phenyl)amino)perylene compounds were further purified by using n-Hexane hot filter washing.:3). Orange powder (0.6 g, Yield: 83%). 1H-NMR (500 MHz, CDCl3, ppm) δ 8.92 (d, J = 8.5 Hz, 2H), 8.83 (dd, J = 8.0, 1.5 Hz, 4H), 8.25 (d, J = 7.5 Hz, 1H), 8.21 (t, J = 8.0 Hz, 3H), 7.86 (d, J = 8.5 Hz, 1H), 7.78 (d, J = 8.5 Hz, 1H), 7.76 (d, J = 8.0 Hz, 2H), 7.65–7.59 (m, 6H), 7.53 (d, J = 8.0 Hz, 1H), 7.48 (t, J = 7.5 Hz, 1H), 7.40 (t, J = 7.5 Hz, 1H), 7.26 (d, J = 8.0 Hz, 1H), 7.04–7.00 (m, 4H), 6.94 (t, J = 9.0 Hz, 4H). 13C{1H} (125 MHz, CDCl3, ppm) δ 171.7 (2C), 171.5, 159.2, 157.3, 145.0, 144.7 (2C), 143.5, 139.1, 136.3, 135.4 (2C), 132.7, 132.5, 132.0, 131.6, 131.3 (2C), 130.8, 130.3, 129.2 (4C), 129.1, 129.0, 128.8, 128.6 (2C), 127.8 (4C), 127.0 (4C), 126.8, 126.1, 124.0, 123.5 (4C), 120.9, 120.7, 119.9, 116.1 (4C). GC-MS (m/z) calcd. for C53H32F2N4: 762.26, found: 762.3 [M]+. Anal. calcd. for C53H32F2N4: C 83.45, H 4.23, N 7.34. Found: C 83.48, H 4.25, N 7.37.:3). Orange powder (0.55 g, Yield: 75%). 1H-NMR (500 MHz, CDCl3, ppm) δ 8.93 (d, J = 8.5 Hz, 2H), 8.84 (dd, J = 8.0, 1.5 Hz, 4H), 8.29–8.20 (m, 4H), 7.87–7.83 (m, 2H), 7.77 (d, J = 8.5 Hz 2H), 7.64–7.59 (m, 6H), 7.54 (d, J = 7.5 Hz, 1H), 7.48 (t, J = 8.5 Hz, 1H), 7.41–7.37 (m, 1H), 7.35 (dd, J = 8.0, 2.0 Hz, 1H), 7.24 (t, J = 7.0 Hz, 4H), 7.11 (d, J = 7.5 Hz, 4H), 6.98 (t, J = 7.5 Hz, 2H). 13C{1H} (125 MHz, CDCl3, ppm) δ 171.7 (2C), 171.4, 148.2 (2C), 145.1, 143.5, 139.2, 139.0, 136.2, 135.4 (2C), 132.7, 132.5, 132.1, 131.9, 130.3, 129.2 (4C), 129.1 (4C), 129.0, 128.8, 128.6 (2C), 127.8 (4C), 127.0 (4C), 126.8, 126.3, 125.7, 124.2, 122.1 (4C), 121.1, 121.0, 120.8, 120.7, 120.4, 120.0, 119.8. GC-MS (m/z) calcd. for C53H34N4: 726.28, found: 726.5 [M]+. Anal. calcd. for C53H34N4: C 87.58, H 4.71, N 7.71. Found: C 87.50, H 4.77, N 7.73.:4). Orange powder (0.37 g, Yield: 51%). 1H-NMR (500 MHz, CDCl3, ppm) δ 8.91 (d, J = 8.0 Hz, 2H), 8.82 (dd, J = 8.0, 1.5 Hz, 4H), 8.23–8.19 (m, 4H), 7.86 (d, J = 4.5 Hz, 1H), 7.84 (d, J = 4.5 Hz, 1H), 7.76 (d, J = 8.5 Hz, 2H), 7.64–7.58 (m, 6H), 7.52 (d, J = 8.0 Hz, 1H), 7.46 (t, J = 8.5 Hz, 1H), 7.37 (t, J = 8.5 Hz, 1H), 7.29 (d, J = 8.0 Hz, 1H), 7.04 (d, J = 8.5 Hz, 4H), 6.97 (d, J = 8.5 Hz, 4H), 2.30 (s, 6H). 13C{1H} (125 MHz, CDCl3, ppm) δ 171.7 (2C), 171.5, 146.2 (2C), 145.1, 144.0, 143.9, 138.8, 136.2, 135.3 (2C), 132.7, 132.5, 131.9, 131.8, 131.5, 131.3 (2C), 131.1 (2C), 130.3, 130.2, 129.7 (6C), 129.1 (4C), 128.8, 128.7 (2C), 128.2, 127.8 (4C), 127.2, 126.8, 124.4, 122.2 (4C), 121.0, 120.8, 120.5, 119.7, 20.7 (2C). GC-MS (m/z) calcd. for C55H38N4: 754.31, found: 754.4 [M]+. Anal. calcd. for C55H38N4: C 87.50, H 5.07, N 7.42. Found: C 87.56, H 5.00, N 7.44.:5). Red powder (0.35 g, Yield: 50%). 1H-NMR (500 MHz, CDCl3, ppm) δ 8.92 (d, J = 8.5 Hz, 2H), 8.83 (dd, J = 8.5, 1.5 Hz, 4H), 8.23 (d, J = 7.5 Hz, 1H), 8.19 (t, J = 8.0 Hz, 3H), 7.86 (d, J = 4.0 Hz, 1H), 7.85 (d, J = 4.0 Hz, 1H), 7.76 (d, J = 8.0 Hz, 2H), 7.64–7.58 (m, 6H), 7.51 (d, J = 7.5 Hz, 1H), 7.46 (t, J = 8.0 Hz, 1H), 7.36 (t, J = 8.5 Hz, 1H), 7.23 (d, J = 8.0 Hz, 1H), 7.01–6.99 (m, 4H), 6.80 (dd, J = 7.0, 2.0 Hz, 4H), 3.78 (s, 6H). 13C{1H} (125 MHz, CDCl3, ppm) δ 171.7 (2C), 171.5, 154.9 (2C), 145.2, 144.6, 142.6, 138.7, 136.3, 135.3 (2C), 132.7, 132.5, 131.8, 131.6, 131.5, 131.2 (2C), 130.3, 130.2, 129.1 (4C), 128.8, 128.6 (2C), 128.1, 127.8 (4C), 126.8, 126.6 (4C), 126.3, 124.6, 123.7 (4C), 121.0, 120.8, 120.5, 119.5, 114.6 (4C), 55.5 (2C). GC-MS (m/z) calcd. for C55H38N4O2: 786.30, found: 786.4 [M]+. Anal. calcd. for C55H38N4O2: C 83.95, H 4.87, N 7.42, O, 4.07. Found: C 83.90, H 4.89, N 7.10, O, 4.11.Spectroscopic measurements
The UV-vis absorption spectra were recorded using a Scinco Mega-2100 spectrophotometer in dual beam mode, and the fluorescence emission measurements were carried out using Shimadzu fluorometer (RF-6000) with a wavelength resolution of ∼1 nm. Fluorescence lifetimes were measured by PicoQuant FluoTime 200 that takes advantage of the time-correlated single photon counting method. A pulsed diode laser operated at 20 MHz repetition rate was used as the excitation source. The FWHM of a laser pulse was typically 45 ps, and the instrument response function was ∼190 ps when the Hamamatzu photomultiplier tube (H5783-01) was used. The emission quantum yields (ΦPL) were calculated using William's comparative method for samples of four different concentrations of (0.4–1) μM, using perylene (ϕPL = 0.94, n-Hexane) as a reference standard.45Cyclic voltammetry (CV)
A CH Instruments 701D potentiate was used for electrochemical measurements, and cyclic voltammetry (CV) was performed in an electrolytic solution prepared using 1 mM of electroactive compounds and 0.1 M tetra-n-butylammonium perchlorate (NBu4ClO4) in deoxygenated DCM and THF. A three-electrode configuration, glassy carbon, platinum wire, and SCE, were used as working, counter, and reference electrodes, respectively. The scanning rate was 50 mV s−1.Spectroelectrochemical (SEC) measurements
Measurements were carried out using a custom-made, optically transparent, thin-layer electrochemical cell (light pass length = 1 mm) equipped with a platinum mesh working electrode and a platinum coil counter electrode, and an SCE was used as the reference electrode. The electrodes were placed into the DPA(R)–Peri–TRZ solution with 0.1 M NBu4ClO4. Potentials were applied using a commercial electrochemical analyzer (CH Instruments 701D potentiostat). The electrochemical analyzer controlled the potential of the working electrode, and a Scinco Nano-MD UV-vis spectrophotometer obtained the absorption spectra of the redox species. The absorption spectra of the samples were recorded about every 3 s over a period of 60 s with the potential induced spectral evolution.Computational details
Density functional theory (DFT) calculations of the neutral forms 3a–3d and the radical forms 3a˙−–3d˙− and 3a˙+–3d˙+ were performed by using Gaussian’16 software package. Full geometry optimizations in their ground state were performed using B3LYP/6-31G(d,p) (for 3a–3d) and ωB97XD/6-31+G(d) (for 3a˙−–3d˙− and 3a˙+–3d˙+) level theory for all atoms. The excitation energies and oscillator strengths for singlet–singlet and doublet–doublet electronic transitions at the optimized geometry in the ground state were obtained in time-dependent DFT (TD-DFT) calculations using the same basis set and functional as for the ground state. All Isodensity plots of the frontier orbitals were visualized by Chem3D Ultra and GaussView software. More detail DFT/TD-DFT calculation results for 3a–3d, 3a˙−–3d˙−, and 3a˙+–3d˙+ were described in ESI.†Conflicts of interest
The authors declare no competing financial interest.Acknowledgements
This research was supported by the Basic Science Research Program through the National Research Foundation of Korea (NRF-2020R1C1C1009007) and Korea Basic Science Institute (National Research Facilities and Equipment Center) grant funded by the Ministry of Education (2020R1A6C103A028).Notes and references
- I. Ratera and J. Veciana, Playing with organic radicals as building blocks for functional molecular materials, Chem. Soc. Rev., 2012, 41, 303–349 RSC.
- X. Ai, E. W. Evans, S. Dong, A. J. Gillett, H. Guo, Y. Chen, T. J. Hele, R. H. Friend and F. Li, Efficient radical-based light-emitting diodes with doublet emission, Nature, 2018, 563, 536–540 CrossRef CAS PubMed.
- A. Zhang, W. Jiang and Z. Wang, Fulvalene-Embedded Perylene Diimide and Its Stable Radical Anion, Angew. Chem., Int. Ed., 2020, 59, 752–757 CrossRef CAS PubMed.
- Z. Chen, Y. Li and F. Huang, Persistent and stable organic radicals: design, synthesis, and applications, Chem, 2021, 7, 288–332 CAS.
- L. Ji, J. Shi, J. Wei, T. Yu and W. Huang, Air-Stable Organic Radicals: New-Generation Materials for Flexible Electronics?, Adv. Mater., 2020, 32, 1908015 CrossRef CAS PubMed.
- M. Ito, S. Shirai, Y. Xie, T. Kushida, N. Ando, H. Soutome, K. J. Fujimoto, T. Yanai, K. Tabata and Y. Miyata, Fluorescent Organic π-Radicals Stabilized with Boron: Featuring a SOMO–LUMO Electronic Transition, Angew. Chem., Int. Ed., 2022, 61, e202201965 CAS.
- C. Simão, M. Mas-Torrent, N. Crivillers, V. Lloveras, J. M. Artés, P. Gorostiza, J. Veciana and C. Rovira, A robust molecular platform for non-volatile memory devices with optical and magnetic responses, Nat. Chem., 2011, 3, 359–364 CrossRef PubMed.
- G. I. Likhtenstein, K. Ishii and S. i. Nakatsuji, Dual Chromophore-Nitroxides: Novel Molecular Probes, Photochemical and Photophysical Models and Magnetic Materials, J. Photochem. Photobiol., 2007, 83, 871–881 CrossRef CAS PubMed.
- N. B. Yapici, S. Jockusch, A. Moscatelli, S. R. Mandalapu, Y. Itagaki, D. K. Bates, S. Wiseman, K. M. Gibson, N. J. Turro and L. Bi, New rhodamine nitroxide based fluorescent probes for intracellular hydroxyl radical identification in living cells, Org. Lett., 2012, 14, 50–53 CrossRef CAS PubMed.
- Y. Hattori, T. Kusamoto and H. Nishihara, Luminescence, stability, and proton response of an open-shell (3, 5-dichloro-4-pyridyl) bis (2, 4, 6-trichlorophenyl) methyl radical, Angew. Chem., Int. Ed., 2014, 126, 12039–12042 CrossRef.
- Y. Hattori, S. Kimura, T. Kusamoto, H. Maeda and H. Nishihara, Cation-responsive turn-on fluorescence and absence of heavy atom effects of pyridyl-substituted triarylmethyl radicals, Chem. Comm., 2018, 54, 615–618 RSC.
- C. Huang, S. Barlow and S. R. Marder, Perylene-3, 4, 9, 10-tetracarboxylic acid diimides: synthesis, physical properties, and use in organic electronics, J. Org. Chem., 2011, 76, 2386–2407 CrossRef CAS PubMed.
- T. Huang, A. Zhang, N. Xue, W. Jiang and Z. Wang, Dicyanopentafulvene-fused perylene diimide and its stable radical anion, Dyes Pigm., 2021, 193, 109489 CrossRef CAS.
- S. Suzuki, Y. Matsumoto, M. Tsubamoto, R. Sugimura, M. Kozaki, K. Kimoto, M. Iwamura, K. Nozaki, N. Senju and C. Uragami, Photoinduced electron transfer of platinum(ll) bipyridine diacetylides linked by triphenylamine- and naphthaleneimide-derivatives and their application to photoelectric conversion systems, Phys. Chem. Chem. Phys., 2013, 15, 8088–8094 RSC.
- E. R. Bittner, V. Lankevich, S. Gélinas, A. Rao, D. A. Ginger and R. H. Friend, How disorder controls the kinetics of triplet charge recombination in semiconducting organic polymer photovoltaics, Phys. Chem. Chem. Phys., 2014, 16, 20321–20328 RSC.
- E. P. Tomlinson, M. E. Hay and B. W. Boudouris, Radical polymers and their application to organic electronic devices, Macromolecules, 2014, 47, 6145–6158 CrossRef CAS.
- D. Schmidt, D. Bialas and F. Würthner, Ambient Stable Zwitterionic Perylene Bisimide-Centered Radical, Angew. Chem., Int. Ed., 2015, 127, 3682–3685 CrossRef.
- B. Tang, J. Zhao, J.-F. Xu and X. Zhang, Tuning the stability of organic radicals: from covalent approaches to non-covalent approaches, Chem. Sci., 2020, 11, 1192–1204 RSC.
- Z. Sun and J. Wu, Open-shell polycyclic aromatic hydrocarbons, J. Mater. Chem., 2012, 22, 4151–4160 RSC.
- Q. Chen, M. Baumgarten, M. Wagner, Y. Hu, I. C. Y. Hou, A. Narita and K. Müllen, Dicyclopentaannelated Hexa-peri-hexabenzocoronenes with a Singlet Biradical Ground State, Angew. Chem., Int. Ed., 2021, 60, 11300–11304 CrossRef CAS PubMed.
- W. Zeng, Q. Qi and J. Wu, Toward long rylene ribbons and quinoidal rylene diradicaloids, Eur. J. Org. Chem., 2018, 2018, 7–17 CrossRef CAS.
- R. Renner, M. Stolte, J. Heitmüller, T. Brixner, C. Lambert and F. Würthner, Substituent-dependent absorption and fluorescence properties of perylene bisimide radical anions and dianions, Mater. Horiz., 2022, 9, 350–359 RSC.
- Y. Zhao, X. Li, Z. Wang, W. Yang, K. Chen, J. Zhao and G. G. Gurzadyan, Precise Control of the Electronic Coupling Magnitude between the Electron Donor and Acceptor in Perylenebisimide Derivatives via Conformation Restriction and Its Effect on Photophysical Properties, J. Phys. Chem. C, 2018, 122, 3756–3772 CrossRef CAS.
- P. Mayorga Burrezo, W. Zeng, M. Moos, M. Holzapfel, S. Canola, F. Negri, C. Rovira, J. Veciana, H. Phan and J. Wu, Perylene π-Bridges Equally Delocalize Anions and Cations: Proportioned Quinoidal and Aromatic Content, Angew. Chem., Int. Ed., 2019, 58, 14467–14471 CrossRef CAS PubMed.
- Y. Li and Z. Wang, Bis-N-annulated quaterrylene: an approach to processable graphene nanoribbons, Org. Lett., 2009, 11, 1385–1387 CrossRef CAS PubMed.
- Y. Li, L. Hao, H. Fu, W. Pisula, X. Feng and Z. Wang, Columnar liquid crystalline bis-N-annulated quaterrylenes, ChemComm, 2011, 47, 10088–10090 RSC.
- P. Michel, A. Moradpour, P. Penven, L. Firlej, P. Bernier, B. Levy, S. Ravy and A. Zahab, Ring-strain-modified properties of substituted perylene radical cation salts. A solid-state carbon-13 CPMAS NMR study, J. Am. Chem. Soc., 1990, 112, 8285–8292 CrossRef CAS.
- C.-L. Liu, C.-J. Zheng, X.-K. Liu, Z. Chen, J.-P. Yang, F. Li, X.-M. Ou and X.-H. Zhang, Multifunctional terpyridine/diphenylamine derivatives as highly efficient blue fluorescent emitters and red phosphorescent hosts, J. Mater. Chem. C, 2015, 3, 1068–1076 RSC.
- S. Jhulki and J. N. Moorthy, Small molecular hole-transporting materials (HTMs) in organic light-emitting diodes (OLEDs): structural diversity and classification, J. Mater. Chem. C, 2018, 6, 8280–8325 RSC.
- H. L. Lee, K. H. Lee and J. Y. Lee, Indoloindole as a new building block of a hole transport type host for stable operation in phosphorescent organic light-emitting diodes, J. Mater. Chem. C, 2019, 7, 5988–5994 RSC.
- Y. Zhang, Y. Zheng, B. Wang, H. Ran, X. Wang, J.-Y. Hu and Q. Wang, Diphenylamine/triazine hybrids as bipolar hosts for phosphorescent organic light-emitting diodes, J. Mater. Chem. C, 2020, 8, 4461–4468 RSC.
- M. Ahn, M.-J. Kim and K.-R. Wee, Electron Push–Pull Effects in 3,9-Bis(p-(R)-diphenylamino)perylene and Constraint on Emission Color Tuning, J. Org. Chem., 2019, 84, 12050–12057 CrossRef CAS PubMed.
- M. Ahn, M.-J. Kim, D. W. Cho and K.-R. Wee, Electron Push–Pull Effects on Intramolecular Charge Transfer in Perylene-Based Donor–Acceptor Compounds, J. Org. Chem., 2021, 86, 403–413 CrossRef CAS PubMed.
- S.-Y. Kim, J.-D. Lee, Y.-J. Cho, M. R. Son, H.-J. Son, D. W. Cho and S. O. Kang, Excitation spectroscopic and synchronous fluorescence spectroscopic analysis of the origin of aggregation-induced emission in N,N-diphenyl-1-naphthylamine-o-carborane derivatives, Phys. Chem. Chem. Phys., 2018, 20, 17458–17463 RSC.
- N. G. Connelly and W. E. Geiger, Chemical redox agents for organometallic chemistry, Chem. Rev., 1996, 96, 877–910 CrossRef CAS PubMed.
- P. Rapta, K. R. Idzik, V. Lukeš, R. Beckert and L. Dunsch, Alternative charge stabilisation and a changing reactivity of 1,3,5-triazine based starburst compounds as studied by in situ ESR/UV-vis-NIR spectroelectrochemistry, Electrochem. Commun., 2010, 12, 513–516 CrossRef CAS.
- L. Yu, M. Shi, Z. Wang, X. Xing, M. Umair Ali, Y. He and H. Meng, Tuning the UV/Vis Absorption Spectra of Electrochromic Small Molecular Radicals Through Bridge Modulation, ChemPhysChem, 2021, 22, 1684–1691 CrossRef CAS PubMed.
- V. Sharma, U. Puthumana, P. Karak and A. L. Koner, Visible-Light-Triggered Generation of Ultrastable Radical Anion from Nitro-substituted Perylenediimides, J. Org. Chem., 2018, 83, 11458–11462 CrossRef CAS PubMed.
- K. Ueno and N. Kitamura, A spectroelectrochemical study on perylene cation radical in polymer microchannel-microelectrode chips, Analyst, 2003, 128, 1401–1405 RSC.
- F. Cataldo, S. Iglesias-Groth and A. Manchado, Electronic absorption spectroscopy of polycyclic aromatic hydrocarbons (PAHs) radical cations generated in oleum: A superacid medium, Spectrochim. Acta, Part A, 2010, 77, 998–1004 CrossRef PubMed.
- S. Amthor, B. Noller and C. Lambert, UV/Vis/NIR spectral properties of triarylamines and their corresponding radical cations, Chem. Phys., 2005, 316, 141–152 CrossRef CAS.
- K. Sreenath, C. V. Suneesh, V. K. Ratheesh Kumar and K. R. Gopidas, Cu(II)-Mediated Generation of Triarylamine Radical Cations and Their Dimerization. An Easy Route to Tetraarylbenzidines, J. Org. Chem., 2008, 73, 3245–3251 CrossRef CAS PubMed.
- É. Torres, M. N. Berberan-Santos and M. J. Brites, Synthesis, photophysical and electrochemical properties of perylene dyes, Dyes Pigm., 2015, 112, 298–304 CrossRef.
- A. Tlili, F. Monnier and M. Taillefer, Selective one-pot synthesis of symmetrical and unsymmetrical di- and triarylamines with a ligandless copper catalytic system, ChemComm, 2012, 48, 6408–6410 RSC.
- R. E. Cook, B. T. Phelan, R. J. Kamire, M. B. Majewski, R. M. Young and M. R. Wasielewski, Excimer Formation and Symmetry-Breaking Charge Transfer in Cofacial Perylene Dimers, J. Phys. Chem. A, 2017, 121, 1607–1615 CrossRef CAS PubMed.
Footnotes |
| † Electronic supplementary information (ESI) available. See DOI: https://doi.org/10.1039/d2ra06460j |
| ‡ These authors contributed equally to this work. |
| This journal is © The Royal Society of Chemistry 2023 |