DOI:
10.1039/D2RA05935E
(Paper)
RSC Adv., 2023,
13, 2939-2948
Luminescence nanothermometry using a trivalent lanthanide co-doped perovskite
Received
20th September 2022
, Accepted 6th December 2022
First published on 18th January 2023
Abstract
This study investigates in detail the laser-mediated upconversion emission and temperature-sensing capability of (Ca0.99−aYb0.01Era)TiO3. Samples were prepared at different concentrations to observe the effect of erbium on upconversion while increasing its concentration and keeping all the other parameters constant. Doping is a widespread technological process which involves incorporating an element called a dopant in a lower ratio to the host lattice to derive hybrid materials with desired properties. The (Ca0.99−aYb0.01Era)TiO3 perovskite nanoparticles were synthesized via a sol–gel technique. The frequency upconversion was performed using a 980 nm laser diode excitation source. X-ray diffractometry (XRD) confirmed that the synthesized samples are crystalline in nature and have an orthorhombic structure. The temperature-sensing ability was examined using the fluorescence intensity ratio (FIR) algorithm of two emission bands (2H11/2 → 4I15/2 and 4S3/2 → 4I15/2) of the Er3+ ion. Temperature-dependent upconversion luminescence is observed over a broad temperature range of 298–623 K. The maximum sensor sensitivity obtained is 6.71 × 10⁻³ K−1 at 110°.
Introduction
Rare earth doped/codoped upconversion luminescent materials are a unique class of nanophosphors which when excited by a suitable energy, emit a photon in the visible range. To obtain efficient upconversion (UC) emission it is essential to choose an excellent host material. CaTiO3 has wide band gap (3.8 eV–4.3 eV),1 which allows emission from embedded luminescent centers mediated by effective excitation. The perovskite compounds of ABO3-type structure have been considered promising inorganic functional materials due to their stable crystal structure.2–4 To date many researchers have investigated perovskite-based temperature sensors but with lower temperature-sensing performance.5 The interest in CaTiO3 perovskite is growing with the passage of time because of its unique properties, such as: high chemical durability, high thermal stability, being cheaper than sulfides or nitrides, and being less reactive than fluorides. In this present study, CaTiO3 is considered as a host owing to the remarkable properties above and its high refractive index.6 Moreover, it has a phonon frequency low enough to achieve good upconversion intensity. UC luminescence is in general observed in lanthanide ions owing to their ability for f–f transition along with numerous metastable energy states.7 Optical UC is an anti-Stokes process which upconverts two or more low-energy photons into one high-energy photon.8 Lanthanide ions doped into a suitable host lattice show multiple advantages, such as longer luminescence lifetimes, lower toxicity and high photochemical stability.9–13
Er3+ is one such member of the lanthanide family, which shows sharp emission. This acts as a green emission activator ion which has well-known intermediate energy levels which are capable of being populated using near infrared excitation.14,15 Yb3+ is a very good sensitizing agent owing to its suitably broad absorption cross-section over the near-infrared region, and it is also able to transport its energy to the activator ion by an excited-state absorption route. Considering the above advantages of lanthanides as luminescent centers and perovskites as host materials, it is an obvious idea to work on their combination: i.e. this combination has the ability to offer upconversion photoluminescence for wide applications in several fields: for example, display devices, drug delivery, cancer therapy, biological imaging solar light conversion, optical thermometry, and security applications.16–21
Precise evaluation of temperature is required in several industrial fields, to obtain a desired progression, and it is being developed under most favorable conditions. Temperature sensing is one such facilitatory non-contact temperature calculation method with fast response, high measurement accuracy and high spatial resolution.22,23 There are several methods to measure temperature sensing ability,24 and the most frequently used are the fluorescence lifetime (FL) and fluorescence intensity ratio (FIR) of thermally coupled and/or non-thermally coupled electronic transitions of rare earth ions.25–31 The FIR method is an effective and well-recognized method for reliable and accurate measurements because it is functional over a broad range of temperature.32 In this technique, the essential requirement is intensity variation in UC luminescence caused by coupled electronic transitions to a low-energy state from two closely spaced high-energy states. The population rate becomes low with higher energy levels due to the huge energy gap between the thermally coupled levels, and thereby emission intensity from these levels is reduced. The thermally coupled levels are in general found in trivalent lanthanide ions e.g. Sm3+, Eu3+, Tm3+, Er3+, Ho3+ and Nd3+.14,33–35 In particular, FL-based optical thermometry is not dependent on outer intrusions or changes in excitation density and is thus suitable for use in severe environmental conditions, such as chemical reaction temperature monitoring, microwave induction heating or radio frequency and plasmas.36,37
Photoluminescence (PL) emission intensity starts decreasing beyond a certain proportion of rare earth, and this trend is known as luminescence quenching. Luminescence quenching occurs because of an increasing rate of non-radiative decay from the excited state.38 Furthermore, talking about temperature-dependent UC, when heating a phosphor, PL emission intensity increases up to a definite temperature; but if the phosphor is heated further at higher temperatures, a decline in the intensity can be observed.39 This may be due to non-radiative relaxation (increasing rate of phonon vibration) of excitons at raised temperatures, reducing the intensity.
Materials
CaCl2 (HiMedia, 97.7%), Yb2O3 (Merck, 99.998%), Er2O3 (Merck, 99.9%), titanium(IV) bis (acetylacetonate) diisopropoxide (Merck), HNO3 (70%), citric acid (99.5%), ethanol (99.9%), and ammonia (70%) were procured commercially. We took CaCl2 (0.98 M) = 2.1754 g, Er2O3 (0.01 M) = 0.076 g, Yb2O3 (0.01 M) = 0.078 g and 3 mL of titanium(IV) bis(acetylacetonate) diisopropoxide solution for CaTiO3: 1 at% Er3+, 1 at% Yb3+. For other samples we calculated the amount of 3% Er3+ and 5% Er3+ using the formula (Ca0.99−aYb0.01Era)TiO3.40 The chemicals were used as received without further refinement.
Experimental methods
To synthesize (Ca0.99−aYb0.01Era)TiO3 with constant Yb3+ and varied concentrations of Er3+ (at molar ratios of 1, 3 and 5%), the well-recognized sol–gel technique was used. To start with, appropriate amounts of CaCl2, Er2O3, and Yb2O3 were added to a beaker containing 20 mL of deionized water, and a few drops of nitric acid were added. The obtained precursor solution was then stirred vigorously at a rate of 400 rpm along with constant heating at 100 °C, until a transparent solution was obtained. In the subsequent step, 3 mL of titanium solution was taken in another beaker containing ethanol solution and 0.4 M of citric acid and stirred, for only a few minutes. Then, both solutions were added together, which then turned into a precipitate. The precipitate was heated for 1 h, and washed with alcohol for removal of any impurities present. We obtained a xerogel after drying the precipitate at 100 °C for 12 h under constant heating. A dried black powder was obtained after the gel was baked at 400 °C for 2 h. Finally annealing was performed at 900 °C, giving a white crystalline powder as the end product.
The synthesized samples were examined for frequency UC-emission using a 980 nm diode laser (continuous mode, power tuneable) as the excitation source and a dispersive monochromator (model: iHR320, Horiba Jobin Yuon) equipped with a photomultiplier tube (model no. R928P, Hamamatsu, Japan) was used as a detector. In order to investigate the microstructure, a JEOL JEM-F200 TEM (transmission electron microscope), equipped with SAED (selected area electron diffraction) was used. HRTEM (high-resolution TEM) was used to record the atomic planes inside the crystal lattice. The X-ray diffraction patterns were measured on a PANalytical Advanced X-ray diffractometer using a Cu Kα (1.5406 Å) radiation source over the angular range 20° ≤ 2θ ≤ 80°.
Results and discussion
X-ray diffraction
The XRD patterns are presented in Fig. 1(a). The diffraction peaks (101), (121), (012), (130), (040), (212), (321) and (242) can be well indexed to pure CaTiO3, matching well with standard JCPDS card number 76-2400, and exhibit an orthorhombic crystal structure with space group Pcmn(62). The peak at 2θ = 33.21° exhibits maximum intensity. However, there are some extra peaks at 29.58° and 31.05° with weak intensity marked by #. These peaks are a result of the formation CaTiO3 matching the orthorhombic phase of CaTiO3. The outcomes of the XRD data are very consistent with the TEM/SEM results. We evaluated the crystallite size of the samples using the Scherrer formula, given as:| |
 | (1) |
where D stands for average crystallite size, λ represents the wavelength of the X-rays (1.5406 Å for the Cu Kα source), β stands for FWHM (full width at half maxima) in radians and θ is the diffraction angle. The average crystallite sizes calculated using the above formula are 33.14 nm, 23.60 nm, and 20.82 nm for the CaTiO3: 1 at% Er3+, 1 at% Yb3+, CaTiO3: 3 at% Er3+, 1 at% Yb3+ andCaTiO3: 5 at% Er3+, 1 at% Yb3+ samples, respectively. The trend in crystallite size shows that with increasing concentration of erbium the crystallite size decreases. This change can be attributed to the change in lattice parameters caused by substitution of Ca2+ ions (ionic radius = 2.31 Å) with smaller radius ions Er3+ (ionic radius ≈ 0.89 Å) and Yb3+ (ionic radius ≈ 0.86 Å).
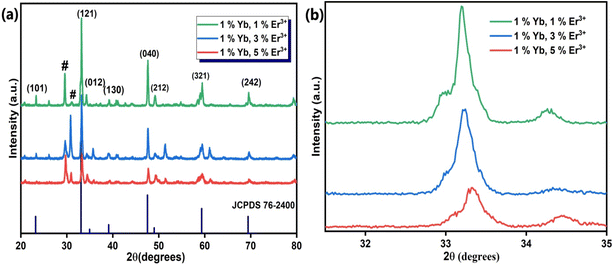 |
| | Fig. 1 (a) X-ray powder diffraction pattern of as-synthesized (Ca0.99−aYb0.01Era)TiO3 (where a = 0.01, 0.03, 0.05). (Vertical drop lines symbolize standard JCPDS card number 76-2400.) (b) shift in (121) peak with Er3+ incorporation. | |
We used the Williamson–Hall relation41 to determine the strain present in the lattice, which is given below:
| |
 | (2) |
where the terms are same as in the Scherrer formula above. The strain appears due to distortion of the lattice in the crystal. The respective strains present for the as-synthesized samples CaTiO
3: 1 at% Er
3+, 1 at% Yb
3+, CaTiO
3: 3 at% Er
3+, 1 at% Yb
3+ and CaTiO
3: 5 at% Er
3+, 1 at% Yb
3+ are 3.49 × 10
−3, 4.48 × 10
−3 and 5.27 × 10
−3. From
Fig. 1(b) it can be observed that there is a slight shift in peak position towards higher 2
θ angle while the peak intensity decreases with an increase in concentration of Er
3+. Therefore, it can be concluded that the lattice dimension contracts with doping of erbium ions in the calcium substitutional sites.
Scanning electron microscopy and EDX
Fig. 2(a) illustrates the surface morphology of the prepared materials using SEM imaging, which was taken using a TESCAN MIRA. The nanomaterials are spherical when seen from the top and agglomeration is seen in the absence of a surfactant. Fig. 2(b) represents the EDX spectra which confirm the presence of Ti (13.86 atomic%), Ca (5.10 atomic%), O (77.68 atomic%), Er (0.60 atomic%) and Yb (2.77 atomic%). Some traces of Au can be seen, due to the presence of gold in the background. All elements were analyzed under normalized conditions and the data taken after four iterations.
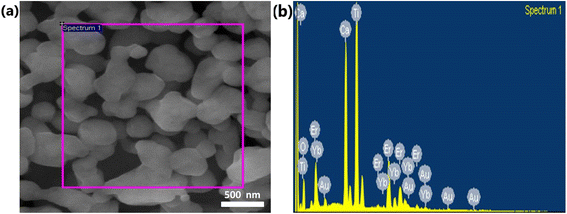 |
| | Fig. 2 (a) SEM micrographs of the optimized sample CaTiO3: 1 at% Er3+, 1 at% Yb3+, (b) corresponding EDX. | |
Transmission electron microscopy
The TEM micrograph in Fig. 3(a) confirms the spherical morphology of the particles. It is apparent that the crystallites are agglomerated, which may be due to annealing performed at high temperature (900 °C). The SAED pattern of the Er3+-Yb3+codoped CaTiO3 nanocomposite confirms its polycrystalline nature and it also consists of three different planes, as shown in Fig. 3(b). One of the plane is illustrated with a d-spacing of 0.2411, as shown in the HRTEM image. The d-spacing values of the resulting diffraction pattern are d111 = 0.3378 nm, d221 = 0.1846 nm, and d130 = 0.1722 nm, and these d-spacing values are in good agreement with the XRD studies and are consistent with standard JCPDS file number 76-2400. The presence of crystalline erbium and ytterbium inside the CaTiO3 matrix is confirmed by means of the well-defined lattice fringes in Fig. 3(c). FIJI IMAGE-J software was used to analyze the d-spacing, which resulted in a dhkl value of 0.2411 nm. The dhkl value was estimated using the line profile approach by taking an average of 51 fringes. The histogram plot in Fig. 3(e) shows the Gaussian distribution, which is indicative of a mean particle size of 381.27 nm.
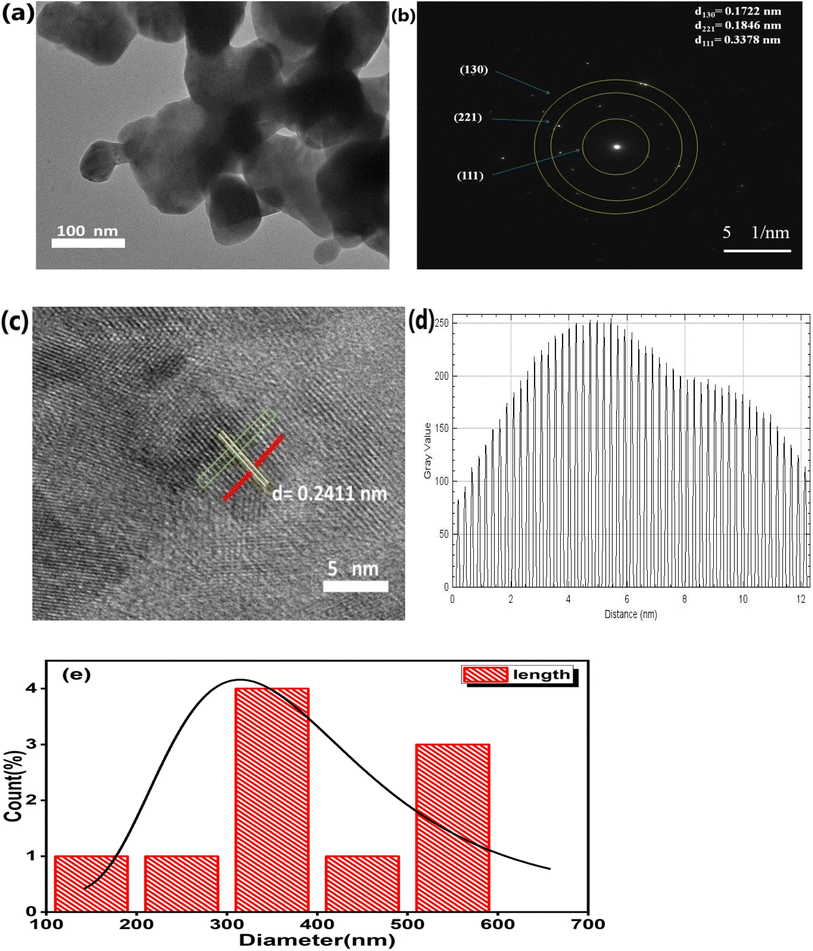 |
| | Fig. 3 (a) Transmission electron microscopy image of CaTiO3: 1 at% Er3+, 1 at% Yb3+, (b) corresponding SADP, (c) corresponding HRTEM, (d) fringes of lattice spacing and (e) size distribution histogram plot. | |
Upconversion emission spectra
The upconversion spectra were recorded over the wavelength range 450–750 nm for three different concentrations of Er3+ ion. Two intense green UC bands at 523 nm and 544 nm were obtained and assigned to the 2H11/2 → 4I15/2 and 4S3/2 → 4I15/2 transitions, respectively. An intense red band corresponding to the 4F9/2 → 4I15/2 transition at 662 nm was also found. From Fig. 4 it is clearly observable that the emission intensity is a maximum for 1 molar% erbium ion concentration. Owing to concentration quenching, the emission intensity is very low for higher concentrations.42,43 Our research goes along with the idea put forward by Wang and co-workers44 that at lower Er3+ concentrations, approximately twice the optical temperature sensitivity is observed compared to a highly doped concentration. So we continued our other studies for the sample giving the maximum signal.
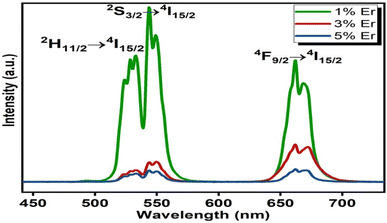 |
| | Fig. 4 Upconversion spectra of (Ca0.99−aYb0.01Era)TiO3 (where a = 0.01, 0.03, 0.05). | |
Power-dependent upconversion spectra
Fig. 5(a) illustrates the pump-power-dependent UC emission spectra. The graph shows a gradual increase in the intensity of UC emission along with an increase in pump power, which establishes the direct dependence of emission intensity on pump power. Here a remarkable change observed in UC emission is that up to a pump power of 548 mW, the highest intensity is observed for 522 nm, but with a further increase in power, the dominant intensity is observed for 544 nm. This might be because up to a power of 548 mW the transition 2H11/2 → 4I15/2 is dominant because the population in the 2H11/2 state is a maximum. However, as the power increases to 620 mW thermal-vibration increases, so that due to non-radiative transition between the 2H11/2 and 4S3/2 states and further to the 4I15/2 ground state, the highest UC emission is observed for 544 nm. The number of photons absorbed can be calculated from the relation below 45where the term Iuc denotes the UC emission intensity, Ppump denotes the infrared excitation pump-power and n stands for the number of photons absorbed.46 Fig. 5(b)–(d) show the slopes of ln(UC intensity) vs. ln(pump power), which confirm the involvement of the two-photon absorption process for the aforementioned upconversion emission bands. The slope of intensity at the 523 nm peak at different pump powers fitted linearly is 1.64 ± 0.19, while for the 544 nm peak the corresponding slope value is 2.03 ± 0.09 and for the peak at 662 nm the corresponding value of slope is 1.67 ± 0.11.
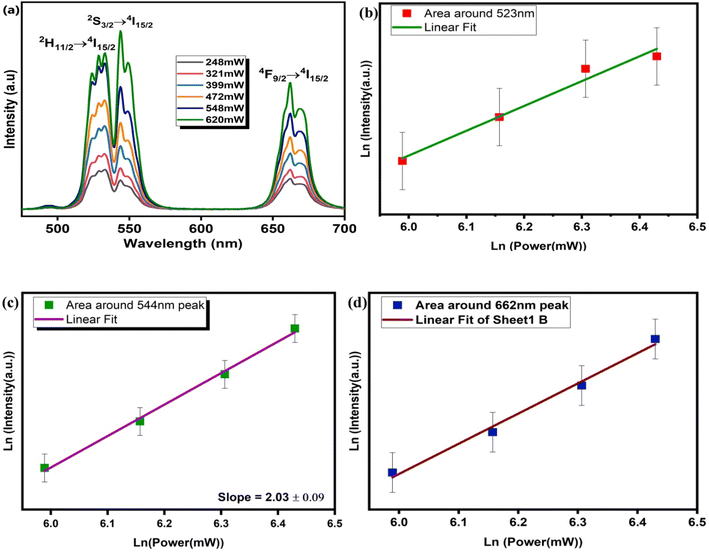 |
| | Fig. 5 (a) Pump-power-dependent UC spectra for CaTiO3: 1 at% Er3+, 1 at% Yb3+ and (b–d) logarithmic plots for 523, 544, and 662 nm peaks, respectively. | |
Fig. 6 shows a schematic representation of possible absorption and emission pathways for Er3+-Yb3+ codoped CaTiO3. The pump-power-dependent study confirms that a two-photon absorption process took place through successive absorption of two photons mediated through intermediate levels and few non-radiative relaxations. The Er3+ ion has an 4I11/2 energy level which gets populated through the ground state absorption (GSA) method absorbing a 980 nm pump photon and from there the 4F7/2 level is populated through absorption of another photon of the same energy by the excited state absorption (ESA) process. The photons in the 4F7/2 state relax non-radiatively to the 2H11/2 and 4S3/2 levels and further relax back to the ground state by the emission of visible green photons around 525 nm and 547 nm, respectively. A red emission centered at 662 nm arises because of 4F9/2 → 4I15/2 transition in Er3+. The Yb3+ ions keep enriching the population in all of the emitting levels by the efficient energy transfer (ET) channels shown in the figure. This transfer of energy from Yb3+ to Er3+ intensifies the emissions correspondingly. Whereas the green color emitting levels, 2H11/2 and 4S3/2, have a very close energy separation of ΔE = 707.43 cm−1, which helps the 4S3/2 level to keep the 2H11/2 level thermally populated; this theory was also supported in many earlier studies.47–52
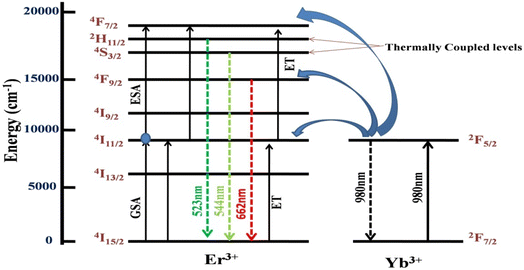 |
| | Fig. 6 A possible schematic energy level illustration for the characteristic Er3+-Yb3+ emissions under 980 nm excitation. | |
CIE diagram
Fig. 7 represents a chromaticity diagram of the synthesized nanophosphor under 980 nm excitation. To characterize the color of the visible light emitted from a phosphor, CIE color coordinates were instituted,53 which can be calculated separately for different pump powers. As shown in Fig. 7, the color coordinate points fall in the yellowish-green region due to the presence of strong red emission. The obtained color coordinates at different excitation powers are tabulated in Table 1. With increasing pump power, the color coordinates shift towards the green region.
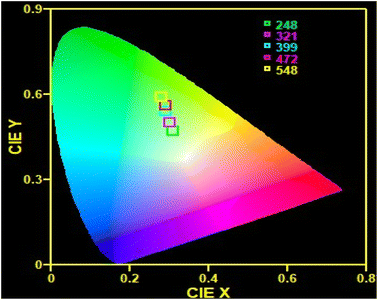 |
| | Fig. 7 CIE color coordinates for CaTiO3: 1 at% Yb3+, 1 at% Er3+. | |
Table 1 The color coordinates corresponding to different pump powers at 980 nm excitation
| Serial number |
Pump power (mW) |
CIE coordinates |
| 1 |
248 |
(0.31, 0.47) |
| 2 |
321 |
(0.30, 0.50) |
| 3 |
399 |
(0.29, 0.54) |
| 4 |
472 |
(0.29, 0.56) |
| 5 |
548 |
(0.28, 0.59) |
Temperature-dependent UC spectra
The UC spectra of the as-synthesized samples were observed by varying the temperature at very low pump power to avoid self-heating. The variation in intensity of the green emission bands peaking at 523 nm and 544 nm owing to 2H11/2 → 4I15/2 and 4S3/2 → 4I15/2 transitions is useful in optical thermometry. In Fig. 8 temperature-dependent emission spectra are shown over the 298–623 K temperature range.
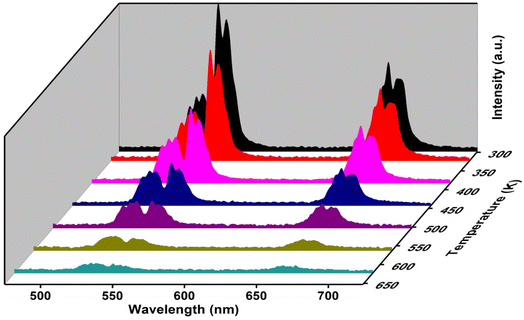 |
| | Fig. 8 Temperature-dependent UC spectra of (Ca0.98Yb0.01Er0.01)TiO3, λex = 980 nm. | |
Fluorescence intensity ratio
For the calculation of FIR of two thermally coupled levels, 2H11/2 and 4S3/2, the Boltzmann distribution expression is used:54| |
 | (4) |
where the terms I523 and I544 represent the corresponding intensities, 2H11/2 → 4I15/2 and 4S3/2 → 4I15/2, respectively. T is the absolute temperature, A is a pre-exponential constant, ΔE is the energy gap between thermally coupled levels (2H11/2 and 4S3/2), and kB represents the Boltzmann constant. FIR for a (Ca0.98Yb0.01Er0.01)TiO3 phosphor has been calculated over the 298–623 K range at constant pump power and is plotted in Fig. 9. A logarithmic plot of FIR versus inverse absolute temperature is plotted to estimate the energy gap (ΔE) between the two thermally coupled levels, as shown in Fig. 9. The obtained data points of FIR vs. inverse T were fitted linearly to obtain the energy gap (ΔE), which was found to be ∼707.43 cm−1, which is almost equal to the experimentally measured energy gap (ΔEm ∼700 cm−1). For a temperature-sensing application, it becomes very necessary to identify the variation of FIR with varying temperature. The formula below is used to obtain absolute sensitivity (SA):| |
 | (5) |
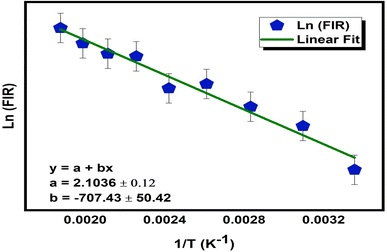 |
| | Fig. 9 A Plot of variation of ln(FIR) vs. inverse temperature for a (Ca0.98Yb0.01Er0.01)TiO3 phosphor. | |
Eqn (5) measures the value of sensor sensitivity. The maximum absolute sensitivity for the present material is found to be 6.71 × 10⁻³ K−1 at 383 K which is amongst the good measured sensitivities for luminescent temperature sensors. In Table 2 the sensor sensitivity of the present sample is compared with other reports.
Table 2 Maximum temperature sensor sensitivities of different RE3+ doped/codoped systems calculated using the FIR algorithm
| Rare earth doped materials |
Maximum sensitivity (K−1) |
Temperature range (K) |
Excitation wavelength |
References |
| Er/Yb:Na0.5Bi0.5TiO3 |
3.1 × 10⁻³ K−1 at 400 K |
163–613 K |
980 nm |
55 |
| Gd2O3:Er3+-Yb3+ |
3.9 × 10⁻³ K−1 at 300 K |
300–900 K |
976 nm |
56 |
| Er:BZT-BCT |
4.4 × 10⁻³ K−1 at 443 K |
200–443 K |
980 nm |
57 |
| Er3+/Yb3+ codoped oxyfluoride glass |
3.9 × 10⁻³ K−1 at 513 K |
291–450 K |
980 nm |
58 |
| CaTi4O9:Er3+, Yb3+ |
4.9 × 10⁻³ K−1 at 323 K |
303–553 K |
980 nm |
59 |
| CaMoO4:Ho–Yb–Mg |
6 × 10⁻³ K−1 at 353 K |
303–543 K |
980 nm |
60 |
| Na0.82Ca0.08Er0.16Y0.853F4:Er3+ |
2.2 × 10⁻³ K−1 at 338 K |
5–300 K |
1.54 μm |
61 |
| CaTiO3:Er3+, Yb3+ |
6.71 × 10⁻³ K−1 at 383 K |
298–623 K |
980 nm |
Present work |
Conclusion
Frequency upconversion emission spectra were recorded for an Er3+, Yb3+ codoped CaTiO3 nanophosphor with orthorhombic phase synthesized successfully through a sol–gel technique, and it emerged as an interesting candidate for optical thermometry. The presence of nanoparticles and small clusters was investigated through TEM and HRTEM images. On codoping with Yb3+ and increasing the concentration of Er3+, the intensity of the emission bands starts decreasing, which confirms the concentration quenching effect. The spectra of UC emission for a temperature-dependent study of the above nanophosphor corresponding to the 2H11/2 → 4I15/2 and 4S3/2 → 4I15/2 transitions over a wide temperature range of 298–623 K show a maximum sensor sensitivity of 6.71 × 10⁻³ K−1 at 383 K. It can be concluded on the basis of the experimental observations that the present phosphors could be excellent candidates for a temperature-sensing probe, in near infrared to green light emitting devices.
Conflicts of interest
There are no conflicts to declare.
Acknowledgements
The authors are thankful to the Inter University Accelerator Center (New Delhi) for providing various characterization facilities such as TEM, SEM, EDX, and XRD. They express their gratitude to Dr Kaushal Kumar for temperature-dependent upconversion data.
References
- A. Krause, W. M. Weber, D. Pohl, B. Rellinghaus, A. Kersch and T. Mikolajick, Investigation of band gap and permittivity of the perovskite CaTiO3 in ultrathin layers, J. Phys. D: Appl. Phys., 2015, 48, 415304, DOI:10.1088/0022-3727/48/41/415304.
- Y.-F. Wu, Y.-T. Nien and Yi-J. Wang, In-Gan, Enhancement of photoluminescence and color purity of CaTiO3:Eu phosphor by Li doping, J. Am. Ceram. Soc., 2011, 95, 1360–1366 CrossRef.
- G. Zhang, G. Liu, L. Wang and J. T. S. Irvine, Inorganic perovskite photocatalysts for solar energy utilization, Chem. Soc. Rev., 2016, 45, 5951–5984 RSC.
- M. A. R. C Alencar, G. S. Maciel, C. B. de Araújo and A. Patra, Er3+-doped BaTiO3 nanocrystals for thermometry: influence of nano environment on the sensitivity of a fluorescence based temperature sensor, Appl. Phys. Lett., 2004, 84, 4753–4755 CrossRef.
- D. K. Singh and J. Manam, Efficient dual emission mode of green emitting perovskite BaTiO3: Er3+ phosphors for display and temperature sensing applications, Ceram. Int., 2018, 44, 10912–10920, DOI:10.1016/j.ceramint.2018.03.15.
- F. Vetrone, J. C. Boyer, J. A. Capobianco, A. Speghini and M. Bettinelli, J. Phys. Chem. B, 2003, 107, 1107 CrossRef CAS.
- F. Wang, R. Deng, J. Wang, Q. Wang, Y. Han, H. Zhu, X. Chen and X. Liu, Tuning upconversion through energy migration in core-shell nanoparticles, Nat. Mater., 2011, 10, 968–973, DOI:10.1038/nmat3149.
- M. F. Wu, et al., Solid-state infrared-to-visible upconversion sensitized by colloidal nanocrystals, Nat. Photonics, 2016, 10, 31–34, DOI:10.1038/nphoton.2015.226.
- F. Zhang, et al., Fabrication of Ag@SiO2@Y2O3:Er nanostructures for bioimaging: tuning of the upconversionfuorescence with silver nanoparticles, J. Am. Chem. Soc., 2010, 132, 2850–2851, DOI:10.1021/ja909108x.
- F. Zhang and S. S. Wong, Ambient large-Scale template-mediated synthesis of high-aspect ratio single-crystalline, chemically doped rare-earth phosphate nanowires for bioimaging, ACS Nano, 2010, 4, 99–112, DOI:10.1021/nn901057y.
- Z. Q. Li and Y. Zhang, Monodisperse silica-coated polyvinylpyrrolidone/NaYF4nanocrystals with multicolor upconversionfuorescence emission, Angew. Chem., Int. Ed., 2006, 45, 7732–7735, DOI:10.1002/anie.200602975.
- L. Cheng, et al., Facile preparation of multifunctional upconversionnanoprobes for multimodal imaging and dual-targeted photothermal therapy, Angew. Chem., 2011, 123, 7523–7528, DOI:10.1002/anie.201101447.
- G. S. Yi and G. M. Chow, Water-Soluble NaYF4:Yb,Er(Tm)/NaYF4/polymer core/shell/shell nanoparticles with significant enhancement of upconversionfuorescence, Chem. Mater., 2007, 19, 341–343, DOI:10.1021/cm062447y.
- A. K. Soni, V. K. Rai and S. Kumar, Cooling in Er3+:BaMoO4 phosphor on codoping with Yb3+ for elevated temperature sensing, Sens. Actuators, B, 2016, 229, 476–482, DOI:10.1016/j.snb.2016.01.144.
- S. K. Hussain and J. S. Yu, Synthesis, up/down-conversion luminescence and cathodoluminescence properties of CaLa2ZnO5:Er3+/Yb3+nanocrystalline phosphors, J. Lumin., 2016, 175, 100–105, DOI:10.1016/j.jlumin.2016.02.008.
- A. K. Parchur, Q. Li and A. Zhou, Near-infrared photothermal therapy of Prussian-blue-functionalized lanthanide-ion-doped inorganic/plasmonic multifunctional nanostructures for the selective targeting of HER2-expressing breast cancer cells, Biomater. Sci., 2016, 4, 1781–1791, 10.1039/C6BM00306K.
- A. Kar, S. Kundu and A. Patra, Lanthanide-doped nanocrystals: strategies for improving the efficiency of upconversion emission and their physical understanding, ChemPhysChem, 2015, 16, 505–521, DOI:10.1002/cphc.201402668.
- M. A. R. C. Alencar, G. S. Maciel, C. de Araujo and A. Patra, Er3+-doped BaTiO3 nanocrystals for thermometry: Influence of nanoenvironment on the sensitivity of a fluorescence based temperature sensor, Appl. Phys. Lett., 2004, 84, 4753–4755, DOI:10.1063/1.1760882.
- L. Cheng, C. Wang and Z. Liu, Upconversion nanoparticles and their composite nanostructures for biomedical imaging and cancer therapy, Nanoscale, 2013, 5, 23–37, 10.1039/C2NR32311G.
- J. Milliez, A. Rapaport, M. Bass, A. Cassanho and H. P. Jenssen, High-Brightness White-Light Source Based on Up-Conversion Phosphors, J. Disp. Technol., 2006, 2, 307–311, DOI:10.1109/JDT.2006.879183.
- F. L. Meng, J. J. Wu, E. F. Zhao, Y. Z. Zheng, M. L. Huang, L. M. Dai, X. Tao and J. F. Chen, High-efficiency near-infrared enabled planar perovskite solar cells by embedding upconversionnanocrystals, Nanoscale, 2017, 9, 18535–18545, 10.1039/C7NR05416E.
- P. V. Dos Santos, M. T. De Araujo, A. S. Gouveia-Neto, J. A. Medeiros Neto and A. S. B. Sombra, Optical temperature sensing using upconversion fluorescence emission in Er3+/Yb3+-codopedchalcogenide glass, Appl. Phys. Lett., 1998, 73, 578–580, DOI:10.1063/1.121861.
- S. A. Wade, S. F. Collins and G. W. Baxter, Fluorescence intensity ratio technique for optical fiber point temperature sensing, J. Appl. Phys., 2003, 94, 4743–4756, DOI:10.1063/1.1606526.
- D. Chen, Z. Wan, Y. Zhou and Z. Ji, Cr3+-doped gallium-based transparent bulk glass ceramics for optical temperature sensing, J. Eur. Ceram. Soc., 2015, 35, 4211–4216, DOI:10.1016/j.jeurceramsoc.2015.08.005.
- E. Maurice, G. Monnom, D. B. Ostrowsky and G. W. Baxter, High dynamic range temperature point sensor using green fluorescence intensity ratio in erbium-doped silica Fiber, J. Lightwave Technol., 1995, 13, 1349–1353, DOI:10.1109/50.400677.
- D. Chen, S. Liu, X. Li, Z. Wan and S. Li, Gd-based oxyfluoride glass ceramics: phase transformation, optical spectroscopy and upconverting temperature sensing, J. Eur. Ceram. Soc., 2017, 37, 4083–4094, DOI:10.1016/j.jeurceramsoc.2017.05.006.
- X. Yang, S. Lin, D. Ma, S. Long, Y. Zhu, H. Li and B. Wang, Up-conversion luminescence of LiTaO3:Er3+ phosphors for optical thermometry, Ceram. Int., 2020, 46, 1178–1182, DOI:10.1016/j.ceramint.2019.09.088.
- J. Cao, D. Xu, F. Hu, X. Li, W. Chen, L. P. Chen and H. Guo, Transparent Sr0.84Lu0.16F2.16:Yb3+, Er3+ glass ceramics: elaboration, structure, up-conversion properties and applications, J. Eur. Ceram. Soc., 2018, 38, 2753–2758, DOI:10.1016/j.jeurceramsoc.2018.02.010.
- B. Hou, M. Jia, P. Li, G. Liu, Z. Sun and Z. Fu, Multifunctional optical thermometry based on the rare-earth-ions-doped up-/down-conversion Ba2TiGe2O8 :Ln(Ln = Eu3+/Er3+/Ho3+/Yb3+) phosphors, Inorg. Chem., 2019, 58, 7939–7946, DOI:10.1021/acs.inorgchem.9b00646.
- P. Du, L. Luo and J. S. Yu, Low-temperature thermometry based on upconversion emission of Ho/Yb-codoped Ba0.77Ca0.23TiO3 ceramics, J. Alloys Compd., 2015, 632, 73–77, DOI:10.1016/j.jallcom.2015.01.130.
- Y. Wu, S. Xu, F. Lai, B. Liu, J. Huang, X. Ye and W. You, Intense near-infrared emission, upconversion processes and temperature sensing properties of Tm3+ and Yb3+ co-doped double perovskite Gd2ZnTiO6 phosphors, J. Alloys Compd., 2019, 804, 486–493, DOI:10.1016/j.jallcom.2019.07.036.
- V. K. Rai and S. B. Rai, Experimental Validation of Fluorescence Intensity Ratio/Fluorescence Lifetime Temperature Sensing Technique, Sens. Transducers J., 2006, 74, 839 Search PubMed.
- A. Zhang, et al., Ln3+ (Er3+, Tm3+ and Ho3+)-doped NaYb (MoO4)2upconversion phosphors as wide range temperature sensors with high sensitivity, J. Alloys Compd., 2017, 728, 476–483, DOI:10.1016/j.jallcom.2017.09.010.
- K. W. Meert, et al., Energy transfer in Eu3+ doped scheelites: use as thermographic phosphor, Opt. Express, 2014, 22(103), A961–A972, DOI:10.1364/OE.22.00A961.
- L. Li, et al., Near-ultraviolet and blue light excited Sm3+ doped Lu2MoO6 phosphor for potential solid state lighting and temperature sensing, J. Alloys Compd., 2018, 738, 473–483, DOI:10.1016/j.jallcom.2017.12.169.
- Z. Y. Zhang, K. T. V. Grattan and A. W. Palmer, Phys. Rev. B: Condens. Matter Mater. Phys., 1993, 48, 7772 CrossRef CAS PubMed.
- L. Ye, J. Zhang and Y. Shi, Rev. Sci. Instrum., 2006, 77, 054901, DOI:10.1063/1.2200889.
- J. Vuojola and T. Soukka, Luminescent lanthanide reporters: new concepts for use in bioanalytical applications, Methods Appl. Fluoresc., 2014, 2(1), 012001, DOI:10.1088/2050-6120/2/1/012001.
- M. Anicete-Santos, et al., Contribution of structural order-disorder to the green photoluminescence of PbWO4, Phys. Rev. B: Condens. Matter Mater. Phys., 2007, 75(16), 165105, DOI:10.1103/PhysRevB.75.165105.
- N. Jain, R. K. Singh, B. P. Singh, A. Srivastava, R. A. Singh and J. Singh, Enhanced Temperature-Sensing Behavior of Ho3+-Yb3+-Codoped CaTiO3 and Its Hybrid Formation with Fe3O4 Nanoparticles for Hyperthermia, ACS Omega, 2019, 4, 7482–7491, DOI:10.1021/acsomega.9b00184.
- V. D. Mote, Y. Purushotham and B. N. Dole, Williamson-Hall analysis in estimation of lattice strain in nanometer-sized ZnO particles, J. Theor. Appl. Phys., 2012, 6(1–8), 6, DOI:10.1186/2251-7235-6-6.
- T. M. Zhou, Y. Q. Zhou, Z. L. Wu and B. J. Chen, Concentration effect and temperature quenching of upconversion luminescence in BaGd2ZnO5:Er3+/Yb3+ phosphor, J. Rare Earths, 2015, 33, 686–692, DOI:10.1016/S1002-0721(14)60471-3.
- R. Wang, X. Zhang, F. Liu, L. Xiao, Y. Chen and L. Liu, Upconversion mechanisms of Er3+:NaYF4 and thermal effects induced by incident photon on the green luminescence, J. Lumin., 2016, 175, 35–43, DOI:10.1016/j.jlumin.2016.02.018.
- R. Wang, X. Zhang, F. Liu, Y. Chen and L. Liu, Concentration effects on the FIR technique for temperature sensing, Opt. Mater., 2015, 43, 18–24, DOI:10.1016/j.optmat.2015.02.015.
- M. Pollnau, D. R. Gamelin, S. R. Luthi, H. U. Gudel and M. P. Hehlen, Power dependence of upconversion luminescence in lanthanide and transition-metal-ion systems, Phys. Rev. B: Condens. Matter Mater. Phys., 2000, 61, 3337, DOI:10.1103/PhysRevB.61.3337.
- F. Wang, F. Song, G. Zhang, Y. Han, Q. Li, C. Ming and J. Tian, Upconversion and pump saturation mechanisms in Er3+/Yb3+ co-doped Y2Ti2O7nanocrystals, J. Appl. Phys., 2014, 115, 134310, DOI:10.1063/1.4870472; Opt. Mater., 43, 2015, 18–23, DOI:10.1016/j.optmat.2015.02.015.
- B. Dong, T. Yang and M. K. Lei, Optical high temperature sensor based on green upconversion emissions in Er3+ doped Al2O3, Sens. Actuators, B, 2007, 123, 667–670, DOI:10.1016/j.snb.2006.10.002.
- G. S. Maciel, et al., Temperature sensor based on frequency upconversion in Er3+ – doped fluoroindate glass, IEEE Photonics Technol. Lett., 1995, 7, 1474–1476 Search PubMed.
- H. Berthou and C. Jörgensen, Optical-fiber temperature sensor based on upconversion-excited fluorescence, Opt. Lett., 1990, 15, 1100–1102, DOI:10.1364/OL.15.001100.
- A. Pandey, et al., Enhanced upconversion and temperature sensing study of Er3+-Yb3+codoped tungsten–tellurite glass, Sens. Actuators, B, 2014, 202, 1305–1312, DOI:10.1016/j.snb.2014.06.074.
- S. F. León-Luis, U. R. Rodriguez-Mendoza, E. Lalla and V. Lavin, Temperature sensor based on the Er3+ green upconverted emission in a fluorotellurite glass, Sens. Actuators, B, 2011, 158, 208–2013, DOI:10.1016/j.snb.2011.06.005.
- B. S. Cao, Y. Y. He, Z. Q. Feng, Y. S. Li and B. Dong, Optical temperature sensing behavior of enhanced Green upconversion emissions from Er-Mo:Yb2Ti2O7nanophosphor, Sens. Actuators, B, 2011, 159, 8–11, DOI:10.1016/j.snb.2011.05.018.
- N. Guo, H. You, Y. Song, M. Yang, K. Liu, Y. Zheng, Y. Huang and H. Zhang, White light emission from a single-emitting-component Ca9Gd(PO4)7:Eu2+,Mn2+ phosphor with tunable luminescent properties for near-UV light-emitting diodes, J. Mater. Chem., 2010, 20, 9061–9067, 10.1039/C0JM01860K.
- B. Dong, B. Cao, Y. He, Z. Liu, Z. Li and Z. Feng, Temperature sensing and in vivo imaging by molybdenum sensitized visible upconversion luminescence of rare-earth oxides, Adv. Mater., 2012, 24, 1987–1993, DOI:10.1002/adma.201200431.
- P. Du, L. Lu, W. Li and Q. Yue, Upconversion emission in Er-doped and Er/Ybcodoped ferroelectric Na0.5Bi0.5TiO3 and its temperature sensing application, J. Appl. Phys., 2014, 116, 014102–014108, DOI:10.1063/1.4886575.
- S. K. Singh, K. Kumar and S. B. Rai, Er3+/Yb3+codoped Gd2O3nano-phosphor for optical thermometry, Sens. Actuators, A, 2009, 149, 16–20, DOI:10.1016/j.sna.2008.09.019.
- P. Du, L. Luo, W. Li, Q. Yue and H. Chen, Optical temperature sensor based on upconversion emission in Er-doped ferroelectric 0.5Ba(Zr0.2Ti0.8)O3−0.5(Ba0.7Ca0.3)TiO3 ceramic, Appl. Phys. Lett., 2014, 104, 152902–152906, DOI:10.1063/1.4871378.
- L. Feng, B. Lai, J. Wang, G. Du and Q. Su, Spectroscopic properties of Er3+ in a oxyfluoride glass and upconversion and temperature sensor behaviour of Er3+/Yb3+-codopedoxyfluoride glass, J. Lumin., 2010, 130, 2418–2423, DOI:10.1016/j.jlumin.2010.08.005.
- P. Singh, N. Jain, A. K. Tiwari, S. Shukla, V. Baranwal, J. Singh and A. C. Pandey, Near-infrared light-mediated Er3+ and Yb3+ co-doped CaTi4O9 for optical temperature sensing behavior, J. Lumin., 2021, 233, 117737, DOI:10.1016/j.jlumin.2020.117737.
- R. Dey, A. Kumari, A. K. Soni and V. K. Rai, CaMoO4:Ho3-Yb3-Mg2 upconverting phosphor for application in lighting devices and optical temperature sensing, Sens. Actuators, B, 2015, 210, 581–588, DOI:10.1016/j.snb.2015.01.007.
- X. Wang, C.-S. Liu and X. Yan, Optical temperature sensing of hexagonal Na0.82Ca0.08Er0.16Y0.853F4 phosphor, RSC Adv., 2014, 4, 24170–24175, 10.1039/C4RA02779E.
|
| This journal is © The Royal Society of Chemistry 2023 |
Click here to see how this site uses Cookies. View our privacy policy here.  Open Access Article
 a,
Neha Jainb,
Shraddha Shuklaa,
Anish Kumar Tiwaria,
Kaushal Kumar
 c,
Jai Singhd and
Avinash C. Pandey*ae


