 Open Access Article
Creative Commons Attribution 3.0 Unported Licence
Conformational flexibility of the disaccharide β-L-Fucp-(1→4)-α-D-Glcp-OMe as deduced from NMR spectroscopy experiments and computer simulations
Wojciech
Plazinski
 ab,
Thibault
Angles d'Ortoli
 c and
Göran
Widmalm
 *c
*c
aJerzy Haber Institute of Catalysis and Surface Chemistry, Polish Academy of Sciences, 30-239 Krakow, Poland
bDepartment of Biopharmacy, Medical University of Lublin, 20-093 Lublin, Poland
cDepartment of Organic Chemistry, Arrhenius Laboratory, Stockholm University, S-106 91 Stockholm, Sweden. E-mail: goran.widmalm@su.se
First published on 2nd August 2023
Abstract
Carbohydrates in biological systems are referred to as glycans and modification of their structures is a hallmark indicator of disease. Analysis of the three-dimensional structure forms the basis for further insight into how they function and comparison of crystal structure with solution-state conformation(s) is particularly relevant, which has been performed for the disaccharide β-L-Fucp-(1→4)-α-D-Glcp-OMe. In water solution the conformational space at the glycosidic linkage between the two sugar residues is identified from molecular dynamics (MD) simulations as having a low-energy exo-syn conformation, deviating somewhat from the solid-state conformation, and two anti-conformational states, i.e., anti-ϕ and anti-ψ, indicating flexibility at the glycosidic linkage. NMR data were obtained from 1D 1H,1H-NOESY and STEP-NOESY experiments, measurement of transglycosidic 3JCH coupling constants and NMR spin-simulation. The free energy profile of the ω torsion angle computed from MD simulation was in excellent agreement with the rotamer distribution from NMR experiment being for gt:gg:tg 38![[thin space (1/6-em)]](https://www.rsc.org/images/entities/char_2009.gif) :
:![[thin space (1/6-em)]](https://www.rsc.org/images/entities/char_2009.gif) 53
53![[thin space (1/6-em)]](https://www.rsc.org/images/entities/char_2009.gif) :
:![[thin space (1/6-em)]](https://www.rsc.org/images/entities/char_2009.gif) 9, respectively, with a proposed inter-residue O5′⋯HO6 hydrogen bond being predominant in the gg rotamer. Quantum mechanics methodology was used to calculate transglycosidic NMR 3JCH coupling constants, averaged over a conformational ensemble of structures representing various rotamers of exocyclic groups, in good to excellent agreement with Karplus-type relationships previously developed. Furthermore, 1H and 13C NMR chemical shifts were calculated using the same methodology and were found to be in excellent agreement with experimental data.
9, respectively, with a proposed inter-residue O5′⋯HO6 hydrogen bond being predominant in the gg rotamer. Quantum mechanics methodology was used to calculate transglycosidic NMR 3JCH coupling constants, averaged over a conformational ensemble of structures representing various rotamers of exocyclic groups, in good to excellent agreement with Karplus-type relationships previously developed. Furthermore, 1H and 13C NMR chemical shifts were calculated using the same methodology and were found to be in excellent agreement with experimental data.
Introduction
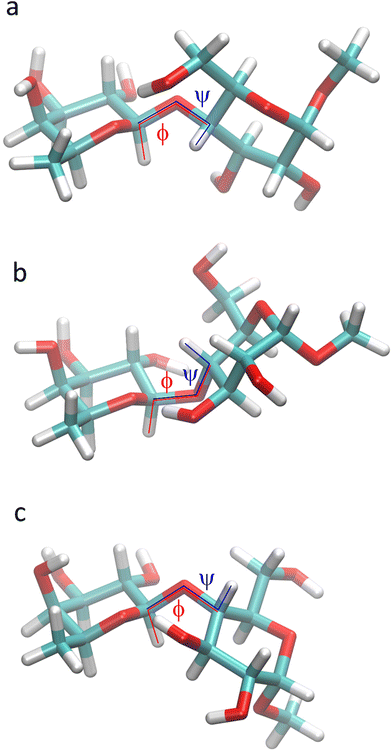
Glycans, carbohydrates in biological systems, are often linked to proteins or lipids as glycoconjugates, although some are not, such as hyaluronic acid, and the glycome is described as all of the glycans in a particular cell, tissue or organism. These glycans are important in relation to infection and immunity where regulatory effects depend on mediated interactions with glycan binding proteins that have carbohydrate binding domains.1 Thus, a thorough understanding of recognition mechanisms facilitates the development of glycan-mimetic anti-infective and anti-inflammatory drugs. Malfunction of glycan regulation plays a central role in disease processes as glycans, for example, control protein stability, receptor dimerization, and binding to carbohydrate-specific receptors such as selectins that mediate immune cell adhesion.2 Changes in glycan structure on glycoproteins are associated with cancer, e.g., in the form of novel glycan-based epitopes, which are markers of oncogenic transformation, or by accumulation of 5-N-glycolylneuraminic acid (a sialic acid form not synthesized by humans) in cancerous tissues. Moreover, in autoimmune disease changes are evident due to loss of galactose residues and exposure of terminal N-acetylglucosamine residues on N-glycans of IgG antibodies.3 Identifying the three-dimensional (3D) structure of glycans and how alteration of these will affect pathological conditions, biomarkers and therapeutic targets are of prime importance to cure disease.4Detailed information about the 3D structure of an oligosaccharide may be obtained from its crystal structure, though crystallization of highly hydrophilic carbohydrate molecules can be difficult and elusive. However, when it is available, a comparison of its solid-state conformation5 can be made with that or those identified by NMR experiments6 in conjunction with molecular dynamics (MD) simulations.7 In the crystal structure of β-L-Fucp-(1→4)-α-D-Glcp-OMe (F4G)8 the glycosidic torsion angles ϕ = −6° and ψ = +34° between the two sugar residues, the former of which deviates a good deal from the exo-anomeric conformation9 that would have ϕ ≈ −50° (β-L-hexopyranoside), or as observed for the torsion angle to the O-methyl group having ϕMe = −56° (α-D-hexopyranoside), whereas the latter ψ torsion is tilted away from an eclipsed conformation (Fig. 1). The torsion angle of the exo-cyclic hydroxymethyl group of the glucose residue has the gauche–trans conformation with ω = 68°, i.e., slightly shifted from the staggered conformation.10 To investigate conformational dynamics at the glycosidic linkage in general, to analyze solution-state conformation(s) in comparison to the conformation in the crystal and to unravel the importance of atomic interactions between the two sugar residues as well as to solvent molecules we have performed NMR experiments and computationally carried out MD simulations and quantum mechanical (QM) calculations on F4G.
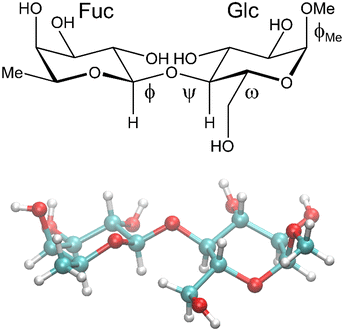 | ||
| Fig. 1 Schematic (top) and crystal structure8 (bottom) of β-L-Fucp-(1→4)-α-D-Glcp-OMe. The ω torsion angle is drawn in the gauche–gauche conformation in the schematic structure and has the gauche–trans conformation in the crystal structure. | ||
Materials and methods
General
The synthesis and 1H and 13C NMR chemical shift assignments of the disaccharide β-L-Fucp-(1→4)-α-D-Glcp-OMe were previously reported by Backman et al.11 Atoms in the terminal fucosyl residue are denoted by a prime and those in the glucosyl residue are unprimed. The glycosidic torsion angles are defined as follows: ϕ = H1′–C1′–O4–C4, ψ = C1′–O4–C4–H4, ϕMe = H1–C1–O–CMe; the torsion angle of the hydroxymethyl group is defined by ω = O5–C5–C6–O6.NMR spectroscopy
The disaccharide sample was prepared in a 5 mm NMR tube in D2O, pD ≈ 6, with a sample concentration of 50 mM. 1H NMR chemical shifts were referenced to internal sodium 3-trimethylsilyl-(2,2,3,3-2H4)-propanoate (TSP, δH 0.00). NMR experiments were carried out using a 600 MHz Bruker AVANCE III spectrometer equipped with a 5 mm inverse Z-gradient TXI (1H/13C/31P) or with a 5 mm BBO probe, a 500 MHz Bruker AVANCE or a 700 MHz Bruker AVANCE III spectrometer, both of which were equipped with a 5 mm TCI Z-gradient cryoprobe. The temperature was calibrated by a methanol-d4 sample,12 and processing of the acquired data was carried out using TopSpin 3.1 (Bruker).1D 1H NMR spectra were recorded at 306 K with the 500, 600 and 700 MHz Bruker spectrometers. Chemical shifts and coupling constants were refined iteratively from 1H NMR spectra with both the integral transform fitting mode and the total-lineshape mode of the PERCH NMR iterator PERCHit.13,14 Starting values for the iteration were extracted from the experimental 1D spectra and the linewidths and lineshapes were part of the iterative refinement process of the spectral parameters.
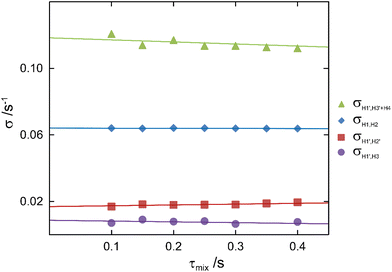
The proton–proton cross-relaxation rates were determined at 600 MHz and 318 K employing both 1D 1H,1H-NOESY15 and 1D 1H,1H-STEP-NOESY experiments.16,17 In all cases, selective excitation was achieved by single PFGSE modules utilizing 50 ms r-SNOB shaped pulses for both the NOESY experiment and the STEP-NOESY experiment. The strengths of the first and second gradient pairs were 15% and 40%, respectively, of the maximum (55.7 G cm−1) for the NOESY experiments. For the STEP-NOESY, the strengths of the gradients were set to 10% or 6.5% for the first and 45% or 15% for the second excitation, respectively. During the STEP-NOESY experiment the resonance from H1 was selectively excited and magnetization transferred to H3 using a 3.8 kHz DIPSI-2 spin-lock with a duration of 50 ms prior to selective excitation of H3. In the STEP-NOESY experiments, zero-quantum coherences were suppressed using the scheme devised by Thrippleton and Keeler,18 where a 30–50 ms adiabatic Chirp pulse with a bandwidth of 20 kHz was applied together with a gradient pulse with 3% of the maximum power. In the NOESY experiment a 20 ms adiabatic Chirp pulse with a bandwidth of 40 kHz was used in combination with a gradient pulse at 3% of the maximum power. In the NOESY as well as the STEP-NOESY experiments, 9 cross-relaxation delays between 70 and 450 ms were collected for each of the excited spins. A spectral width of 6 ppm was sampled using 16k data points and 2048 transients were averaged. The repetition time was 8–10 s, i.e., in all cases longer than 5 × T1. Prior to Fourier transformation, the FIDs of the 1D experiments were zero-filled to 262k points and multiplied by an exponential line-broadening function of 2 Hz. Baseline correction was performed prior to integration, which used the same integration limits for all experiments within a series. The areas of relevant peaks were divided by the area of the inverted peak and analyzed as devised by Dixon et al., i.e., Ij(τmix)/[τmixIj] = −σij, where Ij is the intensity of the signal at nucleus j following selective excitation of nucleus i with intensity Ii in the 1D 1H,1H-NOESY experiments.19 By extrapolation of the individual σij data, the proton–proton cross-relaxation rates were obtained from the intercept with the ordinate axis at τmix = 0.
Measurements of the transglycosidic carbon–proton coupling constants were performed at 600 MHz and 300 K using J-HMBC experiments20 and one-dimensional long-range experiments essentially as devised by Nishida et al.21,22 For the J-HMBC experiments, a threefold low-pass J-filter (J = 140 Hz, 155 Hz and 175 Hz) was used to suppress 1JCH. A scaling factor of 51.5, which was calculated from κ = Δ/tmax1, where Δ was at least 60% of the inverse of the smallest coupling constant to be measured, was used to scale the coupling in the indirect (F1) dimension. Spectral widths of 6 ppm for 1H and 140 ppm for 13C were used. The experiments were performed with 16![[thin space (1/6-em)]](https://www.rsc.org/images/entities/char_2009.gif) 384 × 512 points and 16 scans per t1 increment with the echo/antiecho method. Forward linear prediction to 1024 points in the F1 dimension and subsequent zero-filling to 8192 points was applied prior to Fourier transformation. Coupling constants were extracted from 1D projections of the resonances of interest. One-dimensional long-range (1DLR) experiments employed 13C site-selective excitation with a Gaussian shaped pulse of 80 ms duration. The delay used for suppression of 1JCH was set to (145 Hz)−1 and the time of the delay between excitation and coherence transfer, for evolution of the long-range coupling, was set by using nominal values of 8–16 Hz; an acquisition time of 3 s, 10
384 × 512 points and 16 scans per t1 increment with the echo/antiecho method. Forward linear prediction to 1024 points in the F1 dimension and subsequent zero-filling to 8192 points was applied prior to Fourier transformation. Coupling constants were extracted from 1D projections of the resonances of interest. One-dimensional long-range (1DLR) experiments employed 13C site-selective excitation with a Gaussian shaped pulse of 80 ms duration. The delay used for suppression of 1JCH was set to (145 Hz)−1 and the time of the delay between excitation and coherence transfer, for evolution of the long-range coupling, was set by using nominal values of 8–16 Hz; an acquisition time of 3 s, 10![[thin space (1/6-em)]](https://www.rsc.org/images/entities/char_2009.gif) 240–13
240–13![[thin space (1/6-em)]](https://www.rsc.org/images/entities/char_2009.gif) 312 transients and 50k data points were used. Zero-filling was performed to 512k data points and an exponential line-broadening function lb = 0.6 Hz was applied prior to Fourier transformation. Subsequently, the 3JCH coupling constants were extracted by the J doubling methodology23 implemented in-house by a MATLAB script.
312 transients and 50k data points were used. Zero-filling was performed to 512k data points and an exponential line-broadening function lb = 0.6 Hz was applied prior to Fourier transformation. Subsequently, the 3JCH coupling constants were extracted by the J doubling methodology23 implemented in-house by a MATLAB script.
Conformational analysis from experimental NMR data
From the MD simulations (vide infra) of F4G, three-bond spin–spin NMR coupling constants were calculated according to the following equations:3JH1′,C4(ϕ) = 6.54![[thin space (1/6-em)]](https://www.rsc.org/images/entities/char_2009.gif) cos2(ϕ − Δ) − 0.62 cos2(ϕ − Δ) − 0.62![[thin space (1/6-em)]](https://www.rsc.org/images/entities/char_2009.gif) cos(ϕ − Δ) − 0.17 cos(ϕ − Δ) − 0.17 | (1) |
 | (2) |
 | (3) |
 | (4) |
Heteronuclear transglycosidic Karplus-type relationships were employed, where for the ϕ torsion angle the phase shift (Δ) was set to −12° based on the anomeric and absolute configuration of the β-L-Fucp residue.24 The variable in-plane effect affecting the coupling constant related to the ψ torsion angle was implemented by setting κ = 8.
1H,1H distances in F4G were obtained from NMR experiments by applying the isolated spin-pair approximation (ISPA) rij = rref(σref/σij)1/6, where the reference distance rref is an average over the MD trajectory and σ is the proton–proton cross-relaxation rate constant between directly interacting proton pairs. Effective proton–proton distances were calculated from the MD simulation (using water as explicit solvent) according to rij = 〈rij−6〉−1/6, where the brackets indicate averaging over all frames of the trajectory. The Karplus-type relationships for the conformational dependence of the ω torsion angle developed by Stenutz et al.10 were used to determine the populations of the gt, gg and tg states from 3JH5,H6R and 3JH5,H6S coupling constants.
Computer simulations
The computations were carried out with a single molecule of F4G and involved: (i) MD simulations performed with a classical additive force field, (ii) MD simulations performed according to hybrid QM/MM methodology, and (iii) ab initio QM calculations. Additionally, the classical MD simulations were applied for the α-D-Glcp-OMe monosaccharide.The classical MD simulations were carried out with the CHARMM force field25,26 by using the GROMACS 2016.4 package.27 The CHARMM parameters in the GROMACS-readable format were prepared by using the CHARMM-GUI online server (https://www.charmm-gui.org).28 The considered MD system consisted of one F4G molecule solvated by ca. 1450 explicit water molecules within a cubic box simulated under periodic boundary conditions. The box edges (of initial dimensions corresponding to 3.5 × 3.5 × 3.5 nm3) were preoptimized by a 1 ns constant–pressure MD equilibration at 1 bar and 298 K, ensuring an effective solvent density appropriate for the conditions in the subsequent production simulations. After equilibration, the unbiased MD simulation was carried out for 300 ns. The data (interaction energies and trajectory) were saved every 1 ps. During the MD simulation, the temperature was maintained close to its reference value (298 K) by applying the V-rescale thermostat,29 whereas for constant pressure (1 bar, isotropic coordinate scaling) the Parrinello–Rahman barostat30 was used with a relaxation time of 0.4 ps. The equations of motion were integrated with a time step of 2 fs using the leap-frog scheme.31 The translational center-of-mass motion was removed every timestep separately for the solute and the solvent. The full rigidity of the TIP3P32 water molecules was enforced by application of the SETTLE procedure,33 whereas for the solute the hydrogen-containing bond lengths were constrained by application of the LINCS procedure with a relative geometric tolerance of 10−4.34 The electrostatic interactions were modeled by using the particle-mesh Ewald (PME) method35 with the cutoff set to 1.2 nm, while van der Waals interactions (Lennard-Jones potentials) were switched off between 1.0 and 1.2 nm. The same simulation setup was applied also in the case of α-D-Glcp-OMe.
The analysis of the unbiased MD simulations of F4G included: (i) the occurrence of hydrogen bonding; (ii) the population of the hydroxymethyl group rotamers; (iii) the interatomic distances for selected atom pairs; (iv) the conformation of glycosidic linkages; and (v) the population of the individual conformers, distinguished on the basis of the rotation of the exocyclic groups. In step (i), the default, GROMACS-inherent geometrical criteria were applied, i.e., a cutoff angle (hydrogen-donor–acceptor) of 30° and a cutoff radius (X-acceptor) of 0.35 nm. In step (ii), the conformation of the O5–C5–C6–O6 torsion angle (ω) was assigned to one of the three possible staggered conformers, based on its value, i.e., gt (staggered conformation at 60°), gg (−60°), and tg (180°). In step (iv), the ϕ and ψ glycosidic torsion angles were defined by the following quadruplets of atoms: ϕ = H1′–C1′–O4–C4 and ψ = C1′–O4–C4–H4. The purpose of step (v) was to optimize the ab initio calculations by taking into account a broad set of conformationally distinct structures. Each F4G structure present in the MD trajectory was analyzed with respect to the conformation of all rotatable bonds associated with exocyclic groups of the molecule. The conformation of each torsion angle was assigned to be one of the three possible staggered conformers, based on the smallest deviation from the optimal value. The results of such assignment were sorted and the 400 most frequently occurring individual rotamers were subjected to subsequent ab initio calculations.
The enhanced-sampling free energy calculations were focused on the 2D free energy maps associated with the glycosidic linkage conformation. The calculations relied on an enhanced sampling scheme combining36 parallel tempering37 and well-tempered metadynamics38 as implemented in the PLUMED 2.3 plug-in.39 The well-tempered metadynamics relied on Gaussian local functions of widths of 18°, an initial deposition rate of 0.01 kJ mol−1 ps−1 and a temperature parameter ΔT (defined according to eqn (2) of Barducci et al.38) of 1788 K. The parallel tempering relied on 16 metadynamics simulations carried out in parallel at different temperatures ranging from 298.0 to 363.2 K in steps of about 4.3 K, along with replica-exchange attempts performed at 2 ps intervals. The duration of metadynamics simulations was 10 ns. The remaining details of the simulation set-up were identical to those described earlier for the case of unbiased MD simulations. Additionally, the analogous enhanced-sampling calculations were carried out for F4G in vacuo. The simulation set-up was modified accordingly to account for the lack of solvent by turning off the pressure control and replacing the PME treatment of long-range interactions by plain cutoffs at 1.2 nm.
The hybrid QM/MM-MD simulations were initiated from the fully equilibrated structures obtained during classical MD simulations. A combination of the GROMACS (for MD calculations) and ORCA 2.940 (for QM calculations) packages was applied. The QM part of the system contained the F4G molecule and the corresponding interactions were computed within the BP86/def2-SVP41,42 potential. The MM part comprised water molecules (TIP3P model). The interactions at the QM/MM interface were computed according to the electronic embedding scheme43 and the CHARMM/TIP3P non-bonded parameters analogous to those used during classical MD simulations. The equations of motion were integrated with a time step of 0.5 fs without any constraints on bond lengths or valence angles of solute molecules. The non-bonded interactions were computed by using plain cutoffs at 1.2 nm. The box volume was fixed, keeping the volume of the simulation box constant. The MD simulations were carried out for a duration of 100 ps and the trajectory was saved every 10 steps; other details corresponded to the setup of the classical MD simulations.
The values of the spectroscopic parameters (nJCH and nJHH coupling constants as well as 1H and 13C NMR chemical shifts) were calculated by adopting the multi-step protocol proposed by Gaweda and Plazinski44 and according to the protocol used in our previous study.45 In the first step, the unbiased explicit solvent MD simulations within the classical force field were carried out according to the protocol described above. The analysis of the MD trajectory provided information about the possible conformers of the F4G molecule and their corresponding populations. In the next step, the most populated conformers were extracted from the trajectory and subjected to ab initio-based geometry optimization in the presence of implicit, aqueous solvent. For each of the fully optimized structures the spectroscopic NMR parameters (P) were calculated. The final, averaged values of any P were calculated according to the following equation:
 | (5) |
The values of chemical shifts (δi) were calculated from isotropic nuclear magnetic shielding constants (σ) by assuming a linear relation:46
| δi = σref − σi, | (6) |
The QM calculations were performed in Gaussian0947 at the DFT/B3LYP/6-311+G(d,p) level of theory48,49 and in the presence of implicit, aqueous solvent (polarizable continuum model).50 The geometry optimization was performed by using the default criteria, except for the use of the tight keyword, tightening the cutoffs on forces and step size. Subsequently, spectroscopic parameters were calculated for the fully optimized structures using the GIAO (gauge-independent atomic orbital) approach51 at the same level of theory. The mixed keyword was invoked to request a two-step spin–spin coupling calculation.52 Independently, in order to determine the dependence of the 3JCH coupling constants on a broader range of the ϕ and ψ values, the QM-based optimization and calculation of the NMR parameters were repeated for the same set of structures but with either ϕ or ψ constrained with respect to their initial, MD-derived, values.
Results and discussion
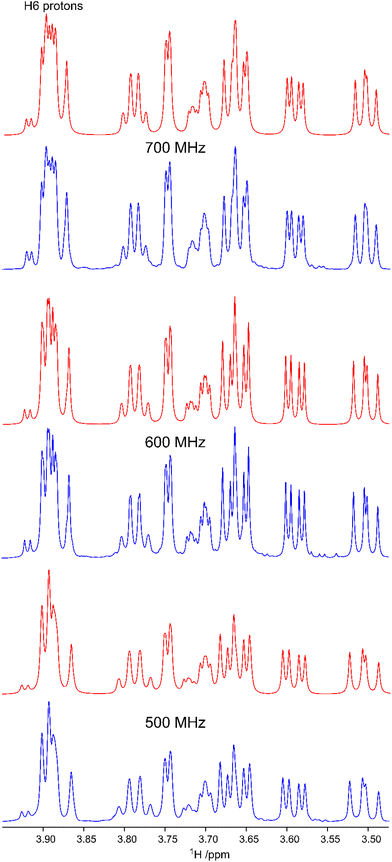
In the study describing the synthesis of β-L-Fucp-(1→4)-α-D-Glcp-OMe the 1H and 13C NMR chemical shifts were assigned for the disaccharide in D2O solution at elevated temperatures of 358 K and 343 K, respectively,11 as higher temperatures are beneficial in structural studies of polysaccharides, both with respect to displacement of the residual HDO peak from the spectral region where resonances from anomeric protons reside and for NMR line shapes, facts that were important in the development of computer-assisted spectrum analysis of polysaccharides at that time.53 Certain 1H NMR chemical shifts showed spectral overlap and the H6 protons of the hydroxymethyl group in the glucosyl residue were degenerate, precluding a straightforward conformational analysis of the rotamer distribution of the ω torsion angle of the exocyclic group. As a basis for the conformational analysis of F4G, 1H NMR experiments were carried out at a lower temperature of 306 K and, in particular, one-dimensional 1H NMR spectra were obtained at three magnetic field strengths corresponding to 1H NMR frequencies of 500, 600 and 700 MHz (Fig. 2). The 1H chemical shifts of F4G were refined by NMR spin-simulation14 (Table 1) and as the procedure fits spectral data containing information on both chemical shifts and spin–spin coupling constants, also nJHH are determined once agreement between experimental and simulated spectra has been obtained (Fig. 2). Although the 1H NMR chemical shifts of the protons of the hydroxymethyl group in the glucosyl reside are closely similar they could be differentiated, resulting in 3.904 ppm and 3.884 ppm, with 3JH5,H6 of 4.55 Hz and 2.24 Hz (Table 2), respectively. Based on 3JH5,H6 observed in glucopyranosyl residues10 the resonances were assigned to H6pro-R and H6pro-S, respectively, which will be further supported in the subsequent conformational analysis (vide infra). Moreover, the 1H NMR chemical shift of H4 in Glc was 3.666 ppm and for H3′ in Fuc it was 3.659 ppm, i.e., a chemical shift difference of <0.01 ppm.| Proton | 1H expt. | 1H calc. | Carbon | 13C expt. | 13C calc. |
|---|---|---|---|---|---|
| a Averaged over the three protons in the methyl group of the fucosyl residue. | |||||
| H1′ | 4.645 | 4.755 | C1′ | 104.40 | 102.77 |
| H2′ | 3.506 | 3.511 | C2′ | 72.16 | 72.99 |
| H3′ | 3.659 | 3.481 | C3′ | 73.84 | 74.27 |
| H4′ | 3.747 | 3.726 | C4′ | 72.13 | 72.74 |
| H5′ | 3.787 | 3.807 | C5′ | 71.78 | 72.81 |
| H6′ | 1.265 | 1.317 | C6′ | 16.15 | 16.42 |
| H1 | 4.817 | 4.838 | C1 | 100.06 | 99.37 |
| H2 | 3.592 | 3.538 | C2 | 72.08 | 73.40 |
| H3 | 3.883 | 3.931 | C3 | 73.87 | 75.28 |
| H4 | 3.666 | 3.706 | C4 | 78.46 | 75.99 |
| H5 | 3.708 | 3.692 | C5 | 71.10 | 72.23 |
| H6pro-R | 3.904 | 3.766 | C6 | 61.62 | 61.95 |
| H6pro-S | 3.884 | 3.885 | |||
| OMea | 3.424 | 3.534 | OMe | 55.98 | 53.37 |
| Method | 3 J expt (Hz) | 3 J MD (Hz) | 3 J MD+QM (Hz) |
3
J
MD+QM![[thin space (1/6-em)]](https://www.rsc.org/images/entities/char_2009.gif) (Hz)
(Hz) |
|
|---|---|---|---|---|---|
| a Calculated according to rij = rref(σref/σij)1/6. b Calculated as rMD = 〈r−6〉−1/6 over the whole trajectory. c Obtained from σH1′,H3′+H4 = 0.117 s−1, an effective distance rH1′,H3′ = 2.510 Å from MD simulation and rearrangement of the ISPA formula to give σij = σref(rref/rij),6i.e., σH1′,H3′ = 4.94 × 10⁻² s−1. d Reference distance. e Scalar coupling constants were calculated from MD simulation using eqn (1). f Scalar coupling constants were calculated from MD simulation using eqn (2). g Scalar coupling constants were calculated from MD simulation using eqn (3). h Scalar coupling constants were calculated from MD simulation using eqn (4). i Standard deviation. j QM calculations using 400 MD-extracted frames with constraints on glycosidic linkage; weighted according to MD populations. k QM calculations using 400 MD-extracted frames with constraints on glycosidic linkage; weighted according to QM energies. l Eqn (1), QM/MM-MD simulations. m Eqn (2), QM/MM-MD simulations. n Calculated as rMD = 〈r−6〉−1/6 for syn-conformations. o Calculated as rMD = 〈r−6〉−1/6 for anti-ψ conformations. p Calculated as rMD = 〈r−6〉−1/6 for anti-ϕ conformations. | |||||
| H5,H6pro-R | PERCH | 4.55 (0.03)i | 4.95g | 5.51 | 3.85 |
| H5,H6pro-S | PERCH | 2.24 (0.09)i | 2.27h | 2.42 | 2.53 |
The conformational space populated by F4G was investigated using a combination of NMR experiments and computational methods. Proton–proton cross-relaxation rates across the glycosidic linkage between the two sugar residues as well as those from intra-residue correlations were obtained by 1D 1H,1H-NOESY and 1H,1H-STEP-NOESY experiments. An array of mixing times utilizing selective excitations at the resonance frequencies for anomeric protons, as well as a TOCSY spin-lock for transfer from H1 to H3 followed by selective excitation in the latter experiment, resulted in NOE buildup curves that were analyzed as devised by Dixon et al.19 (Fig. 3), whereby proton–proton cross-relaxation rates were obtained (Table 2). From the MD simulation an effective distance for the H1,H2 pair in the α-linked glucosyl residue was calculated as 2.40 Å and used as a reference distance to obtain information on inter-residual proton–proton interactions. For the β-linked fucosyl residue the H1′,H2′ distance obtained from experiment using ISPA resulted in a longer distance of 3.00 Å in good agreement with that from the MD simulation, being 3.06 Å. The severe spectral overlap of H4 in Glc and H3′ in Fuc precluded direct analysis of the transglycosidic H1′,H4 NOE. However, its cross-relaxation rate and subsequently the distance between H1′ and H4 could be obtained following the procedure described by Zaccheus et al.,54i.e., the computed effective intra-residue H1′,H3′ distance being 2.51 Å from the MD simulation was together with rearrangement of the ISPA formula used to give the cross-relaxation rate for H1′,H3′, which was subtracted from the sum of the two contributions to the determined cross-relaxation rate (Table 2) from the buildup of the NOE peak at ∼3.66 ppm. The transglycosidic H1′,H4 distance was from the NOE experiment determined to be 2.38 Å, in excellent agreement with that from the MD simulation, also being 2.38 Å.
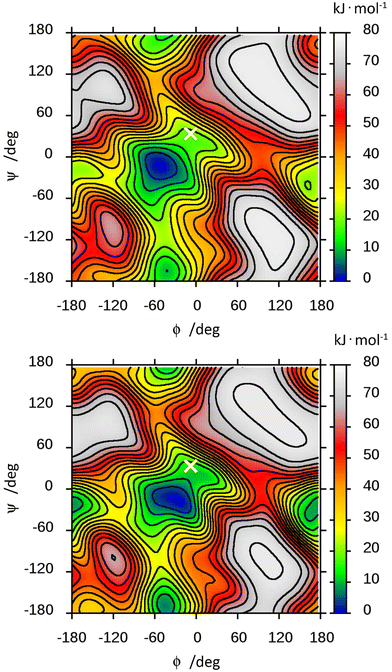
The free energy landscape of F4G was computed from the MD simulations in the presence of explicit water and in vacuo (Fig. 4). The low-energy region is observed for an exo-syn conformation in which the ϕ torsion angle shows an exo-anomeric conformation and the ψ torsion angle is tilted to some extent from an eclipsed conformation; thus, the hydrogen atoms at the glycosidic linkage are arranged such that they are on the same side of a plane perpendicular to the C1′,H1′ bond. The MD simulation showed for glycosidic torsion angles averages and root-mean-square deviations (in parentheses) of 〈ϕ〉 = −52.1° (13.4), 〈ψ〉 = −14.6° (18.5) and 〈ϕMe〉 = −50.0° (11.1) with explicit water molecules as solvent. The free energy landscape of F4G calculated from this set of MD simulations shows, besides the major syn-conformation centered at ϕ/ψ ≈ −50°/−15°, that two anti-conformational states are populated, anti-ϕ and anti-ψ, with a closely similar free energy surface of the in vacuo ϕ/ψ map (Fig. 4). Although the crystal structure of F4G corresponds to a syn-conformation with ϕ = −6° and ψ = 34°, this conformation corresponds to a free energy difference of ∼20 kJ mol−1, suggesting that intermolecular forces (crystal packing) affect the conformation of the disaccharide in the solid state to a significant extent. However, for the α-D-hexopyranoside at the reducing end of the disaccharide the exo-anomeric conformation is maintained with ϕMe = −56°, closely similar to the average conformation from the MD simulations.
The local minima of the free energy corresponding to the anti-ψ and anti-ϕ conformers have levels of 9.9 and 19.2 kJ mol−1 with respect to the exo-syn conformation, respectively. This corresponds to the exo-syn![[thin space (1/6-em)]](https://www.rsc.org/images/entities/char_2009.gif) :
:![[thin space (1/6-em)]](https://www.rsc.org/images/entities/char_2009.gif) anti-ψ
anti-ψ![[thin space (1/6-em)]](https://www.rsc.org/images/entities/char_2009.gif) :
:![[thin space (1/6-em)]](https://www.rsc.org/images/entities/char_2009.gif) anti-ϕ distribution of ca. 98
anti-ϕ distribution of ca. 98![[thin space (1/6-em)]](https://www.rsc.org/images/entities/char_2009.gif) :
:![[thin space (1/6-em)]](https://www.rsc.org/images/entities/char_2009.gif) 2
2![[thin space (1/6-em)]](https://www.rsc.org/images/entities/char_2009.gif) :
:![[thin space (1/6-em)]](https://www.rsc.org/images/entities/char_2009.gif) 0, respectively. Similar energy levels (10.2 and 13.6 kJ mol−1, respectively) and roughly identical distribution of conformational states (98
0, respectively. Similar energy levels (10.2 and 13.6 kJ mol−1, respectively) and roughly identical distribution of conformational states (98![[thin space (1/6-em)]](https://www.rsc.org/images/entities/char_2009.gif) :
:![[thin space (1/6-em)]](https://www.rsc.org/images/entities/char_2009.gif) 2
2![[thin space (1/6-em)]](https://www.rsc.org/images/entities/char_2009.gif) :
:![[thin space (1/6-em)]](https://www.rsc.org/images/entities/char_2009.gif) 0, respectively) are obtained when calculating the average energies of particular conformers of the glycosidic linkage by using the QM data and the modified version of eqn (5) in which spectroscopic parameter values Pi are replaced by QM energies.
0, respectively) are obtained when calculating the average energies of particular conformers of the glycosidic linkage by using the QM data and the modified version of eqn (5) in which spectroscopic parameter values Pi are replaced by QM energies.
Flexibility at the glycosidic linkage of oligosaccharides has been identified as anti-conformations at both the ϕ and ψ torsion angles.55–58 A comparison of the experimental distance from the NOESY experiments shows H1′,H3 = 3.30 Å, which is shorter than the effective distance computed from the MD simulation for which H1′,H3 = 3.69 Å. Furthermore, the effective distance for the all-syn-conformation is 3.75 Å, whereas averaged over the anti-ψ conformational state it is significantly shorter, being 2.46 Å (Table 2). Thus, to investigate to what extent the anti-ψ conformational state is populated, NMR data from the 1D 1H,1H-NOESY experiments of the interaction between protons together with computed distances from the MD simulation can be used in a two-state analysis, e.g., syn- and anti-conformation at the glycosidic linkage:
| (1 − x)〈rsyn−6〉 + (x)〈ranti−6〉 = rexpt−6 | (7) |
 | (8) |
The free energy profile of the ω torsion angle was computed from the MD simulation (Fig. 5) and the rotamer distribution for gt![[thin space (1/6-em)]](https://www.rsc.org/images/entities/char_2009.gif) :
:![[thin space (1/6-em)]](https://www.rsc.org/images/entities/char_2009.gif) gg
gg![[thin space (1/6-em)]](https://www.rsc.org/images/entities/char_2009.gif) :
:![[thin space (1/6-em)]](https://www.rsc.org/images/entities/char_2009.gif) tg was 39
tg was 39![[thin space (1/6-em)]](https://www.rsc.org/images/entities/char_2009.gif) :
:![[thin space (1/6-em)]](https://www.rsc.org/images/entities/char_2009.gif) 52
52![[thin space (1/6-em)]](https://www.rsc.org/images/entities/char_2009.gif) :
:![[thin space (1/6-em)]](https://www.rsc.org/images/entities/char_2009.gif) 9, respectively, in excellent agreement with that obtained from NMR 3JH5,H6 coupling constants (Table 2) resulting in, for the rotamers, gt
9, respectively, in excellent agreement with that obtained from NMR 3JH5,H6 coupling constants (Table 2) resulting in, for the rotamers, gt![[thin space (1/6-em)]](https://www.rsc.org/images/entities/char_2009.gif) :
:![[thin space (1/6-em)]](https://www.rsc.org/images/entities/char_2009.gif) gg
gg![[thin space (1/6-em)]](https://www.rsc.org/images/entities/char_2009.gif) :
:![[thin space (1/6-em)]](https://www.rsc.org/images/entities/char_2009.gif) tg of 38
tg of 38![[thin space (1/6-em)]](https://www.rsc.org/images/entities/char_2009.gif) :
:![[thin space (1/6-em)]](https://www.rsc.org/images/entities/char_2009.gif) 53
53![[thin space (1/6-em)]](https://www.rsc.org/images/entities/char_2009.gif) :
:![[thin space (1/6-em)]](https://www.rsc.org/images/entities/char_2009.gif) 9, respectively, similar to that of α-D-Glcp-OMe having the gt
9, respectively, similar to that of α-D-Glcp-OMe having the gt![[thin space (1/6-em)]](https://www.rsc.org/images/entities/char_2009.gif) :
:![[thin space (1/6-em)]](https://www.rsc.org/images/entities/char_2009.gif) gg
gg![[thin space (1/6-em)]](https://www.rsc.org/images/entities/char_2009.gif) :
:![[thin space (1/6-em)]](https://www.rsc.org/images/entities/char_2009.gif) tg rotamers populated as 42
tg rotamers populated as 42![[thin space (1/6-em)]](https://www.rsc.org/images/entities/char_2009.gif) :
:![[thin space (1/6-em)]](https://www.rsc.org/images/entities/char_2009.gif) 49
49![[thin space (1/6-em)]](https://www.rsc.org/images/entities/char_2009.gif) :
:![[thin space (1/6-em)]](https://www.rsc.org/images/entities/char_2009.gif) 9, respectively.59 If the 1H NMR resonance assignments for the hydroxymethyl protons in F4G were to be reversed, with a small coupling constant for H5,H6pro-R and a large coupling constant for H5,H6pro-S, this would lead to a rotamer distribution for gt
9, respectively.59 If the 1H NMR resonance assignments for the hydroxymethyl protons in F4G were to be reversed, with a small coupling constant for H5,H6pro-R and a large coupling constant for H5,H6pro-S, this would lead to a rotamer distribution for gt![[thin space (1/6-em)]](https://www.rsc.org/images/entities/char_2009.gif) :
:![[thin space (1/6-em)]](https://www.rsc.org/images/entities/char_2009.gif) gg
gg![[thin space (1/6-em)]](https://www.rsc.org/images/entities/char_2009.gif) :
:![[thin space (1/6-em)]](https://www.rsc.org/images/entities/char_2009.gif) tg of 2
tg of 2![[thin space (1/6-em)]](https://www.rsc.org/images/entities/char_2009.gif) :
:![[thin space (1/6-em)]](https://www.rsc.org/images/entities/char_2009.gif) 64
64![[thin space (1/6-em)]](https://www.rsc.org/images/entities/char_2009.gif) :
:![[thin space (1/6-em)]](https://www.rsc.org/images/entities/char_2009.gif) 34, respectively, which disagrees with the one obtained from the MD simulation in particular, and glucopyranosyl residues in general.10,60 It may be noted that the average values the glycosidic torsion angles ϕ and ψ are closely similar even if the ω conformational state is altered, i.e., 〈ϕ〉gt = −51.7°, 〈ψ〉gt = −16.5°, 〈ϕ〉gg = −53.3°, 〈ψ〉gg = −13.8°, 〈ϕ〉tg = −47.0°, and 〈ψ〉tg = −11.4°.
34, respectively, which disagrees with the one obtained from the MD simulation in particular, and glucopyranosyl residues in general.10,60 It may be noted that the average values the glycosidic torsion angles ϕ and ψ are closely similar even if the ω conformational state is altered, i.e., 〈ϕ〉gt = −51.7°, 〈ψ〉gt = −16.5°, 〈ϕ〉gg = −53.3°, 〈ψ〉gg = −13.8°, 〈ϕ〉tg = −47.0°, and 〈ψ〉tg = −11.4°.
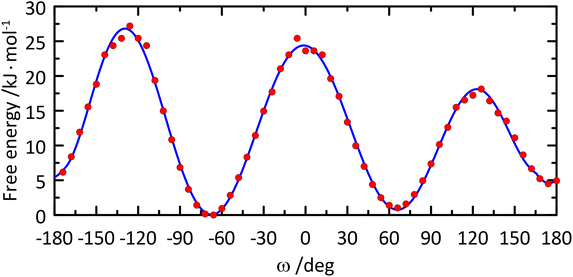 | ||
| Fig. 5 Free energy profile of the ω torsion angle in the glucosyl residue of β-L-Fucp-(1→4)-α-D-Glcp-OMe. | ||
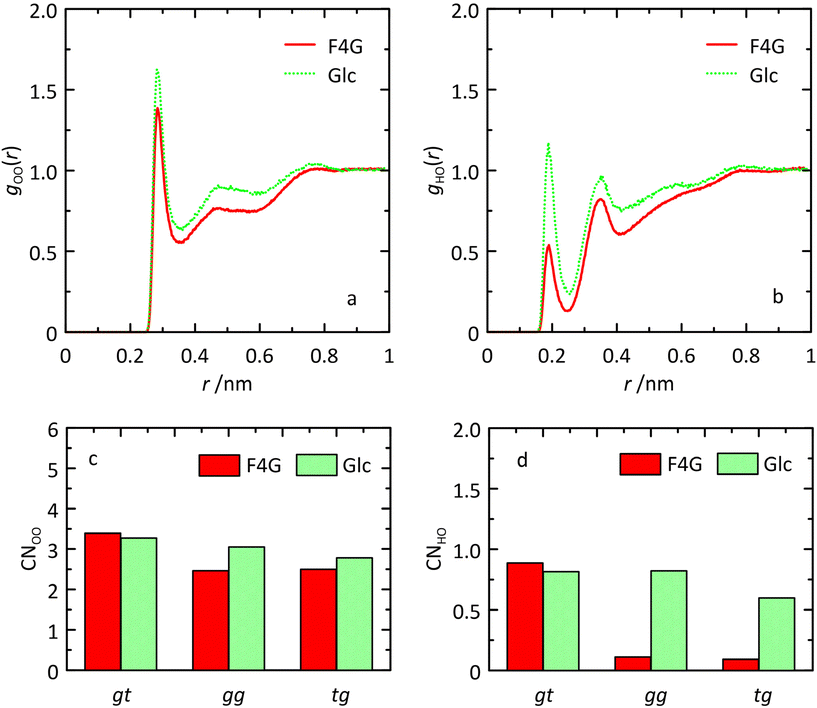
Analysis of the MD simulation revealed that inter-residue hydrogen bonding occurred to a significant extent: for O5′⋯HO6 in the syn-conformation to ∼50% and for O5′⋯HO3 in both the anti-ϕ and anti-ψ conformational states to ∼80% and ∼50%, respectively (Table 3). A large upfield chemical shift displacement, ΔδH ≈ −0.5 ppm, for HO6 in F4G compared to α-D-Glcp-OMe has been reported and the shielding of the proton was attributed to its proximity to O5′ in the fucosyl residue.61,62 The result from the MD simulation showing the occurrence of the O5′⋯HO6 hydrogen bond during half of the time and consequently reduced hydration can be further analyzed using radial distribution functions (RDFs) gOO(r) and gHO(r) and coordination numbers (CNs).63,64 The RDFs of the HO6 atoms to oxygen atoms in water molecules are for O6 in F4G quite similar to those for O6 in α-D-Glcp-OMe and so are the CNs (Fig. 6). For F4G in which the hydroxymethyl group populates the conformational states gg and tg the RDF CNOO ≈ 2.5, whereas in the gt state CNOO ≈ 3.4. In contrast, analysis of the RDF and CN for the hydrogen atom of the hydroxymethyl group showed reduced hydration (Fig. 6) with CNHO(r) ≈ 0.1 in the gg and tg states compared to CNHO(r) ≈ 0.9 in the gt state, a finding in agreement with the interpretation based on the upfield 1H NMR chemical shift displacement.
| Donor | Acceptor | MD (additive FF) | QM/MM-MD |
|---|---|---|---|
| a Determined exclusively for anti-ϕ conformation. b Determined exclusively for anti-ψ conformation. c Distribution of the O5′⋯HO6 hydrogen bond: gt = 0%, gg = 85% and tg = 15%. d gt = 0%, gg = 100% and tg = 0%. | |||
| HO3 | O5′ | 0.5 | 0 |
| HO3 | O5′ | 80.6a | — |
| HO3 | O5′ | 47.4b | — |
| HO6 | O5′ | 51.4c | 98.2d |
| HO3 | HO2′ | 3.2 | 0 |
| HO6 | HO2′ | 0.1 | 0 |
Notably, it is for the gg rotamer that the O5′⋯HO6 hydrogen bond is of greatest importance. When this hydrogen bonding takes place, it is distributed such that 85% of the time the hydroxymethyl group populates the gg conformational state but only 15% of the time is the tg conformational state involved (Table 3). 1H,1H-NOEs have been reported between HO6 and H4 on the glucosyl residue and inter-residually from HO6 to H1′, H5′ and H6′.61 NOEs are weighted according to an 〈rij−6〉-average and the effective distances were calculated from the MD simulation (vide supra) for the four inter-proton interactions; whereas the HO6,H1′ distance was similar in both the gg and tg rotamers, those between HO6 and H4, H5′ and H6′ were all shorter for the gg rotamer than for the tg rotamer (Table 4), which may also be consistent with the NOEs previously observed.
Barriers to rotation of the ω torsion angle from the 1D free energy (F) profile (Fig. 5) were calculated from the classical MD simulation and a polynomial curve fitting of degree 12 resulting in: ΔF(gt → gg) = 23.5 kJ mol−1, ΔF(gt → tg) = 17.3 kJ mol−1, ΔF(gg → gt) = 24.4 kJ mol−1, ΔF(gg → tg) = 26.8 kJ mol−1, ΔF(tg → gg) = 22.3 kJ mol−1, and ΔF(tg → gt) = 13.8 kJ mol−1. The lowest barriers to rotation are related to transitions between the gt and tg conformational states, in which eclipsing of the O6 atom and the small H5 atom takes place. The two remaining barriers are associated with eclipsing of O6 with either O5 or C4, i.e., much larger atoms, which results in stronger repulsive interactions and, consequently, higher barriers for rotation. This effect is accompanied by the influence of the O5′⋯HO6 hydrogen bond, which is pronounced when the hydroxymethyl group in the glucosyl residue has the gg conformation. Thus, the gg → gt and gg → tg barriers are presumably elevated by the energy needed to disrupt this interaction. The independent MD simulations of α-D-Glcp-OMe (carried out according to a protocol identical to that applied for F4G), demonstrated that all barriers to rotation of the ω torsion angle are reduced in comparison to F4G by 2.2–3.3 kJ mol−1. In the context of barriers vicinal to the gg conformational state the effect of lowering barriers to rotation may be ascribed to lack of an intramolecular hydrogen bond involving HO6 when ω has the gg conformation. The rotamer distribution determined from MD simulations for α-D-Glcp-OMe is: gt![[thin space (1/6-em)]](https://www.rsc.org/images/entities/char_2009.gif) :
:![[thin space (1/6-em)]](https://www.rsc.org/images/entities/char_2009.gif) gg
gg![[thin space (1/6-em)]](https://www.rsc.org/images/entities/char_2009.gif) :
:![[thin space (1/6-em)]](https://www.rsc.org/images/entities/char_2009.gif) tg = 42
tg = 42![[thin space (1/6-em)]](https://www.rsc.org/images/entities/char_2009.gif) :
:![[thin space (1/6-em)]](https://www.rsc.org/images/entities/char_2009.gif) 55
55![[thin space (1/6-em)]](https://www.rsc.org/images/entities/char_2009.gif) :
:![[thin space (1/6-em)]](https://www.rsc.org/images/entities/char_2009.gif) 3, i.e., closely similar to that of F4G and in line with the NMR-based estimations.59 The reduced population of the tg conformer in the monosaccharide may be attributed to more unfavorable interactions of O6 with O4, bearing a larger negative charge in comparison to O4 as part of the glycosidic linkage joining the two sugar residues in F4G (−0.65 vs. −0.36 e−, respectively).
3, i.e., closely similar to that of F4G and in line with the NMR-based estimations.59 The reduced population of the tg conformer in the monosaccharide may be attributed to more unfavorable interactions of O6 with O4, bearing a larger negative charge in comparison to O4 as part of the glycosidic linkage joining the two sugar residues in F4G (−0.65 vs. −0.36 e−, respectively).
Transglycosidic 3JH1′,C4 and 3JC1′,H4 coupling constants related to the glycosidic torsion angles ϕ and ψ, respectively, can via Karplus-type relationships give information of conformational preferences at the glycosidic linkage. Two different types of NMR experiments, J-HMBC and 1DLR,20–22 were used to obtain heteronuclear coupling constants resulting in 3JH1′,C4 ≈ 4 Hz and 3JC1′,H4 ≈ 5 Hz related to the ϕ and ψ torsion angles, respectively. From the MD simulation heteronuclear coupling constants were computed using Karplus-type relationships (eqn (1) and (2), respectively) which underestimated 3J(ϕ) somewhat (Table 2), and in this case a parametrization65 proposed by adding a phase shift Θ set as +6° to the originally proposed Karplus-type relationship (eqn (1)) resulted in 2.51 Hz, i.e., an even larger deviation. In contrast, the computed 3J(ψ) was instead somewhat overestimated from the MD simulation (Table 2). An MD-based ϕ,ψ torsion angle distribution was sampled consisting of 400 structures (Fig. 7), which subsequently were constrained at specific torsion angles and geometry-optimized employing QM-based methodology. The computed 3JH1′,C4 coupling constants and the Karplus-type relationship for the ϕ torsion angle agree extraordinarily well, suggesting that this type of heteronuclear coupling constant at the glycosidic linkage can be used to assess carbohydrate force fields employed for MD simulations or to further refine force field parameters to obtain accurate descriptions of molecular structure and dynamics. Related to the ψ torsion angle, the QM-computed 3JC1′,H4 coupling constants are similar to those described by the Karplus-type relationship (Fig. 7) and the differences observed can be used for further improvement of the parametrization of the function (i.e., of eqn (2)).
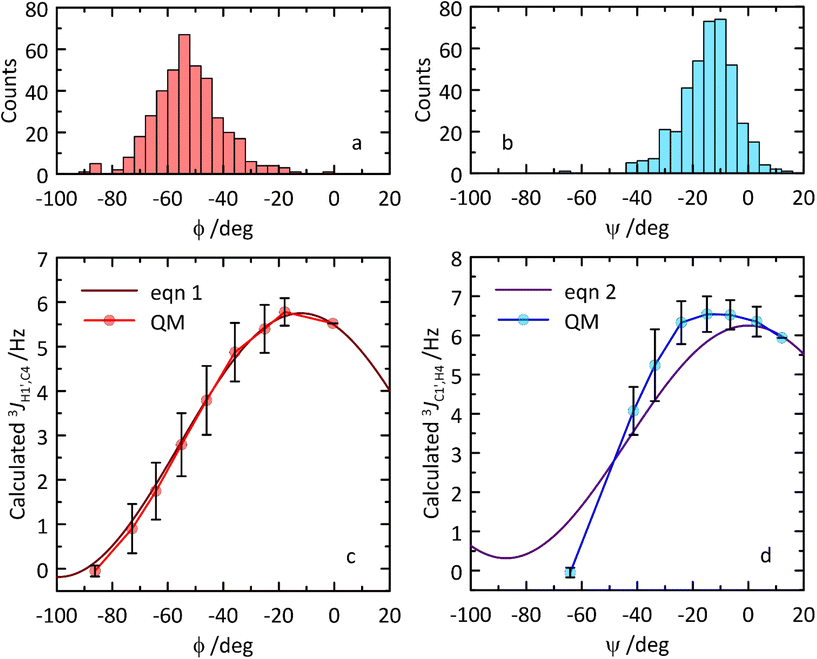 | ||
| Fig. 7 (a and b) Distribution of ϕ and ψ torsion angle values across the subsampled ensemble of 400 MD structures. (c and d) Comparison of transglycosidic 3JCH Karplus-type relationships (eqn (1) and (2)) (solid lines) for the ϕ and ψ torsion angles in β-L-Fucp-(1→4)-α-D-Glcp-OMe to those calculated using constrained torsion angles from MD simulations and subsequently QM-based geometry-optimized structures (circles). QM data correspond to the averages calculated within 10° ranges. Vertical bars denote the corresponding standard deviation values. | ||
Interestingly, using eqn (1) and (2) in combination with QM/MM-MD trajectory leads to nearly the same 3JH1′,C4 and 3JC1′,H4 values as those determined from classical MD simulations (Table 2); the corresponding differences are marginal and do not exceed 0.03 Hz. This indicates that a quite accurate estimation of transglycosidic J coupling constants and the associated conformational properties is possible even when sampling of conformational space relies on very short (i.e., of length of tens of ps) QM/MM-MD trajectories. Such observation may be relevant in the context of studying the conformation of rare sugars or saccharides with unusual substituents for which no thoroughly validated classical force fields are available. Still, the applicability of the QM/MM-MD simulations is restricted by the timescale of the conformational transitions relevant for the determined J coupling constants which can be illustrated by the case of JH5,H6pro-R and JH5,H6pro-S; their values cannot be reliably estimated using the QM/MM-MD data, because the orientation of the hydroxymethyl moiety is conformationally restricted due to short sampling time.
The predictions made by the ‘hybrid’ approach relying on the use of MD-extracted structures, weighted accordingly and direct calculation of J coupling constants exhibit slightly larger deviations from the experimental values in comparison to the classical MD trajectories and eqn (1) and (2) (Table 2). This is a result of the lack of ‘off-equilibrium’ structures that do not correspond to either global or local energy minima in the set of structures subjected to QM calculations. This effect is a consequence of the geometry optimization procedure preceding calculations of the NMR parameters, which can influence the geometry of crucial degrees of freedom (such as ϕ and ψ torsion angles) and bias the average values of 3JCH. However, the ‘hybrid’ approach still can be useful when applied to the cases of compounds for which no Karplus-like relationships are developed or to torsional angles displaying limited variability (e.g., convoluted into cyclic structure) and, therefore, less prone to geometry optimization-induced alterations of geometry. Replacing weights from MD populations by Boltzmann weights dependent only on the QM energies results in a significant improvement of the 3JH1′,C4 value but not that of 3JC1′,H4.
From the QM-based geometry-optimized ensemble 1H and 13C NMR chemical shifts were calculated at the DFT/B3LYP/6-311+G(d,p) level of theory. It is evident that for most NMR chemical shifts the agreement between experiment and computed data is very good (Table 1 and Fig. 8), using the population distribution from the MD simulation as the starting point for the calculation of chemical shifts. Furthermore, the conformational dependence of the 13C NMR chemical shifts of the C1′ and C4 nuclei at the glycosidic linkage (Fig. 9) would make possible their use in refinement of the population distribution of the ϕ and ψ torsion angles. In addition, H6pro-R and H6pro-S show distinct 1H NMR chemical shifts as a function of the conformational state of the ω torsion angle (Fig. 10) and although the 1H chemical shift of H6pro-R differs between experiment and computed value, that of H6pro-S is in excellent agreement between experiment and computed value (Table 1). Moreover, for the three conformational states of the hydroxymethyl group the 13C NMR chemical shift of C6 has a span of ∼5 ppm, with the lowest chemical shift at ∼61 ppm for the gg rotamer, at ∼64 ppm for the gt rotamer and the highest chemical shift at ∼66 ppm for the tg rotamer (Fig. 10). Convincingly, δC6 agrees very well between experimental and computed values (Table 1), which supports the rotamer distribution for the ω torsion angle, and consequently the 1H NMR chemical shift assignments for the hydroxymethyl protons (vide infra).
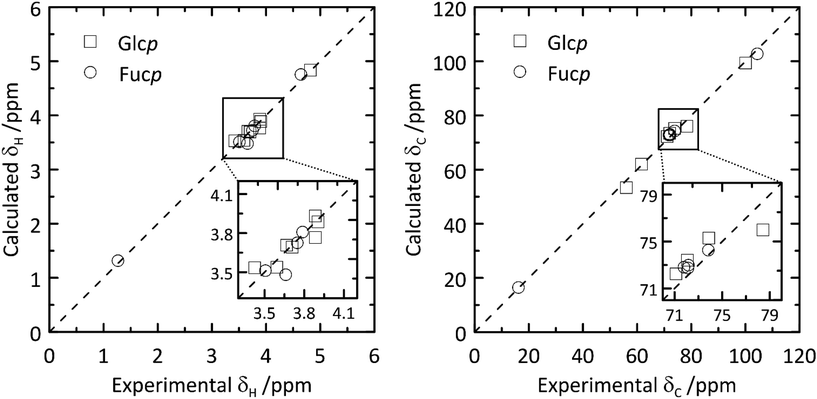 | ||
| Fig. 8 Calculated versus experimental 1H (left) and 13C (right) NMR chemical shifts of β-L-Fucp-(1→4)-α-D-Glcp-OMe.11 | ||
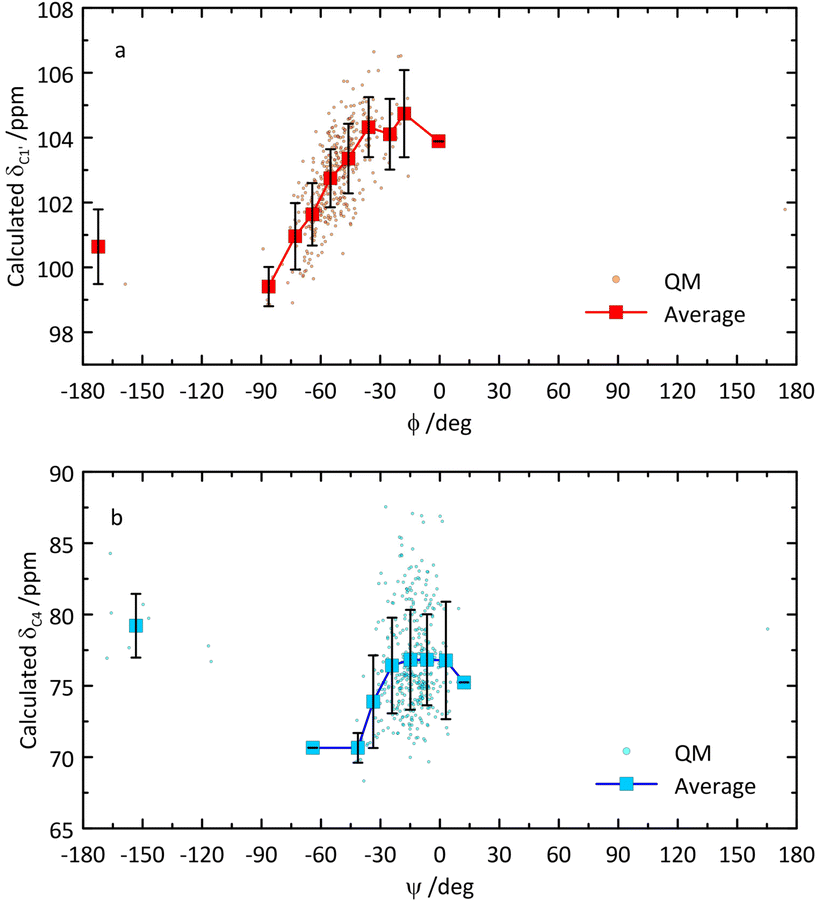 | ||
| Fig. 9 Calculated 13C NMR chemical shifts of C1′ versus glycosidic torsion angle ϕ (a) and of C4 versus glycosidic torsion angle ψ (b) of β-L-Fucp-(1→4)-α-D-Glcp-OMe. | ||
 | ||
| Fig. 10 Calculated NMR chemical shifts of H6pro-R (a), H6pro-S (b) and C6 (c) versus the ω torsion angle of the glucosyl residue in β-L-Fucp-(1→4)-α-D-Glcp-OMe. | ||
Conclusions
The conformational space at the glycosidic linkage of the disaccharide F4G is described by a low-energy region with an exo-syn conformation, present also in the crystal structure, and the two anti-ϕ and anti-ψ conformational states (Fig. 11). NMR spin-simulation of 1H NMR spectra obtained at three different frequencies was used to refine chemical shifts, which for H6 protons of the hydroxymethyl group in the glucosyl residue differed by only 0.02 ppm, and homonuclear coupling constants that for 3JH5,H6 in the glucosyl residue made it possible to determine the rotamer distribution of the ω torsion angle. In the major gg conformation for the hydroxymethyl group an O5′⋯HO6 hydrogen bond was highly populated as identified by MD simulations.QM-based methodology facilitated the calculation of transglycosidic NMR 3JCH coupling constants and 1H and 13C NMR chemical shifts, the conformational dependence of the 13C NMR chemical shifts at the glycosidic linkage, i.e., C1′ versus glycosidic torsion angle ϕ and C4 versus glycosidic torsion angle ψ, as well as the NMR chemical shifts of H6pro-R, H6pro-S and C6 as a function of the ω torsion angle. The computational results show that the methodology developed based on MD simulations and QM calculations is able to accurately reproduce experimental NMR data.
Conflicts of interest
There are no conflicts to declare.Acknowledgements
This work was supported by grants from the Swedish Research Council (2022-03014) and The Knut and Alice Wallenberg Foundation (G.W.) and Polish National Science Centre (contract financed in 2020–2024 under Project No. 2019/35/B/ST4/01149 OPUS 18) (W.P.).References
- R. L. Schnaar, Glycobiology simplified: diverse roles of glycan recognition in inflammation, J. Leukocyte Biol., 2016, 99, 825–838 CrossRef CAS PubMed.
- B. A. H. Smith and C. R. Bertozzi, The clinical impact of glycobiology: targeting selectins, Siglecs and mammalian glycans, Nat. Rev. Drug Discovery, 2021, 20, 217–243 CrossRef CAS PubMed.
- J. Y. Zhou and B. A. Cobb, Glycans in Immunologic Health and Disease, Annu. Rev. Immunol., 2021, 39, 511–536 CrossRef CAS PubMed.
- S. Esmail and M. F. Manolson, Advances in understanding N-glycosylation structure, function, and regulation in health and disease, Eur. J. Cell Biol., 2021, 100, 151186 CrossRef CAS PubMed.
- L. Eriksson and G. Widmalm, Crystal structure of methyl α-L-rhamnopyranosyl-(1→2)-α-L-rhamnopyranoside monohydrate, Acta Crystallogr., Sect. E: Crystallogr. Commun., 2019, 75, 854–857 CrossRef CAS PubMed.
- M. Zerbetto, A. Polimeno and G. Widmalm, Glycosidic linkage flexibility: The ψ torsion angle has a bimodal distribution in α-L-Rhap-(1→2)-α-L-Rhap-OMe as deduced from 13C NMR spin relaxation, J. Chem. Phys., 2020, 152, 035103 CrossRef CAS PubMed.
- R. Pendrill, O. Engström, A. Volpato, M. Zerbetto, A. Polimeno and G. Widmalm, Flexibility at a glycosidic linkage revealed by molecular dynamics, stochastic modeling, and 13C NMR spin relaxation: Conformational preferences of α-L-Rhap-(1→2)-α-L-Rhap-OMe in water and dimethyl sulfoxide solutions, Phys. Chem. Chem. Phys., 2016, 18, 3086–3096 RSC.
- L. Eriksson, R. Stenutz and G. Widmalm, Methyl 4-O-β-L-fucopyranosyl α-D-glucopyranoside hemihydrate, Acta Crystallogr., Sect. C: Cryst. Struct. Commun., 2000, 56, 702–704 CrossRef CAS PubMed.
- E. R. Alonso, I. Peña, C. Cabezas and J. L. Alonso, Structural Expression of Exo-Anomeric Effect, J. Phys. Chem. Lett., 2016, 7, 845–850 CrossRef CAS PubMed.
- R. Stenutz, I. Carmichael, G. Widmalm and A. S. Serianni, Hydroxymethyl Group Conformation in Saccharides: Structural Dependencies of 2JHH, 3JHH, and 1JCH Spin−Spin Coupling Constants, J. Org. Chem., 2002, 67, 949–958 CrossRef CAS PubMed.
- I. Backman, B. Erbing, P.-E. Jansson and L. Kenne, N.m.r. and conformational studies of some 1,4-linked disaccharides, J. Chem. Soc., Perkin Trans. 1, 1988, 889–897 RSC.
- M. Findeisen, T. Brand and S. Berger, A 1H-NMR thermometer suitable for cryoprobes, Magn. Reson. Chem., 2007, 45, 175–178 CrossRef CAS PubMed.
- R. Laatikainen, M. Niemitz, U. Weber, J. Sundelin, T. Hassinen and J. Vepsäläinen, General Strategies for Total-Lineshape-Type Spectral Analysis of NMR Spectra Using Integral-Transform Iterator, J. Magn. Reson., Ser. A, 1996, 120, 1–10 CrossRef CAS.
- G. F. Pauli, S.-N. Chen, D. C. Lankin, J. Bisson, R. J. Case, L. R. Chadwick, T. Gödecke, T. Inui, A. Krunic, B. U. Jaki, J. B. McAlpine, S. Mo, J. G. Napolitano, J. Orjala, J. Lehtivarjo, S.-P. Korhonen and M. Niemitz, Essential Parameters for Structural Analysis and Dereplication by 1H NMR Spectroscopy, J. Nat. Prod., 2014, 77, 1473–1487 CrossRef CAS PubMed.
- K. Stott, J. Keeler, Q. N. Van and A. J. Shaka, One-Dimensional NOE Experiments Using Pulsed Field Gradients, J. Magn. Reson., 1997, 125, 302–324 CrossRef CAS.
- H. Hu, S. A. Bradley and K. Krishnamurthy, Extending the limits of the selective 1D NOESY experiment with an improved selective TOCSY edited preparation function, J. Magn. Reson., 2004, 171, 201–206 CrossRef CAS PubMed.
- R. Pendrill, E. Säwén and G. Widmalm, Conformation and Dynamics at a Flexible Glycosidic Linkage Revealed by NMR Spectroscopy and Molecular Dynamics Simulations: Analysis of β-L-Fucp-(1→6)-α-D-Glcp-OMe in Water Solution, J. Phys. Chem. B, 2013, 117, 14709–14722 CrossRef CAS PubMed.
- M. J. Thrippleton and J. Keeler, Elimination of zero-quantum interference in two-dimensional NMR spectra, Angew. Chem., Int. Ed., 2003, 42, 3938–3941 CrossRef CAS PubMed.
- A. M. Dixon, G. Widmalm and T. E. Bull, Modified GOESY in the analysis of disaccharide conformation, J. Magn. Reson., 2000, 147, 266–272 CrossRef CAS PubMed.
- A. Meissner and O. W. Sørensen, Measurement of J(H,H) and long-range J(X,H) coupling constants in small molecules. Broadband XLOC and J-HMBC, Magn. Reson. Chem., 2001, 39, 49–52 CrossRef CAS.
- T. Nishida, G. Widmalm and P. Sandor, Hadamard long-range proton-carbon coupling constant measurements with band-selective proton decoupling, Magn. Reson. Chem., 1995, 33, 596–599 CrossRef CAS.
- T. Nishida, G. Widmalm and P. Sandor, Hadamard Long-Range Proton—Carbon Coupling Constant Measurements with Pulsed Field Gradients, Magn. Reson. Chem., 1996, 34, 377–382 CrossRef CAS.
- F. del Río-Portilla, V. Blechta and R. Freeman, Measurement of Poorly Resolved Splittings by J Doubling in the Frequency Domain, J. Magn. Reson., Ser. A, 1994, 111, 132–135 CrossRef.
- E. Säwén, T. Massad, C. Landersjö, P. Damberg and G. Widmalm, Population distribution of flexible molecules from maximum entropy analysis using different priors as background information: application to the ϕ,ψ-conformational space of the α-(1→2)-linked mannose disaccharide present in N- and O-linked glycoprotein, Org. Biomol. Chem., 2010, 8, 3684–3695 RSC.
- O. Guvench, E. R. Hatcher, R. M. Venable, R. W. Pastor and A. D. MacKerell, Jr., CHARMM Additive All-Atom Force Field for Glycosidic Linkages between Hexopyranoses, J. Chem. Theory Comput., 2009, 5, 2353–2370 CrossRef CAS PubMed.
- O. Guvench, S. N. Greene, G. Kamath, J. W. Brady, R. M. Venable, R. W. Pastor and A. D. MacKerell, Jr., Additive Empirical Force Field for Hexopyranose Monosaccharides, J. Comput. Chem., 2008, 29, 2543–2564 CrossRef CAS PubMed.
- M. J. Abraham, T. Murtola, R. Schulz, S. Páll, J. C. Smith, B. Hess and E. Lindahl, GROMACS: High performance molecular simulations through multi-level parallelism from laptops to supercomputers, SoftwareX, 2015, 1–2, 19–25 CrossRef.
- J. Lee, X. Cheng, J. M. Swails, M. S. Yeom, P. K. Eastman, J. A. Lemkul, S. Wei, J. Buckner, J. C. Jeong, Y. Qi, S. Jo, V. S. Pande, D. A. Case, C. L. Brooks, A. D. MacKerell, Jr., J. B. Klauda and W. Im, CHARMM-GUI Input Generator for NAMD, GROMACS, AMBER, OpenMM, and CHARMM/OpenMM Simulations Using the CHARMM36 Additive Force Field, J. Chem. Theory Comput., 2016, 12, 405–413 CrossRef CAS PubMed.
- G. Bussi, D. Donadio and M. Parrinello, Canonical sampling through velocity rescaling, J. Chem. Phys., 2007, 126, 014101 CrossRef PubMed.
- M. Parrinello and A. Rahman, Polymorphic transitions in single crystals: A new molecular dynamics method, J. Appl. Phys., 1981, 52, 7182–7190 CrossRef CAS.
- R. W. Hockney, The potential calculation and some applications, Methods Comput. Phys., 1970, 9, 135–211 Search PubMed.
- W. L. Jorgensen, J. Chandrasekhar, J. D. Madura, R. W. Impey and M. L. Klein, Comparison of simple potential functions for simulating liquid water, J. Chem. Phys., 1983, 79, 926–935 CrossRef CAS.
- S. Miyamoto and P. A. Kollman, SETTLE: An analytical version of the SHAKE and RATTLE algorithm for rigid water models, J. Comput. Chem., 1992, 13, 952–962 CrossRef CAS.
- B. Hess, P-LINCS: A parallel linear constraint solver for molecular simulation, J. Chem. Theory Comput., 2008, 4, 116–122 CrossRef CAS PubMed.
- T. Darden, D. York and L. Pedersen, Particle mesh Ewald: An N log(N) method for Ewald sums in large systems, J. Chem. Phys., 1993, 98, 10089–10092 CrossRef CAS.
- G. Bussi, F. L. Gervasio, A. Laio and M. Parrinello, Free-Energy Landscape for β Hairpin Folding from Combined Parallel Tempering and Metadynamics, J. Am. Chem. Soc., 2006, 128, 13435–13441 CrossRef CAS PubMed.
- Y. Sugita and Y. Okamoto, Replica-exchange molecular dynamics method for protein folding, Chem. Phys. Lett., 1999, 314, 141–151 CrossRef CAS.
- A. Barducci, G. Bussi and M. Parrinello, Well-tempered metadynamics: A smoothly converging and tunable free-energy method, Phys. Rev. Lett., 2008, 100, 020603 CrossRef PubMed.
- G. A. Tribello, M. Bonomi, D. Branduardi, C. Camilloni and G. Bussi, PLUMED 2: New feathers for an old bird, Comput. Phys. Commun., 2014, 185, 604–613 CrossRef CAS.
- F. Neese, F. Wennmohs, U. Becker and C. Riplinger, The ORCA quantum chemistry program package, J. Chem. Phys., 2020, 152, 224108 CrossRef CAS PubMed.
- A. D. Becke, Density-functional exchange-energy approximation with correct asymptotic behavior, Phys. Rev. A, 1988, 38, 3098–3100 CrossRef CAS PubMed.
- A. Schäfer, C. Huber and R. Ahlrichs, Fully optimized contracted Gaussian basis sets of triple zeta valence quality for atoms Li to Kr, J. Chem. Phys., 1994, 100, 5829–5835 CrossRef.
- M. J. Field, P. A. Bash and M. Karplus, A combined quantum mechanical and molecular mechanical potential for molecular dynamics simulations, J. Comput. Chem., 1990, 11, 700–733 CrossRef CAS.
- K. Gaweda and W. Plazinski, Pyranose ring conformations in mono- and oligosaccharides: A combined MD and DFT approach, Phys. Chem. Chem. Phys., 2017, 19, 20760–20772 RSC.
- W. Plazinski, M. U. Roslund, E. Säwén, O. Engström, P. Tähtinen and G. Widmalm, Tautomers of N-acetyl-D-allosamine: an NMR and computational chemistry study, Org. Biomol. Chem., 2021, 19, 7190–7201 RSC.
- M. W. Lodewyk, M. R. Siebert and D. J. Tantillo, Computational Prediction of 1H and 13C Chemical Shifts: A Useful Tool for Natural Product, Mechanistic, and Synthetic Organic Chemistry, Chem. Rev., 2012, 112, 1839–1862 CrossRef CAS PubMed.
- M. J. Frisch, G. W. Trucks, H. B. Schlegel, G. E. Scuseria, M. A. Robb, J. R. Cheeseman, G. Scalmani, V. Barone, B. Mennucci, G. A. Petersson, H. Nakatsuji, M. Caricato, X. Li, H. P. Hratchian, A. F. Izmaylov, J. Bloino, G. Zheng, J. L. Sonnenberg, M. Hada, M. Ehara, K. Toyota, R. Fukuda, J. Hasegawa, M. Ishida, T. Nakajima, Y. Honda, O. Kitao, H. Nakai, T. Vreven, J. A. Montgomery Jr., J. E. Peralta, F. Ogliaro, M. Bearpark, J. J. Heyd, E. Brothers, K. N. Kudin, V. N. Staroverov, R. Kobayashi, J. Normand, K. Raghavachari, A. Rendell, J. C. Burant, S. S. Iyengar, J. Tomasi, M. Cossi, N. Rega, J. M. Millam, M. Klene, J. E. Knox, J. B. Cross, V. Bakken, C. Adamo, J. Jaramillo, R. Gomperts, R. E. Stratmann, O. Yazyev, A. J. Austin, R. Cammi, C. Pomelli, J. W. Ochterski, R. L. Martin, K. Morokuma, V. G. Zakrzewski, G. A. Voth, P. Salvador, J. J. Dannenberg, S. Dapprich, A. D. Daniels, Ö. Farkas, J. B. Foresman, J. V. Ortiz, J. Cioslowski and D. J. Fox, Gaussian 09, Revision E.01, Gaussian, Inc., Wallingford CT, 2009 Search PubMed.
- A. D. Becke, Density-functional thermochemistry. III. The role of exact exchange, J. Chem. Phys., 1993, 98, 5648–5652 CrossRef CAS.
- W. J. Hehre, L. Radom, P. von R. Schleyer and J. Pople, AB INITIO Molecular Orbital Theory, Wiley-Interscience, 1986 Search PubMed.
- M. Cossi, V. Barone, R. Cammi and J. Tomasi, Ab initio study of solvated molecules: a new implementation of the polarizable continuum model, Chem. Phys. Lett., 1996, 255, 327–335 CrossRef CAS.
- K. Wolinski, J. F. Hinton and P. Pulay, Efficient implementation of the gauge-independent atomic orbital method for NMR chemical shift calculations, J. Am. Chem. Soc., 1990, 112, 8251–8260 CrossRef CAS.
- W. Deng, J. R. Cheeseman and M. J. Frisch, Calculation of Nuclear Spin - Spin Coupling Constants of Molecules with First and Second Row Atoms in Study of Basis Set Dependence, J. Chem. Theory Comput., 2006, 2, 1028–1037 CrossRef CAS PubMed.
- P.-E. Jansson, L. Kenne and G. Widmalm, CASPER-a computerised approach to structure determination of polysaccharides using information from n.m.r. spectroscopy and simple chemical analyses, Carbohydr. Res., 1987, 168, 67–77 CrossRef CAS.
- M. V. Zaccheus, R. Pendrill, T. A. Jackson, A. Wang, F.-I. Auzanneau and G. Widmalm, Conformational Dynamics of a Central Trisaccharide Fragment of the LeaLex Tumor Associated Antigen Studied by NMR Spectroscopy and Molecular Dynamics Simulations, Eur. J. Org. Chem., 2012, 4705–4715 CrossRef CAS.
- C. Landersjö, R. Stenutz and G. Widmalm, Conformational flexibility of carbohydrates: A folded conformer at the ϕ dihedral angle of a glycosidic linkage, J. Am. Chem. Soc., 1997, 119, 8695–8698 CrossRef.
- J. Dabrowski, H. Grosskurth, T. Kožár and N. E. Nifant'ev, Conformational Mobility of Oligosaccharides: Experimental Evidence for the Existence of an “Anti” Conformer of the Galβl-3Glcβ1-OMe Disaccharide, J. Am. Chem. Soc., 1995, 117, 5534–5539 CrossRef CAS.
- C. Höög, C. Landersjö and G. Widmalm, Oligosaccharides display both rigidity and high flexibility in water as determined by 13C NMR relaxation and 1H,1H NOE spectroscopy: evidence of anti-ϕ and anti-ψ torsions in the same glycosidic linkage, Chem. – Eur. J., 2001, 7, 3069–3077 CrossRef.
- P. Vidal, J. Jiménez-Barbero and J. F. Espinosa, Conformational flexibility around the Gal-β-(1→3)-Glc linkage: Experimental evidence for the existence of the anti-ψ conformation in aqueous solution, Carbohydr. Res., 2016, 433, 36–40 CrossRef CAS PubMed.
- J. Kapla, O. Engström, B. Stevensson, J. Wohlert, G. Widmalm and A. Maliniak, Molecular dynamics simulations and NMR spectroscopy studies of trehalose-lipid bilayer systems, Phys. Chem. Chem. Phys., 2015, 17, 22438–22447 RSC.
- A. Ruda, G. Widmalm and J. Wohlert, O-methylation in carbohydrates: An NMR and MD simulation study with application to methylcellulose, J. Phys. Chem. B, 2021, 125, 11967–11979 CrossRef CAS PubMed.
- I. Ivarsson, C. Sandström, A. Sandström and L. Kenne, 1H NMR chemical shifts of hydroxy protons in conformational analysis of disaccharides in aqueous solution, J. Chem. Soc., Perkin Trans. 2, 2000, 2147–2152 RSC.
- S. Bekiroglu, L. Kenne and C. Sandström, NMR study on the hydroxy protons of the Lewis X and Lewis Y oligosaccharides, Carbohydr. Res., 2004, 339, 2465–2468 CrossRef CAS PubMed.
- C. Höög and G. Widmalm, Molecular dynamics simulation and nuclear magnetic resonance studies of the terminal glucotriose unit found in the oligosaccharide of glycoprotein precursors, Arch. Biochem. Biophys., 2000, 377, 163–170 CrossRef PubMed.
- M. Iannuzzi, A. Laio and M. Parrinello, Efficient Exploration of Reactive Potential Energy Surfaces Using Car-Parrinello Molecular Dynamics, Phys. Rev. Lett., 2003, 90, 238302 CrossRef PubMed.
- M. Yang, T. Angles d'Ortoli, E. Säwén, M. Jana, G. Widmalm and A. D. MacKerell, Jr., Delineating the conformational flexibility of trisaccharides from NMR spectroscopy experiments and computer simulations, Phys. Chem. Chem. Phys., 2016, 18, 18776–18794 RSC.
| This journal is © The Royal Society of Chemistry 2023 |

