
Suppressing Ag2Te nanoprecipitates for enhancing thermoelectric efficiency of AgSbTe2†
Zichen
Gong‡
ab,
Kivanc
Saglik‡
ac,
Jing
Wu
 ab,
Ady
Suwardi
ab and
Jing
Cao
*a
ab,
Ady
Suwardi
ab and
Jing
Cao
*a
aInstitute of Materials Research and Engineering, Agency for Science, Technology and Research, 138634, Singapore. E-mail: cao_jing@imre.a-star.edu.sg
bDepartment of Materials Science and Engineering, National University of Singapore, 117575, Singapore
cSchool of Materials Science and Engineering, Nanyang Technological University, 639798, Singapore
First published on 26th October 2023
Abstract
Thermoelectrics are a class of materials that provide interconversion between heat and electricity, with desirable traits such as low thermal conductivity and low electrical resistivity. AgSbTe2 has emerged as one of the leading materials in recent years due to its ultra-low thermal conductivity. However, one major hindrance in undoped AgSbTe2 is its high electrical resistivity and low Seebeck coefficient due to the presence of Ag2Te nanoprecipitates. In this work, we leverage on the combination of an off-stoichiometric composition and a non-equilibrium process to simultaneously enhance the properties of AgSbTe2 and its thermoelectric device performance. Microscopically, the Ag2Te-deficient starting composition combined with a non-equilibrium thermal process suppresses the Ag2Te nanoprecipitates in the material. In addition, it is evident from the density functional theory (DFT) electronic structure that Ag2Te deficiency results in a smaller lattice and higher density-of-states near the Fermi level, which simultaneously lower the electrical resistivity and increase the Seebeck coefficient. As a result, zT as high as 1.7 was achieved at 573 K. Additionally, when combined with a high room temperature zT of 0.75, a power conversion efficiency of 7.3% was achieved at a ΔT of 290 K. Crucially, the strategy in this work can inspire application in other ABX2 material systems to achieve improved thermoelectric performances.
 Jing Cao | Dr Jing Cao is currently a project leader at the Institute of Materials Research and Engineering (IMRE), Agency for Science, Technology and Research (A*STAR), Singapore. She received her Ph.D. degree in Materials Science at the University of Cambridge in 2019. Her research is primarily focused on electronic transport, specifically in thermoelectrics and ferroelectrics, and bulk photovoltaic effects. Besides experiments, she also does first principles calculations to supplement her work. Outside research, she is active in outreach activities by serving on the scientific committee for Singapore Junior Chemistry Olympiad organized by the SNIC (Singapore National Institute of Chemistry). |
Introduction
The rapidly changing climate, primarily due to the excessive consumption of energy and electricity, has created an urgent need for the development of sustainable materials to meet our renewable energy requirements. Among various renewable energy technologies, thermoelectrics hold a unique position because of their remarkable capacity to convert heat into electricity and vice versa. This distinctive capability makes them particularly valuable. One notable application of thermoelectrics lies in their capacity to harness waste heat and convert it into electricity, offering an attractive complement to technologies such as photovoltaics. By capturing and utilizing the energy that would otherwise turn into waste heat, thermoelectrics enhance overall energy conversion efficiency. Moreover, thermoelectrics also excel as solid-state coolers, used for cooling purposes in heat-sensitive devices, which enhances the reliability and performance of existing technologies such as batteries and modern electronics. Despite their immense potential, the widespread adoption of thermoelectric technologies faces limitations, primarily in terms of their performance and overall cost.1–6Thermoelectric materials are typically characterized using the figure-of-merit zT, where zT is calculated as the product of three key parameters: the Seebeck coefficient (S), electrical conductivity (σ), and thermal conductivity (κ). To enhance the efficiency of thermoelectric materials and achieve higher zT values, various strategies including engineering scattering mechanisms, pursuing band convergence, and implementing nanostructuring techniques are employed.7–10 Each of these approaches aims to optimize the interplay between S, σ, and κ, ultimately leading to improved thermoelectric performance.11–15 Furthermore, researchers have explored a range of strategies to effectively reduce lattice thermal conductivity, including the introduction of various types of defects, the manipulation of lattice anharmonicity, the utilization of complex structures, and the application of lattice strain.16–24 In recent years, several standout materials have risen to prominence as top performers in the field of thermoelectrics. Notable among these are compounds based on GeTe, SnSe, Cu2Se, Mg3Sb2, and AgSbTe2.25–37
In particular, AgSbTe2 can potentially be used for both near room temperature and medium temperature applications, making it a versatile high performance thermoelectric material.38–46 Due to the high intrinsic Seebeck coefficient and low intrinsic thermal conductivity, high thermoelectric performance can be achieved in AgSbTe2 even in the absence of doping. Despite these advantages, this compound has been historically plagued by several major issues including cation disorder, performance instability, and the presence of n-type Ag2Te nanoprecipitates resulting from phase decomposition. Recent breakthrough has been accomplished in achieving cation ordered AgSbTe2via the process of Cd doping. However, due to the highly toxic nature of Cd, alternatives to this strategy are sought after. In this work, we leverage on off-stoichiometry and non-equilibrium thermal annealing to improve the thermoelectric performance of undoped AgSbTe2-based compounds. As shown in Fig. 1, samples with different levels of Ag2Te-deficiency were prepared at different annealing temperatures. As a result, a high zT of 1.7 at 573 K was achieved in Ag0.91Sb1.09Te2.09 annealed at 773 K. The origin of the performance enhancement can be ascribed to the combination of suppression of Ag2Te nanoprecipitates and the lowering of lattice parameters in Ag2Te-deficient samples. This results in simultaneously a higher Seebeck coefficient and lower electrical resistivity, which drastically enhances the power factor and therefore the ultimate zT across a wide temperature range. Furthermore, a high power conversion efficiency of 7.3% at ΔT of 290 K was achieved in an Ag0.91Sb1.09Te2.09 single-leg with Fe and Cu encapsulation. The off-stoichiometry and non-equilibrium strategy reported in this work can be further applied to other ABX2 material systems to achieve improved thermoelectric performances.
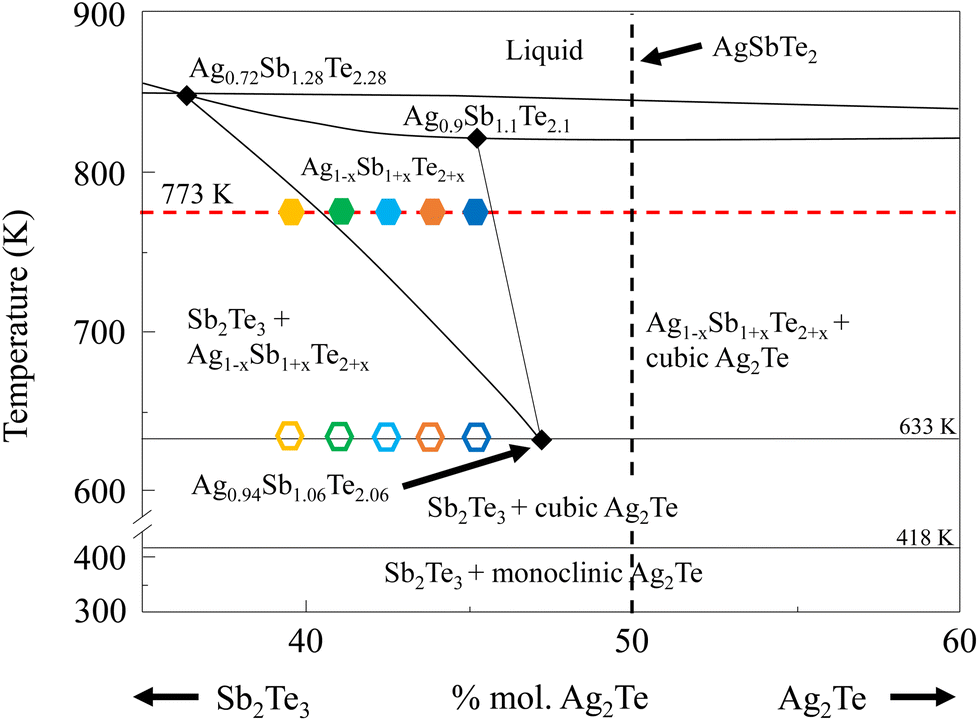 | ||
| Fig. 1 Phase diagram of AgSbTe2, plotted as a fractional %mol of Sb2Te3 and Ag2Te. Symbols of distinct colors represent the composition and processing temperature of the respective samples used in this study. Filled hexagon symbols represent samples annealed at 773 K for 24 hours followed by air quenching. Hollow hexagon symbols represent samples without such an annealing process. The figure is replotted from ref. 47. | ||
Methods
Experimental
Stoichiometric batches of Ag (99.99%) powders, Sb (99.99%) shots, and Te (99.99%) chunks from ZhongNuo Advanced Material Technology Co. Ltd were precisely weighed to a total weight of 12 grams. Subsequently, these precisely measured mixtures were sealed within quartz tubes under a vacuum environment, maintaining a pressure of 10−3 Pa. These sealed tubes were then placed into a rotary furnace and subjected to a gradual heating process, increasing the temperature to 1273 K at a rate of 5 K per minute. Furthermore, the molten samples underwent a homogenization process, achieved by automatic rotation at a constant speed of 2 rpm for a duration of 5 hours. This rigorous and controlled procedure was employed to ensure the uniformity and consistency of the resulting material. To prevent excessive phase decomposition during cooling, the furnace was switched off at 1273 K and allowed to cool down in 3 hours. The obtained ingots were ground into powders, followed by spark plasma sintering (SPS) at 673 K at 50 MPa for 5 minutes. Subsequently, the obtained pellets were cut into various shapes and subjected to thermal processing for subsequent measurements. 5 samples of different compositions (represented as filled hexagon symbols) were annealed at 773 K for 24 hours, followed by air-quenching, whereas the remaining 5 samples of the same composition (represented as hollow hexagon symbols) did not undergo such a process.Electronic transport properties were measured using a ZEM-3 from ULVAC to determine the Seebeck coefficient and electrical resistivity. For this purpose, the samples were cut into rectangular bars, approximately 2 mm × 2 mm × 12 mm height. The thermal transport properties were measured using a laser LFA 457, NETZSCH, with a laser energy of 10 J. LFA samples are typically thin rectangular samples measuring 6 mm × 6 mm × 1 mm thickness. To calculate thermal conductivity, a heat capacity of 0.217 J g−1 K−1 at room temperature to 0.251 J g−1 K−1 at 673 K was used, based on earlier references.38 Single-leg power conversion efficiency measurements were carried out using the commercial system NYDM, a TE device property measurement system from Shanghai Nengyi Semiconductors, Ltd. To ensure impedance matching, a sample with a small cross section of around 1.5 mm × 1.5 mm × 12 mm was prepared. Microstructural analysis was performed using a field-emission scanning electron microscope (FESEM, JEOL JSM7600 and JSM-7800F PRIME) equipped with an energy-dispersive X-ray spectrometer (EDS) detector for elemental analysis. TEM was collected using a Talos F200X. X-ray diffraction (XRD) patterns were collected using a Bruker D8-Advance X-ray powder diffractometer with Cu Kα radiation.
Computational
The density functional theory (DFT) calculations were carried out using QUANTUM ESPRESSO,48–50 with a generalized gradient approximation (GGA)51 to the exchange–correlation energy functional as parametrized by Perdew, Burke, and Ernzerhof (PBE),52 within the projector augmented wave formalism. During calculation, spin–orbit interaction was not included as it has been reported to have little effect on the band structure in AgSbTe2.53 We chose the ordered crystal structure of AgSbTe2: the AF-IIb (F![[3 with combining macron]](https://www.rsc.org/images/entities/char_0033_0304.gif) dm) phase, with the experimental lattice parameter a = 12.305 Å, 64 atoms in the conventional cell and 16 atoms in the primitive cell.54,55 The cut-off energies for the wave functions and charge density expansion in the plane wave basis sets were truncated at 65 and 260 Ry, respectively. Brillouin zone integration was sampled on a uniform mesh of 4 × 4 × 4 k-points. The defect structure Ag0.94Sb1.06Te2.06 was built by replacing 2 Ag atoms with 1 Sb atom and 1 Te atom with the lowest energy. All the structures were fully relaxed before proceeding for band structure and density of states calculations.
dm) phase, with the experimental lattice parameter a = 12.305 Å, 64 atoms in the conventional cell and 16 atoms in the primitive cell.54,55 The cut-off energies for the wave functions and charge density expansion in the plane wave basis sets were truncated at 65 and 260 Ry, respectively. Brillouin zone integration was sampled on a uniform mesh of 4 × 4 × 4 k-points. The defect structure Ag0.94Sb1.06Te2.06 was built by replacing 2 Ag atoms with 1 Sb atom and 1 Te atom with the lowest energy. All the structures were fully relaxed before proceeding for band structure and density of states calculations.
Results and discussion
Fig. 2(a) shows the room temperature XRD analysis of all samples. Notably, no Ag2Te peak can be observed, which is in contrast to typical scans from AgSbTe2 samples.28 This observation can be ascribed to the phase diagram in Fig. 1 which shows that with increasing annealing temperature above 633 K, Ag2Te-deficient samples tend to form a stable phase of Ag1−xSb1+xTe2+x. It is worth noting that a minute amount of the Sb2Te3 phase is expected to be present in Ag0.79Sb1.21Te2.21, despite the absence of peaks in the XRD scan. HRTEM (high resolution transmission electron microscopy) scan of the area of interest shown in Fig. S1† confirms the presence of Sb-rich precipitates in the sample. To further analyze the effect of Ag2Te deficiency on the lattice parameters of the resulting sample, Rietveld refinement was used to derive the lattice volume for all samples, as shown in Fig. 2(b). Evidently, a decreasing trend of lattice parameters can be observed with increasing Ag2Te-deficiency. This is not surprising considering the larger ionic radii of Ag+ (126 pm) than that of Sb3+ (76 pm). To further confirm the absence of Ag2Te nanoprecipitates, SEM EDS scan was conducted on all samples. Fig. 2(c) shows the homogeneous scan of Ag0.91Sb1.09Te2.09 with the absence of the Ag-rich or Sb-deficient region. In contrast, samples without thermal annealing and quenching tend to show mixed phases, as shown in Fig. S2 and Table S1.†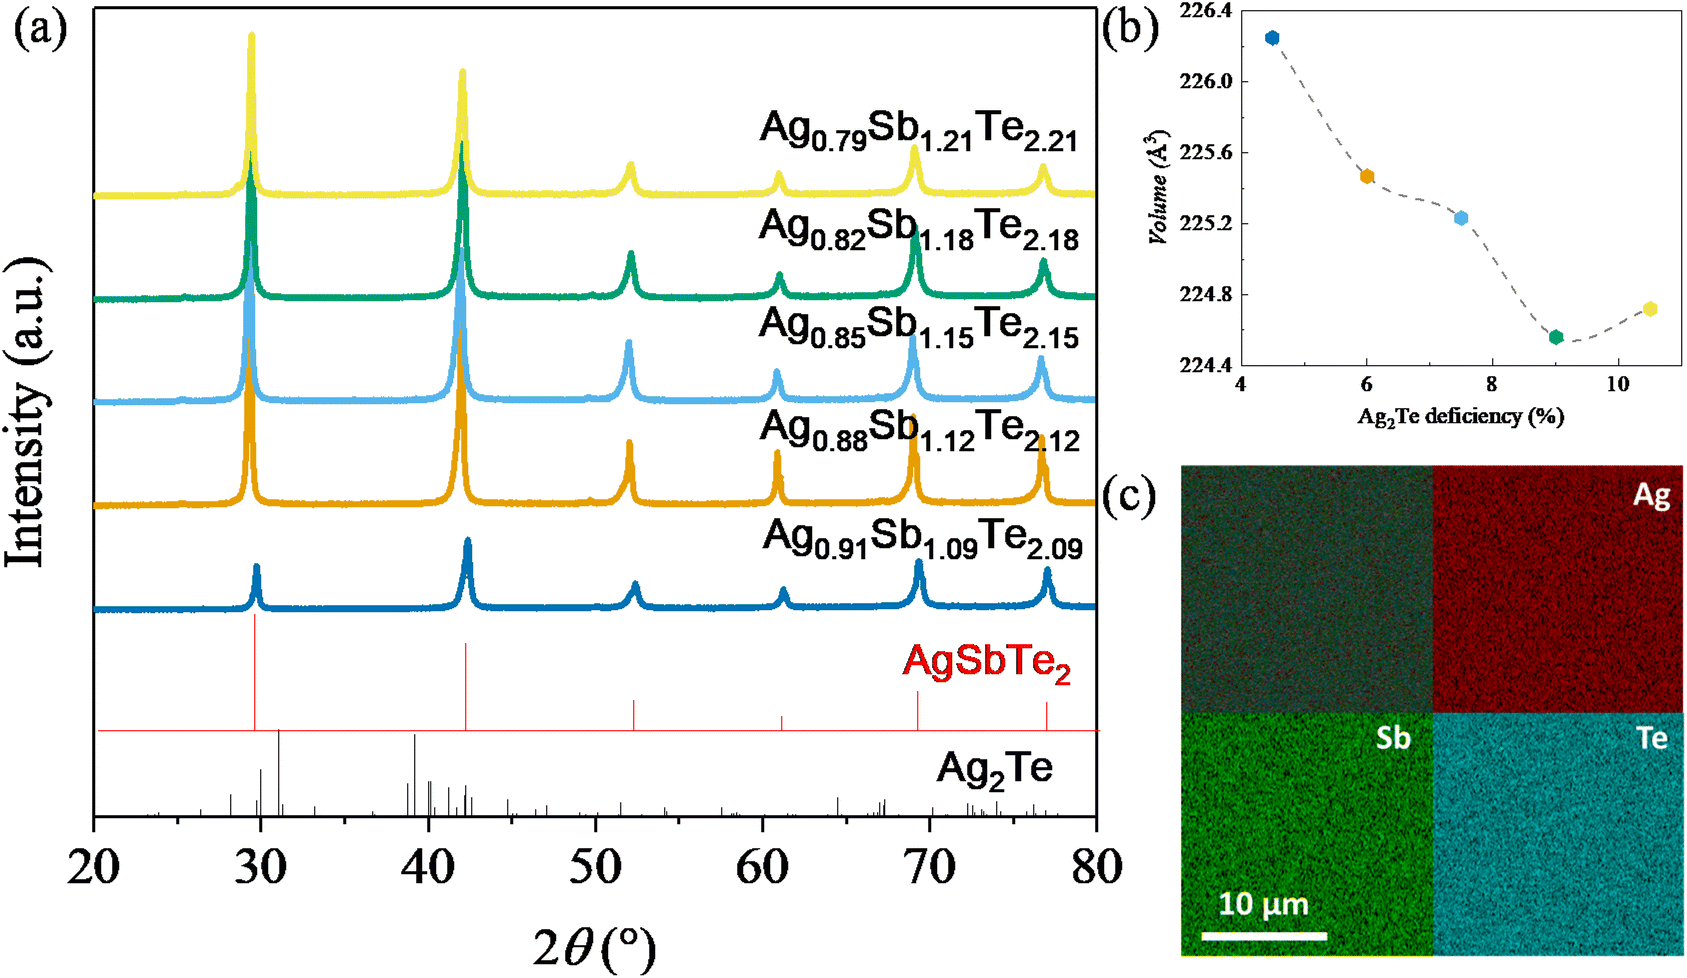 | ||
| Fig. 2 Structural analysis of samples with various levels of Ag2Te deficiency. (a) XRD (X-ray diffraction) showing the absence of Ag2Te peaks in all samples. (b) Lattice parameters of all samples showing a decreasing trend with increasing Ag2Te deficiency. (c) SEM EDS analysis showing a homogeneous distribution and absence of Ag-rich nanoprecipitates. | ||
To systematically study the impact of different compositions and processing conditions on the thermoelectric properties, first, it is worth noting the Seebeck coefficient shown in Fig. 3(a). With the exception of Ag0.88Sb1.12Te2.12, all other samples show a lower magnitude of Seebeck coefficients than pristine AgSbTe2. This can be ascribed to the lower electrical resistivity, as shown in Fig. 3(b). It is well known that the Seebeck coefficient and electrical resistivity are positively correlated via carrier concentrations.1 In addition, samples annealed at 773 K generally show lower electrical resistivity than the non-annealed samples. This can be partially explained by the more ordered crystal structure due to atom diffusion at elevated temperatures and improved defect conditions within the materials, that is better crystallinity after annealing, which helps to improve the carrier mobility. In addition, annealing at 773 K helps to ensure a high purity single phase with no secondary phase precipitates, which also results in higher carrier mobility. As a result, most of the annealed samples show higher weighted mobility (Fig. 3(c)). It is worth noting that the hump in weighted mobility in Fig. 3(c) for pristine AgSbTe2 can be associated with the presence of Ag2Te precipitates, which has a phase transition temperature around 400–450 K. Consequently, a drastically higher power factor can be observed in most Ag2Te deficient samples, especially for annealed Ag0.91Sb1.09Te2.09 which has a power factor of more than 1600 μW m−1 K−2 throughout a wide range of temperatures (300 K–623 K), more than double that of the pristine AgSbTe2 sample. It is worth noting that there was no observable change in the structural properties of all samples after the transport property characterization, as shown in Fig. S3.† This is presumably due to the transient nature of the thermal cycle during testing. Furthermore, this is further supported by the stability of the thermoelectric properties upon repeated cycles of measurement, as shown in Fig. S4.†
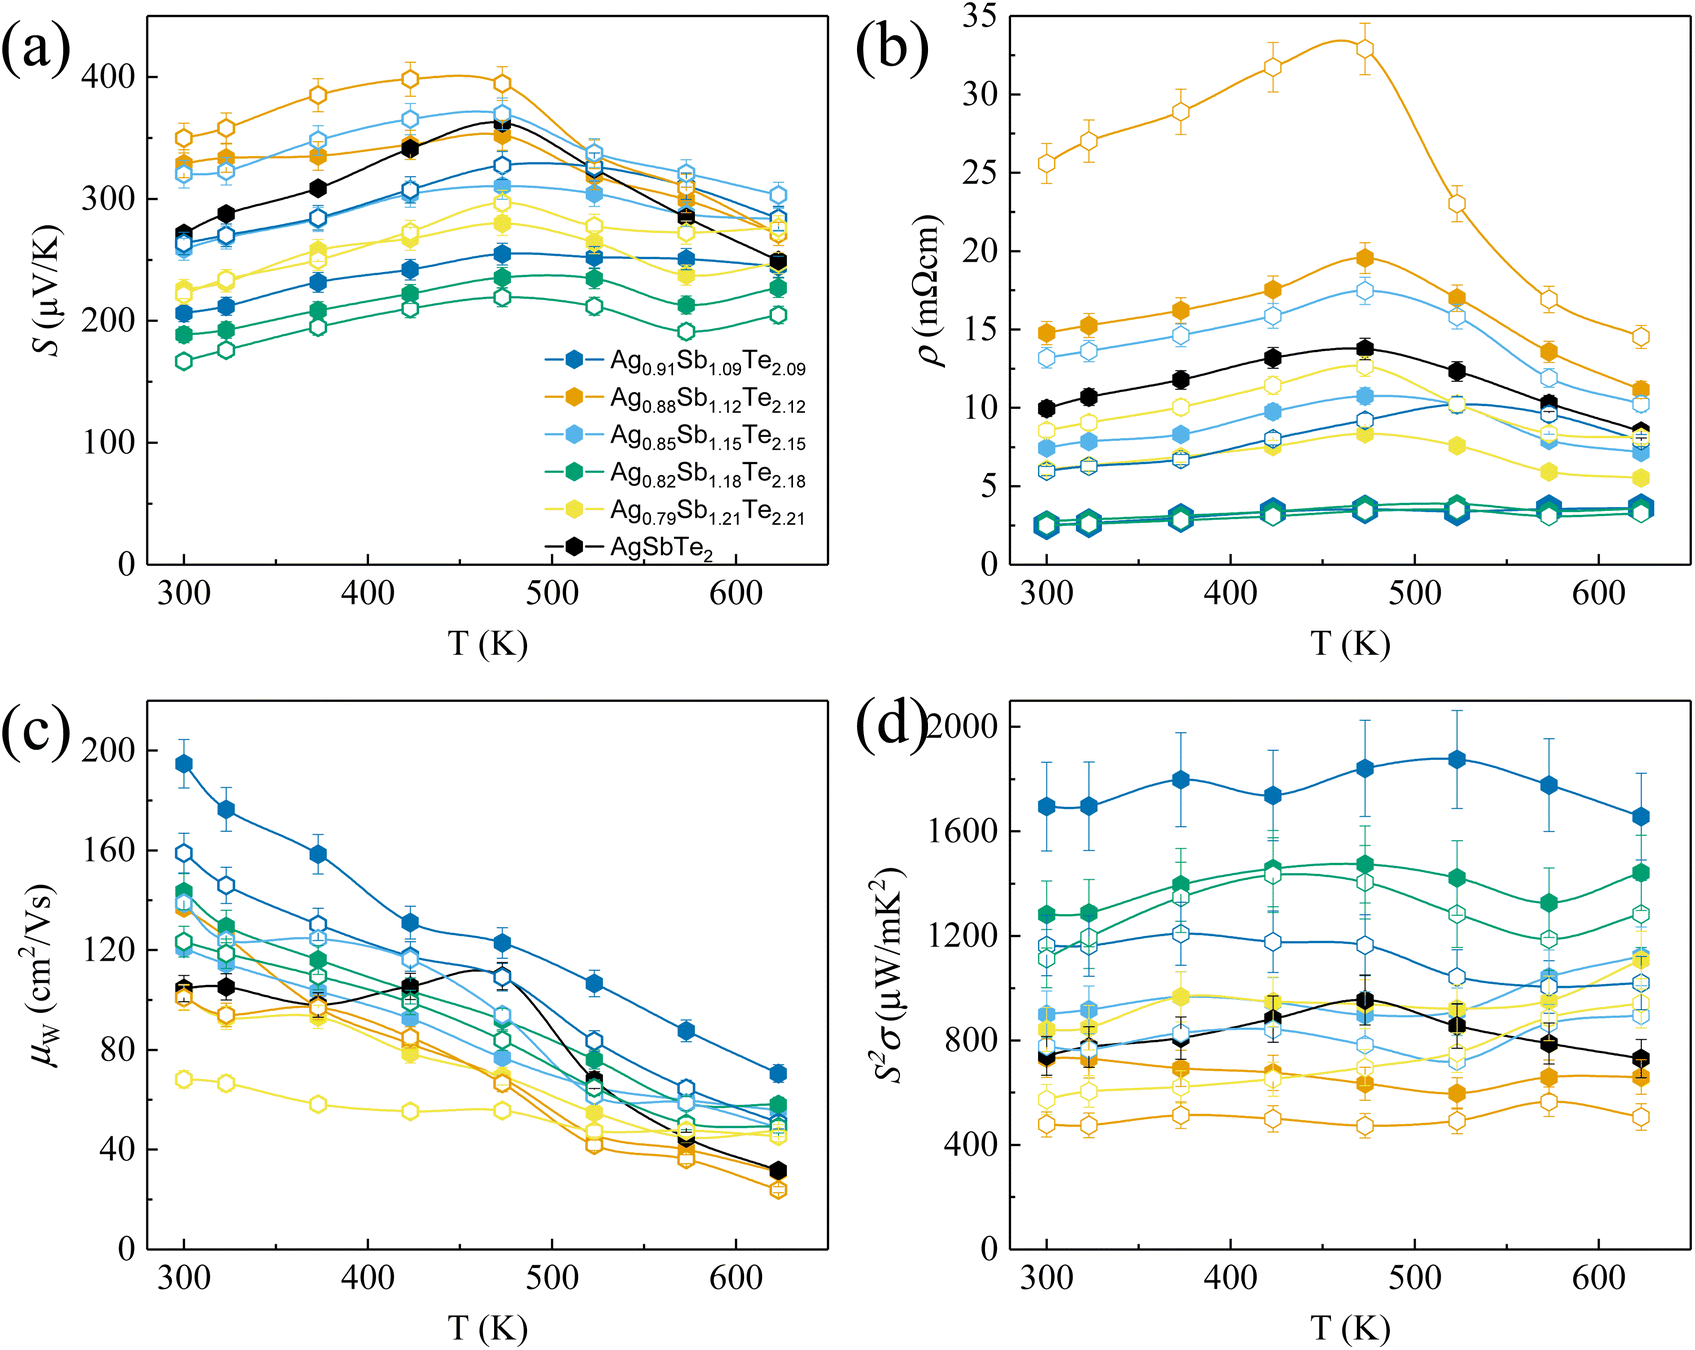 | ||
| Fig. 3 Electronic transport properties of all samples showing the (a) Seebeck coefficient, (b) electrical resistivity, (c) weighted-mobility and (d) power factor as a function of temperature. Filled and hollow hexagon symbols represent samples with and without annealing at 773 K, respectively. | ||
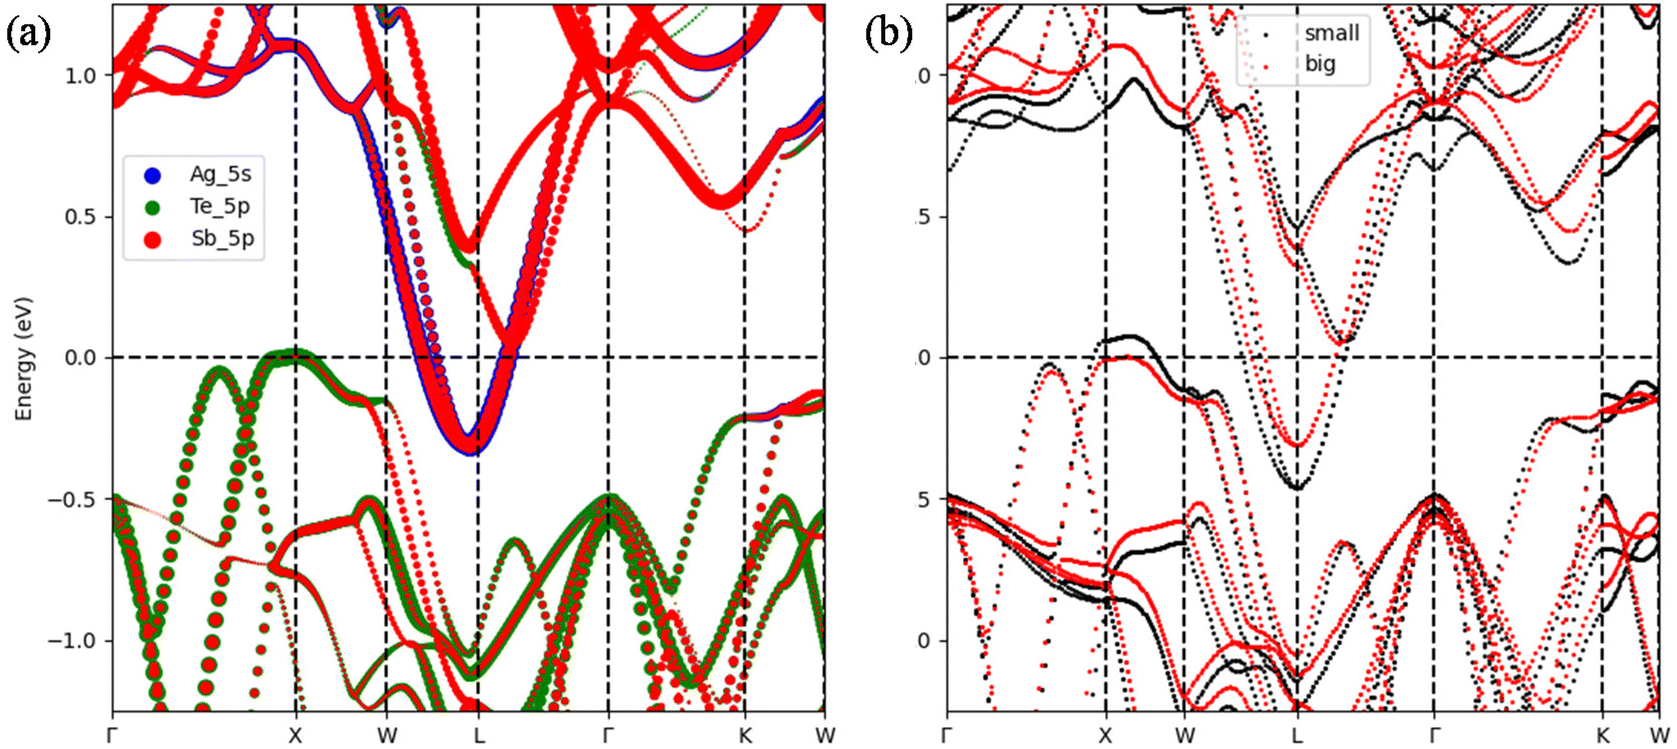
To further elucidate the experimentally observed electronic transport properties in Fig. 3, comparison of density functional theory (DFT) based electronic band structures of pristine stoichiometric AgSbTe2 and Ag1−xSb1+xTe2+x is shown in Fig. 4. As evident from Fig. 4(a) and (b), the deficiency in Ag2Te in Ag1−xSb1+xTe2+x results in more states near the Fermi level, which results in higher total density of states (DOS), as shown in Fig. 4(c). This can be explained by the contribution of the respective elements to the states near the Fermi level, as shown in Fig. 5(a). Since all elements strongly contribute to the total DOS near the Fermi level, Ag1−xSb1+xTe2+x should result in a higher DOS since Ag-deficiency is compensated by Sb and Te excess. Consequently, this results in generally lower electrical resistivity for Ag1−xSb1+xTe2+x than that for AgSbTe2, as evident in Fig. 3(b).
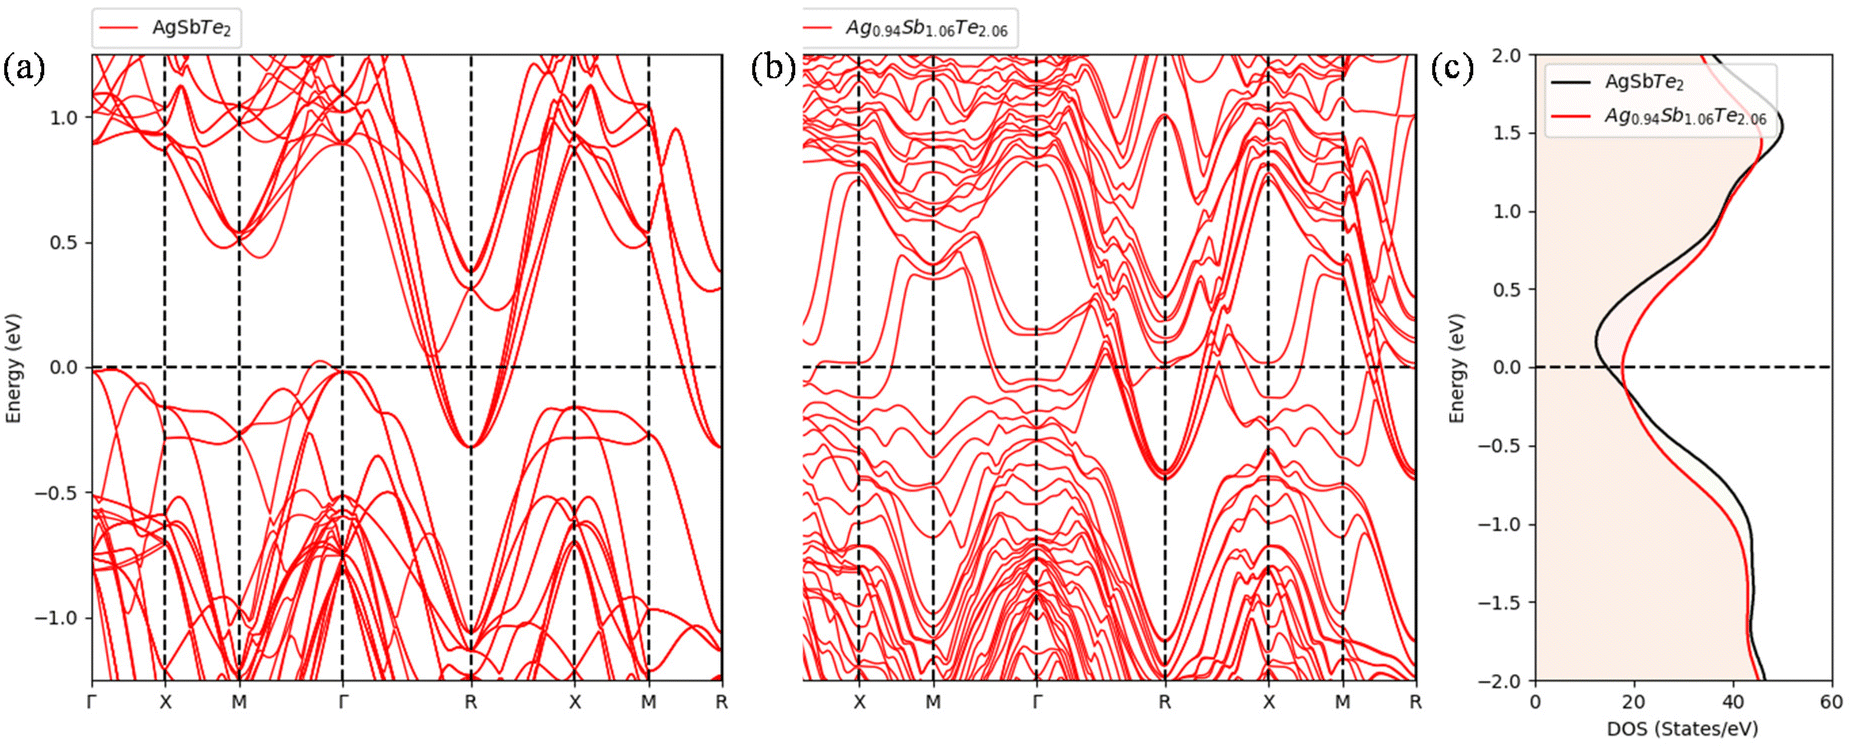 | ||
| Fig. 4 Electronic band structure comparison of (a) pristine AgSbTe2 and (b) the Ag2Te-deficient Ag1−xSb1+xTe2+x composition. (c) Total density of states (DOS) showing higher DOS near the Fermi level for Ag1−xSb1+xTe2+x. The calculations were based on the conventional cell. | ||
 | ||
| Fig. 5 Electronic band structures showing (a) the flatband of AgSbTe2 with contributions from each element and (b) the effect of lattice parameters on the band position and the effective band gap. Both calculations were based on primitive cells. | ||
To further examine the effect of Ag2Te deficiency and the corresponding reduction in lattice parameters observed in Fig. 2(b) on the electronic transport properties, Fig. 5(a) shows the contributions of each element to the band structure near the Fermi level. Due to the p-type nature of AgSbTe2, the region of interest is near the edge of valence bands. Evidently, most of the contributions come from Te 5p states. In terms of composition, shifting away from AgSbTe2 into Ag1−xSb1+xTe2+x results in stronger Te 5p states, which enhances the states near the valence band edge. On the other hand, the simultaneous reduction and increase in Ag and Sb, respectively, does not appreciably change the conduction band profile. In addition, as evident in Fig. 5(b), bigger lattice parameters (red dotted plot) result in effective band-gap opening, which is expected to reduce the bipolar contribution and hence increase the overall power factor. This is consistent with the fact that Ag0.91Sb1.09Te2.09 has the highest power factor and also the highest lattice parameters amongst all Ag1−xSb1+xTe2+x samples.
Fig. 6 shows the thermal transport properties of all samples. In terms of total thermal conductivity (Fig. 6(a)), many of the Ag1−xSb1+xTe2+x samples show reduction compared to AgSbTe2. This is despite the fact that the electrical resistivity in the majority of Ag1−xSb1+xTe2+x samples is lower than that in pristine AgSbTe2 (Fig. 3(b)), which results in lower κe as shown in Fig. 6(b). Not surprisingly, the lattice thermal conductivity shown in Fig. 6(c) of a majority of Ag1−xSb1+xTe2+x samples is lower than that of pristine AgSbTe2. Consequently, drastic zT enhancements can be observed for a majority of the Ag1−xSb1+xTe2+x samples, especially in Ag0.91Sb1.09Te2.09 annealed at 773 K, as shown in Fig. 6(d). In addition, an average zT value above 1.0 was observed between 300 and 500 K, which is higher than many results reported in the literature, as shown in Fig. S5.† Furthermore, the high average zT between room temperature and 623 K for Ag0.91Sb1.09Te2.09 makes it suitable for power harvesting applications. To verify this, a single-leg device based on Ag0.91Sb1.09Te2.09 with an Fe diffusion barrier and Cu electrode layers on both ends was prepared. In order to enable impedance matching with the equipment (minimum circuit resistance ∼ 60 mΩ), the aspect ratio of the single leg was intentionally kept high (1.5 mm × 1.5 mm × 12 mm), as shown in Fig. S6.†
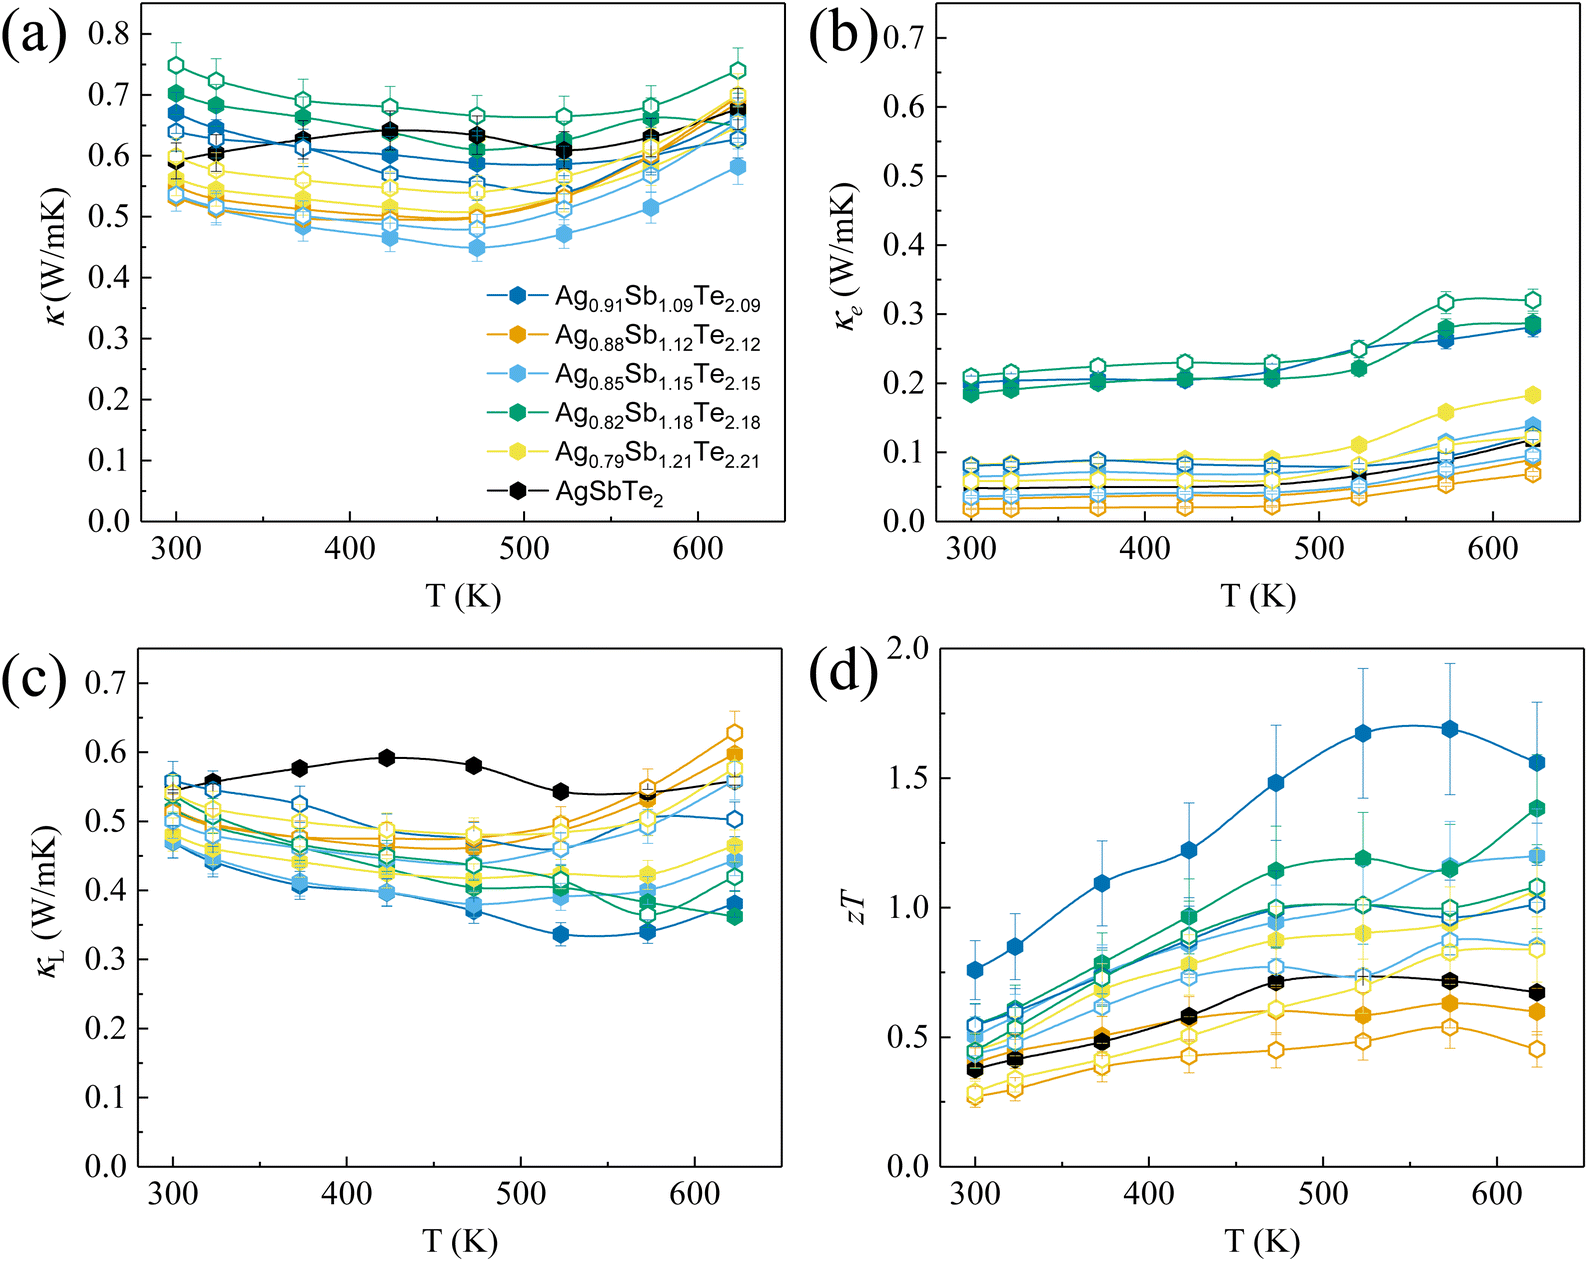 | ||
| Fig. 6 Thermal transport properties of all samples showing (a) total thermal conductivity, (b) electronic contribution to thermal conductivity, (c) lattice thermal conductivity and (d) zT as a function of temperature. Filled and hollow hexagon symbols represent samples with and without annealing at 773 K, respectively. | ||
Fig. 7(a) shows the voltage and power as a function of the current flowing through the single leg for various ΔT. The slope of the voltage and power represents the internal resistance (total resistance of the single leg and the contact resistance). Due to the minimum circuit resistance of the equipment being around 60 mΩ, it is important to ensure high enough single leg resistance. The total resistance of the single leg in this case is 84 mΩ, 101 mΩ, and 108 mΩ, for ΔT of 63 K, 164 K, and 290 K, respectively. Fig. 7(b) shows the open circuit voltage (Voc) and the maximum power output as a function of ΔT. It is noteworthy that the slight non-linearity in Voc can be associated with the temperature-dependency of the Seebeck coefficient in the single leg. On the other hand, the maximum output power approximately follows a quadratic relation with ΔT, consistent with the relation Pmax = S2ΔT2/4Rint where Rint represents the internal resistance. Last but not the least, Fig. 7(c) shows the theoretical maximum and experimental power conversion efficiency, respectively. The deviation from the maximum can be associated with parasitic contact resistance as well as uncertainty in zT estimation of the material. Peak conversion efficiency as high as 7.3% was achieved with a reasonable ΔT of only 290 K.
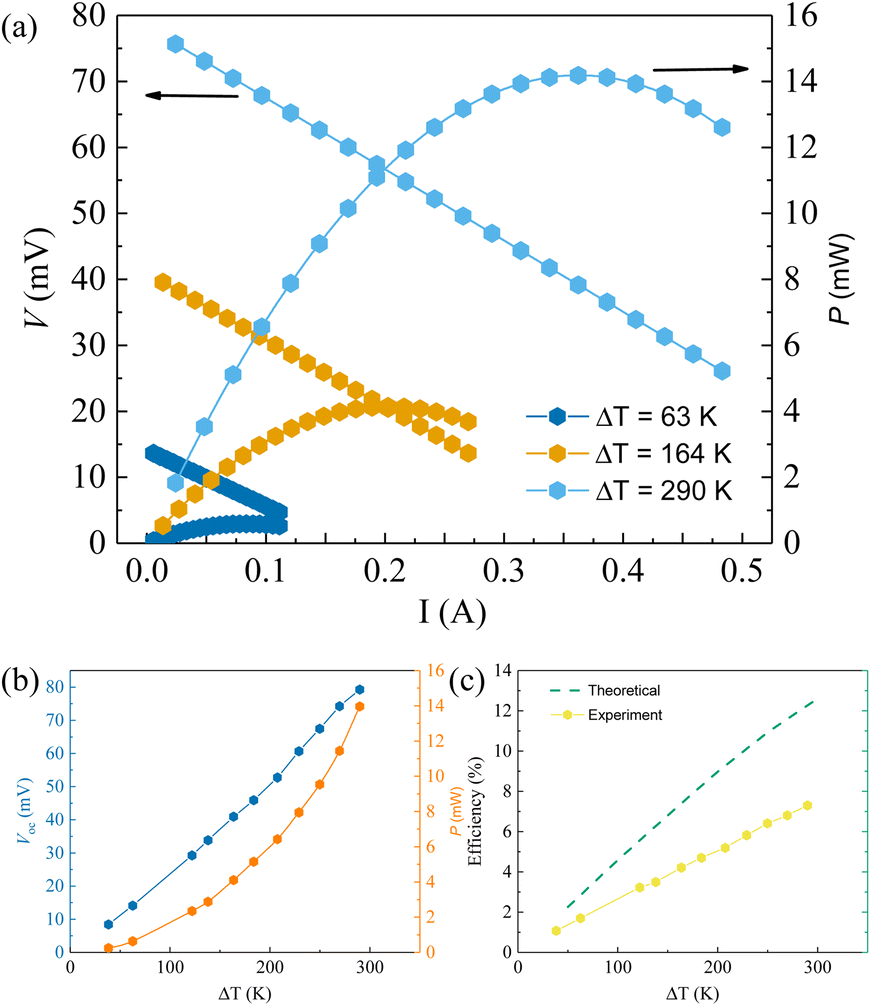 | ||
| Fig. 7 Single leg power harvesting characteristics of Ag0.91Sb1.09Te2.09 showing (a) voltage vs. current and output power vs. current, (b) open circuit voltage vs. temperature gradient and the corresponding maximum output power, and (c) theoretical and experimental power conversion efficiency as a function of temperature gradient. | ||
Conclusions
In this study, we have harnessed the potential of off-stoichiometry and non-equilibrium thermal annealing to significantly enhance the thermoelectric performance of undoped AgSbTe2-based compounds. As depicted in Fig. 1, we systematically prepared samples with varying degrees of Ag2Te deficiency, subjecting them to different annealing temperatures. The outcome of this effort was the achievement of an impressive zT value of 1.7 at 573 K for the Ag0.91Sb1.09Te2.09 composition, which had undergone annealing at 773 K. This remarkable improvement in performance can be attributed to a dual effect: the effective suppression of Ag2Te nanoprecipitates and a reduction in lattice parameters of the Ag2Te-deficient samples. These factors collectively led to an increase in the Seebeck coefficient and a decrease in electrical resistivity, resulting in a substantial enhancement of the power factor and consequently a significantly improved zT value over a broad temperature range. Furthermore, we demonstrated the practical application of these findings by achieving a high power conversion efficiency of 7.3% at a temperature difference (ΔT) of 290 K for a single-leg Ag0.91Sb1.09Te2.09 thermoelectric device, utilizing Fe and Cu encapsulation. The off-stoichiometry and non-equilibrium strategies presented in this study hold promise for broader applications in other ABX2 material systems, offering the potential for similarly enhanced thermoelectric performance in a variety of contexts.Author contributions
The manuscript was written through contributions of all authors. All authors have given approval to the final version of the manuscript.Conflicts of interest
The authors declare no competing financial interest.Acknowledgements
J. C. acknowledges funding from Career Development Fund no. C222812009. A. S. acknowledges funding from A*STAR (Agency of Science, Technology and Research) Career Development Fund (CDF) no. C210112022 and e-Asia Joint Research Program award no. R22I1IR0053. K. S. acknowledges the support from A*STAR's SINGA scholarship. This work was supported by the A*STAR Computational Resource Centre through the use of its high-performance computing facilities.References
- N. Jia, J. Cao, X. Y. Tan, J. Dong, H. Liu, C. K. I. Tan, J. Xu, Q. Yan, X. J. Loh and A. Suwardi, Mater. Today Phys., 2021, 21, 100519 CrossRef CAS.
- J. Cao, X. Y. Tan, J. Dong, H. Liu, Y. Zheng, Q. Zhu, J. Xu, G. Zhang, J. Wu and A. Suwardi, Mater. Today Phys., 2023, 34, 101071 CrossRef CAS.
- J. Dong, A. Suwardi, X. Y. Tan, N. Jia, K. Saglik, R. Ji, X. Wang, Q. Zhu, J. Xu and Q. Yan, Mater. Today, 2023, 66, 137–157 CrossRef CAS.
- J. Mao, G. Chen and Z. Ren, Nat. Mater., 2021, 20, 454–461 CrossRef CAS PubMed.
- J. Mao, Z. Liu, J. Zhou, H. Zhu, Q. Zhang, G. Chen and Z. Ren, Adv. Phys., 2018, 67, 69–147 CrossRef.
- J. Zheng, S. F. D. Solco, C. J. E. Wong, S. A. Sia, X. Y. Tan, J. Cao, J. C. C. Yeo, W. Yan, Q. Zhu and Q. Yan, J. Mater. Chem. A, 2022, 10, 19787–19796 RSC.
- J. Cao, J. Zheng, H. Liu, C. K. I. Tan, X. Wang, W. Wang, Q. Zhu, Z. Li, G. Zhang and J. Wu, Mater. Today Energy, 2022, 25, 100964 CrossRef CAS.
- S. Hao, V. P. Dravid, M. G. Kanatzidis and C. Wolverton, npj Comput. Mater., 2019, 5, 58 CrossRef.
- J. Cao, Y. Sim, X. Y. Tan, J. Zheng, S. W. Chien, N. Jia, K. Chen, Y. B. Tay, J. F. Dong and L. Yang, Adv. Mater., 2022, 34, 2110518 CrossRef CAS PubMed.
- J. Cao, X. Y. Tan, N. Jia, D. Lan, S. F. D. Solco, K. Chen, S. W. Chien, H. Liu, C. K. I. Tan and Q. Zhu, Nanoscale, 2022, 14, 410–418 RSC.
- H. K. Ng, D. Xiang, A. Suwardi, G. Hu, K. Yang, Y. Zhao, T. Liu, Z. Cao, H. Liu and S. Li, Nat. Electron., 2022, 5, 489–496 CrossRef CAS.
- Y. Pei, X. Shi, A. LaLonde, H. Wang, L. Chen and G. J. Snyder, Nature, 2011, 473, 66–69 CrossRef CAS PubMed.
- F. Yang, J. Wu, A. Suwardi, Y. Zhao, B. Liang, J. Jiang, J. Xu, D. Chi, K. Hippalgaonkar and J. Lu, Adv. Mater., 2021, 33, 2004786 CrossRef CAS PubMed.
- A. Suwardi, J. Cao, Y. Zhao, J. Wu, S. W. Chien, X. Y. Tan, L. Hu, X. Wang, W. Wang and D. Li, Mater. Today Phys., 2020, 14, 100239 CrossRef.
- N. Jia, J. Cao, X. Y. Tan, J. Zheng, S. W. Chien, L. Yang, K. Chen, H. K. Ng, S. S. F. Duran and H. Liu, J. Mater. Chem. A, 2021, 9, 23335–23344 RSC.
- B. Zhu, X. Su, S. Shu, Y. Luo, X. Y. Tan, J. Sun, D. Sun, H. Zhang, Q. Zhang and A. Suwardi, ACS Appl. Energy Mater., 2022, 5, 2002–2010 CrossRef CAS.
- B. Zhu, Y. Luo, H. Wu, D. Sun, L. Liu, S. Shu, Z.-Z. Luo, Q. Zhang, A. Suwardi and Y. Zheng, J. Mater. Chem. A, 2023, 11, 8912–8921 RSC.
- Z. Danwei, S. Seng Ann, S. Samantha Faye Duran, X. Jianwei and S. Ady, Soft Science., 2023, 3 DOI:10.20517/ss.2022.29.
- D. Zhang, X. J. G. Lim, X. Li, K. Saglik, S. F. D. Solco, X. Y. Tan, Y. Leow, W. Zhai, C. K. I. Tan and J. Xu, ACS Energy Lett., 2022, 8, 332–338 CrossRef.
- D. Zhang, W. Y. S. Lim, S. S. F. Duran, X. J. Loh and A. Suwardi, ACS Energy Lett., 2022, 7, 720–735 CrossRef CAS.
- Y. Wu, Z. Chen, P. Nan, F. Xiong, S. Lin, X. Zhang, Y. Chen, L. Chen, B. Ge and Y. Pei, Joule, 2019, 3, 1276–1288 CrossRef CAS.
- A. Suwardi, J. Cao, L. Hu, F. Wei, J. Wu, Y. Zhao, S. H. Lim, L. Yang, X. Y. Tan and S. W. Chien, J. Mater. Chem. A, 2020, 8, 18880–18890 RSC.
- A. Suwardi, B. Prasad, S. Lee, E.-M. Choi, P. Lu, W. Zhang, L. Li, M. Blamire, Q. Jia and H. Wang, Nanoscale, 2016, 8, 8083–8090 RSC.
- D. Zhang, M. Xie, D. Safanama, K. Saglik, X. Y. Tan, S. F. D. Solco, J. Cao, C. K. I. Tan, H. Liu and S. Wang, Adv. Energy Sustainability Res., 2023, 2300069 CrossRef.
- J. Cao, S. W. Chien, X. Y. Tan, C. K. I. Tan, Q. Zhu, J. Wu, X. Wang, Y. Zhao, L. Yang and Q. Yan, ChemNanoMat, 2021, 7, 476–482 CrossRef CAS.
- Y. Zheng, H. Xie, Q. Zhang, A. Suwardi, X. Cheng, Y. Zhang, W. Shu, X. Wan, Z. Yang and Z. Liu, ACS Appl. Mater. Interfaces, 2020, 12, 36186–36195 CrossRef CAS PubMed.
- J. Cao, X. Y. Tan, N. Jia, J. Zheng, S. W. Chien, H. K. Ng, C. K. I. Tan, H. Liu, Q. Zhu and S. Wang, Nano Energy, 2022, 96, 107147 CrossRef CAS.
- J. Cao, J. Dong, K. Saglik, D. Zhang, S. F. D. Solco, I. J. W. J. You, H. Liu, Q. Zhu, J. Xu and J. Wu, Nano Energy, 2023, 107, 108118 CrossRef CAS.
- S. Roychowdhury, T. Ghosh, R. Arora, M. Samanta, L. Xie, N. K. Singh, A. Soni, J. He, U. V. Waghmare and K. Biswas, Science, 2021, 371, 722–727 CrossRef CAS PubMed.
- R. Pathak, L. Xie, S. Das, T. Ghosh, A. Bhui, K. Dolui, D. Sanyal, J. He and K. Biswas, Energy Environ. Sci., 2023, 16, 3110–3118 RSC.
- J. Dong, Y. Jiang, J. Liu, J. Pei, X. Y. Tan, H. Hu, A. Suwardi, N. Jia, C. Liu and Q. Zhu, Nano Energy, 2022, 103, 107809 CrossRef CAS.
- X. Wang, H. He, L. Yin, J. Cheng, J. Sui, X. Liu, J. Mao, F. Cao and Q. Zhang, Mater. Today Energy, 2022, 26, 100994 CrossRef CAS.
- Z. Zhang, K. Zhao, T.-R. Wei, P. Qiu, L. Chen and X. Shi, Energy Environ. Sci., 2020, 13, 3307–3329 RSC.
- J. Jia, Y. Zhou, X. Chen, W. Xue, H. Yu, J. Li, S. Zhi, C. Chen, J. Wang and S. Hou, Research, 2022, 9875329 CAS.
- D. Liu, D. Wang, T. Hong, Z. Wang, Y. Wang, Y. Qin, L. Su, T. Yang, X. Gao and Z. Ge, Science, 2023, 380, 841–846 CrossRef CAS PubMed.
- J. Mao, H. Zhu, Z. Ding, Z. Liu, G. A. Gamage, G. Chen and Z. Ren, Science, 2019, 365, 495–498 CrossRef CAS PubMed.
- A. Suwardi, S. H. Lim, Y. Zheng, X. Wang, S. W. Chien, X. Y. Tan, Q. Zhu, L. M. N. Wong, J. Cao and W. Wang, J. Mater. Chem. C, 2020, 8, 16940–16948 RSC.
- J. K. Lee, M.-W. Oh, B. Ryu, J. E. Lee, B.-S. Kim, B.-K. Min, S.-J. Joo, H.-W. Lee and S.-D. Park, Sci. Rep., 2017, 7, 4496 CrossRef PubMed.
- J. K. Lee, B. Ryu, S. Park, J. H. Son, J. Park, J. Jang, M.-W. Oh and S. Park, Acta Mater., 2022, 222, 117443 CrossRef CAS.
- Y. Zhang, Z. Li, S. Singh, A. Nozariasbmarz, W. Li, A. Genç, Y. Xia, L. Zheng, S. H. Lee and S. K. Karan, Adv. Mater., 2023, 35, 2208994 CrossRef CAS PubMed.
- Y. Wu, P. Qiu, Y. Yu, Y. Xiong, T. Deng, O. Cojocaru-Miredin, M. Wuttig, X. Shi and L. Chen, J. Materiomics, 2022, 8, 1095–1103 CrossRef.
- Y. Wu, Q. Liang, X. Zhao, H. Wu, P. Zi, Q. Tao, L. Yu, X. Su, J. Wu and Z. Chen, ACS Appl. Mater. Interfaces, 2022, 14, 3057–3065 CrossRef CAS PubMed.
- T. Ghosh, S. Roychowdhury, M. Dutta and K. Biswas, ACS Energy Lett., 2021, 6, 2825–2837 CrossRef CAS.
- H. Wang, J.-F. Li, M. Zou and T. Sui, Appl. Phys. Lett., 2008, 93, 202106 CrossRef.
- S. Roychowdhury, R. Panigrahi, S. Perumal and K. Biswas, ACS Energy Lett., 2017, 2, 349–356 CrossRef CAS.
- W. Szczypka and A. Koleżyński, J. Alloys Compd., 2019, 787, 1136–1142 CrossRef CAS.
- P. Wyzga and K. Wojciechowski, J. Electron. Mater., 2016, 45, 1548–1554 CrossRef CAS.
- P. Giannozzi, S. Baroni, N. Bonini, M. Calandra, R. Car, C. Cavazzoni, D. Ceresoli, G. L. Chiarotti, M. Cococcioni and I. Dabo, J. Phys.: Condens. Matter, 2009, 21, 395502 CrossRef PubMed.
- P. Giannozzi, O. Andreussi, T. Brumme, O. Bunau, M. B. Nardelli, M. Calandra, R. Car, C. Cavazzoni, D. Ceresoli and M. Cococcioni, J. Phys.: Condens. Matter, 2017, 29, 465901 CrossRef CAS PubMed.
- P. Giannozzi, O. Baseggio, P. Bonfà, D. Brunato, R. Car, I. Carnimeo, C. Cavazzoni, S. De Gironcoli, P. Delugas and F. Ferrari Ruffino, J. Chem. Phys., 2020, 152, 154105 CrossRef CAS PubMed.
- X. Hua, X. Chen and W. Goddard, Phys. Rev. B: Condens. Matter Mater. Phys., 1997, 55, 16103 CrossRef CAS.
- J. P. Perdew, K. Burke and M. Ernzerhof, Phys. Rev. Lett., 1996, 77, 3865 CrossRef CAS PubMed.
- M. Hong, Z. G. Chen, L. Yang, Z. M. Liao, Y. C. Zou, Y. H. Chen, S. Matsumura and J. Zou, Adv. Energy Mater., 2018, 8, 1702333 CrossRef.
- S. Barabash, V. Ozolins and C. Wolverton, Phys. Rev. Lett., 2008, 101, 155704 CrossRef CAS PubMed.
- K. Hoang, S. Mahanti, J. R. Salvador and M. G. Kanatzidis, Phys. Rev. Lett., 2007, 99, 156403 CrossRef PubMed.
Footnotes |
| † Electronic supplementary information (ESI) available. See DOI: https://doi.org/10.1039/d3nr04584f |
| ‡ These authors contributed equally to this work. |
| This journal is © The Royal Society of Chemistry 2023 |