
 Open Access Article
 This Open Access Article is licensed under a Creative Commons Attribution-Non Commercial 3.0 Unported Licence
Predicting nanocarriers’ efficacy in 3D models with Brillouin microscopy
Giulia
Guerriero
a,
Alexis
Viel
b,
Veronica
Feltri
a,
Alice
Balboni
a,
Guqi
Yan
b,
Sylvain
Monnier
b,
Giovanna
Lollo
*a and
Thomas
Dehoux
 *b
*b
aLaboratoire d'Automatique, de Génie des Procédés et de Génie Pharmaceutique, Université Claude Bernard Lyon 1, CNRS UMR 5007, 43 bd 11 Novembre 1918, 69622, Villeurbanne, France. E-mail: giovanna.lollo@univ-lyon1.fr
bInstitut Lumière Matière, UMR5306, Université Lyon 1-CNRS, Université de Lyon, 69622 Villeurbanne, France. E-mail: thomas.dehoux@univ-lyon1.fr
First published on 22nd November 2023
Abstract
Thanks to their unique nanoscale properties, nanomedicines can overcome some of the shortcomings of conventional therapies. For better predictive screening, it is important to assess their performance in three-dimensional (3D) multicellular tumour spheroids (MCTS) that can recapitulate the physiological barriers found in real tumours. Today, the evaluation of drug delivery nanosystems in MCTS is mainly explored by means of microscopy techniques that are invasive and require fluorescent labels which modify the composition and fate of the carriers. In recent years, a new quantitative microscopy technique based on Brillouin light scattering (BLS) has been proposed that uses the interaction of laser light with picosecond timescale density fluctuations in the sample. Because it is label-free, all-optical and non-destructive, BLS has gained interest in the pharmaceutical and biomedical fields. In this work, we implemented a fast BLS spectrometer and used the Brillouin frequency shift at the center of the MCTS as a quantitative readout for drug efficacy. We first investigated the ability of this setup to quantify drug efficacy in MCTS grown in classical multiwell plates and concluded that the low number of samples available in the multiwells limits the statistical significance of the results. To improve the throughput, we then combined the microscope with agarose microwells designed to fabricate a large number of MCTS and test 50 MCTS in less than a minute. Using this platform, we assessed the efficacy of polymeric nanoparticles (NPs) loaded with a platinum derivative anticancer drug (dichloro(1,2-diaminocyclohexane)platinum(II)) in reducing the growth of colorectal cancer cells (HCT-116) in MCTS. We observe a time- and dose-dependent decrease in the frequency shift, revealing the progressive loss of mechanical integrity in the MCTS. These results demonstrate that BLS probing of MCTS grown in agarose microwells is a promising tool for high-throughput screening of nanocarriers in 3D models.
Introduction
Nanomedicine holds tremendous potential for drug delivery with applications in cancer therapy. Thanks to their unique nanoscale properties, nanocarriers can overcome some of the shortcomings of conventional therapies by modulating both the pharmacokinetic and pharmacodynamic profiles of drugs, thus allowing them to accumulate preferably at the tumor site, reducing side effects and enhancing the therapeutic index.1–3 However, rational drug selection, optimization of nanocarrier design and refinement of therapeutic parameters are still needed to grant successful clinical translation.4 In this context, it is critical to develop innovative tools and technologies to assess the performance of nanomedicines in adequate tumour models and understand the biological factors involved in the effective systemic delivery of nanotherapeutics to solid tumours.5,6The interaction between tumour cells and drug delivery nanocarriers is generally carried out in two-dimensional (2D) monocultures. Despite their relative ease of handling and low cost, these in vitro models do not represent the complex physiological gradients found in tumours (e.g., pH, oxygen, and nutrients) and their microenvironment. Consequently, they do not provide predictive models for the in vivo performance of the formulation, notably in terms of in-depth accumulation and efficacy. Alternatively, multicellular tumour spheroids (MCTS), which consist of three-dimensional (3D) sphere-like clusters of cells, have developed over the past decades. Contrary to 2D models, MCTS can reproduce cell–cell and cell–extracellular matrix interactions and exhibit growth kinetics and gene expression levels closer to what is observed in vivo.7,8 Moreover, MCTS can be used to emulate the cellular stratification characteristic of tumoral masses and metastases.9 In MCTS, the recapitulation of the physiological barriers found in real tumours yields a more realistic resistance to anticancer agents compared to 2D cell cultures and allows the investigation of drug penetration into the tumour and the biological response to treatment.10 MCTS thus constitute a promising tool for more predictively screening the efficacy of nanomedicine.11–14
However, the availability of techniques suitable for screening the efficacy of treatments remains poor.15 Conventional histological sections treated with histological stains and immunohistochemistry are widespread approaches but do not allow real-time imaging of the sample.16 Many modern techniques for the evaluation of the efficacy of drug therapies in MCTS rely on the imaging of fluorescent markers, which has several drawbacks. The imaging depth is limited to distances of 60–80 μm due to pronounced scattering of both the excitation and emission lights.17 Clarification techniques, in which lipids are removed from the MCTS, allow deeper imaging but the sample needs to be fixed.18 Moreover, because of pH gradients in the MCTS, fluorescence intensity is heterogeneous, which hampers precise quantification of efficacy. Other methods simply monitor the radius of the MCTS as a read-out for drug efficacy.19 Although this is a simple and cost-effective approach, it cannot reveal the activity of the drug at the centre of the MCTS.
In recent years, a new quantitative microscopy technique based on Brillouin light scattering (BLS) has been proposed which uses the interaction of laser light with picosecond timescale density fluctuations in the sample.20 BLS has been successfully used for mechanical phenotyping and imaging relying on contrast based on the stiffness in single cells through spectroscopic and time-resolved implementations, and it has found applications in live organisms, plant tissues and teeth.21–25 Because it is label-free, all-optical and non-destructive, BLS has gained interest in the pharmaceutical and biomedical fields as a promising tool to investigate the mechanobiology of different pathologies, notably cancer. In particular, BLS has been applied to produce quantitative images of MCTS and study the penetration of drugs within them, although at concentrations much higher than those used in clinical settings.26,27 Since the probing mechanism involves the coupling of photons to longitudinal phonons, variations in the scattering spectra can be interpreted as the response of the sample to an infinitesimal uniaxial compression. In MCTS, the response to such solicitation is driven in part not only by the polymer meshwork but also—and this feature separates BLS from classical microrheology approaches—by the compressibility and the dynamics of the liquid phase.28,29 However, the applicability of BLS to nanomedicines used at therapeutic levels remains unknown, and efforts need to be made to improve the throughput for pharmaceutical applications.
In this work, we implemented a fast BLS spectrometer and used the Brillouin frequency shift measured at the center of the MCTS as a quantitative readout for assessing drug efficacy. We combined this setup with agarose multiwells designed to fabricate a large number of MCTS and test several conditions rapidly. Using this platform, we assessed the efficacy of drug-loaded polymeric nanoparticles (NPs) in reducing the growth of colorectal cancer cells (HCT-116) in MCTS. These NPs made of hyaluronic acid (HA) and polyarginine (PArg) have been recently developed and their efficacy in 2D cell culture has already been demonstrated.30,31 Here, we evaluate BLS microscopy in agarose microwells as a suitable candidate for quantitative high-throughput screening of nanomedicine on three-dimensional (3D) tumour models.
Materials and methods
Chemicals
To prepare nanoparticles, poly-L-arginine hydrochloride (Mw = 5800 Da) was provided by Polypeptide Therapeutic Solutions S.L. (Valencia, Spain) and low molecular weight hyaluronic acid (Mw ≈ 20 kDa) was purchased from Lifecore® Biomedical (Chaska, USA). AmberLite® IRA 900 Cl ion exchange resin, dichloro(1,2-diaminocyclohexane)platinum(II) (DACHPt–Cl2, Mw = 380.17 Da) and silver nitrate (AgNO3, Mw = 169.97 Da) were purchased from Sigma-Aldrich® (Saint-Quentin-Fallavier, France). Sodium hydroxide (NaOH) was purchased from Acros Organics (Thermo Fisher Scientific, Illkirch, France). Oxaliplatin solution (Hospira®, Meudon, France) was a kind gift from the Hospital of Lyon, France. Deionized water (Milli-Q water) was obtained from a Milli-Q plus system (Merck-Millipore, Darmstadt, Germany). A CellTiter Glo® 3D reagent was purchased from Promega Corporation (Madison, USA). To prepare microwells, agarose standard (ROTI®Garose) was purchased from Carl Roth® (Karlsruhe, Germany) and the Norland Optical Adhesive 81 (NOA) glue was provided by Norland Products Inc. (Cranbury, USA). For coverslip silanisation, 3-aminopropyltriethoxysilane 99% (APTS) came from AcroSeal® (Heysham, United Kingdom) and glacial acetic acid was supplied by VWR PROLABO® Chemicals (Fontenay-sous-Bois, France).DACHPt aqueous complex preparation and quantification
To obtain DACHPt-loaded polymeric NPs, a DACHPt aqueous complex, DACHPt-(H2O)22+, was prepared as previously described by Matha et al.30 DACHPt–Cl2 (0.25 mM) was suspended in distilled water and mixed with silver nitrate ([AgNO3]/[DACHPt–Cl2] = 1). The solution was kept in the dark at 25 °C for 24 h under magnetic stirring. Silver chloride (AgCl) precipitates were found after the reaction. The mixture was centrifuged at 4000 rpm for 30 min to remove the AgCl precipitates. Afterwards, the supernatant was purified by filtration through a 0.22 μm filter. The obtained solution of the DACHPt aqueous complex was stored at 4 °C. 30 μL of DACHPt aqueous solution was diluted in 2 mL of ultrapure water for platinum quantification using microwave plasma atomic emission spectrometry (MP-AES) on an Agilent 4200 MP-AES instrument (Agilent Technologies, Santa Clara, California, USA) equipped with an Agilent 4107 Nitrogen Generator, an inert torch with alumina injector and a OneNeb inert nebulizer. Wavelength calibration using MP-AES Wavecal solution (Agilent Technologies, Santa Clara, USA) was done before any analyses. The detection wavelength was 265.945 nm. The nebulizer flow was set at 0.75 L min−1, the viewing position was 0 and the temperature was maintained at 25 °C during the analysis. The analytical cycle consisted of 30 seconds of rinsing with ultrapure water followed by 15 seconds of sample uptake at an 80 rpm pump speed and then 15 seconds of stabilization before reading the emitted signal for 3 seconds at a 15 rpm pump speed. Peak areas were recorded and processed on the MP Expert Microwave Plasma Instrument Software, version 1.6.1.10384 (Agilent® Technologies, Santa Clara, USA). The automatic background correction mode available in the software was used. A platinum calibration curve (R2 = 0.99) was obtained by diluting an oxaliplatin (OXA) stock solution (5 mg mL−1) in ultrapure water in order to obtain a platinum concentration range of 0.10–25.00 mg L−1. Instrumental limits of detection (LOD) and quantification (LOQ) were 0.13 mg L−1 and 0.40 mg L−1, respectively. The yield of the reaction, Y, was calculated as follows (eqn (1)): | (1) |
Polyarginine hydroxide preparation
Polyarginine hydroxide (PArg–OH) was prepared from polyarginine hydrochloride (PArg–Cl) by ion exchange using Amberlite® IRA 900Cl (Sigma-Aldrich, Saint Quentin Fallavier, France) resin. 3 mL of 1 M sodium hydroxide (NaOH) was added to a column containing 1 mL of wet resin. After 30 minutes, the column was rinsed with ultrapure water to reach a final pH of 7. Then, a PArg–Cl solution (20 mg mL−1) and 3 mL of ultrapure water were added to the top of the column to recover a PArg–OH solution at a pH of 11. Lastly, the PArg–OH solution was diluted to a PArg concentration of 2.5 mg mL−1 and stored at 4 °C.Preparation of blank and DACHPt-loaded NPs
Blank and DACHPt-loaded polymeric NPs were obtained using the ionic gelation technique.31,32 DACHPt–(H2O)22+ solution (1.5 mg mL−1) was mixed with PArg–OH diluted solution (2.5 mg mL−1) and then HA water solution (9 mg mL−1) was added to the agitating mixture. The dispersion was maintained under magnetic stirring for 10 minutes. Blank NPs were obtained following the same procedure by substituting the DACHPt-(H2O)22+ solution with ultrapure water.Physicochemical characterization of blank and drug-loaded NPs
Blank and DACHPt-loaded NPs were characterised in terms of size, polydispersity index (PDI) and ζ-potential. The size and PDI of NPs were measured by the dynamic light scattering (DLS) method using a Malvern Zetasizer® (Nano Series ZS, Malvern Instruments S.A., Worcestershire, UK). Samples were diluted to an appropriate concentration in deionized water and each analysis was carried out at 25 °C with a detection angle of 173°. The ζ-potential values were calculated from the mean electrophoretic mobility values, as determined by electrophoretic light scattering (ELS). For ELS measurements, samples were diluted in deionized water and placed in an electrophoretic cell. DLS and ELS analyses were performed on three independently prepared samples using a Malvern Zetasizer® apparatus DTS 1060 (Nano Series ZS, Malvern Instruments S.A., Worcestershire, UK).DACHPt quantification in drug-loaded NPs
To assess the DACHPt encapsulation efficiency, EE, 500 μL of diluted nanoparticle suspension was loaded into an Amicon filter (Amicon Ultra-0.5, Membrane Ultracel-30, PMNL 30 kDa, Merck Millipore) and centrifugation was performed at 2000g for 20 minutes at 20 °C. 50 μL of supernatant was diluted in 1 mL of ultrapure water for platinum quantification using MP-AES, as described above. Similarly, 50 μL of the nanoparticle suspension was diluted in 1 mL of ultrapure water and analysed using MP-AES. EE was measured using the following equation (eqn (2)):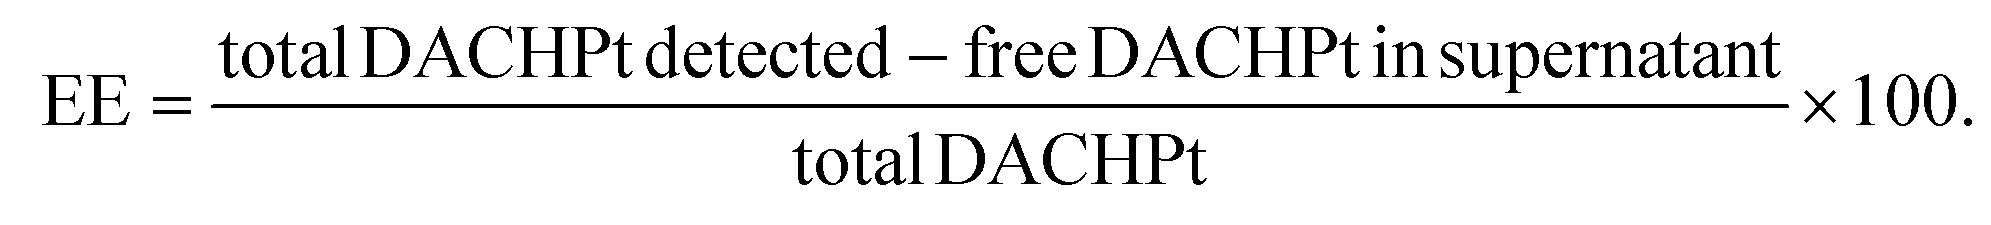 | (2) |
The measurement was performed in triplicate.
Agarose microwell preparation
300 μm diameter agarose microwells were prepared according to the protocol described by Goodarzi et al.33,34 1 g of standard agarose was diluted in a vial with 49 mL of Milli-Q water to obtain a 2% agarose suspension. The agarose was then dissolved using a semi-automatic autoclave (Advantage-Lab) at 121 °C for 20 minutes. The 2% agarose was maintained in a liquid state by placing the vial on a hot plate at 100 °C. Another hot plate was set to 78 °C in order to warm the polydimethylsiloxane (PDMS) moulds, the pipette tips, silanised coverslips and some non-silanised coverslips. The moulds were sprayed with ethanol to increase the penetration of the agarose into the mould. 130 μL of the 2% liquid agarose was pipetted onto a PDMS mould and covered with a non-silanised coverslip. The system was removed from the hot plate and left for 10 minutes with a Petri dish lid placed on top to promote slow and homogeneous gelation. The agarose microwells were then detached from the mould and glued onto a silanised 22 mm diameter coverslip with a 2% agarose drop to avoid movement in the well. Finally, the microwells were rinsed with PBS to remove residual ethanol. A 20 mm diameter hole was drilled in each well of a 12-well plate. Under a fume hood, the microwell–coverslip systems were glued at the bottom of each well with Norland Optical Adhesive 81 (NOA). For glue polymerization, the plate was left under a UV lamp for 2 minutes. Then, to keep the microwells hydrated and to create an environment suitable for cell seeding, 1 mL of medium (DMEM 1× GlutaMAX™, 10% FBS, 1% PS, 0.20 μm filtered) was added to each well of the plate and the plate was sterilized under a UV lamp for 10 minutes with the lid off and 30 minutes with the lid on. The plate was stored in the fridge until use.Optimization of agarose microwells
A non-silanised coverslip was used in the agarose gelation step and was removed during demoulding to simplify agarose detachment from the mould, thereby avoiding fractures in the hydrogel matrix and preserving the integrity of the microwells. The agarose microsystem was then fixed onto a silanised coverslip using a small drop of liquid agarose as glue, as illustrated in Fig. 1. | ||
| Fig. 1 (a) Schematic illustration of the preparation protocol for agarose microwells: (1) warmed PDMS mould sprayed with ethanol, (2) 130 μL of 2% liquid agarose pipetted onto the PDMS mould, (3) coverage with a non-silanised coverslip to promote slow and homogeneous gelation at room temperature, (4) detachment of the agarose microwells from the mould, (5) fixation of the agarose microwells on a silanised 22 mm diameter coverslip with a 2% agarose drop, and (6) fixation of the microwell–coverslip systems at the bottom of each well in a 12-well plate; (b) representation of the advantages obtained from the optimization of the agarose microwell fabrication (scale bar: 500 μm): (1) phase contrast image (5×) of HCT-116 spheroids grown only on the border of the system, indicating the presence of microwells to host cells only in that part of the agarose matrix, (2) microscope visualization (4×) of an agarose support with microwells broken as a consequence of demoulding, and (3) phase contrast image (5×) of regular and homogeneous HCT-116 spheroids formed in the final microwells. | ||
Coverslip salinization
In order to perform the 3-aminopropyltriethoxysilane (APTS) functionalization, 22 mm coverslips were washed with ethanol and deionized water, dried with compressed air and placed in a clean Petri dish. Under a fume hood, a 1% APTS solution was prepared in a 50 mL Falcon tube by mixing 43.5 mL of deionized water, 12.5 μL of glacial acetic acid and 435 μL of 3-aminopropyltriethoxysilane 99%. The APTS solution was poured onto the Petri dish containing the coverslips and the system was left 20 minutes under stirring. The coverslips were then washed with deionized water for 3 seconds on each side, dried with compressed air and left on a hot plate at 100 °C for 15 minutes.Cell culture
The HCT-116 (ATCC® CCL-247™) human colorectal carcinoma cell line (initiated from an adult male) was purchased from the American Type Culture Collection (ATCC, Virginia, USA). The cells were stored in 1 mL batches in the liquid nitrogen vapor phase (−196 °C) until use. All reagents, media, and solutions were sterilized using the sterile filtration procedure with a 0.22 μm Millipore Express® polyether sulfone (PES) filter. The HCT-116 cells were grown in Dulbecco's Modified Eagle's medium (DMEM 1× GlutaMAX™, Gibco Life Technologies), supplemented with 10% heat-inactivated fetal bovine serum (FBS, Pan Biotech) and 100 units/100 μg of penicillin/streptomycin (PS, Gibco Life Technologies) in T25 flasks. The cells were incubated at 37 °C under a humidified atmosphere with 5% of CO2 for a few days. The culture medium was changed regularly, and cell passages were performed every three days. Cells were detached with 500 μL of Trypsin (TrypLE™ Select Enzyme 1×, Gibco Life Technologies). All cells were used at low passage numbers (not exceeding passage 30).MCTS formation in multiwells
MCTS were engineered from the spontaneous aggregation of the HCT-116 cell line and placed in an ultra-low attachment (ULA) 96-well round-bottom plate (Greiner bio-one) to avoid cell–substrate attachment. The cells were trypsinised and counted using a Malassez grid. The cell suspension was diluted in order to obtain 2400 cells per mL (480 cells per well in a volume of 200 μL). This concentration of cells was chosen to obtain a single spheroid per well with a diameter not exceeding 300 μm at the end of the experiment. After seeding, the plates were cultured at 37 °C with 5% CO2 for two days to allow spheroid formation. The culture medium was renewed at the third day before starting the experiment. To study the influence of the spheroids’ initial size on the effect of therapeutic treatment, several alternative cell dilutions were also used to obtain spheroids of different radii (4800 c mL−1, 2400 c mL−1, 1200 c mL−1, 600 c mL−1, 300 c mL−1, and 150 c mL−1).MCTS formation in microwells
MCTS formation in microwells was promoted by the cell-repellent nature of the agarose. In the culture flasks, cells were trypsinised, counted using the Neubauer method and diluted in order to reach a concentration of 120![[thin space (1/6-em)]](https://www.rsc.org/images/entities/char_2009.gif) 000 cells per mL. This cell concentration was chosen in order to have spheroids with a diameter not exceeding 300 μm (i.e., the size of the microwells) at the end of the experiment. For cell seeding, 1 mL of the cell suspension was added to each well of the 12-well plate containing the agarose microwells and spheroids were cultured at 37 °C with 5% CO2 for two days before starting the treatment to allow for cell assembly.
000 cells per mL. This cell concentration was chosen in order to have spheroids with a diameter not exceeding 300 μm (i.e., the size of the microwells) at the end of the experiment. For cell seeding, 1 mL of the cell suspension was added to each well of the 12-well plate containing the agarose microwells and spheroids were cultured at 37 °C with 5% CO2 for two days before starting the treatment to allow for cell assembly.
CellTiter-Glo® 3D cell viability assay
Cell viability was assessed with the CellTiter-Glo® 3D method. MCTS grown in ULA 96-well round-bottom plates were treated with OXA water solution, blank NPs and DACHPt-loaded NPs at 5, 10, 25 and 50 μM on days 0, 1 and 2. Blank nanoparticles were also tested to evaluate the toxicity of empty nanosystems. From day 3 on, the medium was replaced with culture medium without treatment. Cell viability measurements were performed on days 4 and 7. For the measurements, 10 MCTS per condition were transferred from the ULA 96-well round-bottom plates and placed separately in single wells of a 96-well opaque culture plate (Thermo Fisher Scientific™). Then, a CellTiter-Glo® 3D reagent was mixed with the culture medium in a ratio of 1:1, promoting the reaction that generates the luminescence signal in the presence of ATP (i.e., live cells). After a 30-minute equilibration period, the luminescence signal was measured with the Tristar 5 Multimode Reader (Berthold Technologies GmbH & Co. KG), with an integration time of 0.5 s. Cell viability, CV, was calculated using eqn (3): | (3) |
MCTS treatment in multiwells
An OXA water solution (used as a reference drug), blank NPs and DACHPt-loaded NPs were tested on MCTS. A control condition which did not receive any treatment was included in each experiment. For a proper comparison, DACHPt-loaded NPs and OXA water solutions were tested at the same drug concentrations of 5, 25 and 50 μM on MCTS. The OXA water solution, drug-loaded NPs, and blank NPs suspension were dispersed in culture medium (200 μL) and incubated in the wells with the spheroids after two days of seeding. Treatment and medium were renewed each day from day 0 to 2 and from day 3 to 7, respectively, as explained above. The blank NP dilution was prepared by considering the concentration of polymers in the NP formulation with the highest concentration of DACHPt (50 μM). For the control spheroids, the culture medium was renewed each day (day 0–7).MCTS treatment in microwells
Each treatment condition (control, OXA water solution, blank and DACHPt-loaded NPs) was tested on about 50 MCTS, corresponding to the number of spheroids grown in microwells. Firstly, the medium was gently removed from the wells. 500 μL of new prewarmed medium was added to each well. Then, considering the same concentration used for MCTS treatment in multiwells (see above), 500 μL of the appropriate drug dilution was added to each well (500 μL of medium for the control group). To obtain the desired dilutions, a specific volume of OXA water solution or a freshly prepared blank/DACHPt-loaded NPs in water suspension was mixed with the culture medium. The treatment was performed on days 0, 1, and 2 and the culture medium was replaced each day from day 3 on. The drug's effects were monitored until day 7.MCTS size evaluation
Brightfield images of the MCTS were taken daily after treatment or medium renewal using an inverted microscope (Leica DMi8) with a 5× objective, enclosed in an incubation chamber (37 °C and 5% CO2). A threshold was applied to isolate the MCTS and allow edge detection using ImageJ software (Fig. 2). In these binary images, the spheroids were fitted to an ellipse and the area A occupied by the MCTS was calculated through the ImageJ Analyze Particles’ plugins. From this, the sphere-equivalent mean radius was extrapolated, . The resulting values were normalized to the radius measured under control conditions (untreated spheroids).
 | ||
| Fig. 2 (1) Brightfield image (5×, scale bar: 500 μm) of HCT-116 spheroids on day 0 and (2) application of the threshold function. | ||
BLS measurements
In BLS, the infinitesimal compressive motion induced by spontaneous acoustic phonons creates a periodic grating of refractive index fluctuations.35 Using a monochromatic visible light beam, this grating with a spacing imposed by the acoustic wavelength produces peaks in the spectrum of the backscattered light characterized by a frequency shift f (eqn (4)):36 | (4) |
 depends on the stiffness, M, and mass density, ρ, and is thus an indicator of the mechanics of the sample. A typical spectrum is plotted in Fig. 3a, where we observe three peaks. The smallest peak at f = 0 is due to elastic scattering (so-called Rayleigh scattering) at the same frequency as the illumination. This contribution is usually discarded for BLS analysis. The left-hand side and right-hand side peaks at around −8 and 8 GHz, respectively, are the Stokes and anti-Stokes Brillouin peaks produced by counter-propagating phonon modes. Here we average these two peaks to extract f.
 | ||
| Fig. 3 (a) Typical spectrum obtained at the center of an MCTS and (b) schematic of the BLS setup. SM, single mode. NA, numerical aperture. CW, continuous wave. | ||
We used a 532 nm single-mode CW laser with a spectral line width <0.01 pm (Spectra-Physics Excelsior-532; 15 mW measured at the sample). The laser is coupled to an inverted life science microscope (Nikon Eclipse Ti2-U) to focus on and collect the backscattered light with the same objective lens (20×, N.A. 0.35). We chose a lens with a low numerical aperture to avoid broadening of the Brillouin spectrum. The output beam is coupled using an objective lens (4×, N.A. 0.10) into a single-mode fiber (1 m, 400–680 nm, core diameter 3 μm) connected to a Brillouin spectrometer as shown in Fig. 3b. The VIPA-based spectrometer (Light Machinery; Hyperfine HF-8999-532) is based on a 3.37 mm-thick VIPA etalon (30 GHz, 500–600 nm) and is equipped with two double-pass air-spaced etalons to increase the contrast to about 120 dB. The fiber is directly connected to the built-in FC/PC connector of the spectrometer. The free spectral range of the VIPA used in our work is 30 GHz, corresponding to a sampling interval of 0.11 GHz. To ensure perfect control of the sample, the microscope is enclosed in an environmental chamber to maintain a constant temperature (37 °C) and a 5% CO2 level.
To monitor the effect of NPs on MCTS mechanical integrity, a frequency shift was probed each day at the center of the MCTS. The frequency shift of at least 20 spheroids per test condition was probed every day at the same hour, after optical microscopy observations and drug treatment (day 0–7). The frequency shift in the culture medium, fm, was also probed to be subtracted from the one measured in the spheroids. The frequency variation at the center, Δf, was calculated by normalizing the frequency measured in the spheroids, fs, to the control spheroids of day 0, f\ 0s, using the following equation (eqn (5)):
 | (5) |
Statistical analysis
For the statistical analysis of the in vitro experiments on cell viability, the software GraphPad Prism 8.0 was used. Sidak's multiple comparison test was adopted and p values <0.05 were considered statistically significant.Results and discussion
Blank and DACHPt-loaded NP preparation and characterization
Blank and DACHPt-loaded NPs were prepared using the ionic gelation technique, which relies on the electrostatic polyelectrolyte complexation between the negatively charged carboxylic group of HA and the positively charged guanidine group of PArg–OH. In the case of DACHPt-loaded NPs, a previous reaction of DACHPt–Cl2 with AgNO3 is needed to increase its solubility in water and to promote its activation. The yield of the reaction was around 70%. Then, the DACHPt solution is mixed with the PArg–OH solution before adding the HA solution. The formation of a metal–polymer complex between the platinum of DACHPt and the carboxylic group of HA is the driving force for DACHPt association with NPs. PArg is needed as a crosslinking agent to form stable nanosystems. On the base of previous studies, a HA/PArg mass ratio of 3.6 was chosen to provide optimal physico-chemical properties and stability of the complex.30 As listed in Table 1, efficient electrostatic complexation led to the formulation of stable NPs with a size of around 170 nm, a polydispersity index (PDI) lower than 0.1, a negative surface charge (ζ-potential around −35 mV), a result of the presence of an excess of HA in the NPs preparation, and an EE of around 70%.| Size (nm) | PDI | ζ potential (mV) | EE (%) | |
|---|---|---|---|---|
| Blank NPs | 169 ± 7 | <0.1 | −36.2 ± 1 | — |
| DACHPt-loaded NPs | 174 ± 7 | <0.1 | −34.9 ± 1 | 71 ± 4 |
Evaluation of drug efficacy on MCTS grown in multiwell plates
In order to quantify the in vitro anticancer efficacy of nanomedicine, we selected 3D MCTS (human colorectal carcinoma cell line HCT-116), a powerful tool to evaluate the activity and penetration of drug-loaded nanosystems. We first engineered the MCTS in multiwell plates, as is classically done. We treated the MCTS with polymeric nanoparticles loaded with the platinum derivative (1,2-diaminocyclohexane) platinum(II) (DACHPt) and commercial oxaliplatin (OXA) solutions, used as a reference drug. After a three-day treatment, MCTS cell viability was evaluated using the CellTiter-Glo® 3D method (see Materials and methods) to verify the cytotoxic efficacy of the nanosystem and its long-term activity. Fig. 4 shows MCTS cell viability evaluated on days 4 and 7. We observe a comparable cytotoxic effect for OXA solutions and DACHPt-loaded NPs on day 4 (Fig. 4a). Conversely, on day 7, we observe a statistically significant difference (p < 0.0001) between the batches treated with DACHPt-loaded NPs and OXA solutions (Fig. 4b). The marked cytotoxic effect at all the concentrations tested of DACHPt-loaded NPs suggests long-term efficacy of NPs compared to OXA solutions. Blank NPs, prepared using the same concentration of polymers as the highest DACHPt-loaded NP formulation (50 μM), show a cell viability of 84% on day 4 and 97% on day 7, confirming the biocompatibility of the nanosystem. | ||
| Fig. 4 Percentage of cell viability of MCTS treated with OXA solutions and DACHPt-loaded NPs at 5, 10, 25 and 50 μM, measured on (a) day 4 and (b) day 7. Statistical data analysis on Sidak's multiple comparison test: *p < 0.05; **p < 0.01; ***p < 0.001; ****p < 0.0001; and ns = not significant. | ||
Then, we measured the radii of MCTS (10 per condition) using brightfield microscopy for 8 days to further assess the long-term efficacy of the treatments. Brightfield images of control MCTS grown in culture medium (top row) are plotted in Fig. 5a. They reveal a regular spherical shape. Fig. 5b shows the MCTS radii measured from brightfield images. We observe a linear increase in size for the control condition at a rate of 23 μm day−1 for an initial radius of 130 μm (red line). For illustration, Fig. 5a shows the size evolution of MCTS treated with a 25 μM OXA solution (bottom row). We observe a decrease in size with the length of the treatment, with the formation of a diffuse outer layer made of loosely attached cells on day 4, consistent with the anticancer effect of the drug (Fig. 4a). Interestingly, the morphology of treated MCTS remained largely comparable with that of untreated MCTS, allowing the use of the radius as a read-out for drug efficacy as has been shown in other works.27,37
 | ||
| Fig. 5 (a) Phase-contrast images of MCTS at days 0, 2 and 4 (scale bar: 200 μm) for the control condition (top row) and treatment with a 25 μM OXA solution (bottom row). (b) MCTS radius vs. time measured from images in Fig. 4a (markers), fitted to a linear function (red line). | ||
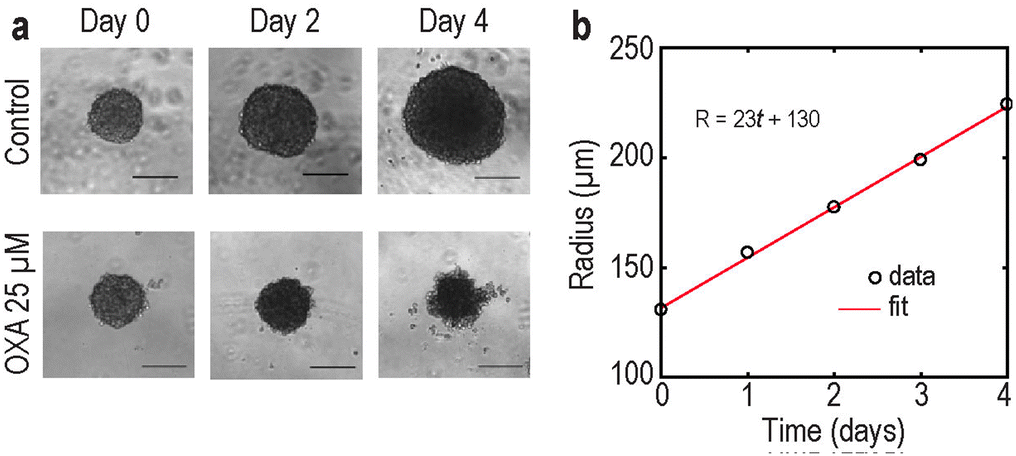
To test the influence of the initial MCTS radius on treatment efficacy, we increased the initial cell concentrations to form MCTS. We observe a non-linear increase in the MCTS radius R with increasing cell concentration C (Fig. 6a). As a guide to the eye, the radius (markers) was fitted to the function R = 45 + 1.7√C (red line), consistent with typical MCTS growth. To evaluate the impact of MCTS size on treatment efficacy and BLS shift, we probed the BLS shift at the center of MCTS formed from different initial cell concentrations and treated with DACHPt-loaded NPs at 50 μM. Fig. 6b shows f measured for each size group with a different colour for each day. We observe that on each day f remains largely independent of the initial cell concentration. For this reason, the average f-value for each day was plotted (plain lines in Fig. 6b and circles in Fig. 6c). This analysis demonstrates that the size of MCTS does not impact treatment efficacy, suggesting that NP diffusion within the tissue occurs within minutes. Moreover, this makes f-values more versatile and immune to uncertainties due to size variations during the fabrication protocol of MCTS. We also observe a frequency shift decreasing with the duration of treatment, as previously observed with free drugs.27
 | ||
| Fig. 6 (a) MCTS radius R vs. initial cell concentration C fitted to the function R = 45 + 1.7√C (red line). (b) Frequency shift measured at the center of MCTS treated with NPs at 50 μM. Each size group is plotted with a different colour for each day (markers) and average values for each day are rendered as lines. (c) Average frequency shift for each group size corresponding to (b). Control points are plotted in grey, and the line indicates the mean. (d) Frequency shift vs. days and initial cell concentration at seeding for (d) control group and (e) group treated with NPs at 50 μM. (f) Frequency shift measured at the center of MCTS treated with NPs at 50 μM. Each size group (obtained for different initial cell concentrations at seeding) is plotted with a different colour. The mean of all concentrations is plotted in gray. | ||
We also tested different concentrations of treatment. We selected 5, 25 and 50 μM concentrations for both OXA solutions and DACHPt-loaded NPs, considering the similar cytotoxic effect between 5 and 10 μM (see Fig. 4). Fig. 7 shows the radius of MCTS treated with OXA solutions (panel a) or with DACHPt-loaded NPs (panel b), normalized to the radius of the control MCTS. Blank NPs (grey line, panel b) do not significantly affect spheroid growth (size reduction is less than 7% on day 7). This observation demonstrates the non-toxicity of the nanocarriers, in agreement with cell viability results. In addition, the effect of OXA and DACHPt-loaded NPs on MCTS size is dose and time dependent, as has been observed previously for other nanosystems loaded with 5-fluorouracil (5-FU).37 On day 3, DACHPt-loaded NPs and OXA both led to comparable MCTS growth impairment at all concentrations tested (5, 25 and 50 μM). On day 4 however, the size of MCTS treated with 50 μM of DACHPt-loaded NPs was reduced by 70% compared to the control, while OXA alone induced only a 50% size reduction (Fig. 7c). This result suggests an increase in treatment efficacy using loaded NPs on day 4.
 | ||
| Fig. 7 Mean MCTS radius normalized to control radius monitored during 7-day therapy for (a) OXA solutions and (b) DACHPt-loaded NPs after treatment at 5, 25 and 50 μM concentrations. (c) Mean MCTS radius normalized to control radius for OXA and DACHPt-loaded NPs on day 4. | ||
To evaluate the impact of OXA treatment on the mechanical properties of MCTS, we probed the BLS shift f at the center of each spheroid. f-Values were collected 1 h after size measurement on the same plate. We observe a clear reduction in f over time, with a more pronounced effect at higher concentrations (Fig. 8). In Fig. 8c, we plot f for both OXA and DACHPt-loaded NPs on day 4 for comparison. We chose day 4 because we stopped the treatment on day 3, and later time points might include a potential relapse of the tumor and may not be available due to complete destruction of the MCTS (see, for instance, the 50 μM NP condition). Overall, similar values were found for loaded NPs and OXA solutions, in agreement with size measurements (Fig. 7) and cell viability on day 4 (Fig. 4a). In the case of MCTS treated with 50 μM of DACHPt-loaded NPs (Fig. 8b), the frequency variation on day 7 was not measured because the difference between the frequency shift measured in culture medium and in cell aggregates was not detectable. This observation suggests a high cytotoxic effect of the loaded nanosystems, consistent with viability studies. Globally, these results demonstrate the sensitivity of BLS to therapeutic protocols in 3D models and its ability to follow anticancer drug efficacy, and the agreement with size measurements indicates that BLS can advantageously complement brightfield imaging. However, the low sample number (which can be as low as 3 MCTS at the highest concentrations), imposed by the number of wells per condition in the multiwell plate, hinders a clear comparison between OXA and DACHPt-loaded NPs. To overcome this issue and increase throughput, we propose using microwells in the remainder of our study.
 | ||
| Fig. 8 Frequency shift variation probed at the centre of MCTS treated with (a) OXA solutions at 5, 25 and 50 μM and (b) DACHPt-loaded NPs. (c) Data on day 4 for both OXA and DACHPt-loaded NPs. | ||
Evaluation of drug efficacy on MCTS in microwells
Recently, the use of micro-patterned arrays has been investigated to develop a high-throughput screening platform. Goodarzi et al. proposed a simple agarose-based microsystem that is fully compatible with conventional multi-well plates and offers larger statistics.33,34 Here, to ensure proper focusing of the laser beam for BLS investigation, we replaced the well bottoms with silanised coverslips to fix the microwells securely. This optimized fabrication technique provides an increased number of spheroids with homogeneous size, circular shape and well-defined edges. We designed approximately 50 microwells per well (i.e. per condition), each separated by 300 μm. Fig. 9 shows brightfield images of the microwells that reveal a morphology and volume increase, in both control MCTS and MCTS treated with blank NPs, similar to MCTS grown in 96-well plates. Contrary to MCTS grown in multiwell plates, all other MCTS treated with OXA or DACHPt-loaded NPs showed a darker core surrounded by a grey ring. This is due to the accumulation of dead cells, trapped in the microwells, which are not removed by changing the medium. | ||
| Fig. 9 Brightfield images of HCT-116 spheroids in microwells on day 0 and on day 4 (scale bar: 400 μm). Test conditions: control, OXA solution 5–25–50 μM, blank NPs, and DACHPt-loaded NPs 5–25–50 μM. | ||
To measure the radii of the MCTS, the threshold function in ImageJ software was used to detect the surface occupied by treated MCTS. For illustration, Fig. 10a shows a comparison between the brightfield image and the result of the threshold function on day 4. Clearly, this procedure includes both the compact living nucleus of MCTS and the surrounding dead cells. Fig. 10b shows the resulting radii vs. time for all conditions. We observe, even at the highest concentration of the drug, an increase in the radius comparable with that of the control condition. This analysis demonstrates that the radius, as measured with the threshold segmentation, cannot be used to quantify the efficacy of the drug in microwells. For this reason, we now turn to BLS spectroscopy.
 | ||
| Fig. 10 (a) (1) Brightfield image (scale bar: 500 μm) of MCTS on day 4 after treatment with OXA solution at 50 μM; (2) result of the ImageJ threshold function. (b) MCTS radius as a function of time after treatment with OXA solution (left panel, 5, 25 and 50 μM), DACHPt-loaded NPs (center panel, 5, 25, 50 μM) and blank NPs, and for OXA and DACHPt-loaded NPS on day 4 (right panel). | ||
We have shown in the previous sections that, in multiwells, BLS spectroscopy gives quantification of drug efficacy similar to that of radius measurement, but without the need for labelling or image analysis. BLS measurements were performed just after image acquisition and the treatment of the samples. 20 spheroids per test condition were analysed each day. Fig. 11a and b show the relative frequency shift measured at the center of MCTS treated with OXA and NPs, respectively. MCTS treated with blank NPs show a largely constant f-values (Fig. 11b), confirming the non-toxicity of the carrier. For all treatments, we obtained a small standard deviation, demonstrating that the higher number of samples in microwells effectively improved the robustness of the data compared to multiwells. We observe a slight difference between conditions on day 0 which we attribute to an osmotic shock occurring when replacing the medium, as has been shown with dextran solutions.29 At longer times and for higher concentrations, the f-values plateau at around a 10% frequency variation which we interpret as a complete loss of mechanical integrity. Considering treated spheroids, the frequency shift decreased in a dose-dependent manner, as observed in the multiwells. We observe a similar decrease in f-values for MCTS treated with OXA and NPs at 5 and 50 μM. At 25 μM concentration however, drug-loaded nanosystems induced a more pronounced effect compared to the free drug, reaching on day 4 (Fig. 11c) a f-value comparable to that for 50 μM treatment (significant at p = 0.0009, one-tailed t-test). Data on day 7 show that treated MCTS did not proliferate again after the end of the treatment, confirming the long-lasting efficacy of the nanosystem. Finally, we observe that the plateau around 10% is reached faster for DACHPt-NPs than for OXA solutions, demonstrating a more durable cytotoxic activity compared to OXA solutions, in line with the higher cytotoxic effect highlighted by cell viability tests (Fig. 4b).
 | ||
| Fig. 11 Frequency shift variation after treatment of HCT-116 MCTS with (a) OXA water solution at 5–25–50 μM and (b) DACHPt-loaded NPs at 5–25–50 μM. (c) Frequency shift variation as a function of drug concentrations on day 4 for OXA and DACHPt-loaded NPs. | ||
Conclusions
In order to quantify the anticancer efficacy of nanomedicine in vitro, we treated 3D MCTS with drug-loaded nanosystems. We first engineered the MCTS in multiwell plates, as is classically done. After a treatment, we monitored the MCTS radii as is also classically done using phase-contrast microscopy images,37 during a 7-day therapy, observing a decrease in size that can be used as a read-out for efficacy. We also probed the BLS frequency shift f at the center of the MCTS. This emerging technology is label-free, compatible with standard microscopes, and offers rapid probing with minimal data processing. It has been previously used by Margueritat et al. to study the effect of 5-FU, however at a very high concentration.27 The action of the drug degrades the physical properties and the structure of the MCTS. This process reduces both n (indicator of the optical properties) and V (indicator of the mechanical properties, see Material and methods), which we observed through a reduction of f. In this work, we observed a decrease in f with time and dose, consistent with radius decrease using therapeutic concentrations. This demonstrates the sensitivity of BLS to therapeutic protocols in 3D models. We also showed that the f-value at the center of the MCTS was largely insensitive to the initial MCTS radius, making it more versatile and immune to uncertainties due to size variations during the fabrication protocol of MCTS.The use of multiwell plates is time-consuming and only provides 5–10 MCTS per condition. We have implemented the use of agarose microwells based on a design recently proposed by Goodarzi et al. that is fully compatible with conventional multi-well plates, offering larger statistics.33 Agarose can easily form gels with porous structure, is biocompatible and repels cells. In addition, the transparency of the thin agarose layer offers optical access from the top and bottom sides of the microwell plate for microscopy. In microwells, we have shown that quantification of the radius can be challenging because it is difficult to rinse the cell debris forming during therapy, which renders size measurement inaccurate. Conversely, a decrease in the frequency shift in a dose-dependent manner was observed, without being influenced by the presence of dead cells all around. The results were comparable with what we observed in multiwell plates, but with a much lower standard deviation due to the increased number of samples. We observed a similar frequency decrease in spheroids treated with OXA solutions and DACHPt-loaded NPs at 5 and 50 μM, with a more pronounced effect of NPs compared to the free drug at 25 μM. Moreover, the absence of a new increase in the frequency shift after the treatment with DACHPt-loaded NPs was stopped at day 3, i.e. the lack of evidence of new growth in the tumoral model, confirmed the long-lasting efficacy of the nanosystem. The plateau corresponding to a complete loss of mechanical integrity was reached faster with NPs, demonstrating a more durable cytotoxic activity compared to OXA solution, in line with cell viability experiments.
In conclusion, this study affirms the suitability of BLS analysis for the quantitative screening of nanosystems on 3D tumour models. The combination with microwells provides a high-throughput platform for the precise determination of the efficacy of the drug. In these systems, BLS does not require labelling, fixation, or complex data processing, and is not dependent on size variation and boundary effects that can occur during MCTS growth. Importantly, contrary to size measurement, BLS provides information on the core of the MCTS, hence giving a more reliable information on drug efficacy. In the future, mapping the frequency shift at shorter timescales should also allow for investigation of the kinetic of drug penetration and mode of action. Since the shift depends on optical and mechanical properties, it would be informative to probe the refractive index simultaneously and refine our understanding of the molecular mechanisms at play during drug therapy.
Author contributions
Giulia Guerriero: experimental work, characterization, data collection, data analysis, writing the original draft and editing. Alexis Viel: data collection and data analysis. Veronica Feltri: experimental work and characterization. Alice Balboni: experimental work and characterization. Guqi Yan: data collection and data analysis. Sylvain Monnier: data collection and data analysis. Giovanna Lollo: project administration, supervision, writing, review and editing. Thomas Dehoux: project administration, supervision, investigation, writing, review and editing.Conflicts of interest
There are no conflicts to declare.Acknowledgements
We thank Charlotte Rivière for her advice on the elaboration of the microwells. We thank ITMO Cancer AVIESAN (Alliance Nationale pour les Sciences de la Vie et de la Santé/National Alliance for Life Sciences & Health) for the financial support within the framework of the Cancer Plan, specifically the PerImmune project group supported by the national funding organisations under the framework of the ERA-NET TRANSCAN-3 initiative (JTC 2021): FWO, Belgium; RCN and NCA, Norway; INCa and ARC, France; TUBITAK, Turkey; BMBF, Germany, and the SATT-Ouest project NanoNeb.References
- A. Wicki, D. Witzigmann, V. Balasubramanian and J. Huwyler, J. Controlled Release, 2014, 200, 138–157 CrossRef PubMed.
- M. S. Sasso, G. Lollo, M. Pitorre, S. Solito, L. Pinton, S. Valpione, G. Bastiat, S. Mandruzzato, V. Bronte, I. Marigo and J. Benoit, Biomaterials, 2016, 96, 47–62 CrossRef CAS PubMed.
- L. Pinton, S. Magri, E. Masetto, M. Vettore, I. Schibuola, V. Ingangi, I. Marigo, K. Matha, J. Benoit, A. Della Puppa, V. Bronte and S. Mandruzzato, J. Nanobiotechnol., 2020, 18(1), 31 CrossRef CAS PubMed.
- R. van der Meel, E. Sulheim, Y. Shi, F. Kiessling, W. J. M. Mulder and T. Lammers, Nat. Nanotechnol., 2019, 14(11), 1007–1017 CrossRef CAS PubMed.
- J. M. Metselaar and T. Lammers, Drug Delivery Transl. Res., 2020, 10(3), 721–725 CrossRef PubMed.
- J. Shi, P. W. Kantoff, R. Wooster and O. C. Farokhzad, Nat. Rev. Cancer, 2020, 15(1), 20–37 CrossRef PubMed.
- P. Xie, J. Zhang, P. Wu, Y. Wu, Y. Hong, J. Wang and Z. Cai, Chin. Chem. Lett., 2023, 34(2), 107349 CrossRef CAS.
- S. I. Bär, B. Biersack and R. Schobert, Invest. New Drugs, 2022, 40(5), 953–961 CrossRef PubMed.
- C. Jensen and Y. Teng, Front. Mol. Biosci., 2020, 7, 33 CrossRef CAS PubMed.
- H. Ju, L. Noorani, Y. Jiang, A. W. Du and M. H. Stenzel, J. Mater. Chem. B, 2017, 5(48), 9591–9599 RSC.
- H. Lu and M. H. Stenzel, Small, 2018, 14(13), e1702858 CrossRef PubMed.
- F. Castro, C. L. Pereira, M. H. Macedo, A. Almeida, M. J. Silveira, S. Dias, A. P. Cardoso, M. J. Oliveira and B. Sarmento, Adv. Drug Delivery Rev., 2021, 175, 113824 CrossRef CAS PubMed.
- S. Daunys, A. Janonienė, I. Januškevičienė, M. Paškevičiūtė and V. Petrikaitė, Adv. Exp. Med. Biol., 2021, 1295, 243–270 CrossRef CAS PubMed.
- M. Millard, I. Yakavets, V. Zorin, A. Kulmukhamedova, S. Marchal and L. Bezdetnaya, Int. J. Nanomed., 2017, 12, 7993–8007 CrossRef CAS PubMed.
- E. C. Costa, A. F. Moreira, D. de Melo-Diogo, V. M. Gaspar, M. P. Carvalho and I. J. Correia, Biotechnol. Adv., 2016, 134(8), 1427–1441 CrossRef PubMed.
- I. Dufau, C. Frongia, F. Sicard, L. Dedieu, P. Cordelier, F. Ausseil, B. Ducommun and A. Valette, BMC Cancer, 2012, 12, 15 CrossRef CAS PubMed.
- G. Lazzari, D. Vinciguerra, A. Balasso, V. Nicolas, N. Goudin, M. Garfa-Traore, A. Fehér, A. Dinnyés, J. Nicolas, P. Couvreur and S. Mura, Eur. J. Pharm. Biopharm., 2019, 142, 195–203 CrossRef CAS PubMed.
- E. Nürnberg, M. Vitacolonna, J. Klicks, E. von Molitor, T. Cesetti, F. Keller, R. Bruch, T. Ertongur-Fauth, K. Riedel, P. Scholz, T. Lau, R. Schneider, J. Meier, M. Hafner and R. Rudolf, Front. Mol. Biosci., 2020, 7, 20 CrossRef PubMed.
- A. Virgone-Carlotta, M. Lemasson, H. C. Mertani, J. Diaz, S. Monnier, T. Dehoux, H. Delanoë-Ayari, C. Rivière and J. Rieu, PLoS One, 2017, 12(11), e0188100 CrossRef PubMed.
- G. Scarcelli and S. H. Yun, Nat. Photonics, 2007, 2, 39–43 CrossRef PubMed.
- G. Scarcelli, W. J. Polacheck, H. T. Nia, K. Patel, A. J. Grodzinsky, R. D. Kamm and S. H. Yun, Nat. Methods, 2015, 12(12), 1132–1134 CrossRef CAS PubMed.
- T. Dehoux, M. Abi Ghanem, O. F. Zouani, J. Rampnoux, Y. Guillet, S. Dilhaire, M. Durrieu and B. Audoin, Sci. Rep., 2015, 5, 8650 CrossRef CAS PubMed.
- R. Schuller, S. Möllmert, S. Abuhattum, G. Cojoc, P. Müller, K. Kim, C. Möckel, C. Zimmermann, J. Czarske and J. Guck, Biophys. J., 2018, 115(5), 911–923 CrossRef PubMed.
- K. Elsayad, S. Werner, M. Gallemí, J. Kong, E. R. Sánchez Guajardo, L. Zhang, Y. Jaillais, T. Greb and Y. Belkhadir, Sci. Signaling, 2016, 9(435), rs5 CrossRef PubMed.
- T. Lainović, J. Margueritat, Q. Martinet, X. Dagany, L. Blažić, D. Pantelić, M. D. Rabasović, A. J. Krmpot and T. Dehoux, Acta Biomater., 2020, 105, 214–222 CrossRef PubMed.
- G. Yan, A. Bazir, J. Margueritat and T. Dehoux, Biomed. Opt. Express, 2020, 11(12), 6933 CrossRef CAS PubMed.
- J. Margueritat, A. Virgone-Carlotta, S. Monnier, H. Delanoë-Ayari, H. C. Mertani, A. Berthelot, Q. Martinet, X. Dagany, C. Rivière, J. Rieu and T. Dehoux, Phys. Rev. Lett., 2019, 122(1), 018101 CrossRef CAS PubMed.
- F. Palombo and D. Fioretto, Chem. Rev., 2019, 119(13), 7833–7847 CrossRef CAS PubMed.
- G. Yan, S. Monnier, M. Mouelhi and T. Dehoux, Proc. Natl. Acad. Sci. U. S. A., 2022, 119(4), e2113614119 CrossRef CAS PubMed.
- K. Matha, G. Lollo, G. Taurino, R. Respaud, I. Marigo, M. Shariati, O. Bussolati, A. Vermeulen, K. Remaut and J. Benoit, Eur. J. Pharm. Biopharm., 2020, 150, 1–13 CrossRef CAS PubMed.
- G. Lollo, J. Benoit and M. Brachet-Botineau, WO2020053445A1, 2020.
- F. Carton, Y. Chevalier, L. Nicoletti, M. Tarnowska, B. Stella, S. Arpicco, M. Malatesta, L. P. Jordheim, S. Briançon and G. Lollo, Int. J. Pharm., 2019, 568, 118526 CrossRef CAS PubMed.
- S. Goodarzi, A. Prunet, F. Rossetti, G. Bort, O. Tillement, E. Porcel, S. Lacombe, T. Wu, J. Guerquin-Kern, H. Delanoë-Ayari, F. Lux and C. Rivière, Lab Chip, 2021, 21(13), 2495–2510 RSC.
- C. Riviere, A. Prunet, L. Fuoco and H. Avari, FR3079524A1, 2018.
- L. Brillouin, Ann. Phys., 1922, 9(17), 88–122 Search PubMed.
- J. M. Vaughan and J. T. Randall, Nature, 1980, 284(5755), 489–491 CrossRef CAS PubMed.
- G. Lollo, K. Matha, M. Bocchiardo, J. Bejaud, I. Marigo, A. Virgone-Carlotta, T. Dehoux, C. Rivière, J. Rieu, S. Briançon, T. Perrier, O. Meyer and J. Benoit, J. Drug Targeting, 2019, 27(5–6), 634–645 CrossRef CAS PubMed.
| This journal is © The Royal Society of Chemistry 2023 |