
 Open Access Article
 This Open Access Article is licensed under a
 Creative Commons Attribution 3.0 Unported Licence
A structure–activity approach towards the toxicity assessment of multicomponent metal oxide nanomaterials†
G. P.
Gakis
,
I. G.
Aviziotis
and
C. A.
Charitidis
 *
*
Research Lab of Advanced, Composite, Nano-Materials and Nanotechnology, Materials Science and Engineering Department, School of Chemical Engineering, National Technical University of Athens, 9 Heroon Polytechneiou Street, Zografos, Athens 15780, Greece. E-mail: charitidis@chemeng.ntua.gr; Tel: +30 2107724046
First published on 26th September 2023
Abstract
The increase of human and environmental exposure to engineered nanomaterials (ENMs) due to the emergence of nanotechnology has raised concerns over their safety. The challenging nature of in vivo and in vitro toxicity assessment methods for ENMs, has led to emerging in silico techniques for ENM toxicity assessment, such as structure–activity relationship (SAR) models. Although such approaches have been extensively developed for the case of single-component nanomaterials, the case of multicomponent nanomaterials (MCNMs) has not been thoroughly addressed. In this paper, we present a SAR approach for the case metal and metal oxide MCNMs. The developed SAR framework is built using a dataset of 796 individual toxicity measurements for 340 different MCNMs, towards human cells, mammalian cells, and bacteria. The novelty of the approach lies in the multicomponent nature of the nanomaterials, as well as the size, diversity and heterogeneous nature of the dataset used. Furthermore, the approach used to calculate descriptors for surface loaded MCNMs, and the mechanistic insight provided by the model results can assist the understanding of MCNM toxicity. The developed models are able to correctly predict the toxic class of the MCNMs in the heterogeneous dataset, towards a wide range of human cells, mammalian cells and bacteria. Using the abovementioned approach, the principal toxicity pathways and mechanisms are identified, allowing a more holistic understanding of metal oxide MCNM toxicity.
1. Introduction
Engineered nanomaterials (ENMs) have emerged as a key part of today's technology,1 in various forms such as nanofilms,2–4 nanoparticles (NPs)5 and nanotubes.6,7 The applications of ENMs ranging from electronics8 to medicine,9 energy10 and catalysis11 has increased the intentional12,13 and non-intentional exposure to such materials in workplaces,14 households,15 atmospheric air,16 or via commercial products.17The topic of human and ecosystem safety upon exposure to ENMs has also been raised during the last decade.18 The most common way to assess the safety of an ENM is through experimental methods. In vitro toxicity methods, are faster, less costly and do not include animal testing.19 In contrast, in vivo methods are more reliable for hazard and risk assessment,20 but are characterized by higher cost and time requirements, let alone the ethical concerns regarding animal testing.
During the last decade, in silico methods21 have been employed for the study of ENM biodistribution22,23 and toxicity.21,24,25 In particular, focus has shifted to the development of structure–activity relationship (SAR) models for ENM toxicity assessment.26 These models are based on finding relations between physicochemical or structural properties of nanoparticles (NPs), known as descriptors, and toxicity data, thus developing predictive models for NP toxicity.27 These models can be either quantitative (QSAR),28 or classification models.24,25 Such approaches constitute a promising tool to provide a rapid and cost-effective toxicity assessment of various NPs, and to reduce animal testing.
Several SAR models that have been developed during the last decade, focused on metal oxide NPs.29–31 Reviews on such SAR approaches have been provided by Buglak et al.,26 and Li et al.32 However, the limited number of data points,28,33–35 as well as the complexity of the set of descriptors used for larger and more heterogeneous datasets,36–40 have rendered the extraction of mechanistic information from SAR models challenging. However, as the OECD principles for SAR model validation indicate, the mechanistic insight from such approaches should not be undermined.41 In this context, frameworks have been presented to approach the metal oxide NP toxicity in a more mechanistic way.42,43 Such frameworks have been used to explain experimental results regarding the toxicity of different sets of metal oxide NPs.24,31,34,44,45 Recently, we presented a classification SAR approach for the case of metal and metal oxide NP toxicity, using a large dataset of toxicity measurements towards a wide range of cell lines and organisms, such as human and mammalian cell lines, eukaryotes, bacteria, crustaceans, fish and plants.46 This approach was able to provide a more holistic understanding of the key NP features that induce toxicity, providing valuable information regarding the toxicity pathways and the metal oxide NP mode of action.
Although the scientific literature on the development of SAR models for pure metal and metal oxide NPs is extensive, less works have addressed the case of multicomponent nanomaterials (MCNMs). In particular, Mikolajczyk et al., studied the effect of Au and Pt loaded on the surface of TiO2 NPs, both experimentally and with a QSAR modelling approach.47 The same research group has studied the effect of other metals loaded on the surface of TiO2-based MCNMs via QSAR modelling48,49 providing web tools50 and modelling networks51 to treat such MCNMs. Beside the case of TiO2-based NPs, however, nano-SAR models focusing on other metal oxide MCNMs are very sparse, with only the case of doped ZnO particles being studied.52 Although the toxicity of doped and loaded metal oxides, as well as multi-metal oxides and bimetallic NPs has been studied experimentally,53,54 the focus has not been shifted to SAR models.
In this paper, we present a classification SAR approach for the case of metal–oxide MCNMs. The list of MCNMs includes metal-doped metal oxides, composite metal oxides, bimetallic particles, as well as metal oxides with metal or metal oxide NPs loaded on their surface. The dataset used for the model development consists of 796 toxicity measurements in the form of half maximal concentrations towards various cell lines and bacteria. This dataset is, to the best of the author's knowledge, the largest dataset of individual MCNM toxicity measurements used for SAR model development. The aim of the present study is to unravel key MCNM characteristics that induce toxicity by using a heterogeneous and large dataset, in order to extract mechanistic information and provide a more global understanding of MCNM toxicity. The novelty of the present work lies in the multicomponent nature of the nanomaterials and the size of the dataset used for the model training and validation, the approach used to compute MCNM descriptors, and the mechanistic insight obtained regarding MCNM toxicity. The diversity and heterogeneous nature of the present MCNM toxicity dataset can also contribute to a more global and mechanistic understanding of MCNM toxicity, as SAR models for MCNMs are still limited in scientific literature.
2. Methods
2.1. Toxicity endpoints
In this work, a SAR approach is developed regarding the toxicity of MCNMs. Specifically, this manuscript covers the case of metal-doped metal oxide NPs, bimetallic NPs, composite metal oxide NPs and metal oxide NPs loaded with metals on their surface. The developed dataset consists of MCNM toxicity measurements towards human (and human cancer) and mammalian cell lines. Toxicity data for such cell lines have been previously used for the development of QSAR models to predict the cytotoxicity of metal oxide NPs.26,31,32,34,46,55,56 Furthermore, toxicity measurements towards bacteria are also included. The toxicity endpoints are expressed as half maximal concentrations. These include half maximal effective (EC50), inhibitory (IC50), and lethal (LC50) concentration toxicity endpoints, collected from various published research works. Although most SAR models are built using a specific endpoint, the inclusion of these different half maximal concentrations (henceforth labelled as C50) within the same dataset has been previously addressed.36,39 The half maximal concentrations were derived by a dose–response study reported in the corresponding published paper. The toxicity classification scheme is described in the following section.2.2 Toxicity classification scheme
A measurement in the dataset is characterized as toxic if the logarithm of the molar concentration endpoint (mol L−1) was lower than −2.5 (log(C50) ≤ −2.5), based on previous studies.24 In some cases where a limited range of experimental concentrations is explored, the half maximal concentrations are just being reported to be higher than the maximum tested concentrations (C50 > Cmax,tested). In this paper, these measurements are characterized as in our previous study.46 Briefly, if the maximum concentration tested yields an effect of 50% or less and log(Cmax) > −2.5, then C50 was set to the maximum tested concentration, and the measurement is classified as non-toxic. Otherwise, if log(Cmax) ≤ −2.5, then the following scheme is applied: If Cmax is more than 50% of the threshold concentration (Cthres), the measurement is classified as non-toxic. If, however, Cmax is less than 50% of the threshold value, the measurement is omitted from the dataset. The value of 50% was arbitrarily chosen, so that a significant amount of MCNM has been exposed so that the measurement is classified as non-toxic, and to reduce the number of data omitted from the dataset.A similar approach was adopted for studies where Cmax yielded an effect higher than 50%. If the concentration tested was lower than the threshold value (log(Csingle) ≤ −2.5), then the C50 value is set to the concentration tested and classified as toxic. If the concentration tested was higher than the threshold value (log(Cmax) > −2.5), the measurement is omitted, i.e. removed from the dataset. The classification scheme is summarized in Table 1.
| Reported concentration | Condition | Classification |
|---|---|---|
| C50 value reported | log(C50) ≤ −2.5 | Toxic |
| log(C50) > −2.5 | Non-toxic | |
| C max yields effect > 50% | log(Cmax) ≤ −2.5 | Toxic |
| log(Cmax) > −2.5 | Omitted | |
| C max yields effect < 50% | log(Cmax) > −2.5 | Non-toxic |
| log(Cmax) ≤ −2.5, Cmax ≥ 0.5·Cthreshold | Non-toxic | |
| log(Cmax) ≤ −2.5, Cmax < 0.5·Cthreshold | Omitted |
Although the toxicity data in the dataset is heterogeneous in terms of the cell morphology which is exposed to the MCNMs, the same criteria are used for the classification of each measurement. As the aim of the present model is not to predict a quantitative value for a toxicity endpoint, but rather to qualitatively determine a toxic class for MCNMs and in this way to identify key MCNM characteristics with a dominant role on the toxicity mechanisms, the choice of similar criteria can be justified. Similar criteria have been used in relevant scientific literature,24,37,40,46 for such heterogeneous datasets to build classification models. The criteria used in the present analysis is based on the work of Simeone and Costa, which also uses the same toxicity criteria for the grouping of NPs based on their toxicity towards heterogeneous cells.24
2.3 Datasets
Following the above classification scheme, a dataset of 796 individual measurements is collected, regarding MCNM toxicity endpoints towards human/human cancer (onwards referred to as human) and mammalian cell lines, as well as bacteria. To the best of the author's knowledge, this is the largest dataset of individual toxicity measurements regarding MCNMs. The data were acquired from 104 different research papers and consist of half maximal concentration endpoints towards 78 different cell lines and bacteria, measured using different toxicity assays. In total, the dataset consists of 340 different MCNMs. The complete dataset is presented in the ESI (SM file 1).† The total set of data is split into subsets of data, based on the individual cell line or organism that was exposed to the MCNM. Furthermore, data subsets are created regarding the cell or organism group of the cell lines or organism, namely Human (and human cancer) cells, Mammalian cells and Bacteria. The criteria for the creation of a data subset are the dataset size (minimum of 30 measurements) and the balance between toxic and non-toxic measurements (minimum of 30% of both data classes). With these criteria, datasets for seven individual cells or organisms and three cell and organism groups are created. The final datasets are presented in Table 2.| Cell type/cell type | No. of measurements | No of NPs | % of toxic measurements | % of non-toxic measurements |
|---|---|---|---|---|
| Individual cell lines and organisms | ||||
| A549 | 83 | 74 | 44.6 | 55.4 |
| HeLa | 55 | 37 | 50.9 | 49.1 |
| HepG2 | 60 | 49 | 55 | 45 |
| MCF 7 | 44 | 37 | 65.9 | 34.1 |
| 3T3 | 43 | 39 | 51.2 | 48.8 |
| E. coli | 79 | 46 | 57 | 43 |
| S. aureus | 53 | 31 | 56.6 | 43.4 |
| Cell line and organism groups | ||||
| Human cells | 486 | 225 | 49.6 | 50.4 |
| Mammalian cells | 122 | 108 | 41.8 | 58.2 |
| Bacteria | 188 | 61 | 60.6 | 39.4 |
| Complete dataset | 796 | 340 | 51 | 49 |
2.4 Descriptors
 | (1) |
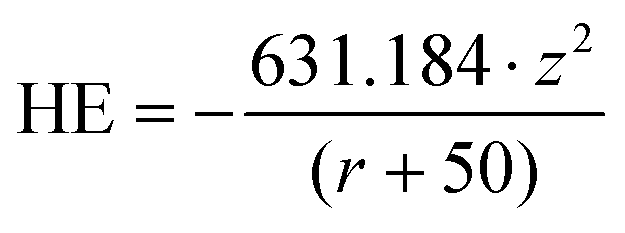
The metal ion (χme) and oxide (χoxide) electronegativity is calculated as in,58,43,31 The band gap (Eg) was computed with an exponential equation as in the works,43,44 using the pre-exponential terms presented in the literature.59 For metal oxide components, the conduction band energy (Ec) was computed as in ork of Burello and Worth,43 with the point of zero zeta potential obtained from a previously reported work.60 For metal components, this descriptor took the value of the Fermi level energy, estimated by the Mulliken electronegativity.61 The redox potential of couples active in biological media43 has been previously reported to be between −4.12 and −4.84 eV (ref. 31, 43, 44, 62 and 63) with an average of −4.48 eV. The absolute difference between Ec and the redox potential in is represented by:
| Dbio = abs(Ec − (−4.48) eV) | (2) |
Finally, a set of 31 elemental descriptors are obtained using the program elemental descriptor 1.0.64
 | (3) |
However, a different approach was employed for the case of MCNMs where components are loaded on the particle surface. In such cases, the composition of the surface is not the same as their bulk composition, as the MCNM consists of a core component and surface components are loaded on the core particle surface. As the interaction between the NPs and the biological media is primarily via their surface, a way to estimate the surface composition of the MCNMs is required. In this work, this is conducted as follows: As a first step, the particle volume is estimated:
 | (4) |
The nominal densities (25 °C) of each component (which can be found in online handbooks and/or databases) and mass/molar fractions are then used to estimate the total mass and molecular amount (qi, in moles) for each of the particle components in a single particle. The surface components are all assumed to be situated on the particle surface (qs,i = qi). The amount of the core component on the particle surface (qs,core) is computed based on the core component's unit cell:
 | (5) |
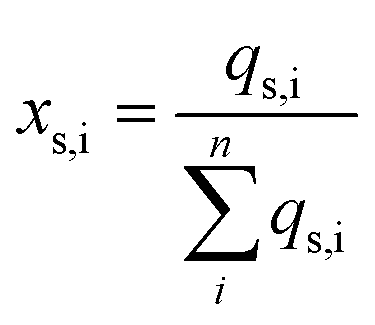 | (6) |
Using the above approach, an estimation of the surface composition of MCNMs with components loaded on the core component surface is obtained. This composition is then used in eqn (3) to obtain the MCNM descriptors. Although this surface composition-oriented estimation is a rough approximation, it is more adequate to represent the composition of the surface of such MCNMs, which is the area of interaction of the MCNM with the biological media.
2.5 Model implementation, training and validation
As previously stated in section 2.3, seven datasets were created regarding toxicity measurements of MCNMs towards individual cell lines and organisms, while three different datasets were created for measurements towards cells and organisms of the same group, namely human cells, mammalian cells and bacteria. Finally, the whole set of measurements was also incorporated in the total dataset. The modelling and validation schemes for the above-mentioned datasets are presented below.For less populated datasets (n < 100), a five-fold cross validation was used. For populated datasets (n ≥ 100), a hold-out validation is used with 80% of the data as a training set and 20% as a validation set. In the hold-out validation scheme, five-fold cross validation was used to train the model on the training set and the developed model was then used to predict the toxic class for the validation set. The random data splitting and the model training were realized in MATLAB®, using the classification learner toolkit, by implementing Support Vector Machines (SVM), k-Nearest-Neighbors (kNN) and Random Forests (RF). The optimal models were selected for each dataare identified with the use of different statistical metrics based on the resulting confusion matrix. The metrics used are presented below:
Accuracy (ACC):
 | (7) |
Precision (Prec):
 | (8) |
Sensitivity, or recall (Sens):
 | (9) |
Specificity, or selectivity (Sel):
 | (10) |
In eqn (3)–(6), P and N are the total number of toxic and non-toxic predictions, respectively. TP and TN are the number of correctly classified toxic and non-toxic measurements, respectively. FP and FN are the number of falsely predicted toxic and non-toxic measurements, respectively. The area under curve (AUC) of the receiver operating characteristic (ROC) curve was also employed as a metric. The models were deemed acceptable when the accuracy exceeds 80%.
2.6 Applicability domain
OECD standards state that the applicability domain of a developed SAR model should be clearly reported,41 to determine the descriptor space within which the developed model is applicable. The methods used for the applicability domain definition are the bounding box PCA, convex hull and Euclidean distance from centroid methods.73,74 The Applicability Domain toolbox developed for MATLAB by the Milano Chemometrics and QSAR Research Group73,74 was used for the analysis.3. Results and discussion
3.1 Descriptor selection
The first step of the present framework is the descriptor selection step. The Pearson coefficient was used for the intercorrelation analysis between the different descriptors The resulting Pearson intercorrelation coefficient is presented in Fig. 1. The threshold value was set to 0.95.75 Subsequently, descriptors were analyzed to see if their values are continuous over the dataset. Non-continuous descriptors (showing no value for several observations in the dataset) were removed. Finally, descriptors with similar physical meaning are omitted. The above analysis resulted in the removal of 35 descriptors in total.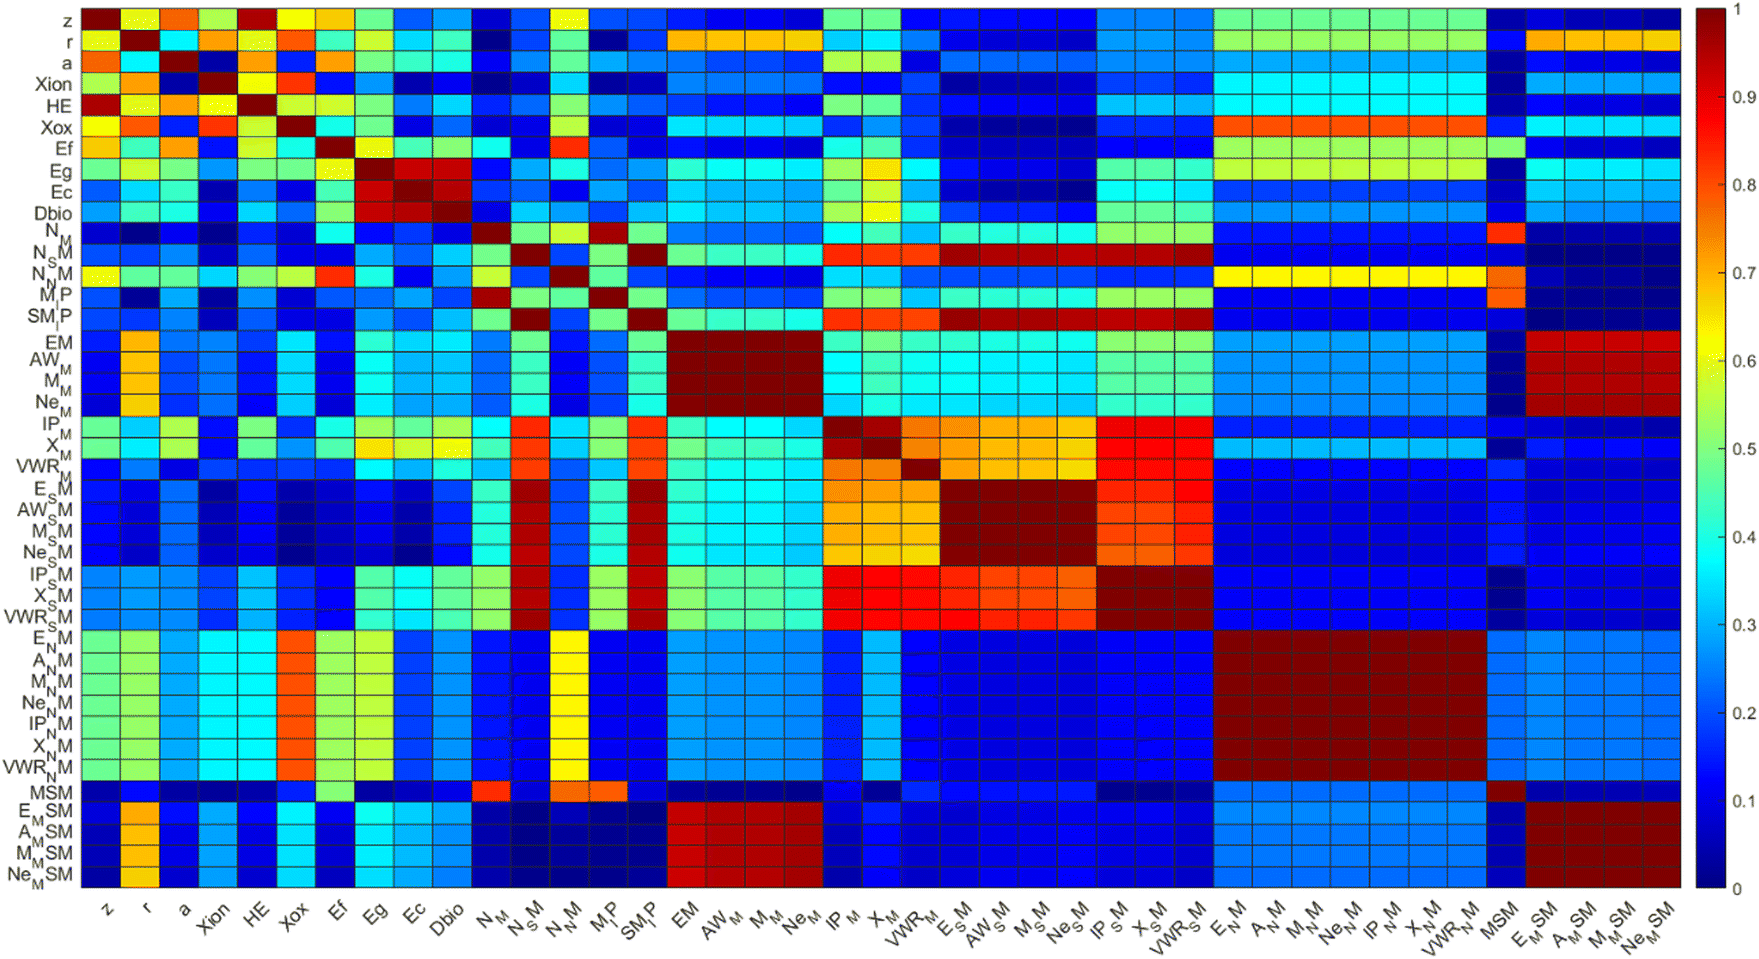 | ||
| Fig. 1 Pearson correlation coefficient for the initial descriptor set. | ||
The remaining descriptors from the previous step were ranked using the feature descriptor methods described in section 2.4.3 and the four most relevant descriptors are kept. The resulting weights and scores of the four most relevant descriptors, following the above analysis, are shown in Fig. 2.
 | ||
| Fig. 2 Results for the four most relevant descriptors, as derived from (a) chi-square and (b) ReliefF methods. | ||
Results of Fig. 2 show that the HE, the sum of the ionization potential of the metals in the MCNM (MSIP), the van der Waals radius of the metal in the MCNM (VWR_M) and Dbio are the most relevant descriptors derived using the chi-square method. On the other hand, Dbio, HE, VWR_M and the electronegativity of the metal ion (Xion) are the most relevant descriptors derived using the ReliefF method. These results show that three of the descriptors, namely HE, Dbio and VWR_M are deemed as relevant by both methods. Hence, these descriptors are kept for the SAR model building.
3.2 Individual cell lines and bacteria
Based on the results of the feature selection step, several models are built using different combinations of the three descriptors identified as more relevant (HE, Dbio, VWR_M). The results for the descriptor combinations, for the representative case of the most populous dataset of individual cell lines (A549 cells), is presented in Table 3.| Dbio | HE | VWR_M | Accuracy (%) |
|---|---|---|---|
| Single descriptor models | |||
| ✓ | ✗ | ✗ | 63.9 |
| ✗ | ✓ | ✗ | 74.7 |
| ✗ | ✗ | ✓ | 72.3 |
| Two descriptor models | |||
| ✓ | ✓ | ✗ | 81.9 |
| ✓ | ✗ | ✓ | 74.7 |
| ✗ | ✓ | ✓ | 77.1 |
| Three descriptor models | |||
| ✓ | ✓ | ✓ | 81.9 |
Table 3 shows that none of the models trained using a single descriptor shows accuracy values over 80%. This shows that no descriptor is predictive enough towards the toxic class of the different measurements in the MCNM dataset. However, the accuracy is increased when a second descriptor is included. In particular, the model built using the descriptor set of Dbio and HE produced the highest accuracy of 81.9%. The addition of VWR_M in the descriptor set did not increase the accuracy of the model, showing the lesser effect of this descriptor (Table 3). Following the above analysis of the model results, the descriptor set of Dbio and HE is kept as the optimal descriptor set.
The above procedure is repeated for the rest of the individual cell and bacteria datasets, and the optimal classification models are built for each set of data. The resulting classification models for the individual cell lines and bacteria are presented in Table 4, along with their respective statistical metrics.
| Cell line/bacteria | Model | Descriptors | Validation scheme | Acc (%) | Prec (%) | Sens (%) | Sel (%) |
|---|---|---|---|---|---|---|---|
| A549 | SVM | HE, Dbio | 5-fold cross validation | 81.9 | 75 | 89.2 | 76.1 |
| HeLa | kNN | HE, Dbio | 5-fold cross validation | 96.4 | 100 | 92.9 | 100 |
| HepG2 | SVM | HE, Dbio | 5-fold cross validation | 96.7 | 97 | 97 | 96.3 |
| MCF 7 | SVM | HE, Dbio | 5-fold cross validation | 84.1 | 89.3 | 86.2 | 80 |
| 3T3 | SVM | HE, Dbio | 5-fold cross validation | 97.7 | 95.7 | 100 | 95.2 |
| E. coli | SVM | HE, Dbio | 5-fold cross validation | 94.9 | 97.7 | 93.3 | 97.1 |
| S. aureus | kNN | HE, Dbio | 5-fold cross validation | 96.2 | 93.8 | 100 | 91.3 |
As shown in Table 4, the optimal combination of descriptors was found to be HE and Dbio, for all the individual cell and bacteria models. Although the measurements in the data are heterogeneous, in terms of the experimental conditions used for the toxicity measurements, the developed models were able to predict the toxic class of the MCNMs using the same descriptor set. Furthermore, the developed models exhibited high accuracy (>94%) using 5-fold cross validation, for all datasets except from the MCF-7 cell line (84.1%) and the A549 cell line (81.9%). The low accuracy towards the MCF-7 dataset could in part be assigned to its smaller size and more unbalanced nature between toxic and non-toxic measurements. The lowest accuracy is obtained for the A549 dataset. In this model dataset, the vast majority of the misclassifications refer to a specific experimental study. Nevertheless, the 81.9% accuracy is considered as acceptable. The models also exhibit values above 80% for sensitivity, selectivity and precision for all datasets, except from the A549 dataset, where the precision (75%) and selectivity (76.1%) are below the threshold.
The above classification approach shows that the MCNM toxicity towards the different cell lines and bacteria can be predicted with acceptable accuracy, using the same two descriptors (HE and Dbio). The fact that the same descriptors were used can hint towards similar underlying toxicity mechanisms for the different MCNMs, towards a variety of cell lines or organism. Furthermore, the abovementioned results show that the additive mixture approach, suggested by Mikolajczyk et al.,47 complemented by the approach used for the calculation of descriptors for surface-loaded MCNMs, is able to compute descriptors that can predict the toxic class of MCNMs towards a variety of cell lines and bacteria. This can also provide information on the interaction between the various components and biological media. The above-mentioned findings will be discussed in the following section of the present work.
3.3 Cell and organism groups
Since the same descriptor combination was found to be the optimal for the different individual cell and bacteria models, the focus is shifted towards the development of models for cells that belong to the same group. SAR models are developed for the Human cells, Mammalian cell, and bacteria datasets. Furthermore, a model is built for the total dataset, to examine whether the combination of the two descriptors (HE, Dbio) is predictive towards the whole set of heterogeneous data. The classification model results are shown in Table 5.| Cell/organism group | Model | Descriptors | Validation scheme | ACC (%) | Prec (%) | Sens (%) | Sel (%) |
|---|---|---|---|---|---|---|---|
| Human cells | SVM | HE, Dbio | Train. (n = 389) | 93.8 | 90.7 | 98 | 89.4 |
| Val. (n = 91) | |||||||
| Mammalian cells | SVM | HE, Dbio | Train. (n = 98) | 91.6 | 87.5 | 87.5 | 93.8 |
| Val. (n = 24) | |||||||
| Bacteria | SVM | HE, Dbio | Training (n = 151) | 97.3 | 100 | 95.6 | 100 |
| Validation (n = 37) | |||||||
| Total dataset | SVM | HE, Dbio | Train. (n = 637) | 91.2 | 89.4 | 93.8 | 88.5 |
| Val. (n = 159) |
As for the case of individual cell lines and bacteria, the model predictions show a very good accuracy towards the validation sets, while the different statistical metrics, such as precision, sensitivity and selectivity, show acceptable values for all the cell and organism data groups. This shows that despite the heterogeneous nature of the data used for the model building, the same combination of MCNM descriptors can accurately predict the toxic class of the respective measurements, using the same descriptors. These results, together with a mechanistic analysis of the descriptors and their effect on toxicity (discussed in a subsequent section) can assist towards a more global understanding of the toxicity mechanisms of MCNMs. As the dataset consists of a large number of MCNMs, with various measurements towards different cells and bacteria, the results of the SAR models encourage the notion that the dominant underlying toxicity mechanisms for metal and metal oxide MCNMs are similar, even towards different cell morphologies. Furthermore, the additive mixture approach for MCNM descriptors can predict the toxic class of MCNMs towards a wide range of cell lines and organisms, as for previous works using such approaches to describe MCNM properties.47–49
3.4 Model extrapolation
Following the above analysis, as the same set of descriptors was found to be optimal for the model development with different datasets (Tables 4 and 5), we aimed at investigating whether the models built for a specific dataset could be extrapolated to predict the toxic class of the measurements in the rest of the data. This is done by using the A459 cell line model to predict the toxic class of the measurements in the rest of the datasets, as well as the total dataset. This could further support the idea that metal/metal oxide MCNM toxicity is dominated by similar mechanisms, towards different cell morphologies. The A549 model is chosen as it is the most populous individual cell dataset, in terms of number of measurements and different MCNMs (Table 2). The predictions of the A549 cell model towards the different datasets are presented in Table 6.| Dataset | Model | ACC (%) | Prec (%) | Sens (%) | Sel (%) |
|---|---|---|---|---|---|
| Individual cells/organisms | |||||
| HeLa | A549 | 90.9 | 87.1 | 96.4 | 85.2 |
| HepG2 | A549 | 96.7 | 100 | 93.9 | 100 |
| MCF 7 | A549 | 84.1 | 95.8 | 79.3 | 93.3 |
| 3T3 | A549 | 95.3 | 95.5 | 95.5 | 95.2 |
| E. coli | A549 | 79.7 | 100 | 64.4 | 100 |
| S. aureus | A549 | 84.9 | 100 | 73.3 | 100 |
| Cell/organism groups | |||||
| Human cells | A549 | 92 | 91.7 | 92.1 | 91.8 |
| Mammalian cells | A549 | 91 | 87 | 92.2 | 90.1 |
| Bacteria | A549 | 87.2 | 100 | 78.9 | 100 |
| Total dataset | A549 | 90.6 | 93 | 88.2 | 93.1 |
Table 6 shows that the A549 cell model can accurately predict the toxic class of the measurements in the rest of the individual cell line datasets, the human and mammalian cell and bacteria datasets, as well as the total dataset. This shows not only that the toxic class can be predicted using the same set of descriptors, but also that these descriptor values can be used to predict the toxicity towards a very heterogeneous dataset. Furthermore, the approach used for the calculation of descriptors for MCNMs, based on the descriptors of individual components, can produce predictive descriptors for the large and heterogeneous data of toxicity measurements.
3.5 Applicability domain
The identification of the descriptor space over which the developed models are applicable is conducted by determining the applicability domain. The number of MCNM toxicity measurements in the dataset that were deemed to be outside the applicability domain of the respective model (defined over its training set), using the different methods for the applicability domain definition, are shown in Table 7.| Dataset | Bounding box PCA | Convex hull | Centroid distance |
|---|---|---|---|
| A549 | — | — | 1 |
| HeLa | — | — | 1 |
| HepG2 | — | — | 2 |
| MCF 7 | — | — | 1 |
| 3T3 | — | — | — |
| E. coli | — | — | — |
| S. aureus | — | — | 3 |
| Human cells | — | 10 | 20 |
| Mammalian cells | 3 | 13 | 5 |
| Bacteria | — | 3 | 12 |
| Complete dataset | 2 | 19 | 33 |
The bounding box PCA and convex hull methods included all the MCNMs in the applicability domain of each model, as seen in Table 7, for the individual datasets. However, the centroid distance showed that some of the MCNMs were outside of the applicability domain. For the cell and organism group models, as well as the complete dataset model, some MCNMs were found to be outside the applicability domain, by all three methods, with the centroid distance method showing a narrower applicability domain. These results show that the method used for the definition of the applicability domain is crucial. The dependency of the applicability domain to the different methods has been discussed in scientific literature.74 From the applicability domain analysis, it is seen that MCNMs with more negative HE values, as well as MCNMs with higher Dbio values, are found to be deemed as outside the applicability domain of the models. Such applicability domains have been presented in works that used classification SARs built using similar descriptor combinations.45,46 This should be taken into account when the model results are discussed.
3.6 Overall toxicity evaluation
Based on the results of the different models, the model developed for the whole dataset was employed to assess the toxicity classification of the 340 different MCNMs over the space defined by the descriptors used (HE, Dbio). The results are presented in Fig. 3a. For comparison, the percentage of toxic measurements for each MCNM is also presented over the descriptor space, in Fig. 3b, for comparison. | ||
| Fig. 3 (a) Toxicity classification of the different MCNMs over the descriptor space by the model, (b) percentage of toxic measurements for each of the MCNMs in the complete dataset. | ||
Fig. 3a shows that the toxic classification of the MCNMs is separated descriptor space. It is shown that toxic MCNMs have a lower absolute Dbio and HE value. These results show that MCNMs with a conduction band energy (Ec) close to the redox potential of biological pairs as well as a less exothermic metal cation hydration, are more probable to be toxic. A less negative hydration enthalpy and a smaller Dbio value result in a higher toxicity probability of the NPs. Such results have previously been presented for the case of pure metal oxide NPs in literature scientific works.44–46 In the same direction with those works, the results of Fig. 3 hint towards the same underlying mechanisms of toxicity for the case of MCNMs, with the additive mixture approach and the correction for surface loaded MCNMs being able to predict the toxic class of MCNMs. Fig. 3b shows that the percentage of toxic measurements follows the above-mentioned behavior over the descriptor space. Although some of the MCNMs are misclassified by the classification model, most of these misclassifications are situated close to the plane in the descriptor space that separates the two toxicity classes. This shows that the two applied descriptors are able to quantify the key characteristics of the MCNMs that induce toxicity. Although the exact descriptor values that separate the two classes may not be identified in detail, the key MCNM characteristics which lead to the MCNMs to induce toxicity, namely a lower Dbio value and a less negative HE, can be identified. Within the context of the present classification model, which is not targeting to predict a quantitative toxicity endpoint, but to reveal the key characteristics resulting in a large number of different MCNMs toxic action, towards different cell lines and bacteria, the results of Fig. 3a are in very good agreement with the experimental measurements of Fig. 3b. The fact that the model classification results reproduce the experimental findings over the heterogeneous nature of the dataset shows that these MCNM properties play a crucial role over the MCNM toxicity towards a wide range of cells and bacteria, unravelling general trends for MCNM toxicity. This allows a more global analysis of the MCNMs toxicity pathways, as discussed in the next section.
In Fig. 3, the majority of data consist of MCNMs that exhibit a metal ion HE > −100 eV. In the same way, most of the MCNMs have a Dbio < 1.5 eV. This explains the results of the previous section, where the MCNMs that were deemed to be outside the applicability domain of the models exhibited higher Dbio and more negative HE values.
Based on the above results, the analysis proceeds with the interpretation of the results and the discussion of the toxicity mechanism of metal and metal oxide MCNMs.
3.7 Toxicity mechanisms of metal and metal oxide MCNMs
The results presented in the previous sections allow to proceed with a mechanistic interpretation of the MCNM toxicity. The additive mixture approach suggested by Mikolajczyk et al.,47 along with the approach suggested in the present paper for the descriptors of surface loaded MCNMs, provided descriptors that could predict the toxic class of the different MCNMs with good accuracy. All of the developed models used the same descriptor set, showing that the primary toxicity mechanisms were similar towards the wide range of cell morphologies under study.The descriptor Dbio reflects the energy difference between the conduction band and the mean standard redox potential of biological pairs. MCNMs that were classified as toxic exhibited lower values of Dbio, which express possible electron transfer between the MCNM and the biological pairs, unbalancing the reducing capacity of a cell and increasing its oxidative stress.43
Such mechanisms of actions have been identified for metal oxide NPs.42,43 The generation of various reactive oxygen species (ROS), such as OH radicals anf hydrogen peroxides,31,76–82 has been investigated towards E. coli and correlated with the conduction band energy of NPs.83 The effect on the reduction capabilities of antioxidants in the cells upon exposure to metal oxide and biological redox pairs may also lead to increased oxidative stress.43 The descriptor Dbio expresses the above mechanisms. Similar descriptors have been adopted to explain the toxicity of metal oxides towards various cells31,34,45 and bacteria,44 reproducing experimental results. A similar descriptor has also been used for the grouping of metal oxides based on their redox activity.24 Finally, in a previous work, we showed that Dbio was used as a descriptor to predict the toxic class of metal and metal oxide NPs towards human and mammalian cell lines, fish, bacteria, crustaceans, plants and eukaryotes,46 with good accuracy, providing a more global understanding of metal and metal oxide toxicity mechanisms.
HE was also predictive as a descriptor for the MCNM toxicity towards the different cells and bacteria of the dataset. This descriptor quantifies the affinity of water to the metal ions that are released from the MCNM,44 with a more negative value suggesting enhanced affinity. HE also reflects the residence time of water molecules near a cation, indirectly expressing the permeability of a cation. A metal ion with a more negative HE value will attract more water molecules, which increase its hydration shell, hindering its transport through cell membranes.84–88
Latimer's equation (eq. (1)), which is used to compute HE, uses the product of the oxidation number or cation charge (z) and ionic potential (z/r). The oxidation number has been correlated with metal oxide solubility and the release of metal ions,24,32,89 leading to higher toxicity.56 The ionic potential expresses the charge potential or electronegativity of the metal cation,24,32 also correlated with toxicity.90 The ionic potential has also been used as a metric for the surface charge of metal oxide NPs.24 The factor of z2/r, which is the product of the two aforementioned quantities, has been previously used by Liu et al., in order to classify metal oxide NPs,45 while HE has also been deemed predictive for the toxicity of metal oxides.44,46 To summarize, HE includes the contribution of the three mechanisms: the release of metal ions, their electronegativity and surface charge, and their interaction with aqueous media.
The release of metal ions has been identified as an important toxicity mechanisms for metal oxides,76 by inducing oxidative stress91–95 and enzyme inactivation.91,94 Metal ions have been found to replace elements in proteins and enzymes.91,92 They can also cause damage to cell membranes,31,96 or even DNA.91,97,98 Although the solubility of NPs is a major factor for the release of ions,24 it cannot explain the toxicity of every metal oxide, as shown for the case of MgO.29,55,99
The results presented in this work are unable to indicate which of the abovementioned mechanism is dominant for MCNM toxicity. The MCNMs that are classified as toxic from the developed models are characterized by both a lower Dbio value and a less negative HE of the corresponding metal cations. As seen from the results of Table 3, the incorporation of only a single descriptor could not provide predictive models for the toxicity of the different MCNMs. In contrast, it is the combination of the two mechanisms that defines the toxic class of the different MCNMs: electron exchange and release of ions that permeate the cell before hydration occurs are both crucial toxicity pathways.
The developed models were trained using heterogeneous datasets consisting of toxicity measurements of MCNMs towards different cell lines and bacteria. Although the cell morphology has an influence on the toxicity of the MCNMs, the models developed for all the individual and cell group datasets have shown the same optimal descriptor combination of HE and Dbio. Furthermore, the model built for a specific cell line (A549) was able to predict the toxic class of the measurements in the bacteria datasets with good accuracy, using the same descriptors. This could hint that that even though the cell morphology is different, the principal mechanisms of toxicity of MCNMs could be similar. The different cell morphology could affect the mechanisms in a quantitative way (leading to higher or lower uptake rates, electron transfer rates, or metal ion release rates) but not in a way that affects the toxicity classification qualitatively. As the present model is qualitative, the quantitative differences in the value of the toxicity endpoints cannot be obtained by the model, unless they change the toxic class of the MCNM. Such similar mechanisms of toxicity towards different cells and bacteria have been previously reported for the case of metal oxides,31,44 where nanoparticles with conduction bands close to the redox potential of biological pairs were found to induce toxicity towards BEAS-2B and RAW264.7 cells,31 as well as E. coli.44 This has led the development of classification models for metal oxide NP toxicity using heterogeneous toxicity data in terms of cell morphology,36–40,46 which produced sets of descriptors that are predictive for the toxicity of metal oxide NPs towards a wide range of cells and organisms.
The descriptors used to predict the MCNM toxic class were computed using the additive mixture approach.47 Although some works have tested the use of descriptors computed using an independent action approach for the case of nanomaterial or chemical mixtures,100,101 the additive mixture approach has been the main approach used to build predictive models for nanomaterial mixtures,66,67,102 as well as for the case of MCNMs.47–50,52 Nevertheless, the list of MCNMs has been more limited. The results of the present manuscript show that the additive mixture approach can accurately predict the toxic class of a large number of different MCNMs, towards a wide range of cells and bacteria. Furthermore, the approach presented for the calculation of descriptors for surface loaded MCNMs produced descriptors that were predictive over the whole range of large dataset. These results can hence provide valuable information regarding the nature of the interaction between the individual components of the MCNMs and different cells and bacteria. However, as the model outcome is a qualitative classification rather than a quantitative prediction of a toxicity endpoint, it is difficult to assess the quantitative impact of each component in certainty. In previous works, a similar approach has produced predictive quantitative models, even for a more limited number of MCNMs.48,49 These works showed that the toxic action of the MCNMs could be predicted by the ratio of its respective components, showing an additive effect of each component to the MCNM toxicity. Although in the present work this cannot be directly implied by the classification model results, the good accuracy over a very populated toxicity dataset, for a large number of MCNMs could hint that this additive effect could be more global. Nevertheless, this would be the subject of a future work, performed by testing quantitative models for more restricted datasets under the same experimental conditions, in order to draw conclusions regarding the quantitative effect of each component on the MCNM toxicity.
The heterogenous datasets used to build the classification models presented in this work can unravel the key characteristics of the MCNM toxicity pathways and mode of action. In this work, however, the size and shape of the MCNMs was not used as a descriptor in the final model, as in the case of other predictive models have been built for ENMs.24,28,31,34,44,103 The non-inclusion of size as a descriptor in the classification model may show that size may not have a qualitative effect on which mechanism occurs. However, since the size and shape of the MCNMs defines their surface, it could affect the different mechanisms quantitatively, by affecting their kinetics.24 The quantitative prediction of toxicity endpoints is not in the scope of the present manuscript, and will be the subject of future work.
In the same way, the surface charge of MCNMs has not been directly used as a predictive descriptor in the final models. The surface charge of metal or metal oxide particles has been previously found to be an important characteristic for the toxicity of such NPs, and is often expressed in QSAR studies by a measured zeta potential for each NP.26,32,33 NPs interact differently with cells depending on their surface charge, with positively charged particles showing higher cellular uptake than neutral or negatively charged NPs.24,104 The contribution of surface charge has previously been assigned to its acidity, which can be expressed by the ionic potential (z/r).24,89 Although in the present model the surface charge or ionic potential is not used as a descriptor per se, the term z/r is included in Latimer's equation (eq. (1)), for the calculation of HE. Hence, HE is a complex descriptor that incorporates some contribution from the surface charge. The non-inclusion of surface charge per se in the present models does not mean that it does not affect the MCNM toxicity, but rather that it has a combined effect with other key characteristics of MCNMs. Besides the surface charge, which affects the cellular uptake of the MCNM, the release of metal ions, their electronegativity, and their interaction with aqueous media are expressed by HE, while the electron transfer between the cells and the MCNM is expressed by the Dbio descriptor. The combination of these descriptors, that express different mechanisms, yields the classification of the MCNMs as toxic or non-toxic.
The accuracy of the classification models developed towards such heterogeneous datasets, illustrates the potential of classification SAR models to provide a more global understanding of the toxicity pathways for the case of MCNMs. Beside such models being used as predictive tools, focus can also be shifted towards the extraction of mechanistic information, by employing larger datasets of toxicity measurements for the nanomaterials under study. Such mechanistic insight could help assist the safe-by-design synthesis and production of functional MCNMs. For example, Feng et al., designed MCNMs with control over their toxicity by altering their energy bands, based on a mechanistic approach to ENM toxicity similar to the results of the present study.105 The results presented in this work can serve as a basis towards such a knowledge-based development of MCNMs.
4. Conclusions
In this work, an extensive dataset consisting of 796 individual toxicity measurements is used to build classification SAR models for MCNMs. The novelty of the approach lies in the multicomponent nature of the nanomaterials, as well as the size, diversity and heterogeneous nature of the dataset used. The developed classification models showed good results towards individual cells and bacteria, as well as cell groups and the total set of data, using the same descriptor set. Furthermore, the approach used for the descriptor calculation was able to provide predictive descriptors, shedding light on the interaction between the different components of MCNMs. The approach used to calculate descriptors for surface loaded MCNMs, and the mechanistic insight provided by the model results can assist the understanding of MCNM toxicity in a more global way.The two descriptors that were used for the predictive model expressed the electron transfer between the MCNM and the biological pairs, leading to the increased oxidative stress of cells, and the release and transport of metal ions from the MCNMs. The good accuracy towards the heterogeneous measurements of the dataset showed that the abovementioned mechanisms could explain the toxicity of MCNMs towards a wide range of cells and bacteria. This analysis showed that these toxicity mechanisms are crucial for the case of metal oxide MCNMs, leading to a more global understanding of MCNM mode of action. The understanding of the effect of the multiple components of MCNMs on different cells and bacteria can assist in the synthesis of MCNMs for targeted biological applications. Finally, such approaches lead to a more knowledge-driven hazard assessment of nanomaterials, assisting the synthesis of safe-by-design MCNMs for various applications.
Conflicts of interest
There are no conflicts to declare.Acknowledgements
This work was funded by the EU H2020 Project ‘Safe and sUstainable by desigN Strategies for HIgh performance multi-component NanomatErials’ “SUNSHINE” (grant number 952924). The publication of the article in OA mode is financially supported by HEAL-Link.References
- A. Haase, F. Klaessig, P. Nymark, K. Paul and D. Greco, EU US Roadmap Nanoinformatics 2030, 2018 Search PubMed.
- G. P. Gakis, H. Vergnes, F. Cristiano, Y. Tison, C. Vahlas, B. Caussat, A. G. Boudouvis and E. Scheid, In situ N2-NH3 plasma pre-treatment of silicon substrate enhances the initial growth and restricts the substrate oxidation during alumina ALD, J. Appl. Phys., 2019, 126, 125305 CrossRef.
- G. P. Gakis, C. Vahlas, H. Vergnes, S. Dourdain, Y. Tison, H. Martinez, J. Bour, D. Ruch, A. G. Boudouvis, B. Caussat and E. Scheid, Investigation of the initial deposition steps and the interfacial layer of Atomic Layer Deposited (ALD) Al2O3 on Si, Appl. Surf. Sci., 2019, 492, 245–254 CrossRef CAS.
- G. P. Gakis, H. Vergnes, E. Scheid, C. Vahlas, A. G. Boudouvis and B. Caussat, Detailed investigation of the surface mechanisms and their interplay with transport phenomena in alumina atomic layer deposition from TMA and water, Chem. Eng. Sci., 2019, 195, 399–412 CrossRef CAS.
- R. Sharma, Newer Methods of Nanoparticle Synthesis: Nitroimidazole properties with Nanometal oxides in Polymer Cages as Drug-Biomarker Monitors, Nat. Preced., 2009 DOI:10.1038/npre.2009.3952.1.
- G. P. Gakis, S. Termine, A.-F. A. Trompeta, I. G. Aviziotis and C. A. Charitidis, Unraveling the mechanisms of carbon nanotube growth by chemical vapor deposition, Chem. Eng. J., 2022, 445, 136807 CrossRef CAS.
- G. P. Gakis, E. N. Skountzos, I. G. Aviziotis and C. A. Charitidis, Multi-parametric analysis of the CVD of CNTs: Effect of reaction temperature, pressure and acetylene flow rate, Chem. Eng. Sci., 2023, 267, 118374 CrossRef CAS.
- C.-Z. Ning, L. Dou and P. Yang, Bandgap engineering in semiconductor alloy nanomaterials with widely tunable compositions, Nat. Rev. Mater., 2017, 2, 17070 CrossRef CAS.
- X. Hu, Y. Zhang, T. Ding, J. Liu and H. Zhao, Multifunctional Gold Nanoparticles: A Novel Nanomaterial for Various Medical Applications and Biological Activities, Front. Bioeng. Biotechnol., 2020, 8, 990 CrossRef PubMed.
- F. Christian, Edith, Selly, D. Adityawarman and A. Indarto, Application of nanotechnologies in the energy sector: A brief and short review, Front. Energy, 2013, 7, 6–18 CrossRef.
- S. Mitchell, R. Qin, N. Zheng and J. Pérez-Ramírez, Nanoscale engineering of catalytic materials for sustainable technologies, Nat. Nanotechnol., 2021, 16, 129–139 CrossRef CAS PubMed.
- M. A. Hamzawy, A. M. Abo-youssef, H. F. Salem and S. A. Mohammed, Antitumor activity of intratracheal inhalation of temozolomide (TMZ) loaded into gold nanoparticles and/or liposomes against urethane-induced lung cancer in BALB/c mice, Drug Delivery, 2017, 24, 599–607 CrossRef CAS PubMed.
- A. K. Verma and S. Perlman, Lipid nanoparticle-mRNA: another step in the fight against COVID-19, Cell Res., 2022, 32, 421–422 CrossRef CAS PubMed.
- M. J. Bessa, F. Brandão, M. Viana, J. F. Gomes, E. Monfort, F. R. Cassee, S. Fraga and J. P. Teixeira, Nanoparticle exposure and hazard in the ceramic industry: an overview of potential sources, toxicity and health effects, Environ. Res., 2020, 184, 109297 CrossRef CAS PubMed.
- M. Manigrasso, C. Protano, M. L. Astolfi, L. Massimi, P. Avino, M. Vitali and S. Canepari, Evidences of copper nanoparticle exposure in indoor environments: Long-term assessment, high-resolution field emission scanning electron microscopy evaluation, in silico respiratory dosimetry study and possible health implications, Sci. Total Environ., 2019, 653, 1192–1203 CrossRef CAS PubMed.
- S. Sonwani, S. Madaan, J. Arora, S. Suryanarayan, D. Rangra, N. Mongia, T. Vats and P. Saxena, Inhalation Exposure to Atmospheric Nanoparticles and Its Associated Impacts on Human Health: A Review, Front. Sustain. Cities, 2021, 3, 690444 CrossRef.
- Y. Nazarenko, T. W. Han, P. J. Lioy and G. Mainelis, Potential for exposure to engineered nanoparticles from nanotechnology-based consumer spray products, J. Exposure Sci. Environ. Epidemiol., 2011, 21, 515–528 CrossRef CAS PubMed.
- J. Blasco, I. Corsi and V. Matranga, Particles in the oceans: Implication for a safe marine environment, Mar. Environ. Res., 2015, 111, 1–4 CrossRef CAS PubMed.
- V. Kumar, N. Sharma and S. S. Maitra, In vitro and in vivo toxicity assessment of nanoparticles, Int. Nano Lett., 2017, 7, 243–256 CrossRef CAS.
- D. T. Savage, J. Z. Hilt and T. D. Dziubla, in Nanotoxicity: Methods and Protocols, ed. Q. Zhang, Springer New York, New York, NY, 2019, pp. 1–29, DOI:10.1007/978-1-4939-8916-4_1.
- I. Xiarchos, A. K. Morozinis, P. Kavouras and C. A. Charitidis, Nanocharacterization, Materials Modeling, and Research Integrity as Enablers of Sound Risk Assessment: Designing Responsible Nanotechnology, Small, 2020, 16, 2001590 CrossRef CAS PubMed.
- G. P. Gakis, A. Krikas, P. Neofytou, L. Tran and C. Charitidis, Modelling the biodistribution of inhaled gold nanoparticles in rats with interspecies extrapolation to humans, Toxicol. Appl. Pharmacol., 2022, 457, 116322 CrossRef CAS PubMed.
- A. Krikas, P. Neofytou, G. P. Gakis, I. Xiarchos, C. Charitidis and L. Tran, Modeling of clearance, retention, and translocation of inhaled gold nanoparticles in rats, Inhalation Toxicol., 2022, 34, 361–379 CrossRef CAS PubMed.
- F. C. Simeone and A. L. Costa, Assessment of cytotoxicity of metal oxide nanoparticles on the basis of fundamental physical–chemical parameters: a robust approach to grouping, Environ. Sci.: Nano, 2019, 6, 3102–3112 RSC.
- M. Kotzabasaki, I. Sotiropoulos, C. Charitidis and H. Sarimveis, Machine learning methods for multi-walled carbon nanotubes (MWCNT) genotoxicity prediction, Nanoscale Adv., 2021, 3, 3167–3176 RSC.
- A. A. Buglak, A. V. Zherdev and B. B. Dzantiev, Nano-(Q)SAR for Cytotoxicity Prediction of Engineered Nanomaterials, Molecules, 2019, 24, 4537 CrossRef CAS PubMed.
- L. Lamon, D. Asturiol, A. Vilchez, R. Ruperez-Illescas, J. Cabellos, A. Richarz and A. Worth, Computational models for the assessment of manufactured nanomaterials: Development of model reporting standards and mapping of the model landscape, Comput. Toxicol., 2019, 9, 143–151 CrossRef CAS PubMed.
- T. Puzyn, B. Rasulev, A. Gajewicz, X. Hu, T. P. Dasari, A. Michalkova, H. M. Hwang, A. Toropov, D. Leszczynska and J. Leszczynski, Using nano-QSAR to predict the cytotoxicity of metal oxide nanoparticles, Nat. Nanotechnol., 2011, 6, 175–178 CrossRef CAS PubMed.
- V. Aruoja, S. Pokhrel, M. Sihtmäe, M. Mortimer, L. Mädler and A. Kahru, Toxicity of 12 metal-based nanoparticles to algae, bacteria and protozoa, Environ. Sci.: Nano, 2015, 2, 630–644 RSC.
- A. Ivask, T. Titma, M. Visnapuu, H. Vija, A. Kakinen, M. Sihtmae, S. Pokhrel, L. Madler, M. Heinlaan, V. Kisand, R. Shimmo and A. Kahru, Toxicity of 11 Metal Oxide Nanoparticles to Three Mammalian Cell Types In Vitro, Curr. Top. Med. Chem., 2015, 15, 1914–1929 CrossRef CAS PubMed.
- H. Zhang, Z. Ji, T. Xia, H. Meng, C. Low-Kam, R. Liu, S. Pokhrel, S. Lin, X. Wang, Y.-P. Liao, M. Wang, L. Li, R. Rallo, R. Damoiseaux, D. Telesca, L. Mädler, Y. Cohen, J. I. Zink and A. E. Nel, Use of Metal Oxide Nanoparticle Band Gap To Develop a Predictive Paradigm for Oxidative Stress and Acute Pulmonary Inflammation, ACS Nano, 2012, 6, 4349–4368 CrossRef CAS PubMed.
- J. Li, C. Wang, L. Yue, F. Chen, X. Cao and Z. Wang, Nano-QSAR modeling for predicting the cytotoxicity of metallic and metal oxide nanoparticles: A review, Ecotoxicol. Environ. Saf., 2022, 243, 113955 CrossRef CAS PubMed.
- J. Cao, Y. Pan, Y. Jiang, R. Qi, B. Yuan, Z. Jia, J. Jiang and Q. Wang, Computer-aided nanotoxicology: risk assessment of metal oxide nanoparticles via nano-QSAR, Green Chem., 2020, 22, 3512–3521 RSC.
- A. Gajewicz, N. Schaeublin, B. Rasulev, S. Hussain, D. Leszczynska, T. Puzyn and J. Leszczynski, Towards understanding mechanisms governing cytotoxicity of metal oxides nanoparticles: Hints from nano-QSAR studies, Nanotoxicology, 2015, 9, 313–325 CrossRef CAS PubMed.
- S. Kar, K. Pathakoti, P. B. Tchounwou, D. Leszczynska and J. Leszczynski, Evaluating the cytotoxicity of a large pool of metal oxide nanoparticles to Escherichia coli: Mechanistic understanding through In Vitro and In Silico studies, Chemosphere, 2021, 264, 128428 CrossRef CAS PubMed.
- V. V. Kleandrova, F. Luan, H. González-Díaz, J. M. Ruso, A. Melo, A. Speck-Planche and M. N. D. S. Cordeiro, Computational ecotoxicology: Simultaneous prediction of ecotoxic effects of nanoparticles under different experimental conditions, Environ. Int., 2014, 73, 288–294 CrossRef CAS PubMed.
- F. Luan, V. V. Kleandrova, H. González-Díaz, J. M. Ruso, A. Melo, A. Speck-Planche and M. N. D. S. Cordeiro, Computer-aided nanotoxicology: assessing cytotoxicity of nanoparticles under diverse experimental conditions by using a novel QSTR-perturbation approach, Nanoscale, 2014, 6, 10623–10630 RSC.
- V. V. Kleandrova, F. Luan, H. González-Díaz, J. M. Ruso, A. Speck-Planche and M. N. D. S. Cordeiro, Computational Tool for Risk Assessment of Nanomaterials: Novel QSTR-Perturbation Model for Simultaneous Prediction of Ecotoxicity and Cytotoxicity of Uncoated and Coated Nanoparticles under Multiple Experimental Conditions, Environ. Sci. Technol., 2014, 48, 14686–14694 CrossRef CAS PubMed.
- R. Concu, V. V. Kleandrova, A. Speck-Planche and M. N. D. S. Cordeiro, Probing the toxicity of nanoparticles: a unified in silico machine learning model based on perturbation theory, Nanotoxicology, 2017, 11, 891–906 CrossRef CAS PubMed.
- M. K. Ha, T. X. Trinh, J. S. Choi, D. Maulina, H. G. Byun and T. H. Yoon, Toxicity Classification of Oxide Nanomaterials: Effects of Data Gap Filling and PChem Score-based Screening Approaches, Sci. Rep., 2018, 8, 3141 CrossRef PubMed.
- OECD, Guidance Document on the Validation of (Quantitative) Structure-Activity Relationship [(Q)SAR] Models, 2014 Search PubMed.
- E. Burello and A. Worth, in Towards Efficient Designing of Safe Nanomaterials: Innovative Merge of Computational Approaches and Experimental Techniques, The Royal Society of Chemistry, 2012, pp. 257–283, 10.1039/9781849735476-00257.
- E. Burello and A. P. Worth, A theoretical framework for predicting the oxidative stress potential of oxide nanoparticles, Nanotoxicology, 2011, 5, 228–235 CrossRef CAS PubMed.
- C. Kaweeteerawat, A. Ivask, R. Liu, H. Zhang, C. H. Chang, C. Low-Kam, H. Fischer, Z. Ji, S. Pokhrel, Y. Cohen, D. Telesca, J. Zink, L. Madler, P. A. Holden, A. Nel and H. Godwin, Toxicity of metal oxide nanoparticles in Escherichia coli correlates with conduction band and hydration energies, Environ. Sci. Technol., 2015, 49, 1105–1112 CrossRef CAS PubMed.
- R. Liu, H. Y. Zhang, Z. X. Ji, R. Rallo, T. Xia, C. H. Chang, A. Nel and Y. Cohen, Development of structure–activity relationship for metal oxide nanoparticles, Nanoscale, 2013, 5, 5644–5653 RSC.
- G. P. Gakis, I. G. Aviziotis and C. A. Charitidis, Metal and metal oxide nanoparticle toxicity: moving towards a more holistic structure–activity approach, Environ. Sci.: Nano, 2023, 10, 761–780 RSC.
- A. Mikolajczyk, N. Sizochenko, E. Mulkiewicz, A. Malankowska, M. Nischk, P. Jurczak, S. Hirano, G. Nowaczyk, A. Zaleska-Medynska, J. Leszczynski, A. Gajewicz and T. Puzyn, Evaluating the toxicity of TiO2-based nanoparticles to Chinese hamster ovary cells and Escherichia coli: a complementary experimental and computational approach, Beilstein J. Nanotechnol., 2017, 8, 2171–2180 CrossRef CAS PubMed.
- A. Mikolajczyk, A. Gajewicz, E. Mulkiewicz, B. Rasulev, M. Marchelek, M. Diak, S. Hirano, A. Zaleska-Medynska and T. Puzyn, Nano-QSAR modeling for ecosafe design of heterogeneous TiO2-based nano-photocatalysts, Environ. Sci.: Nano, 2018, 5, 1150–1160 RSC.
- A. Mikolajczyk, N. Sizochenko, E. Mulkiewicz, A. Malankowska, B. Rasulev and T. Puzyn, A chemoinformatics approach for the characterization of hybrid nanomaterials: safer and efficient design perspective, Nanoscale, 2019, 11, 11808–11818 RSC.
- F. Stoliński, A. Rybińska-Fryca, M. Gromelski, A. Mikolajczyk and T. Puzyn, NanoMixHamster: a web-based tool for predicting cytotoxicity of TiO2-based multicomponent nanomaterials toward Chinese hamster ovary (CHO-K1) cells, Nanotoxicology, 2022, 16, 276–289 CrossRef PubMed.
- A. Rybińska-Fryca, A. Mikolajczyk and T. Puzyn, Structure–activity prediction networks (SAPNets): a step beyond Nano-QSAR for effective implementation of the safe-by-design concept, Nanoscale, 2020, 12, 20669–20676 RSC.
- T. C. Le, H. Yin, R. Chen, Y. Chen, L. Zhao, P. S. Casey, C. Chen and D. A. Winkler, An Experimental and Computational Approach to the Development of ZnO Nanoparticles that are Safe by Design, Small, 2016, 12, 3568–3577 CrossRef CAS PubMed.
- T. X. Trinh and J. Kim, Status Quo in Data Availability and Predictive Models of Nano-Mixture Toxicity, Nanomaterials, 2021, 11, 124 CrossRef CAS PubMed.
- F. Zhang, Z. Wang, W. J. G. M. Peijnenburg and M. G. Vijver, Review and Prospects on the Ecotoxicity of Mixtures of Nanoparticles and Hybrid Nanomaterials, Environ. Sci. Technol., 2022, 56, 15238–15250 CrossRef CAS PubMed.
- M. Horie, K. Fujita, H. Kato, S. Endoh, K. Nishio, L. K. Komaba, A. Nakamura, A. Miyauchi, S. Kinugasa, Y. Hagihara, E. Niki, Y. Yoshida and H. Iwahashi, Association of the physical and chemical properties and the cytotoxicity of metal oxide nanoparticles: metal ion release, adsorption ability and specific surface area, Metallomics, 2012, 4, 350–360 CrossRef CAS PubMed.
- X. Hu, S. Cook, P. Wang and H.-m. Hwang, In vitro evaluation of cytotoxicity of engineered metal oxide nanoparticles, Sci. Total Environ., 2009, 407, 3070–3072 CrossRef CAS PubMed.
- R. D. Shannon, Revised effective ionic radii and systematic studies of interatomic distances in halides and chalcogenides, Acta Crystallogr., Sect. A: Cryst. Phys., Diffr., Theor. Gen. Crystallogr., 1976, 32, 751–767 CrossRef.
- J. Portier, G. Campet, J. Etourneau and B. Tanguy, A simple model for the estimation of electronegativities of cations in different electronic states and coordinations, J. Alloys Compd., 1994, 209, 285–289 CrossRef CAS.
- J. Portier, H. S. Hilal, I. Saadeddin, S. J. Hwang, M. A. Subramanian and G. Campet, Thermodynamic correlations and band gap calculations in metal oxides, Prog. Solid State Chem., 2004, 32, 207–217 CrossRef CAS.
- M. Kosmulski, Isoelectric points and points of zero charge of metal (hydr)oxides: 50years after Parks’ review, Adv. Colloid Interface Sci., 2016, 238, 1–61 CrossRef CAS PubMed.
- C. Tantardini and A. R. Oganov, Thermochemical electronegativities of the elements, Nat. Commun., 2021, 12, 2087 CrossRef CAS PubMed.
- M. Auffan, J. Rose, M. R. Wiesner and J. Y. Bottero, Chemical stability of metallic nanoparticles: a parameter controlling their potential cellular toxicity in vitro, Environ. Pollut., 2009, 157, 1127–1133 CrossRef CAS PubMed.
- G. S. Plumlee, S. A. Morman and T. L. Ziegler, The Toxicological Geochemistry of Earth Materials: An Overview of Processes and the Interdisciplinary Methods Used to Understand Them, Rev. Mineral. Geochem., 2006, 64, 5–57 CrossRef CAS.
- P. Ambure, R. B. Aher, A. Gajewicz, T. Puzyn and K. Roy, “NanoBRIDGES” software: Open access tools to perform QSAR and nano-QSAR modeling, Chemom. Intell. Lab. Syst., 2015, 147, 1–13 CrossRef CAS.
- T. X. Trinh and J. Kim, Status Quo in Data Availability and Predictive Models of Nano-Mixture Toxicity, Nanomaterials, 2021, 11, 124 CrossRef CAS PubMed.
- B. Yuan, P. Wang, L. Sang, J. Gong, Y. Pan and Y. Hu, QNAR modeling of cytotoxicity of mixing nano-TiO2 and heavy metals, Ecotoxicol. Environ. Saf., 2021, 208, 111634 CrossRef CAS PubMed.
- L. Sang, Y. Wang, C. Zong, P. Wang, H. Zhang, D. Guo, B. Yuan and Y. Pan, Machine Learning for Evaluating the Cytotoxicity of Mixtures of Nano-TiO2 and Heavy Metals: QSAR Model Apply Random Forest Algorithm after Clustering Analysis, Molecules, 2022, 27, 6125 CrossRef CAS PubMed.
- F. Zhang, Z. Wang, W. J. G. M. Peijnenburg and M. G. Vijver, Machine learning-driven QSAR models for predicting the mixture toxicity of nanoparticles, Environ. Int., 2023, 177, 108025 CrossRef CAS PubMed.
- T. X. Trinh, M. Seo, T. H. Yoon and J. Kim, Developing random forest based QSAR models for predicting the mixture toxicity of TiO2 based nano-mixtures to Daphnia magna, NanoImpact, 2022, 25, 100383 CrossRef CAS PubMed.
- I. Guyon and A. Elisseeff, An introduction to variable and feature selection, J. Mach. Learn. Res., 2003, 3, 1157–1182 Search PubMed.
- M. Eklund, U. Norinder, S. Boyer and L. Carlsson, Choosing Feature Selection and Learning Algorithms in QSAR, J. Chem. Inf. Model., 2014, 54, 837–843 CrossRef CAS PubMed.
- Y. Li, Z. Dai, D. Cao, F. Luo, Y. Chen and Z. Yuan, Chi-MIC-share: a new feature selection algorithm for quantitative structure–activity relationship models, RSC Adv., 2020, 10, 19852–19860 RSC.
- F. Sahigara, D. Ballabio, R. Todeschini and V. Consonni, Assessing the Validity of QSARs for Ready Biodegradability of Chemicals: An Applicability Domain Perspective, Curr. Comput.-Aided Drug Des., 2014, 10, 137–147 CrossRef CAS PubMed.
- F. Sahigara, K. Mansouri, D. Ballabio, A. Mauri, V. Consonni and R. Todeschini, Comparison of Different Approaches to Define the Applicability Domain of QSAR Models, Molecules, 2012, 17, 4791–4810 CrossRef CAS PubMed.
- A. Rácz, D. Bajusz and K. Héberger, Intercorrelation Limits in Molecular Descriptor Preselection for QSAR/QSPR, Mol. Inf., 2019, 38, 1800154 CrossRef PubMed.
- A. B. Djurisic, Y. H. Leung, A. M. Ng, X. Y. Xu, P. K. Lee, N. Degger and R. S. Wu, Toxicity of metal oxide nanoparticles: mechanisms, characterization, and avoiding experimental artefacts, Small, 2015, 11, 26–44 CrossRef CAS PubMed.
- M. Premanathan, K. Karthikeyan, K. Jeyasubramanian and G. Manivannan, Selective toxicity of ZnO nanoparticles toward Gram-positive bacteria and cancer cells by apoptosis through lipid peroxidation, Nanomedicine, 2011, 7, 184–192 CrossRef CAS PubMed.
- H. L. Karlsson, P. Cronholm, J. Gustafsson and L. Möller, Copper Oxide Nanoparticles Are Highly Toxic: A Comparison between Metal Oxide Nanoparticles and Carbon Nanotubes, Chem. Res. Toxicol., 2008, 21, 1726–1732 Search PubMed.
- G. Applerot, A. Lipovsky, R. Dror, N. Perkas, Y. Nitzan, R. Lubart and A. Gedanken, Enhanced Antibacterial Activity of Nanocrystalline ZnO Due to Increased ROS-Mediated Cell Injury, Adv. Funct. Mater., 2009, 19, 842–852 CrossRef CAS.
- T. Xia, M. Kovochich, J. Brant, M. Hotze, J. Sempf, T. Oberley, C. Sioutas, J. I. Yeh, M. R. Wiesner and A. E. Nel, Comparison of the Abilities of Ambient and Manufactured Nanoparticles To Induce Cellular Toxicity According to an Oxidative Stress Paradigm, Nano Lett., 2006, 6, 1794–1807 CrossRef CAS PubMed.
- T. C. Long, N. Saleh, R. D. Tilton, G. V. Lowry and B. Veronesi, Titanium Dioxide (P25) Produces Reactive Oxygen Species in Immortalized Brain Microglia (BV2): Implications for Nanoparticle Neurotoxicity, Environ. Sci. Technol., 2006, 40, 4346–4352 CrossRef CAS PubMed.
- A. L. Neal, What can be inferred from bacterium–nanoparticle interactions about the potential consequences of environmental exposure to nanoparticles?, Ecotoxicology, 2008, 17, 362 CrossRef CAS PubMed.
- Y. Li, W. Zhang, J. Niu and Y. Chen, Mechanism of Photogenerated Reactive Oxygen Species and Correlation with the Antibacterial Properties of Engineered Metal-Oxide Nanoparticles, ACS Nano, 2012, 6, 5164–5173 CrossRef CAS PubMed.
- F. Thevenod, Catch me if you can! Novel aspects of cadmium transport in mammalian cells, BioMetals, 2010, 23, 857–875 CrossRef CAS PubMed.
- S. Sugiharto, T. M. Lewis, A. J. Moorhouse, P. R. Schofield and P. H. Barry, Anion-cation permeability correlates with hydrated counterion size in glycine receptor channels, Biophys. J., 2008, 95, 4698–4715 CrossRef CAS PubMed.
- R. Epsztein, E. Shaulsky, M. Qin and M. Elimelech, Activation behavior for ion permeation in ion-exchange membranes: Role of ion dehydration in selective transport, J. Membr. Sci., 2019, 580, 316–326 CrossRef CAS.
- S. Adapa and A. Malani, Role of hydration energy and co-ions association on monovalent and divalent cations adsorption at mica-aqueous interface, Sci. Rep., 2018, 8, 12198 CrossRef PubMed.
- Z. Qu and H. C. Hartzell, Anion permeation in Ca(2+)-activated Cl(-) channels, J. Gen. Physiol., 2000, 116, 825–844 CrossRef CAS PubMed.
- G. E. Brown, V. E. Henrich, W. H. Casey, D. L. Clark, C. Eggleston, A. Felmy, D. W. Goodman, M. Grätzel, G. Maciel, M. I. McCarthy, K. H. Nealson, D. A. Sverjensky, M. F. Toney and J. M. Zachara, Metal Oxide Surfaces and Their Interactions with Aqueous Solutions and Microbial Organisms, Chem. Rev., 1999, 99, 77–174 CrossRef CAS PubMed.
- Y. Mu, F. Wu, Q. Zhao, R. Ji, Y. Qie, Y. Zhou, Y. Hu, C. Pang, D. Hristozov, J. P. Giesy and B. Xing, Predicting toxic potencies of metal oxide nanoparticles by means of nano-QSARs, Nanotoxicology, 2016, 10, 1207–1214 CrossRef CAS PubMed.
- M. Balali-Mood, K. Naseri, Z. Tahergorabi, M. R. Khazdair and M. Sadeghi, Toxic Mechanisms of Five Heavy Metals: Mercury, Lead, Chromium, Cadmium, and Arsenic, Front. Pharmacol., 2021, 12, 643972 CrossRef CAS PubMed.
- M. Jaishankar, T. Tseten, N. Anbalagan, B. B. Mathew and K. N. Beeregowda, Toxicity, mechanism and health effects of some heavy metals, Interdiscip. Toxicol., 2014, 7, 60–72 CrossRef PubMed.
- S. J. Stohs and D. Bagchi, Oxidative mechanisms in the toxicity of metal ions, Free Radicals Biol. Med., 1995, 18, 321–336 CrossRef CAS PubMed.
- A. Manuja, B. Kumar, R. Kumar, D. Chhabra, M. Ghosh, M. Manuja, B. Brar, Y. Pal, B. N. Tripathi and M. Prasad, Metal/metal oxide nanoparticles: Toxicity concerns associated with their physical state and remediation for biomedical applications, Toxicol. Rep., 2021, 8, 1970–1978 CrossRef CAS PubMed.
- A. Abdal Dayem, M. K. Hossain, S. B. Lee, K. Kim, S. K. Saha, G.-M. Yang, H. Y. Choi and S.-G. Cho, The Role of Reactive Oxygen Species (ROS) in the Biological Activities of Metallic Nanoparticles, Int. J. Mol. Sci., 2017, 18, 120 CrossRef PubMed.
- V. Forest, J.-F. Hochepied, L. Leclerc, A. Trouvé, K. Abdelkebir, G. Sarry, V. Augusto and J. Pourchez, Towards an alternative to nano-QSAR for nanoparticle toxicity ranking in case of small datasets, J. Nanopart. Res., 2019, 21, 95 CrossRef.
- R. R. Crichton, in Metal Chelation in Medicine, The Royal Society of Chemistry, 2017, pp. 1–23, 10.1039/9781782623892-00001.
- N. Mei, Y. Zhang, Y. Chen, X. Guo, W. Ding, S. F. Ali, A. S. Biris, P. Rice, M. M. Moore and T. Chen, Silver nanoparticle-induced mutations and oxidative stress in mouse lymphoma cells, Environ. Mol. Mutagen., 2012, 53, 409–419 CrossRef CAS PubMed.
- W.-S. Cho, R. Duffin, F. Thielbeer, M. Bradley, I. L. Megson, W. MacNee, C. A. Poland, C. L. Tran and K. Donaldson, Zeta Potential and Solubility to Toxic Ions as Mechanisms of Lung Inflammation Caused by Metal/Metal Oxide Nanoparticles, Toxicol. Sci., 2012, 126, 469–477 CrossRef CAS PubMed.
- F. Chen, L. Wu, X. Xiao, L. Rong, M. Li and X. Zou, Mixture toxicity of zinc oxide nanoparticle and chemicals with different mode of action upon Vibrio fischeri, Environ. Sci. Eur., 2020, 32, 41 CrossRef CAS.
- D. Wang, S. Wang, L. Bai, M. S. Nasir, S. Li and W. Yan, Mathematical Modeling Approaches for Assessing the Joint Toxicity of Chemical Mixtures Based on Luminescent Bacteria: A Systematic Review, Front. Microbiol., 2020, 11, 1651 CrossRef PubMed.
- M. Na, S. H. Nam, K. Moon and J. Kim, Development of a nano-QSAR model for predicting the toxicity of nano-metal oxide mixtures to Aliivibrio fischeri, Environ. Sci.: Nano, 2023, 10, 325–337 RSC.
- K. Pathakoti, M.-J. Huang, J. D. Watts, X. He and H.-M. Hwang, Using experimental data of Escherichia coli to develop a QSAR model for predicting the photo-induced cytotoxicity of metal oxide nanoparticles, J. Photochem. Photobiol., B, 2014, 130, 234–240 CrossRef CAS PubMed.
- Q. Mu, G. Jiang, L. Chen, H. Zhou, D. Fourches, A. Tropsha and B. Yan, Chemical Basis of Interactions Between Engineered Nanoparticles and Biological Systems, Chem. Rev., 2014, 114, 7740–7781 CrossRef CAS PubMed.
- Y. Feng, Y. Chang, K. Xu, R. Zheng, X. Wu, Y. Cheng and H. Zhang, Safety-by-Design of Metal Oxide Nanoparticles Based on the Regulation of their Energy Edges, Small, 2020, 16, 1907643 CrossRef CAS PubMed.
Footnote |
| † Electronic supplementary information (ESI) available. See DOI: https://doi.org/10.1039/d3nr03174h |
| This journal is © The Royal Society of Chemistry 2023 |