
 Open Access Article
 This Open Access Article is licensed under a Creative Commons Attribution-Non Commercial 3.0 Unported Licence
Crystallization and melting of polymer chains on graphene and graphene oxide†
Arman
Ghasemi‡
a,
Yangchao
Liao‡
 b,
Zhaofan
Li
b,
Wenjie
Xia
*c and
Wei
Gao
*ade
b,
Zhaofan
Li
b,
Wenjie
Xia
*c and
Wei
Gao
*ade
aDepartment of Mechanical Engineering, University of Texas at San Antonio, San Antonio, TX 78249, USA. E-mail: wei.gao@tamu.edu
bDepartment of Civil, Construction and Environmental Engineering, North Dakota State University, Fargo, ND 58108, USA
cDepartment of Aerospace Engineering, Iowa State University, Ames, IA 50011, USA. E-mail: wxia@iastate.edu
dJ. Mike Walker ‘66 Department of Mechanical Engineering, Texas A&M University, College Station, Texas 77843, USA
eDepartment of Materials Science & Engineering, Texas A&M University, College Station, TX 77843, USA
First published on 28th June 2023
Abstract
This study employs all-atomistic (AA) molecular dynamics (MD) simulations to investigate the crystallization and melting behavior of polar and nonpolar polymer chains on monolayers of graphene and graphene oxide (GO). Polyvinyl alcohol (PVA) and polyethylene (PE) are used as representative polar and nonpolar polymers, respectively. A modified order parameter is introduced to quantify the degree of two-dimensional (2D) crystallization of polymer chains. Our results show that PVA and PE chains exhibit significantly different crystallization behavior. PVA chains tend to form a more rounded, denser, and folded-stemmed lamellar structure, while PE chains tend to form an elongated straight pattern. The presence of oxidation groups on the GO substrate reduces the crystallinity of both PVA and PE chains, which is derived from the analysis of modified order parameter. Meanwhile, the crystallization patterns of polymer chains are influenced by the percentage, chemical components, and distribution of the oxidation groups. In addition, our study reveals that 2D crystalized polymer chains exhibit different melting behavior depending on their polarity. PVA chains exhibit a more molecular weight-dependent melting temperature than PE chains, which have a lower melting temperature and are relatively insensitive to molecular weight. These findings highlight the critical role of substrate and chain polarity in the crystallization and melting of polymer chains. Overall, our study provides valuable insights into the design of graphene-based polymer heterostructures and composites with tailored properties.
1. Introduction
Confined polymer chains absorbed on the surface of two-dimensional (2D) materials have emerged as a new class of heterostructures and building blocks for various novel nanomaterials and nanodevices. The confinement has a significant impact on determining the mechanical and physical properties of nanocomposites and nanostructures made of polymer/2D material heterostructures.1–5 Polymer crystallization, due to confinement, transforms randomly entangled polymer chains into fully ordered hierarchical structures,6–9 which affects the morphology of the 2D crystalline region and the interface properties between the polymer chains and 2D materials.10–15 Confined polymer chains on graphene-based nanosheets find applications in diverse fields, such as conductive composite materials,16 flexible electronic devices such as solar cell electrodes,17 energy storage systems such as supercapacitors and lithium-ion batteries18 and sensing devices like humidity sensors.19 To achieve the desired functionality of these 2D heterostructures, it is vital to have a thorough understanding of the atomistic mechanism of 2D polymer crystallization.Polymer chains absorbed on the surface of a 2D material experience one-dimensional (1D) confinement, meaning they are confined perpendicularly to the substrate surface. When provided with enough kinetic energy, the chains can move in the in-plane direction, leading to the formation of monolayer crystals with lamellar structures made up of folded chains called lamellae, which have specific lengths, orientations, and curvatures.20,21 Graphene and graphene oxide (GO) monolayers are typical substrates for absorbing polymer chains to achieve unique mechanical, thermal, and electrical properties. GO is particularly attractive due to its tunable microstructure and physical properties, which can be engineered by controlling the percentage, chemical components, and distribution of its functional groups. This make it a versatile material for various nanomaterials and nanodevices.22,23
Previous studies have investigated the interactions between bulk polymers and graphene or GO nanofillers to understand how the confinement of bulk polymer chains affects the mechanical strength of polymer nanocomposites.2,3,5,10,13–15,24–26 However, these studies did not consider the crystallization behavior of atomically thin polymer chains, which differs from those in the bulk state. Additionally, previous studies have only focused on non-polar polymer chains on the surface of pure graphene sheets and nanotubes, thus, limiting the examination of hydrogen bonding interactions within the polymer chain or with the substrate.4,9,12,21,27,28 Moreover, some previous studies have analyzed the crystallization behavior of polymers when they are melted, providing insight into the impact of substrate confinement on polymer chain crystallization and melting.6,7,29 However, these studies only considered Lennard-Jones (LJ) non-bonding energies and neglected other types of interactions such as electrostatic and hydrogen bonding, which have a significant effect on the crystallization and melting of polymer chains.
To address the issues mentioned earlier, we report a study on the crystallization and melting of polymer chains on the surface of graphene and GO using all-atomistic (AA) molecular dynamics (MD) simulations. We take into consideration all forms of interactions between the polymer chains and the substrates. Our study focuses on the crystallization and melting behavior of the polar polymer Polyvinyl alcohol (PVA) and the nonpolar polymer Polyethylene (PE) on monolayer graphene and GO substrates. We aim to examine the impact of polymer polarity and substrate properties on these behaviors. This work allows us to explore the interplay between the polymer-substrate interaction and the polymer–polymer interaction in the context of atomically thin chains. While our simulation setup may not directly represent practical thin film systems, it serves as a simplified model to gain fundamental understanding and insights into the behavior of atomically thin polymer chains on graphene and GO substrates. By studying this system, we can elucidate the underlying mechanisms governing the crystallization behavior and provide fundamental knowledge that can inform the design and fabrication of novel 2D-material/polymer hybrid structures.
2. Methods
2.1. All-atom molecular dynamics simulation
In this work, all polymer chains are built using in-house MATLAB and Python scripts, and all the AA-MD simulations are conducted with the open-source package Large-scale Atomic/Molecular Massively Parallel Simulator (LAMMPS).30 The simulations are visualized using Visual Molecular Dynamics (VMD).31 The atomistic models of PVA and PE are shown in Fig. 1, where the carbon, oxygen, and hydrogen atoms are represented by orange, red, and green colors, respectively.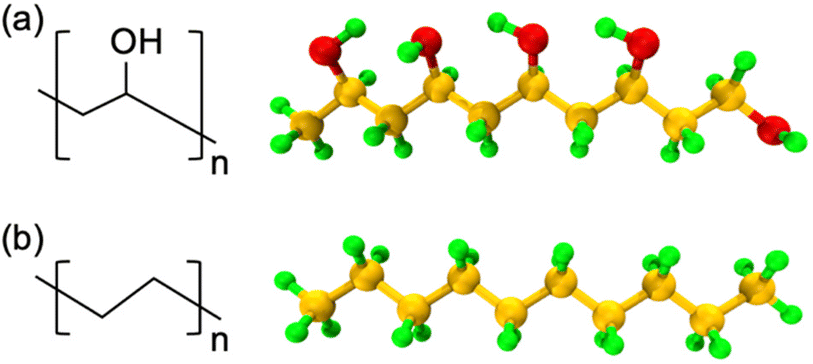 | ||
| Fig. 1 Schematic of the chemical structures and representative AA models of (a) PVA and (b) PE used in the simulations. Orange, red, and green spheres represent C, O, and H atoms, respectively. | ||
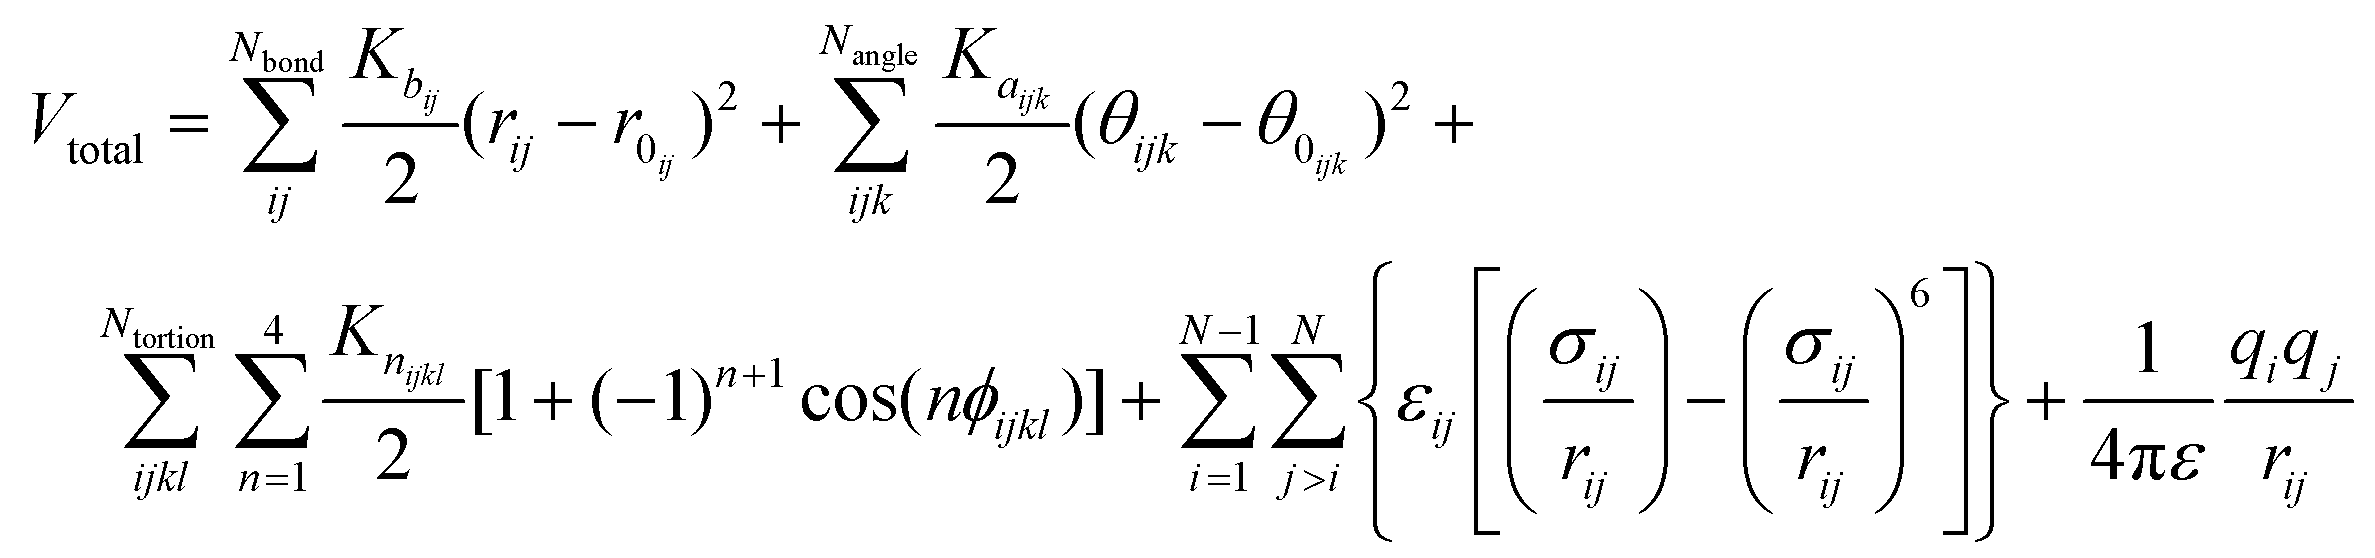
The non-reactive all-atomistic Optimized Potential for Liquid Simulation (OPLS-AA) force field was chosen for this study since no bond breaking was expected in the simulations. OPLS-AA calculates the energy for bond stretching, angle bending, and dihedral deformations, as well as non-bonded energy terms. The energy values predicted by this force field for organic materials have been shown to be in good agreement with density functional theory calculations.28 The validity of the OPLS-AA force field for polymer and organic material simulations has also been confirmed in other studies,32–34 and it has been successfully used for simulations of GO.35,36 According to the OPLS-AA force field, the total energy is calculated as follows:
 | (1) |
Square-shaped graphene and GO monolayers are placed in the xy plane and positioned at the center of a simulation box with dimensions of 20 nm × 20 nm × 12 nm. The molecular weights of the PVA and PE chains considered ranged from 4 kDa to 20 kDa. The system employs periodic boundary conditions (PBCs) in all directions. After the initial system setup, molecular statics minimization method is applied to minimize the total potential energy of the system. An initial velocity is then assigned to the system based on Gaussian distribution at the desired temperature. A cutoff value of 10 Å and a time step of 1 fs are used for all MD simulations. Moreover, all simulations related to polymer crystallization are conducted through heating-cooling cycles, with an annealing temperature of 1100 K and a cooling rate of 50 K ns−1. Detailed descriptions of polymer generation and equilibration, and annealing process are presented in the ESI.†
2.2. Quantification of polymer crystallization
A polymer crystal is typically made up of straight or rod-like polymer segments. The order parameter λ, which describes the degree of crystallinity in a polymer segment of length 2k + 1 monomers, is given by:38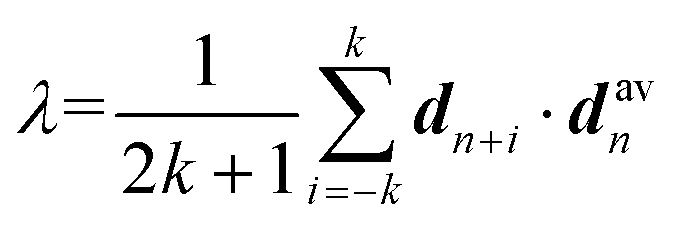 | (2) |
Here, the chord vector dn is calculated as dn = (rn+1 − rn−1)/|rn+1 − rn−1|, which gives the local direction of the polymer segment, and davn represents the average chord direction within the segment. The parameter k denotes the number of carbon atoms in a continuous polymer chain, with only the carbon atoms on the main chain considered in the calculation of λ. The value of λ describes the average deviation of the chord from the overall direction of the chain. A polymer segment from n − k to n + k is considered straight if the value of λ at atom n exceeds a threshold of 0.9. In this study, k = 5 is used, implying that the minimum length of a segment is 11 monomers. It should be noted that while λ is a useful parameter for evaluating the degree of crystallinity in bulk polymer systems, it is not suitable for assessing the degree of crystallinity for atomically thin polymer chains. The λ of polymer single chains as studied in this paper is influenced by various factors such as chain conformation (or shape), chain length, interactions and bonding, temperature, environment, and external fields.39–41 Therefore, it is necessary to perform certain modifications to the order parameter λ.
To address this issue, we introduce a modified λm to quantitatively describe the degree of crystallization of polymer chains on graphene and GO monolayers. λm is calculated using the following equation:
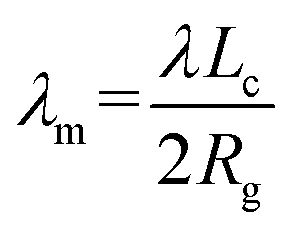 | (3) |
 | (4) |
We further calculate the orientational order parameter 〈P2〉 to characterize the alignment properties of the polymer chains. 〈P2〉 is defined below:42
〈P2〉 = ½〈3![[thin space (1/6-em)]](https://www.rsc.org/images/entities/char_2009.gif) cos2β − 1〉 cos2β − 1〉 | (5) |
3. Results and discussion
3.1. Crystallization of single chain on graphene monolayer
Our simulations have revealed a lamellar-folded type of 2D polymer crystallization on a graphene sheet, driven by two main interactions: the polymer–substrate interaction, which confines the out-of-plane displacement of the polymer and guides its folding, and the polymer–polymer interaction, which also influences the polymer folding. The interplay between these interactions can result in different lamellar patterns and shapes. In the following sections, we investigate the primary factors that influence the curvature and thickness of these lamellar structures.The chemical composition and molecular weight of the polymer are two key factors that impact the degree of crystallization, radius of gyration, and lamella thickness of a 2D crystallized polymer chain. In Fig. 2(a) and (b), we show examples of single PVA and PE chains crystallized on a graphene monolayer with molecular weights of 10 kDa and 20 kDa. The 2D crystal structure of PVA appears more circular and tightly packed in comparison to PE, resulting in a smaller overall structure, shorter folded rod segment length, and a higher number of folded stems. The parameter β, defined as the ratio of the length to width of rod segments in a lamellar crystalline region, is smaller for PVA chains confined on the surface of a graphene substrate compared to PE chains under similar crystallization and confinement conditions, indicating that PVA chains tend to form more folded stems than PE chains. This is because PVA is a polar polymer, resulting in stronger interactions within the polymer chain through hydrogen bonds. Additionally, the shorter rod segment length of PVA results in a more circular shape of the lamellar region, as illustrated in Fig. 1(a) and (b). Our simulations indicate that increasing the molecular weight of the polymer chain (i.e., chain length) results in thicker lamellar regions for both PVA and PE.
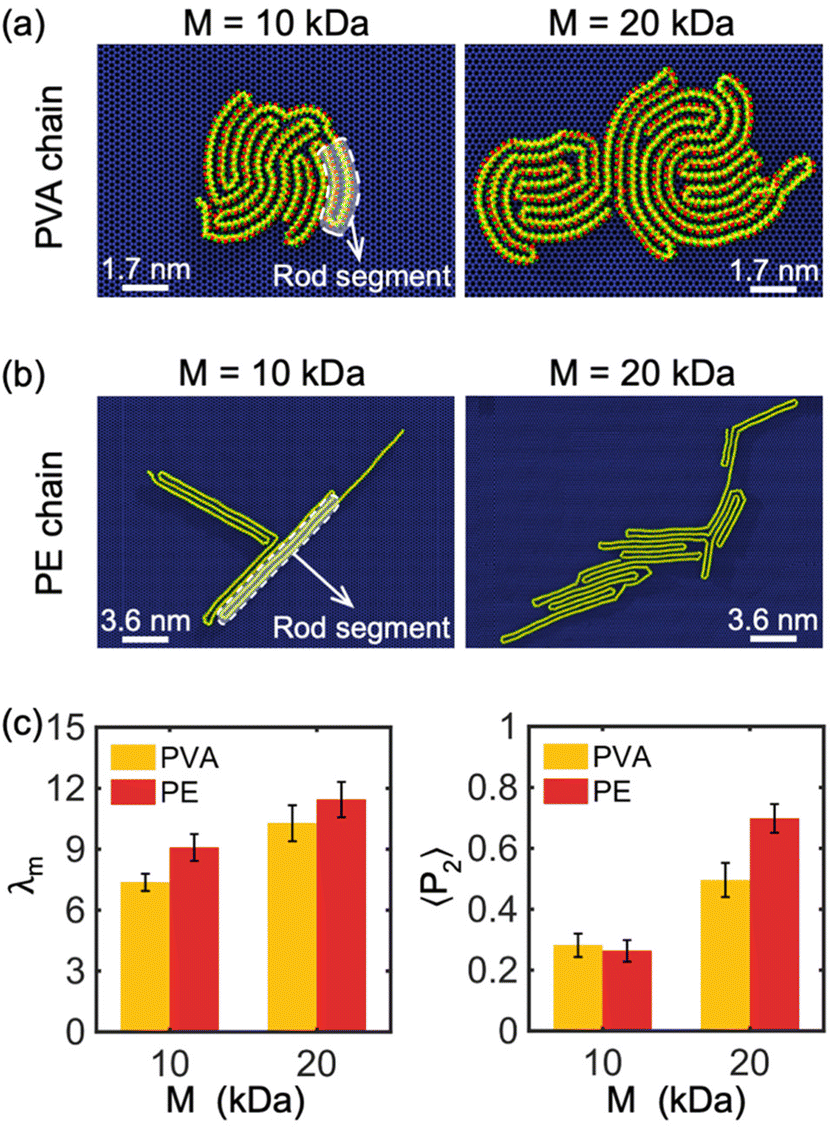 | ||
| Fig. 2 Crystallization of single (a) PVA chain and (b) PE chain with two molecular weights (i.e., M = 10 kDa and M = 20 kDa) on the surface of graphene monolayer. The carbon atoms of graphene are represented by dark blue spheres. The dashed loops and the arrows show the typical rod segments formed due to crystallization. The white line represents the scale bar for the system size. (c) Modified order parameter λm and orientational order parameters 〈P2〉 of single PVA and PE chains of different M on the surface of graphene monolayer. Five independent simulations are performed to obtain the average values of λm and 〈P2〉 for each molecular weight. | ||
To better understand the degree of crystallinity of the polymer chains, we examined the modified order parameter λm (eqn (3)) and orientational order parameters 〈P2〉 (eqn (5)). As illustrated in Fig. 2(c), at the same molecular weight, a PE chain has a slightly higher λm than a PVA chain, indicating that PE has a higher degree of crystallinity compared to PVA. This is due to the weaker intra-chain interactions of non-polar PE, which favor highly crystalline morphologies on the surface of a graphene monolayer, resulting in a larger λm. Fig. 2(c) also demonstrates that the crystallinity of both PVA and PE chains increases with molecular weight M, with λm increasing as M increases. Moreover, 〈P2〉 of the PE chain is larger than that of the PVA chain when M = 20 kDa, indicating that the PE chain has a higher degree of alignment along the direction of the maximum eigenvalue of its gyration tensor. As 〈P2〉 of both PVA and PE chains increases remarkably with the increase of M, it implies that the polymer chain of large molecular weight has a higher degree of alignment property (Fig. 2(c)). In general, the PE chain with large molecular weight tends to form a long strip-like alignment pattern, while the PVA chain alignment is more concentrated around the center of mass. In our simulations, it is observed that polymer chains prefer to form a monolayer covering the surface of graphene, due to the strong two-dimensional confinement. However, as the quantity of chains continues to increase, the formation of bilayers or even multilayered polymers is also possible. It is anticipated that the impact of graphene's confinement decreases beyond the initial polymer layer. The transition from monolayer to multilayer polymers under confinement conditions presents an intriguing problem for future exploration.
3.2. Effect of GO substrate on single chain crystallization
In this section, we investigate the influence of the oxidation degree (i.e., percentage of oxidized area) and distribution type of the oxidized area (i.e., random type and island type) of the GO monolayer on the crystallization behavior of the polymer chains. Fig. 3(a) and (b) depict the crystallization of single PVA and PE chains with molecular weight of 10 kDa on the surface of a GO monolayer having randomly distributed oxide-functional groups at levels of 10%, 30%, and 40%, respectively. Unless otherwise stated, the ratio of epoxide to hydroxyl oxidized functional groups in GO is 4 to 1. We observe that, in contrast to the graphene substrate, the presence of oxidized functional groups on the GO surface hinders the formation of lamellar structures with a high degree of crystallinity in PVA and PE chains. This can be attributed to the additional confinement of the absorbed polymer chains by the functional groups of GO in the in-plane direction, partially restricting their movement along this direction, thereby leading to a reduced degree of crystallinity of the confined chains. | ||
| Fig. 3 Crystallization of single (a) PVA chain and (b) PE chain with M = 10 kDa on the surface of a GO monolayer having 10%, 30%, and 40% randomly distributed oxide-functional groups. (c) Modified order parameter λm and orientational order parameters 〈P2〉 of single PVA and PE chains on the surface of GO with randomly distributed oxide-functional groups and different oxidation percentages. Crystallization of single (d) PVA chain and (e) PE chain with M = 10 kDa on the surface of a GO monolayer having 10%, 30%, and 40% island-type distributed oxide-functional groups, respectively. (f) Modified order parameter λm and orientational order parameters 〈P2〉 of single PVA and PE chains on the surface of GO with island-type distributed oxide-functional groups and different oxidation percentages. The ratio of epoxide to hydroxyl oxidized functional groups in GO is 4 to 1. Epoxy-oxidized and hydroxyl-oxidized carbon atoms are highlighted in white and cyan, respectively. The white line represents the scale bar for the system size. Five independent simulations are performed to obtain the average values of λm and 〈P2〉 for each oxidation percentage in panels (c) and (f). | ||
Furthermore, the λm of PVA chains for different oxidation percentages is shown in Fig. 3(c), which is approximately 3.5 for all three cases. This is half of the corresponding value of 7 for PVA chains crystallizing on pristine graphene (Fig. 2(c)), indicating that the oxidation percentage has no significant impact on the crystallization of PVA chains above a certain threshold. This suggests that the functional groups on the GO surface can create strong hydrogen bonds with PVA chains, thereby reducing the degree of 2D crystallization. The analysis of λm also reveals a lower crystallinity of PE chains with increasing oxidation ratio and the presence of oxidizing groups due to the constraints caused by functional group-PE bonds (the λm of PE chains crystallized on pristine graphene and GO are about 9 and less than 6, respectively). Since the polymer-functional group bonds are weaker in PE than in PVA, the functional groups have a weaker confining effect on PE compared to PVA, resulting in a difference in the crystallinity of PE chains on the GO surface for oxidation ratios of 10% and 30%. However, for oxidation ratios of 30% and higher (e.g., 40%), the functional group-PE bonds are enough to saturate the confining effect of the functional groups.
The distribution of GO's functional groups is another factor that can influence the degree of crystallization and pattern of confined PVA and PE chains on the surface of the GO substrate. GO can exist in different types of heterostructures depending on its synthesis method.22 For example, it can take the form of a heterostructure consisting of several separate islands of functional groups within graphitic regions, which is different from the form shown in Fig. 3(a) and (b) where functional groups are evenly distributed throughout the sheet. Fig. 3(d) and (e) show the crystallization of a single PVA and PE chain with M = 10 kDa on the surface of GO monolayer with island-type oxidized regions. It is observed that PVA chain partially attaches into the edge of oxidized islands, while the PE chain stays on the graphitic regions. Comparing Fig. 3(c) and (f), we observe that at 10% oxidation ratio, the crystallization of PVA on island-type GO is essentially the same as on evenly/randomly distributed GO (λm ≈ 3.5), while PE crystallizes significantly more on island-type GO. For oxidation ratios of 30% and above, there are no meaningful patterns or differences observed in the polymers’ crystallization between these island-type GO and evenly/randomly distributed GO. These observations suggest that it is possible to engineer a desired design for the morphology of polymer 2D-material heterostructures by customizing the oxidized regions in a GO substrate. Notably, the influence of the percentage of oxidation of the GO substrate and the distribution of its functional groups on the alignment properties of the polymer chains (both PVA and PE chains) is relatively random, making it difficult to find significant rules from the analysis of 〈P2〉 in Fig. 3(c) and (f).
Furthermore, simulations were performed to investigate the impact of oxidized functional group chemical components on the crystallization process of PE and PVA chains. Specifically, we analyzed the absorption and crystallization of a single PVA and PE chain with M = 10 kDa on the surface of a 30% oxidized monolayer GO substrate with randomly distributed functional groups and two different compositions of chemicals: all-epoxide groups and all-hydroxyl groups compositions. The results of these simulations are shown in Fig. 4(a) and (b). Our findings reveal that PVA can partially crystallize on GO substrates with all-epoxide groups, but it completely loses its crystal structure when absorbed by GO with all-hydroxyl groups. However, the chemical components of the oxidation functional group have no significant impact on the crystallization of the PE chain. This observation is confirmed by the analysis of λm in Fig. 4(c), which shows that the PVA chain has a much larger modified order parameter (λm ≈ 6) on GO substrate with all-epoxide groups than on GO substrates with all-hydroxyl groups (λm ≈ 4), while the PE chain shows no significant change in λm on both GO substrates. Furthermore, the analysis of 〈P2〉 shows that the type of oxidation of the GO substrate has a weaker effect on the alignment properties of the PE chains, as evidenced by the values of 〈P2〉 that are all around 0.6 (Fig. 4(c)). However, hydroxyl-oxidation makes the PVA chains have a higher alignment due to the tendency of PVA chains to present a stretched and low crystallinity conformation on the hydroxyl-oxidized GO substrate.
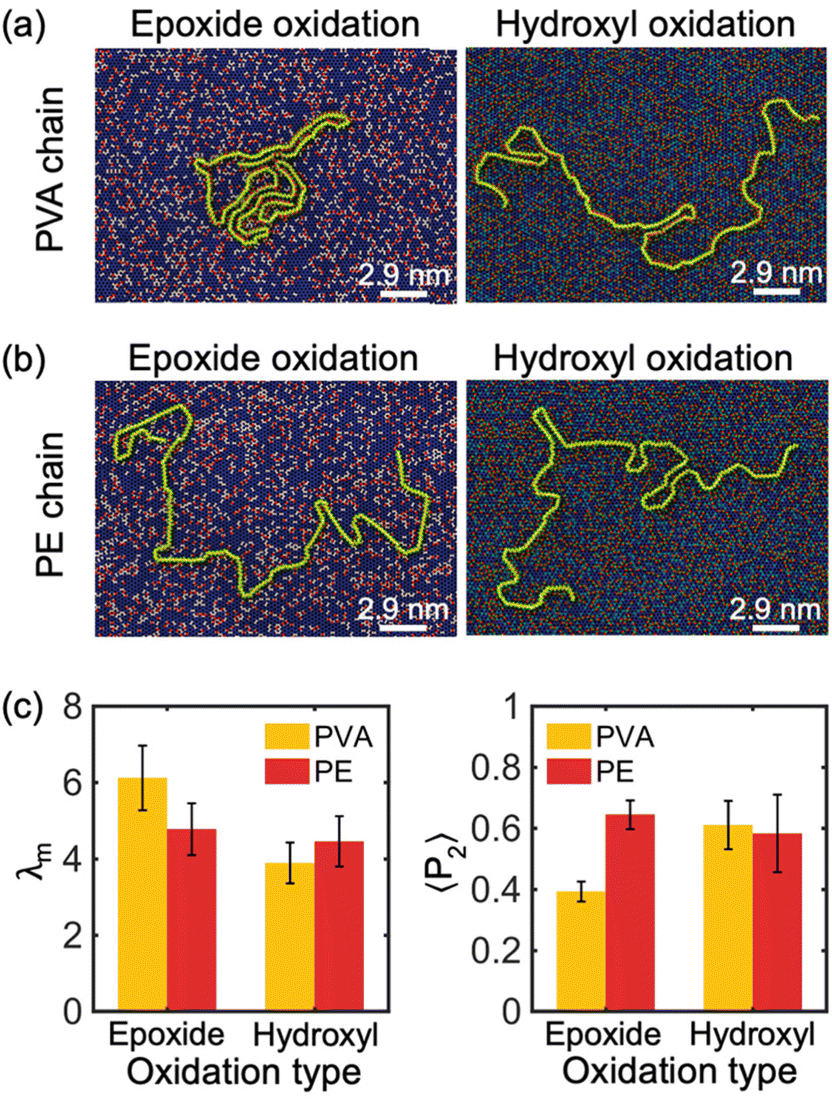 | ||
| Fig. 4 Crystallization of single (a) PVA chain and (b) PE chain with M = 10 kDa on the surface of GO monolayers with 30% randomly distributed all epoxide functional groups and all hydroxyl functional groups. The white line represents the scale bar for the system size. (c) Modified order parameter λm and orientational order parameters 〈P2〉 of single PVA and PE chains on the surface of GO with randomly distributed oxide-functional groups and different oxidation types. Five independent simulations are performed to obtain the average values of λm and 〈P2〉 for each oxidation type. | ||
The impact of the chemical components of oxidation functional groups of GO on the crystallization behavior of PVA and PE chains can be explained as follows: the hydroxyl group (–OH) is a polar functional group that can form hydrogen bonds with (–OH) functional groups on the PVA chain, which confines the PVA from moving along the in-plane direction and restricts chain folding, resulting in non-crystallized confined polymer chains. In contrast, the non-polar PE chain tends to avoid oxidized regions, whether they are epoxide-reach or hydroxyl-reach, and instead preferentially stays on the graphitic regions. Therefore, both types of functional groups have a similar level of adverse effect on PE crystallization.
3.3. Melting of crystallized polymer chain on graphene monolayer
Melting behavior refers to the loss of crystallinity in the structure of a crystallized polymer. For a confined, crystallized polymer, melting involves overcoming existing barrier interactions, such as van der Waals, electrostatic, and hydrogen bonds, that keep the chain in a folded lamella shape. As the temperature of the confined polymer and its substrate increases, the distance between the folded stems (i.e., rod segments in Fig. 2) of the lamella increases, and eventually, the chain starts to unfold. This is considered the starting point of the melting process. The melting process is complete when the chain is completely unfolded. Therefore, the point at which melting is complete depends on the shape and thickness of the lamellas.The melting point is determined based on measuring the change in the potential energy coming from non-bonded interaction (i.e., interactions between atoms not linked by covalent bonds) as a function of temperature.43 This potential energy is referred to as non-bonded energy. Fig. 5(a) illustrates the correlation between non-bonded energy Enb and temperature T for crystallized PVA on a graphene substrate. During the initial stage, a slight increase in the distance between the folded chains causes a gradual increase in non-bonded energy. At this stage, non-bonded interactions are still able to maintain the chain in a folded shape despite the increase in temperature. Once the onset of melting is reached, a significant jump in the non-bonded energy curves is observed, marking the starting point of melting in the crystalized PVA chain. As the temperature continues to rise, the increasing kinetic energy acts as a driving force to separate the folded chain segments of the crystal structure, leading to the breaking of many non-bonded interactions between chain segments. This causes a more abrupt increase in the non-bonded energy as temperature increases. The unfolding process continues until the entire crystal structure has melted (the second black point), after which the increase of non-bonded energy is mainly due to the change of chain-substrate interactions when the chain substrate distance increases, leading to a smaller slope of the non-bonded energy. A melting temperature is defined as the average temperature of the starting and final points of the unfolding process. The analysis shows that the melting temperature Tm of single-chain crystalized PVA increases with increasing polymer molecular weight.
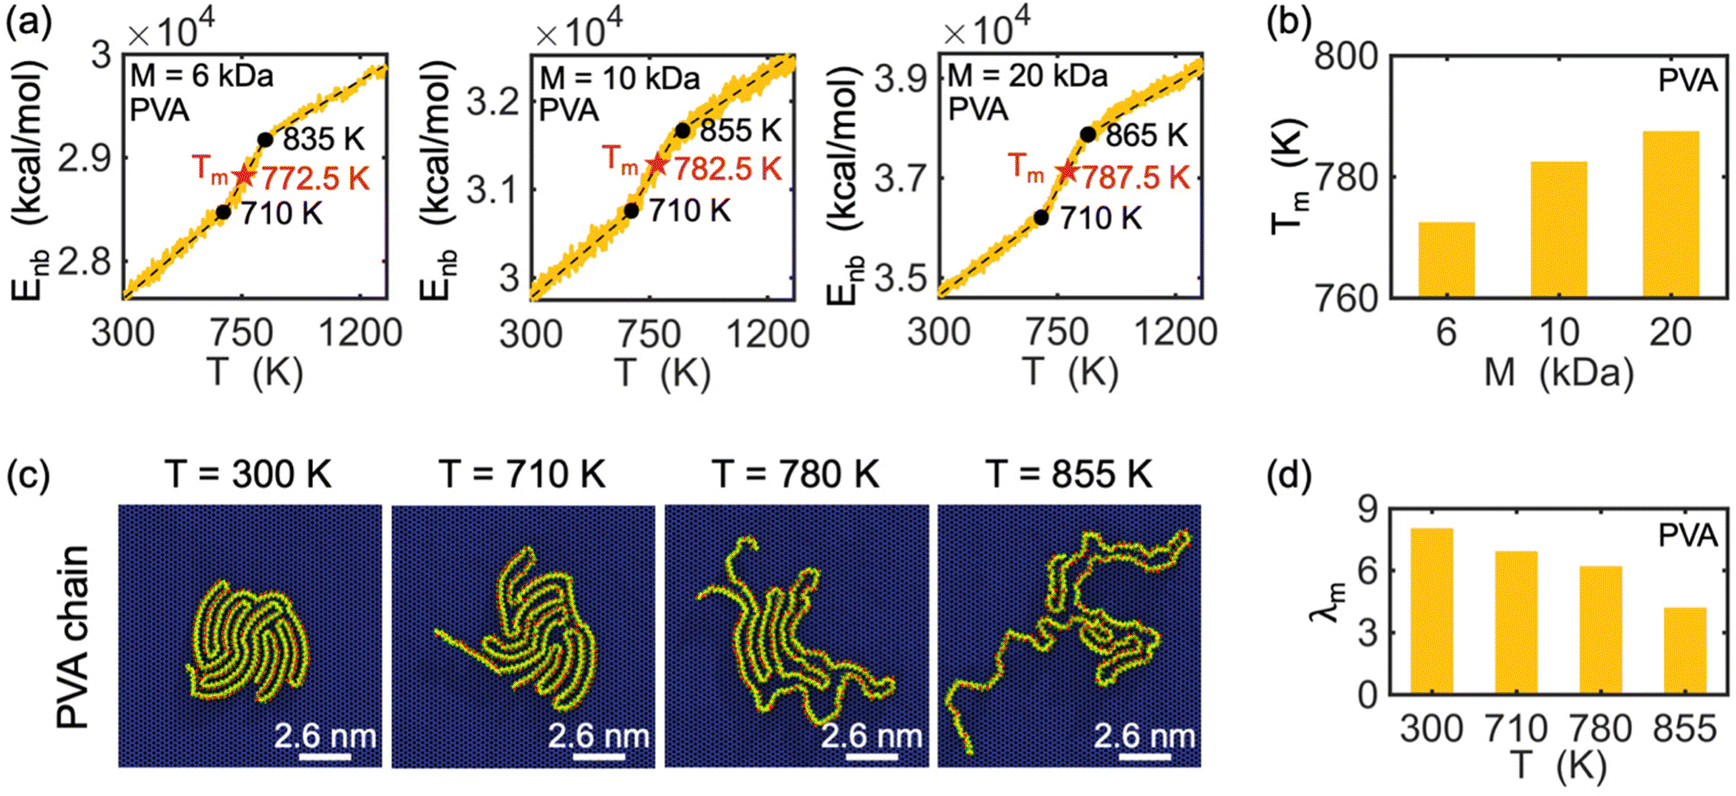 | ||
| Fig. 5 (a) Change in total non-bonded energy Enbversus temperature T for crystallized PVA/graphene heterostructures with different polymer chain molecular weights (i.e., M = 6, 10, 20 kDa). The black dashed lines represent the linear fit of Enb–T curve. The two black points indicate the starting and fully melted states of polymer chain melting, respectively. The red stars imply the melting temperature Tm of the polymer, which is the average temperature of starting point and final point of the unfolding process (fully melted state). (b) Tmversus M for PVA chain crystallized on graphene. (c) The conformation of the melting process of the 10 kDa PVA chain on the surface of the graphene substrate at four different temperatures (i.e., T = 300, 710, 780, 855 K). (d) λmversus T for PVA chain crystallized on graphene. | ||
Additionally, the conformation of a PVA chain with a molecular weight of 10 kDa during the melting process is shown in Fig. 5(c). At room temperature (T = 300 K), the PVA chain is crystallized on the surface of the graphene substrate. As the temperature increases to 710 K, the crystalized PVA begins to unfold, and this process continues until 780 K, at which point the chain becomes fully unfolded. Fig. 5(d) shows a decrease in the degree of crystallization (λm) with increasing temperature during the melting process. The observed trend in λm is consistent with the conformation of the PVA chain as shown in Fig. 5(c). Note that we do not analyze the threshold of the order parameter to describe the cross-phase transition of the polymer chain and that the modified order parameter considered in this work gives us information about the degree of crystallinity.
The melting behavior of crystallized polyethylene (PE) chains on a graphene substrate was studied using a similar approach as that used for PVA chains. Fig. 6(a) shows that the melting behaviors of single PE chains differs from that of PVA chains in two significant ways. First, PVA exhibits three different slope regimes in its non-bonded energy-temperature curves, whereas PE only exhibits two. The intersection of these two slopes indicates the melting of the entire PE crystal structure (marked by a black star). Second, while the melting temperature of PVA depends on the molecular weight of the chains, the melting temperature of PE does not significantly change with increasing molecular weight. This difference can be attributed to the fact that PE does not form thick lamellar regions on the graphene surface, even for chains with high molecular weight, and there are no hydrogen bonds between the folded segments of the PE lamellar regions, in contrast to the hydrogen bonds formed within the folded segments of PVA chains. Consequently, the unfolding process of PE consumes much less energy than that of PVA, resulting in a lower melting temperature for PE, which is relatively insensitive to molecular weight. In accordance with the conformation shown in Fig. 6(c), the degree of crystallization λm of PE decreases during melting, as demonstrated in Fig. 6(d). We further analyzed the radial distribution function of the polymer chains during the melting process, for providing basic information on the local structure and density variations (see Fig. S1 and S2 in the ESI†). It is found that the radial distribution functions of both PVA chains and PE chains exhibit significant changes during the melting process, implying a shift from higher crystallinity at low temperatures to lower crystallinity at high temperatures for the polymer chains. Finally, it is noted that the structure and dynamics of PE chain on graphene substrate has been studied by Gulde et al.12 using molecular dynamics simulation, where they found the crystalline patten of PE similar to those discovered in present study. In addition, they observed heterogeneous polymer melting via a transient floating phase on a picosecond time scale upon quasi-instantaneous substrate heating. In present work, we revealed distinct crystallization lamellar patterns and melting behavior between the polar polymer PVA and the non-polar polymer PE.
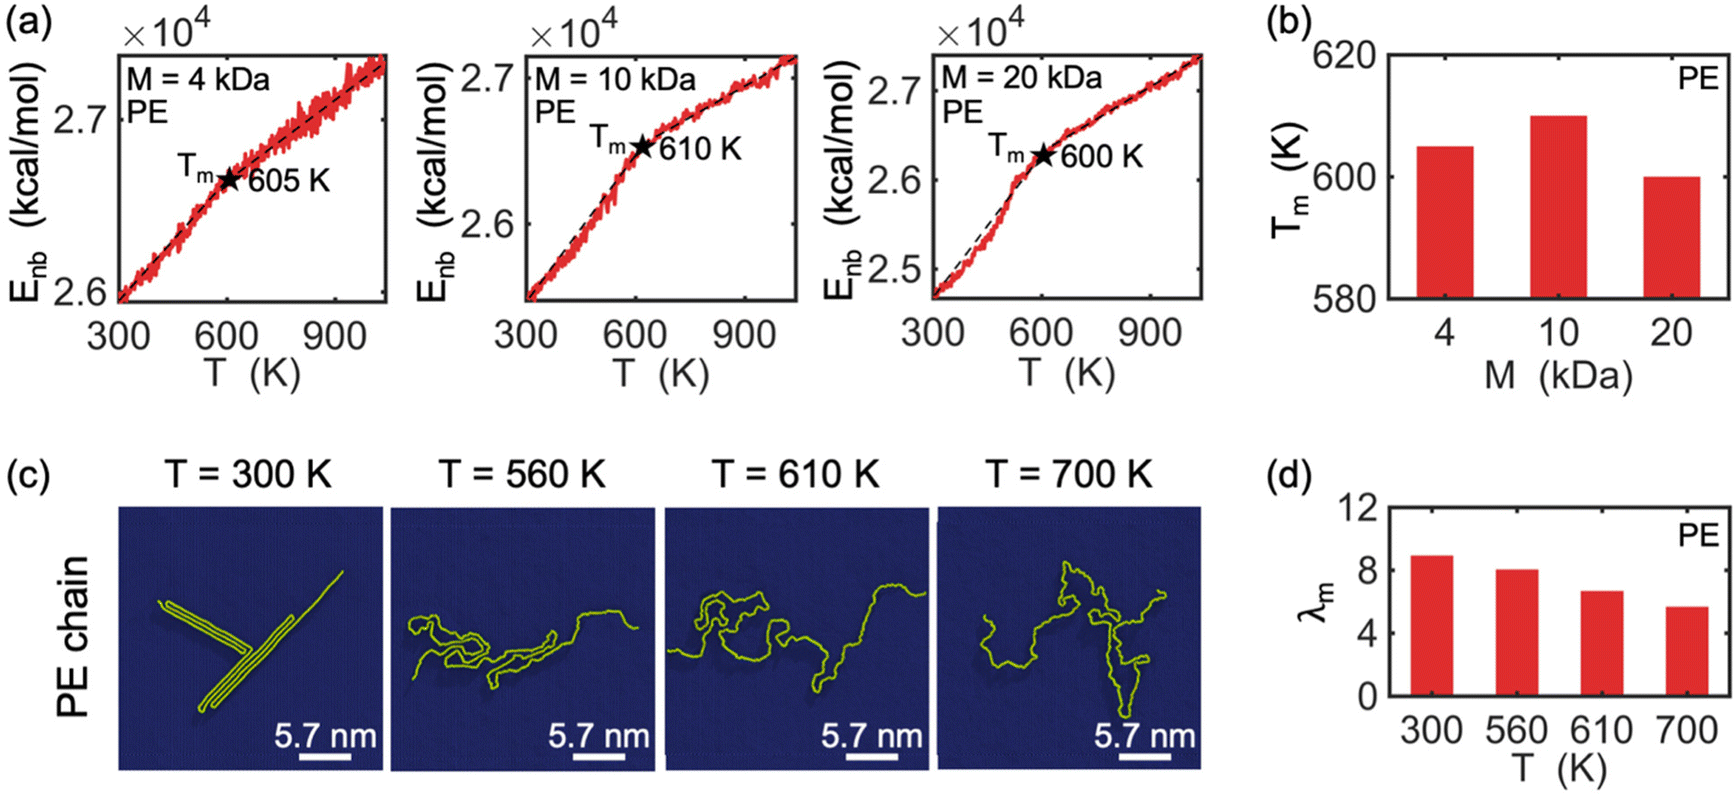 | ||
| Fig. 6 (a) Change in total non-bonded energy Enbversus temperature T for crystallized PE/graphene heterostructures with different polymer chain molecular weights (i.e., M = 4, 10, 20 kDa). The black dashed lines represent the linear fit of Enb–T curve. The black stars imply the melting temperature Tm of the polymer. (b) Tmversus M for PE chain crystallized on graphene. (c) The conformation of the melting process of the 10 kDa PE on the surface of the graphene substrate at four different temperatures (i.e., T = 300, 560, 610, 700 K). (d) λmversus T for PE chain crystallized on graphene. | ||
4. Conclusions
In conclusion, we use all-atom molecular dynamics simulations to study the crystallization of PVA and PE chains on graphene and GO substrates. Our simulations reveal that the interplay between the polymer-substrate interaction and the polymer–polymer interaction can result in different lamellar patterns and shapes, and that the degree of crystallinity, lamellar thickness, and curvature of the polymer chains are strongly influenced by the chemical composition and molecular weight of the polymer, as well as the distribution and chemical components of the functional groups on the substrate. Specifically, we found that PVA chains tend to form more tightly packed and circular 2D crystalline structures with more folded stems, while PE chains form larger and more highly crystalline structures due to their weaker intra-chain interactions. The PE chains have a higher degree of alignment compared to the crystalline pattern of PVA chains. Additionally, we have shown that the distribution of functional groups on the substrate can significantly impact the crystallization behavior of the confined polymer chains, with PVA chains being more sensitive to the polar –OH functional groups and PE chains being more sensitive to the graphitic regions. Furthermore, we studied the melting behavior of the confined, crystallized polymer chains by measuring the change in non-bonded energy as a function of temperature, and found that the melting of PVA and PE chains was different due to the differences in the hydrogen bonding within their lamellar regions. The melting temperature of PVA chains increases with increasing molecular weight, whereas the melting temperature of PE chains is relatively insensitive to molecular weight. Our findings provide new insights into the underlying mechanisms governing 2D polymer crystallization on graphene and GO substrates and have important implications for the design and fabrication of novel 2D-material/polymer hybrid structures for a variety of applications.Author contributions
Arman Ghasemi: methodology, software, formal analysis, validation, writing – original draft, writing – review & editing. Yangchao Liao: methodology, formal analysis, validation, visualization, writing – original draft, writing – review & editing. Zhaofan Li: methodology, formal analysis, writing – review & editing. Wenjie Xia: conceptualization, supervision, project administration, funding acquisition, resources, writing – review & editing. Wei Gao: conceptualization, supervision, project administration, funding acquisition, resources, writing - review & editing.Data availability
The LAMMPS input files used in this study are publicly available at figshare: https://doi.org/10.6084/m9.figshare.23519340Conflicts of interest
The authors declare that they have no known competing financial interests or personal relationships that could have appeared to influence the work reported in this paper.Acknowledgements
W. G. and A. G. gratefully acknowledge financial support of this work by the National Science Foundation through Grant No. CMMI-2308163 and CMMI-2305529. The authors acknowledge the Texas Advanced Computing Center (TACC) at the University of Texas at Austin for providing HPC resources that have contributed to the research results reported within this paper. Y. Liao and W. Xia acknowledge the support from the National Science Foundation (NSF) through Grant No. CMMI-2113558 and CMMI-2331017.References
- N. R. Tummala and A. Striolo, Role of counterion condensation in the self-assembly of SDS surfactants at the water-graphite interface, J. Phys. Chem. B, 2008, 112(7), 1987–2000, DOI:10.1021/jp077678m.
- O. C. Compton, et al., Tuning the mechanical properties of graphene oxide paper and its associated polymer nanocomposites by controlling cooperative intersheet hydrogen bonding, ACS Nano, 2012, 6(3), 2008–2019, DOI:10.1021/nn202928w.
- F. Rahmani, M. Mahdavi, S. Nouranian and A. Al-Ostaz, Confinement effects on the thermal stability of poly(ethylene oxide)/graphene nanocomposites: A reactive molecular dynamics simulation study, J. Polym. Sci., Part B: Polym. Phys., 2017, 55(13), 1026–1035, DOI:10.1002/polb.24355.
- Z. Zhou, J. Wang, X. Zhu, X. Lu, W. Guan and Y. Yang, Molecular dynamics simulation of melting and crystallization processes of polyethylene clusters confined in armchair single-walled carbon nanotubes, J. Mol. Model., 2015, 21(1), 1–9, DOI:10.1007/s00894-014-2564-2.
- N. Ding, X. Chen, C. M. L. Wu and X. Lu, Computational investigation on the effect of graphene oxide sheets as nanofillers in poly(vinyl alcohol)/graphene oxide composites, J. Phys. Chem. C, 2012, 116(42), 22532–22538, DOI:10.1021/jp3056587.
- T. Yamamoto, Molecular dynamics modeling of polymer crystallization from the melt, Polymer, 2004, 45(4), 1357–1364, DOI:10.1016/j.polymer.2003.04.006.
- T. Yamamoto, Molecular dynamics simulation of polymer ordering. II. Crystallization from the melt, J. Chem. Phys., 2001, 115(18), 8675–8680, DOI:10.1063/1.1410377.
- W. Chen and Y. Ren, Molecular dynamics simulations of polymerisation and crystallisation at constant chemical potential, Mol. Simul., 2020, 46(11), 823–828, DOI:10.1080/08927022.2020.1776276.
- M. Anwar and T. Schilling, Crystallization of polyethylene: A molecular dynamics simulation study of the nucleation and growth mechanisms, Polymer, 2015, 76, 307–312, DOI:10.1016/j.polymer.2015.08.041.
- N. Rissanou, P. Bačová, A. J. Power and V. Harmandaris, Atomistic Molecular Dynamics Simulations of Polymer/Graphene Nanostructured Systems, Mater. Today: Proc., 2018, 5(4), 27472–27481, DOI:10.1016/j.matpr.2018.09.066.
- R. K. Layek and A. K. Nandi, A review on synthesis and properties of polymer functionalized graphene, Polymer, 2013, 54(19), 5087–5103, DOI:10.1016/j.polymer.2013.06.027.
- M. Gulde, A. N. Rissanou, V. Harmandaris, M. Müller, S. Schäfer and C. Ropers, Dynamics and Structure of Monolayer Polymer Crystallites on Graphene, Nano Lett., 2016, 16(11), 6994–7000, DOI:10.1021/acs.nanolett.6b03079.
- A. N. Rissanou and V. Harmandaris, Dynamics of various polymer-graphene interfacial systems through atomistic molecular dynamics simulations, Soft Matter, 2014, 10(16), 2876–2888, 10.1039/c3sm52688g.
- V. A. Harmandaris, K. C. Daoulas and V. G. Mavrantzas, Molecular dynamics simulation of a polymer melt/solid interface: Local dynamics and chain mobility in a thin film of polyethylene melt adsorbed on graphite, Macromolecules, 2005, 38(13), 5796–5809, DOI:10.1021/ma050177j.
- S. Güryel, M. Walker, P. Geerlings, F. De Proft and M. R. Wilson, Molecular dynamics simulations of the structure and the morphology of graphene/polymer nanocomposites, Phys. Chem. Chem. Phys., 2017, 19(20), 12959–12969, 10.1039/c7cp01552f.
- A. M. Díez-Pascual and A. Rahdar, Graphene-Based Polymer Composites for Flexible Electronic Applications, Micromachines, 2022, 13(7), 1123, DOI:10.3390/mi13071123.
- E. N. Skountzos and V. Mavrantzas, Molecular dynamics simulations of graphene-based polymer nanocomposites, Carbon-Based Smart Materials, De Gruyter, 2020, pp. 115–152 Search PubMed.
- H. Kumar, R. Sharma, A. Yadav and R. Kumari, Recent advancement made in the field of reduced graphene oxide-based nanocomposites used in the energy storage devices: A review, J. Energy Storage, 2021, 33 DOI:10.1016/j.est.2020.102032.
- N. I. Muhamad Fauzi, et al., Evaluation of Structural and Optical Properties of Graphene Oxide-Polyvinyl Alcohol Thin Film and Its Potential for Pesticide Detection Using an Optical Method, Photonics, 2022, 9(5), 300, DOI:10.3390/photonics9050300.
- T. Yamamoto, Molecular dynamics simulation of polymer crystallization through chain folding, J. Chem. Phys., 1997, 107(7), 2653–2663, DOI:10.1063/1.474576.
- Y. F. Liu, H. Yang and H. Zhang, Molecular dynamics simulation of the folding of single alkane chains with different lengths on single-walled carbon nanotubes and graphene, J. Mol. Model., 2018, 24(6), 1–11, DOI:10.1007/s00894-018-3675-y.
- I. Benedetti, et al., Formulation and validation of a reduced order model of 2D materials exhibiting a two-phase microstructure as applied to graphene oxide, J. Mech. Phys. Solids, 2018, 112, 66–88, DOI:10.1016/j.jmps.2017.11.012.
- T. Yang, S. Berber, J. F. Liu, G. P. Miller and D. Tománek, Self-assembly of long chain alkanes and their derivatives on graphite, J. Chem. Phys., 2008, 128(12) DOI:10.1063/1.2841478.
- Y. F. Liu, H. Yang, Z. M. Zhang and H. Zhang, Molecular dynamics simulations on the orientation of n-alkanes with different lengths on graphene, Surf. Sci., 2019, 690 DOI:10.1016/j.susc.2019.121468.
- H. Yang, Y. F. Liu and H. Zhang, Fully Atomistic Molecular Dynamics Simulations of the Isothermal Orientation of n-Decanes Confined between Graphene Sheets, J. Phys. Chem. C, 2018, 122(45), 26226–26235, DOI:10.1021/acs.jpcc.8b06191.
- J. S. Yang, D. H. Huang, Q. L. Cao, Q. Li, L. Z. Wang and F. H. Wang, Crystallization of polymer chains induced by graphene: Molecular dynamics study, Chin. Phys. B, 2013, 22(9) DOI:10.1088/1674-1056/22/9/098101.
- H. Tang, Y. Zhao, X. Yang, D. Liu, S. Shan and F. Cui, Understanding the Roles of Solution Chemistries and Functionalization on the Aggregation of Graphene-Based Nanomaterials Using Molecular Dynamic Simulations, J. Phys. Chem. C, 2017, 121(25), 13888–13897, DOI:10.1021/acs.jpcc.7b03193.
- C. Wei, Radius and chirality dependent conformation of polymer molecule at nanotube interface, Nano Lett., 2006, 6(8), 1627–1631, DOI:10.1021/nl0605770.
- T. Yamamoto, Molecular dynamics simulations of polymer crystallization in highly supercooled melt: Primary nucleation and cold crystallization, J. Chem. Phys., 2010, 133(3), 034904, DOI:10.1063/1.3463393.
- S. Plimpton, Fast parallel algorithms for short-range molecular dynamics, J. Comput. Phys., 1995, 117(1), 1–19, DOI:10.1006/jcph.1995.1039.
- W. Humphrey, A. Dalke and K. Schulten, VMD: Visual molecular dynamics, J. Mol. Graphics, 1996, 14(1), 33–38, DOI:10.1016/0263-7855(96)00018-5.
- J. Gupta, C. Nunes and S. Jonnalagadda, A molecular dynamics approach for predicting the glass transition temperature and plasticization effect in amorphous pharmaceuticals, Mol. Pharm., 2013, 10(11), 4136–4145, DOI:10.1021/mp400118v.
- C. Wu, Cooperative behavior of poly(vinyl alcohol) and water as revealed by molecular dynamics simulations, Polymer, 2010, 51(19), 4452–4460, DOI:10.1016/j.polymer.2010.07.019.
- C. Wu, et al., Multi-scale progressive failure mechanism and mechanical properties of nanofibrous polyurea aerogels, Soft Matter, 2018, 14(38), 7801–7808, 10.1039/C8SM01546E.
- C. J. Shih, S. Lin, R. Sharma, M. S. Strano and D. Blankschtein, Understanding the pH-dependent behavior of graphene oxide aqueous solutions: A comparative experimental and molecular dynamics simulation study, Langmuir, 2012, 28(1), 235–241, DOI:10.1021/la203607w.
- J. A. L. Willcox and H. J. Kim, Molecular Dynamics Study of Water Flow Across Multiple Layers of Pristine, Oxidized, and Mixed Regions of Graphene Oxide: Effect of Graphene Oxide Layer-to-Layer Distance, J. Phys. Chem. C, 2017, 121(42), 23659–23668, DOI:10.1021/acs.jpcc.7b06063.
- W. L. Jorgensen, D. S. Maxwell and J. Tirado-Rives, Development and testing of the OPLS all-atom force field on conformational energetics and properties of organic liquids, J. Am. Chem. Soc., 1996, 118(45), 11225–11236, DOI:10.1021/ja9621760.
- T. Verho, A. Paajanen, J. Vaari and A. Laukkanen, Crystal Growth in Polyethylene by Molecular Dynamics: The Crystal Edge and Lamellar Thickness, Macromolecules, 2018, 51(13), 4865–4873, DOI:10.1021/acs.macromol.8b00857.
- X. Lü and J. T. Kindt, Monte Carlo simulation of the self-assembly and phase behavior of semiflexible equilibrium polymers, J. Chem. Phys., 2004, 120(21), 10328–10338, DOI:10.1063/1.1729855.
- F. Huang, Y. Lv, L. Wang, P. Xu, J. Lin and S. Lin, An insight into polymerization-induced self-assembly by dissipative particle dynamics simulation, Soft Matter, 2016, 12(30), 6422–6429, 10.1039/c6sm00912c.
- A. K. Tucker and M. J. Stevens, Study of the polymer length dependence of the single chain transition temperature in syndiotactic poly(n -isopropylacrylamide) oligomers in water, Macromolecules, 2012, 45(16), 6697–6703, DOI:10.1021/ma300729z.
- V. S. R. Jampani, R. H. Volpe, K. R. De Sousa, J. F. Machado, C. M. Yakacki and J. P. F. Lagerwall, Liquid crystal elastomer shell actuators with negative order parameter, Sci. Adv., 2019, 5(4) DOI:10.1126/sciadv.aaw2476.
- T. Yamamoto, Molecular dynamics of polymer crystallization revisited: Crystallization from the melt and the glass in longer polyethylene, J. Chem. Phys., 2013, 139(5), 054903, DOI:10.1063/1.4816707.
Footnotes |
| † Electronic supplementary information (ESI) available. See DOI: https://doi.org/10.1039/d3nr00817g |
| ‡ These authors contributed equally to this work. |
| This journal is © The Royal Society of Chemistry 2023 |