 Open Access Article
Diversity of dynamic voltage patterns in neuronal dendrites revealed by nanopipette electrophysiology†
Jeffrey
Mc Hugh‡
 *ab,
Stanislaw
Makarchuk‡
c,
Daria
Mozheiko
 ad,
Ana
Fernandez-Villegas
c,
Gabriele S.
Kaminski Schierle
 c,
Clemens F.
Kaminski
 c,
Ulrich F.
Keyser
 b,
David
Holcman§
ef and
Nathalie
Rouach§
 *af
*af
aCentre for Interdisciplinary Research in Biology, Collège de France, CNRS, INSERM, Université PSL, Labex Memolife, Paris, France. E-mail: jeffrey.mc-hugh@college-de-france.fr; nathalie.rouach@college-de-france.fr
bCavendish Laboratory, University of Cambridge, Cambridge CB3 0HE, UK
cDepartment of Chemical Engineering and Biotechnology, University of Cambridge, Philippa Fawcett Drive, Cambridge CB3 0AS, UK
dDoctoral School No 158, Sorbonne Université, Paris, France
eGroup Data Modelling, Computational Biology and Predictive Medicine, Institut de Biologie de l'Ecole Normale Supérieure (IBENS), CNRS, INSERM, Université PSL, Labex Memolife, Paris, France
fChurchill College, University of Cambridge, Cambridge CB3 0DS, UK
First published on 11th May 2023
Abstract
Dendrites and dendritic spines are the essential cellular compartments in neuronal communication, conveying information through transient voltage signals. Our understanding of these compartmentalized voltage dynamics in fine, distal neuronal dendrites remains poor due to the difficulties inherent to accessing and stably recording from such small, nanoscale cellular compartments for a sustained time. To overcome these challenges, we use nanopipettes that permit long and stable recordings directly from fine neuronal dendrites. We reveal a diversity of voltage dynamics present locally in dendrites, such as spontaneous voltage transients, bursting events and oscillating periods of silence and firing activity, all of which we characterized using segmentation analysis. Remarkably, we find that neuronal dendrites can display spontaneous hyperpolarisation events, and sustain transient hyperpolarised states. The voltage patterns were activity-dependent, with a stronger dependency on synaptic activity than on action potentials. Long-time recordings of fine dendritic protrusions show complex voltage dynamics that may represent a previously unexplored contribution to dendritic computations.
Introduction
Dendrites and dendritic spines receive a diverse range of chemical and electrical inputs and play an essential role in neuronal communication. Synaptic transmission involves the release of neurotransmitters from the presynaptic terminal, opening ligand receptors and leading to a local voltage change in the postynaptic terminal.1 Direct connection between neurons by gap junction channels can also directly modulate the membrane potential via diffusive ionic flow.2 The integrated outputs of these local voltage changes have been studied for decades using the patch-clamp technique3 at the level of the soma.During propagation, voltage signals are often transformed at the level of dendrites and dendritic spines. They can be amplified, filtered or summed,4 which are processes at the basis of dendritic and neuronal computations.5–9 More recently, voltage signals have been studied at the level of narrow axons10 and also at level of apical dendrites from human cortical neurons.8 However, studying voltage dynamics at finer, more distal neuronal dendrites has remained largely elusive. The nanoscale size of these cell compartments poses a challenge to the probing and characterisation of their local voltage dynamics11 and furthermore, to understanding the nature of computational mechanisms within dendrites.8,12
Two approaches were recently developed to surmount this obstacle. One approach employs voltage-sensitive dyes13 and can be used in vivo,14 offering the ability to study activity across multiple cells.15 Another approach makes use of quartz glass nanopipettes, which can offer insight into voltage dynamics localised to domains of nanoscale cellular compartments, as recently demonstrated with direct recordings of voltage signals from dendritic spines over short time periods16in vitro and from dendrites in vivo.17
Nanopipettes offer several advantages over optical and other nanoscale electrophysiology methods. Nanopipettes are capable of considerably greater temporal resolution than can be achieved by imaging voltage-sensitive dyes with typical galvo- or resonant scanning microscopes (30–60 Hz vs. 10 kHz), while offering better signal-to-noise ratios. They can also achieve a higher signal-to-noise ratio compared to extracellular electrodes or intracellular metallic electrodes16,18 and importantly, they can be readily incorporated into existing electrophysiology hardware, simply replacing conventional micropipettes when one wishes to target smaller cellular compartments.
Here, we investigate the spontaneous dynamics of the membrane potential in rat and mouse neuronal dendrites in vitro, obtained directly using nanopipettes. Intriguingly, in recording signals over long time frames, on the order of an hour or more, repetitive, dynamic voltage patterns were observed, such as large amplitude oscillations, repetitive and fast spiking, and bursting events. Interestingly, we also report transient hyperpolarised states in neuronal dendrites. The long-time recordings of neuronal dendrites we report here reveal an unexpected variety of dynamic voltage patterns that might reflect local information processing in dendritic nanodomains.
Results
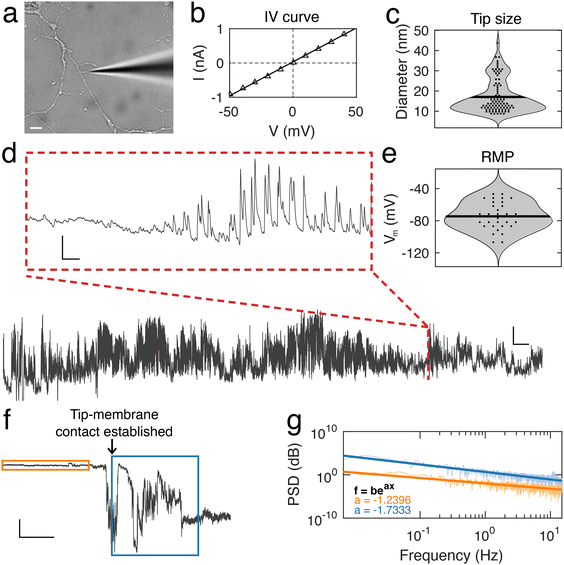
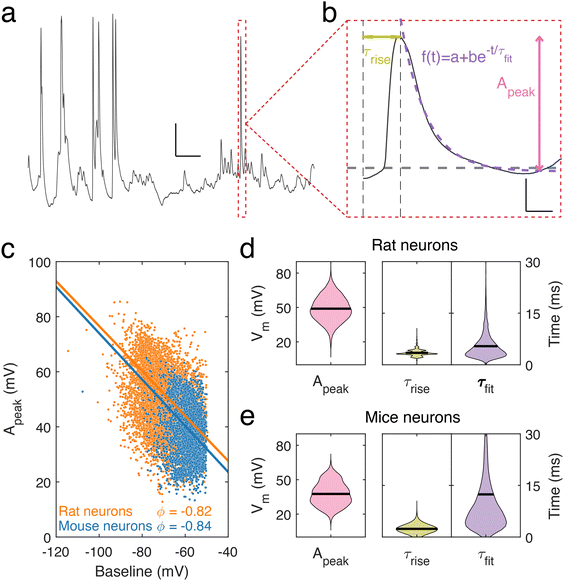
Using nanopipettes, we recorded electrophysiological signals from dendrites of rat and mouse neurons in vitro (Fig. 1a), obtaining long-lasting and stable recordings of more than an hour. Nanopipette size was characterized by recording current–voltage responses (Fig. 1b) and inputting the calculated resistance into our tip sizing model (Methods, ESI nanopipette conductance model, Fig. S1†). The mean aperture size of nanopipettes used was 17.1 ± 0.8 nm (n = 131) (Fig. 1c). Nanopipette recordings revealed large amplitude spontaneous activity from neuronal dendrites (Fig. 1d) and exhibited low levels of noise (mean bath noise: 0.5 ± 0.02 mV and mean noise during recordings: 1.7 ± 0.1 mV, n = 54 neurons). We found that the distribution of resting membrane potentials (RMP) recorded from dendrites with nanopipettes (Fig. 1e) was in line with somatic recordings under physiological conditions (mean Vm: −74.5 ± 2.35 mV, n = 54 neurons, indicating an excellent seal between the nanopipette tip and the dendrite membrane.19 Electrical contact with cells was achieved by physical contact alone (Fig. 1f and Fig. S2†), with no negative pressure or electroporation used. The recorded potential (Vm) remained stable during the approach to each dendrite, followed by a sharp decrease at the point the nanopipette tip and dendrite were in focus together, indicating intracellular access, occurring with no pressure change or electrical stimulation. Following this the tip-membrane contact was left unperturbed and spontaneous activity was recorded. The power spectral density (PSD) of the signal before and after contacting the cell revealed an increased amplitude at all frequencies after intracellular access (Fig. 1g). The PSD of the signal before contacting the cell showed no specific peaks in frequency, while after contact, there were prominent peaks around 10 Hz, a characteristic frequency of electrophysiological neuronal signals.20 To obtain further confirmation that a successful contact had been established with the cell membrane, we characterized nanopipette noise by fitting an exponential to the PSDs of the nanopipette bath and patch signals. We observed that when the nanopipette was in contact with the cell, the PSD displays a more negative slope, in line with changes reported for nanopipette noise resulting from different molecular environments.21,22To describe the electrical properties of neuronal dendrites, we studied local spontaneous activity (Fig. 2a). Spontaneous activity events were decomposed into single events, characterized by fast rise and slow decay times, followed by stable baselines (Fig. 2b). Events from both rat and mouse neuronal dendrites were characterized using three parameters: the rise time τrise, the decay time τfit, and the amplitude, Apeak (ESI data analysis section†). We report a trend common to both datasets – the amplitude, Apeak, increases at more hyperpolarised baseline values, indicating that the degree of depolarization during a voltage transient was greater at more negative Vm (Fig. 2c). To identify how the baseline voltage influenced the amplitude, the largest eigenvalue of the inertia tensor of the data points was computed (ESI data analysis section†). We found little difference between the major axes computed for rat and mouse neuronal dendrites. From this analysis, an upper limit of −15 mV to −8 mV for Vm during voltage transients was determined. The mean transient amplitude of spontaneous activity was higher for rat than mouse dendrites (49 ± 0.13 mV, n = 7537 and 37 ± 0.19 mV, n = 2882, respectively, p < 0.0001, t test with Welch correction), while the rise and decay dynamics of dendritic transients were increased and decreased respectively in rat dendrites (rat: rise time: 3.5 ± 0.01 ms, decay time: 5.4 ± 0.04 ms, n = 7537; mouse: rise time: 2.4 ± 0.01 ms, decay time: 12.4 ± 0.3 ms, n = 2882, p < 0.0001, t test with Welch correction) (Fig. 2d and e). We also measured event characteristics as a function of distance from the soma to the point along the target dendrite where the nanopipette made contact and found no correlation using linear fitting (Fig. S3†).
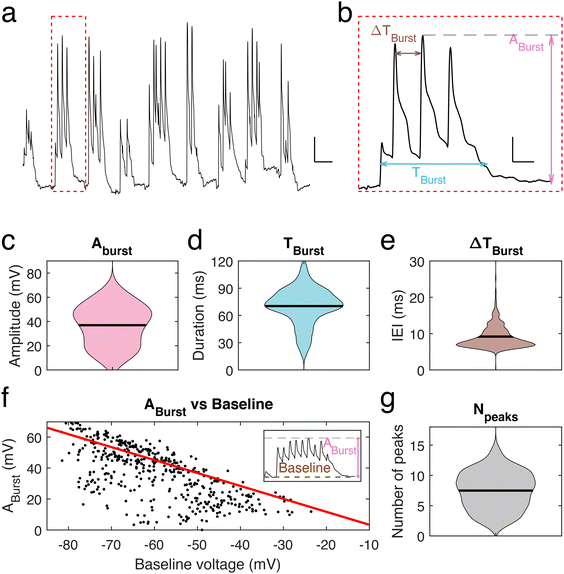
To further investigate the voltage properties of mice neuronal dendrites using our nanopipettes, bursting events were induced by using a pro-bursting solution (with 0 mM MgCl2 and 6 mM KCl)23 (Fig. 3a). Bursting activity was quantified by determining three parameters (Fig. 3b): the amplitude, Aburst, of the highest peak in a burst, the duration, Tburst, of a burst and the inter-event interval (IEI) time, ΔTburst. The mean burst amplitude was 36.9 ± 0.8 mV (n = 445 bursts, Fig. 3c), the mean burst duration was 70.3 ± 0.95 ms (n = 445, Fig. 3d), and the mean IEI was 9.2 ± 0.2 ms (n = 445, Fig. 3e). We observed that Aburst decreases as the baseline voltage becomes more depolarized, correspondingly membrane potential rarely exceeded an upper value of −15 mV to −10 mV during a burst (Fig. 3f), as observed for spontaneous transients, suggesting a limit to depolarization within these dendrites and in line with the calculated inertia tensor (slope = −0.83). Finally, we found that the number of peaks per bursting event is in the range 5–11. On rare occasions, more than 11 peaks were observed (Fig. 3g). However, no significant correlation between the number of peaks within one burst and its amplitude was found.
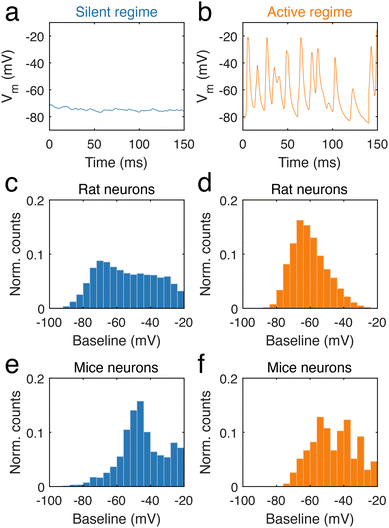
During long-term recordings, two categories of neural activity were chiefly observed, one characterized by an absence of electrical activity, and the other by frequent and fast potential changes. The first is a silent regime, which was defined as regions of the trace during which potential changes were small, with no event above 5 mV (ESI data analysis section†). In contrast, the second type of behaviour corresponds to an active regime, defined by a high frequency of neural activity (ESI data analysis section†). In neuronal dendrites, periods of stable silence (n = 3536 for mouse and n = 18![[thin space (1/6-em)]](https://www.rsc.org/images/entities/char_2009.gif) 969 for rat, Fig. 4a, Fig. S4a and c†) and abundant firing (n = 195 for mouse and n = 2702 for rat, Fig. 4b, Fig. S4b and d†) were analysed. In rat dendrites, we found that the silent regime was largely independent of the baseline voltage (Fig. 4c), in contrast to the active regime (Fig. 4d), where voltage changes occurred at approximately −70 mV. The silent regime in rat dendrites contrasted with the silent regime in mice dendrites (Fig. 4e), as the latter was mostly observed at −50 mV. In mouse dendrites (Fig. 4f), the active regime onsets in the range −55 mV to −40 mV. We found that the frequency of regimes was somewhat variable between neurons. Silent regimes tended to be shorter than active regimes in both rat and mouse neurons, but occur at higher frequency (ESI, data analysis section†).
969 for rat, Fig. 4a, Fig. S4a and c†) and abundant firing (n = 195 for mouse and n = 2702 for rat, Fig. 4b, Fig. S4b and d†) were analysed. In rat dendrites, we found that the silent regime was largely independent of the baseline voltage (Fig. 4c), in contrast to the active regime (Fig. 4d), where voltage changes occurred at approximately −70 mV. The silent regime in rat dendrites contrasted with the silent regime in mice dendrites (Fig. 4e), as the latter was mostly observed at −50 mV. In mouse dendrites (Fig. 4f), the active regime onsets in the range −55 mV to −40 mV. We found that the frequency of regimes was somewhat variable between neurons. Silent regimes tended to be shorter than active regimes in both rat and mouse neurons, but occur at higher frequency (ESI, data analysis section†).
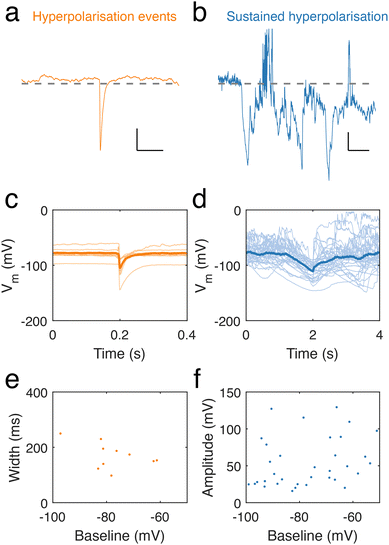
Intriguingly, throughout our recordings of neuronal dendrite spontaneous activity, we occasionally observed spontaneous, transient hyperpolarisations (10 in 9 recordings) (Fig. 5a) and longer, sustained periods of hyperpolarisation (36 in 49 recordings) (Fig. 5b). Hyperpolarisation transients featured sharp decreases in potential, followed by a slower recovery to the baseline potential (Fig. 5c). Sustained hyperpolarisation events were considerably longer than hyperpolarisation transients and featured slower dynamics, lasting over periods on the order of seconds (Fig. 5d), in contrast to hyperpolarising transients, which had durations lasting hundreds of ms (Fig. 5e), determined by measuring their full width at half minimum. There was also a trend of longer events at lower baseline membrane potential. We measured the amplitude of long hyperpolarisation events (defined as the minimum voltage per event) and found this to be independent of the baseline (Fig. 5f).
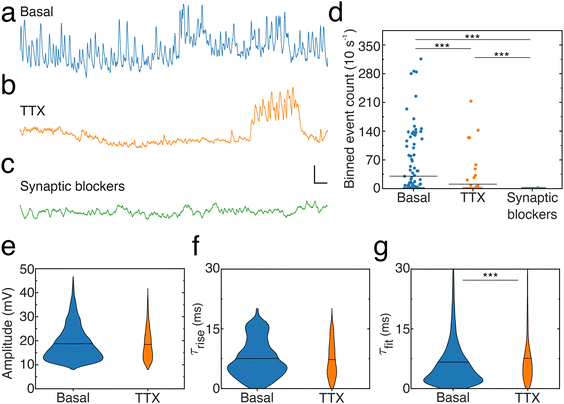
To elucidate the origin of the signals reported here, as well as verify whether noise resulting from a variable contact between the nanopipette tip and cell membrane contributes to the activity patterns, we compared activity levels and event characteristics from neuronal dendrites in the absence (Fig. 6a) or presence of pharmacological agents blocking either action potentials (Fig. 6b) by inhibiting voltage-gated sodium channels (Tetrodotoxin, [TTX]) or excitatory NMDA receptors (3-(2-carboxypiperazin-4-yl)propyl-1-phosphonic acid, [CPP]), AMPA receptors (2,3-dihydroxy-6-nitro-7-sulphamoyl-benzo(F)quinoxaline, [NBQX]) and inhibitory GABAA receptors (picrotoxin) (Fig. 6c). To account for the dynamic spontaneous activity levels observed across recordings, activity levels in each condition were quantified by dividing recordings into 10 s long bins and counting the number of events per bin (ESI, data analysis section†), termed binned event count (Fig. 6d). Blocking action potentials significantly reduced the activity as indicated by the decreased binned depolarization event count, the number of periods where events were observed and the number of times large groups of events were found close together. In addition, depolarization events recorded in the presence of TTX show similar amplitudes (Fig. 6e) and rise times (Fig. 6f) but increased and differently distributed decay times compared to the basal condition. Notably, blocking synaptic receptors virtually abolished activity: only two depolarization events were detected and they showed lowered amplitude (12.2 ± 1.1 mV) and a similar slower rise time (7.3 ± 1.0 ms) and slowed decay time (16.5 ± 1.8 ms) compared to the basal condition. In addition, hyperpolarization events were not detected in the absence of action potentials (TTX) or synaptic activity (CPP, NBQX, picrotoxin).
Conclusion and discussion
Our nanopipette approach is ideal for exploring local fluctuations of membrane potential over hour-long time scales in cellular compartments that are inaccessible to conventional patch-clamp pipettes because of their very small size (tens to hundreds of nm). Nanopipettes featured very low levels of noise and permitted detection and consequent analysis of voltage dynamics in neuronal dendrites. Experiments were successfully performed in both rat and mouse cell cultures in different set-ups, demonstrating the robustness and repeatability of our method.Previous reports of nanopipette electrophysiology required electroporation to achieve recordings of up to 30 minutes in culture.16,17 In contrast, we recorded from neuronal dendrites for up to 73 minutes with no electroporation. Contacting a dendrite was sufficient to access Vm and observe voltage dynamics. Despite this difference, characterisation of dendritic membrane potentials yielded transients with rise and decay dynamics that are in agreement with previous observations, while having amplitudes of 40 to 50 mV, significantly higher than those previously reported and notably with no signal deconvolution performed to recover these amplitudes.
Our analysis of transient events observed from dendrites suggests that they typically depolarized to between −15 mV and −8 mV at most, which could be related to the activation of ion channels such as calcium channels.24,25 In addition, here we reveal novel dendrite voltage dynamics, such as bursts and hyperpolarisation events. The substantial hyperpolarisation events we have identified may be related to inhibitory postsynaptic potentials,26 however with larger amplitudes than previously reported.27–29 The amplitude of hyperpolarisation we observed might be explained by the more confined geometry of the dendrites compared to soma. Hyperpolarization events were not found when action potentials or synaptic activity were blocked. However, because these events were only observed in a limited number of traces, it remains unclear whether they were really dependent on action potentials and synaptic activity or they were just rare events. Their origin thus remains to be further studied.
We modified activity levels using pharmacological blockers of action potentials or synaptic activity. Dendrites recorded in the absence of action potentials showed reduced activity, while it essentially ceased in the presence of synaptic blockers. This indicates that the voltage transients are caused by activation of NMDA and/or AMPA and/or GABAA receptors. This is in line with previous findings from studies done on apical dendrites in acute brain slices and in vivo, where transient voltage dynamics are predominantly attributed to NMDA receptor activity.30 This opens an avenue of future exploration for the precise cause of these dynamics through selective blocking of NMDA receptors, also offering the chance to link these in vitro findings with evidence obtained in acute tissue slices and in vivo.
In this report we have described multiple motifs of events observed using nanopipettes to target individual dendrites from a neuronal network. There is a diversity to the spontaneous activity, with multiple events such as fast bursting, rapid and large hyperpolarisation, and oscillation between two distinct regimes of activity, active and silent. It is known that through localized ion channel behaviour, voltage signals can be processed in a linear9 and non-linear manner31 at the level of neuronal dendrites.4 Altogether these processes form the basis of dendrite level signal operations, or, dendritic computations.5–8 The variety of dynamic voltage patterns that we report here may be direct observation of these transformations, and may result from a combination of local channel conductances and/or reflect the underlying network electrical activity. Further clarifying the nature of these patterns through more targeted pharmaceutical approaches and in additional models (different developmental stages, co-cultures) should be a key goal of future works and will provide new insights into dendritic processing at the nanoscale.
Materials and methods
Neuronal cultures
Cortical tissues were isolated from postnatal day 1 rats (Sprague-Dawley rats from Charles River) and digested in Dulbecco's modified Eagle's medium (Thermo Fischer Scientific, UK) containing 0.1% Trypsin and 0.05% DNase (Sigma Aldrich, UK) for 20 minutes in an incubator. The tissues were dissociated to single cell suspension by trituration through 1 mL and 200 μL Gilson pipette tips and the suspension was centrifuged at 600 rpm for 5 minutes. The supernatant was replaced by Neurobasal medium containing 2% B27 and 0.25% Glutamax (all from Thermo Fischer Scientific, UK) and the cell pellet was gently resuspended. Finally, 100![[thin space (1/6-em)]](https://www.rsc.org/images/entities/char_2009.gif) 000 cells were plated in MatTek dishes (P35G-1.5-14-C, MatTek Corp., Ashland, MA, USA). The cultures were maintained by replacing half of the medium every 7 days. A similar protocol was followed for mice cortical cultures, except that 16-day-old embryos were used, and tissues were dissociated using trituration through pipette tips without digestion. Electrophysiological experiments were performed at days 14–24 after cells were cultured. Prior to recording, rat neurons were cultured and imaged in 35 mm diameter MatTek dishes at room temperature. Rat neurons were washed with PBS and the cell medium was replaced with extracellular buffer (NaCl: 140 mM, KCl: 5.5 mM, MgCl2: 1 mM, CaCl2: 1.8 mM, HEPES: 10 mM, glucose: 10 mM). To record bursts from mice neurons a pro-bursting solution was used, which was the same as the extracellular buffer but 6 mM KCl and 0 mM MgCl2.
000 cells were plated in MatTek dishes (P35G-1.5-14-C, MatTek Corp., Ashland, MA, USA). The cultures were maintained by replacing half of the medium every 7 days. A similar protocol was followed for mice cortical cultures, except that 16-day-old embryos were used, and tissues were dissociated using trituration through pipette tips without digestion. Electrophysiological experiments were performed at days 14–24 after cells were cultured. Prior to recording, rat neurons were cultured and imaged in 35 mm diameter MatTek dishes at room temperature. Rat neurons were washed with PBS and the cell medium was replaced with extracellular buffer (NaCl: 140 mM, KCl: 5.5 mM, MgCl2: 1 mM, CaCl2: 1.8 mM, HEPES: 10 mM, glucose: 10 mM). To record bursts from mice neurons a pro-bursting solution was used, which was the same as the extracellular buffer but 6 mM KCl and 0 mM MgCl2.
Nanopipette fabrication and size determination
Quartz glass nanopipettes were produced using a Sutter P2000 pipette puller (P2000/F, Sutter Instruments, USA). To fabricate a nanopipette, a quartz capillary is clamped in two holders, themselves under tension. A laser is directed onto the centre of the capillary, heating the glass, and melting it, at which point the capillary is pulled apart. As it is pulled, the molten glass is stretched and tapered to a small opening. Flaming/Brown type pipette pullers (such as the P1000 or P97 from Sutter Instruments) are not capable of producing nanopipettes with diameters on the order of 10s of nm.16 Additionally, borosilicate glass capillaries cannot be used to produce nanopipettes because of their lower melting temperature. Nanopipettes were fabricated from quartz glass capillaries (outer diameter 0.5 mm, inner diameter 0.2 mm) that contain a glass filament of approximately 160 μm in diameter annealed to the inner wall. The purpose of this filament is to ameliorate the filling of the resultant nanopipette with electrolyte solution through capillary action.The nanopipettes we used in this work are well characterized, having previously been demonstrated in myriad nanopore sensing experiments,32,33 and their size previously confirmed by electron microscopy.34 For routine in situ characterisation of nanopore size, a current–voltage curve is recorded for each nanopipette prior to an experiment. To obtain the conductance G of the nanopipette, we measured the slope of the resulting current–voltage curve and used it with eqn (1) (based on a conical tip model described in ESI and shown in Fig. S1†) to estimate the diameter, d, of the nanopipette opening.
 | (1) |
Nanopipette electrophysiology
Nanopipettes with mean diameters of 17.1 nm made from quartz glass capillaries (parameters given in Table S1†) were used for intracellular recordings. Nanopipettes were assembled into a conventional pipette holder, and the holder was inserted into the amplifier headstage. A pressure control system was connected to the pipette holder, but we observed that applying positive or negative pressure had no observable effect on our ability to contact a cell. It is likely that no useful pressure difference could be generated given the nanometric tip size, as the pressure drop scales with R−4.35Before approaching a cell, the amplifier (Axon Axopatch 200B, Molecular Devices, USA) was operated in voltage clamp mode to record an IV curve to ascertain the tip resistance and thus, diameter. Recordings were performed in I = 0 Mode, meaning the current was clamped to 0 A and the potential measured was that across the nanopipette required to maintain 0 current.36 The sampling rate was 10 kHz and the built in four-pole Bessel filter was set to 2 kHz. Preliminary measurements suffered from drift in the nanopipette position, consequently cell contact was lost after 1–2 minutes. To increase stability, the original motor-driven micromanipulator (Patchstar, Scientifica, UK) was replaced with a piezo-based micromanipulator (uMp, Sensapex, Finland) which is physically smaller and has a finer positioning resolution at 5 nm.
Following previously reported protocols for nanopipette electrophysiology,16,17 we filled nanopipettes with 3 M KCl to minimise filtering effects caused by impedance mismatch between the nanopipette and the cell.16 The mean nanopipette tip resistance was found to be 55 ± 24 MΩ, much larger than the typical 3–7 MΩ using conventional patch clamp micropipettes,19 justifying the need for such high salt concentration. Nanopipettes were filled by placing the blunt end of the capillary into a bath of 3 M KCl, placing that into a vacuum jar and evacuating it. Rapidly releasing the vacuum caused the solution to be pushed from the bath up and into the nanopipette tip.
To contact dendrites, nanopipettes were initially approached at speed 2 on the uMp (10 μm s−1). When the tip appeared to be almost in the same focal plane as the dendrite of interest, the speed was decreased to 1 (1 μm s−1). Within 30 s of further approach if no change in Vm was seen, the speed was decreased to ‘S’ (the slowest uMp speed, dynamic with control wheel rotation rate, on the order of 100 nm s−1). The final stages of this approach are illustrated in Fig. S2† using data from the approach before a successful dendritic patch. This slow approach regularly led to a slight decrease from 0 measured potential to values ranging from −5 to −20 mV. Following small movements in the z-positioning of the tip, a sudden rapid decrease in potential was observed, indicating electrical contact to the membrane. No further manipulation of the tip-membrane contact was made at this point in terms of pressure changes or attempts to electroporate the membrane. After a period on the order of tens of seconds the potential stabilised in terms of baseline suggesting a stabilisation of the interface between the nanopipette tip and cell membrane.
Drugs
All drugs are from Tocris except for picrotoxin, which is from Sigma.Statistical analysis
Statistical analysis were performed using GraphPad Prism software v8 (USA). All data are expressed as mean ± standard error of the mean (SEM). Statistical significance was determined by two-tailed unpaired Student's t-test with Welch correction, Mann–Whitney test or Kruskall Wallis with Dunn post hoc test.Data availability
The data that support the findings of this study are available from the corresponding author upon reasonable request.Author contributions
N. R. directed the project. J. Mc H. and S. M. performed electrophysiological recordings. J. Mc H., S. M., and D. H. analysed data. D. M. and A. F. V. prepared and maintained cell cultures. G. S. K. S. contributed to the implementation of the research. J. Mc H., S. M., D. H., C. F. K., U. F. K., and N. R. designed experiments and data analysis. J. Mc H., S. M., D. H., and N. R. wrote the manuscript. N. R. and J. Mc H. devised the project. All authors contributed to the critical revision of the manuscript.Abbreviations
| A burst | Burst amplitude |
| A peak | Transient amplitude |
| CPP | 3-(2-Carboxypiperazin-4-yl)propyl-1-phosphonic acid |
| IEI | Inter-event interval |
| NBQX | 2,3-Dihydroxy-6-nitro-7-sulphamoyl-benzo(F)quinoxaline |
| PSD | Power spectral density |
| RMP | Resting membrane potential |
| T burst | Burst duration |
| τ fit | Decay time |
| τ rise | Rise time |
| TTX | Tedrotoxin |
| V m | Membrane potential |
| ΔTburst | ISI duration |
Conflicts of interest
There are no conflicts to declare.Acknowledgements
The authors thank Elena Dossi, Charles Felix-Calvo, Julien Moulard and Giampaolo Milior for discussion and technical help. J. Mc H. acknowledges funding from AFOSR (Grant No. FA9550-17-1-0118), ANR programme Investissements d'avenir (ANR-10-LABX-54 MEMOLIFE and ANR-IO-IDEX0001-02 PSL Research University) and from FRM (SPF202005011994). D. M. acknowledges funding from Q-life (ANR-17-CONV-0005). G. S. K. S. acknowledges funding from the Michael J Fox Foundation (16238). U. F. K. is supported by ERC Consolidator Grant (DesignerPores n° 647144). D. H. acknowledges funding from the European Research Council (ERC Advanced Grant OrganellenanoComp n° 882673) under the European Union's Horizon 2020 research and innovation programme, Plan Cancer-INSERM (19CS145-00) and ANR (ANR-18-NEUC-0001). N. R. and C. F. K. acknowledge funding from Cam-PSL-French Embassy. N. R. and D. H. acknowledge funding from ANR (ANR-22-CE16-0027) and ANR programme Investissements d'avenir (ANR-10-LABX-54 MEMOLIFE and ANR-IO-IDEX0001-02 PSL Research University). N. R. acknowledges the Service Enseignement Supérieur, Recherche et Innovation de l'Ambassade de France and Churchill College for the French government oversea fellowship.References
- J. J. E. Chua, S. Kindler, J. Boyken and R. Jahn, The architecture of an excitatory synapse, J. Cell Sci., 2010, 123, 819–823 CrossRef CAS.
- G. Söhl, S. Maxeiner and K. Willecke, Expression and functions of neuronal gap junctions, Nat. Rev. Neurosci., 2005, 6, 191–200 CrossRef.
- E. Neher and B. Sakmann, Single-channel currents recorded from membrane of denervated frog muscle fibres, Nature, 1976, 260, 799–802 CrossRef CAS PubMed.
- R. Yuste, Dendritic Spines, The MIT Press, 2010, DOI:10.7551/mitpress/9780262013505.001.0001.
- I. Segev, What do dendrites and their synapses tell the neuron?, J. Neurophysiol., 2006, 95, 1295–1297 CrossRef PubMed.
- G. Eyal, H. D. Mansvelder, C. P. J. de Kock and I. Segev, Dendrites impact the encoding capabilities of the axon, J. Neurosci., 2014, 34, 8063–8071 CrossRef CAS PubMed.
- O. Dan, E. Hopp, A. Borst and I. Segev, Non-uniform weighting of local motion inputs underlies dendritic computation in the fly visual system, Sci. Rep., 2018, 8, 1–12 CAS.
- L. Beaulieu-Laroche, et al., Enhanced Dendritic Compartmentalization in Human Cortical Neurons, Cell, 2018, 175, 643–651.e14 CrossRef CAS PubMed.
- M. London and M. Häusser, Dendritic computation, Annu. Rev. Neurosci., 2005, 28, 503–532 CrossRef CAS PubMed.
- P. Novak, et al., Nanoscale-Targeted Patch-Clamp Recordings of Functional Presynaptic Ion Channels, Neuron, 2013, 79, 1067–1077 CrossRef CAS.
- A. P. Alivisatos, et al., Nanotools for neuroscience and brain activity mapping, ACS Nano, 2013, 7, 1850–1866 CrossRef CAS PubMed.
- L. Goetz, A. Roth and M. Häusser, Active dendrites enable strong but sparse inputs to determine orientation selectivity, Proc. Natl. Acad. Sci. U. S. A., 2021, 118(30), e2017339118 CrossRef CAS.
- T. Kwon, M. Sakamoto, D. S. Peterka and R. Yuste, Attenuation of Synaptic Potentials in Dendritic Spines, Cell Rep., 2017, 20, 1100–1110 CrossRef CAS.
- V. H. Cornejo, N. Ofer and R. Yuste, Voltage compartmentalization in dendritic spines in vivo, Science, 2022, 375, 82–86 CrossRef CAS PubMed.
- B. Li, et al., Two-Photon Voltage Imaging of Spontaneous Activity from Multiple Neurons Reveals Network Activity in Brain Tissue, iScience, 2020, 23, 101363 CrossRef CAS PubMed.
- K. Jayant, et al., Targeted intracellular voltage recordings from dendritic spines using quantum-dot-coated nanopipettes, Nat. Nanotechnol., 2017, 12, 335–342 CrossRef CAS PubMed.
- K. Jayant, et al., Flexible Nanopipettes for Minimally Invasive Intracellular Electrophysiology In Vivo, Cell Rep., 2019, 26, 266–278 CrossRef CAS PubMed.
- M. R. Angle, B. Cui and N. A. Melosh, Nanotechnology and neurophysiology, Curr. Opin. Neurobiol., 2015, 32, 132–140 CrossRef CAS.
- K. L. Perkins, Cell-attached voltage-clamp and current-clamp recording and stimulation techniques in brain slices, J. Neurosci. Methods, 2006, 154, 1–18 CrossRef CAS PubMed.
- R. Gao, Interpreting the electrophysiological power spectrum, J. Neurophysiol., 2016, 115, 628–630 CrossRef.
- S. F. Knowles, et al., Current Fluctuations in Nanopores Reveal the Polymer-Wall Adsorption Potential, Phys. Rev. Lett., 2021, 127, 137801 CrossRef CAS.
- S. Marbach, Intrinsic fractional noise in nanopores: The effect of reservoirs, J. Chem. Phys., 2021, 154, 171101 CrossRef CAS.
- E. Dossi, et al., Pannexin-1 channels contribute to seizure generation in human epileptic brain tissue and in a mouse model of epilepsy, Sci. Transl. Med., 2018, 10, 1–14 Search PubMed.
- N. Niisato and Y. Marunaka, Ion Transport: Calcium Channels, in Encyclopedia of Respiratory Medicine, Elsevier, 2022, pp. 646–653. DOI:10.1016/B978-0-12-801238-3.11628-9.
- E. Perez-Reyes, Molecular physiology of low-voltage-activated T-type calcium channels, Physiol. Rev., 2003, 83, 117–161 CrossRef CAS PubMed.
- J. S. Coombs, J. C. Eccles and P. Fatt, The specific ionic conductances and the ionic movements across the motoneuronal membrane that produce the inhibitory post-synaptic potential, J. Physiol., 1955, 130, 326–373 CrossRef CAS.
- S. M. G. Solinas, R. Maex and E. De Schutter, Dendritic, amplification of inhibitory postsynaptic potentials in a model Purkinje cell, Eur. J. Neurosci., 2006, 23, 1207–1218 CrossRef.
- S. W. Johnson and R. A. North, Opioids excite dopamine neurons by hyperpolarization of local interneurons, J. Neurosci., 1992, 12, 483–488 CrossRef CAS PubMed.
- E. R. Kandel and W. A. Spencer, Electrophysiology of Hippocampal Neurons: II. After-Potentials and Repetive Firing, J. Neurophysiol., 1961, 24, 243–259 CrossRef CAS.
- G. Major, M. E. Larkum and J. Schiller, Active Properties of Neocortical Pyramidal Neuron Dendrites, Annu. Rev. Neurosci., 2013, 36, 1–24 CrossRef CAS PubMed.
- B. B. Ujfalussy, J. K. Makara, M. Lengyel and T. Branco, Global and Multiplexed Dendritic Computations under In Vivo-like Conditions, Neuron, 2018, 100, 579–592 CrossRef CAS.
- N. Laohakunakorn, V. V. Thacker, M. Muthukumar and U. F. Keyser, Electroosmotic Flow Reversal Outside Glass Nanopores, Nano Lett., 2015, 15, 695–702 CrossRef CAS PubMed.
- N. E. Weckman, et al., Multiplexed DNA Identification Using Site Specific dCas9 Barcodes and Nanopore Sensing, ACS Sens., 2019, 4, 2065–2072 CrossRef CAS.
- N. A. W. Bell and U. F. Keyser, Digitally encoded DNA nanostructures for multiplexed, single-molecule protein sensing with nanopores, Nat. Nanotechnol., 2016, 11, 645–651 CrossRef CAS.
- S. P. Sutera and R. Skalak, The History of Poiseuille's Law, Annu. Rev. Fluid Mech., 1993, 25, 1–20 CrossRef.
- J. Magistretti, M. Mantegazza, E. Guatteo and E. Wanke, Action potentials recorded with patch-clamp amplifiers: Are they genuine?, Trends Neurosci., 1996, 19, 530–534 CrossRef CAS PubMed.
Footnotes |
| † Electronic supplementary information (ESI) available: Description of nanopipette conductance model (Fig. S1), explanation of analysis used to characterize observed voltage dynamics, details of nanopipette puller program parameters, schematic of nanopipette approach and contact to cells (Fig. S2), plot of distance from soma against event characteristics (Fig. S3) and additional traces showing silent and active regimes (Fig. S4). See DOI: https://doi.org/10.1039/d2nr03475a |
| ‡ These authors contributed equally. |
| § These authors contributed equally. |
| This journal is © The Royal Society of Chemistry 2023 |

