 Open Access Article
Engineering 3D structure Mn/YTiOx nanotube catalyst with an efficient H2O and SO2 tolerance for low-temperature selective catalytic reduction of NO with NH3†
Rongji
Cui
ab,
Xiaosheng
Huang
 a,
Guodong
Zhang
a and
Zhicheng
Tang
 *ab
*ab
aState Key Laboratory for Oxo Synthesis and Selective Oxidation, National Engineering Research Center for Fine Petrochemical Intermediates, Lanzhou Institute of Chemical Physics, Chinese Academy of Sciences, Lanzhou 730000, China. E-mail: tangzhicheng@licp.cas.cn
bShandong Laboratory of Yantai Advanced Materials and Green Manufacturing, Yantai Zhongke Research Institute of Advanced Materials and Green Chemical Engineering, Yantai, 264006, China
First published on 31st March 2023
Abstract
TiO2 with a 3D structure is considered to be a promising support for Mn-based catalysts for the NH3-SCR reaction, but it is still insufficient to solve problems such as poor N2 selectivity and tolerance of H2O/SO2 at low temperature. In this work, a novel 3D-structured Mn/YTiOx nanotube catalyst was designed and the role of Y on the catalytic performance was investigated for the NH3-SCR reaction at low temperature. The results indicated that the Y-doped TiOx gradually transformed from nanotubes to nanosheets with the increase in Y doping, leading to a reduction in specific surface area and Brønsted acid sites. An appropriate amount of Y doping could distinctly improve the dispersion of MnOx and increase the concentration of surface Mn4+, Lewis acid sites and chemisorbed oxygen of catalysts, which was beneficial to the low-temperature NH3-SCR reaction, while excessive Y doping could cause a sharp decrease in specific surface area and Lewis acid sites. Therefore, Mn/YTiOx catalysts exhibited a volcano-type tendency in NO conversion with an increase in Y doping, and the highest activity was obtained at 3% doping, showing more than 90% NO conversion and N2 selectivity in a wide temperature window from 120 to 320 °C. The N2 selectivity and H2O/SO2 resistance of the catalysts was also enhanced with the increase in Y doping mainly due to the increased chemisorbed oxygen and electron transfer between Y and Mn. An in situ DRIFTS study demonstrated that Lewis acid sites played a more important role in the reaction than Brønsted acid sites, and the coordinated NH3 absorbed on Lewis acid sites, –NH2, monodentate nitrate and free nitrate ions were the main reactive intermediate species in the NH3-SCR reaction over an Mn/3%YTiOx catalyst. Langmuir–Hinshelwood (L–H) and Eley–Rideal (E–R) reaction mechanisms co-existed in the NH3-SCR reaction, but the L–H reaction mechanism predominated.
1. Introduction
Nitrogen oxides (NOx) emitted from the combustion of mobile and stationary sources has triggered a series of severe environmental issues, including photochemical smog, acid rain and ozone layer depletion, which cause serious damage to the ecological environment and human health.1 As the state-of-the-art denitrification strategy, the selective catalytic reduction of NOx with NH3 (NH3-SCR) has realized extensive applications in the removal of stationary source NOx. However, in cement, glass, steel and other non-electric industries, the NH3-SCR units are placed downstream of the electrostatic precipitator and the desulfurization units to avoid poisoning of the catalyst by SO2 and dust, to prolong its lifetime as long as possible. This leads to a reduction in the flue gas temperature, even below 200 °C, and reheating of the exhaust gas to reach the operating temperature of vanadium-based catalysts undoubtedly increases the operating cost and reduces the economy of the process. Therefore, considerable effort has been devoted to the development of vanadium-free catalysts for NH3-SCR at low temperature. Manganese-based catalysts exhibit remarkable catalytic performance in low-temperature NH3-SCR due to their multiple oxidation states and labile oxygen, which can promote the adsorption and activation of reactants on the surface. However, N2 selectivity and H2O/SO2 tolerance of manganese-based catalysts at low temperature still need to be further improved before achieving industrial commercialization.Rare earth metal doping is a common method to enhance the catalytic ability of Mn-based catalysts due to the unique 4f electron orbit ensuring superior performance of oxygen storage and release.2 It is reported that Ce doping can not only provide rich active oxygen to accelerate the redox circle of Mn3+ + Ce4+ ↔ Mn4+ + Ce3+, thus improving catalytic efficiency, but also promoting the formation of bulk-like sulfate and alleviating the poisoning of SO2 to MnOx by preferentially reacting with SO2.3 The effect of Sm doping on an Mn-based catalyst was studied by Meng et al.,4 and the results showed the promotion effect of Y doping on the increase in the amount of surface active oxygen and Mn4+ and specific surface area, thus improving the absorption and activation ability for NH3 and NO. Moreover, an enhancement in resistance to both H2O and SO2 was obviously observed. Similarly, doping of Eu could also increase the concentration of chemisorbed oxygen and surface Mn4+, restraining the crystallization of MnOx, hinder the generation of ammonium sulfate and maintain better adsorption capacity for NH3.5,6 Yu found that doping Pr into MnOx/SAPO-34 catalysts could prevent active components from sulfation and inhibit the generation of ammonia bisulfate.7 Niu et al.8 indicated that doping with Tm could improve the surface acidity and reducibility of Mn-based catalysts, contributing to the adsorption and activation of NH3 and NO. Zhang et al.9 developed Y-doped TiO2 by replacing Ti4+ with Y3+, followed by MnOx loading. It was found that the catalytic efficiency was improved due to the increasing amount of superoxide ions in surface active oxygen and NO oxidation, which was generated from the interaction between WO3 and TiO2 owing to F doping. Thus, the role of rare earth metals in the NH3-SCR reaction is mainly reflected in an improvement in the redox ability and SO2/H2O tolerance of Mn-based catalysts.
TiO2 has been widely used as a carrier of catalysts in the NH3-SCR reaction owing to the advantages of chemical stability, non-toxicity and easy access, and the morphologies of TiO2 are reported to have a significant effect on catalytic ability. In our previous work,10 flower-like TiO2 as a support contributed to improving catalytic activity and resistance to H2O and SO2 by increasing the surface atomic ratio of Ce3+/(Ce3+ + Ce4+), surface active oxygen and the acid property. Besides, Qin et al.11 pointed out that the unique flower-like structure can improve the dispersion and interaction of the active species Mn and Ce, thereby facilitating the “fast SCR” reaction. Cheng et al.12 suggested that 3D TiO2 microspheres consisting of nanorods can promote the dispersion of CeO2 through a strong interaction with CeO2, and enhance the surface acidity, oxygen vacancies and redox property of the catalyst, hence improving the catalytic ability. TiO2 nanosheets exposed with (001) facets (TiO2-NS) were prepared by Li et al.,13 and it was proved to improve the specific surface area and the amount of chemisorbed oxygen and acid sites. The catalytic efficiency of the Mn–Ce/TiO2-NP catalyst was 30% lower than that of Mn–Ce/TiO2-NS in the temperature range 100–160 °C. Furthermore, TiO2 nanotubes are at the leading edge of TiO2 nano-materials, and are recognized as promising supports for SCR catalysts. The special nano-tubular structure and large surface area of TiO2 nanotubes are conducive to the high dispersion of active species and short diffusion length of reaction gases, which greatly increase the NOx conversion of catalysts at 100–300 °C.14 Likewise, Cu supported on TiO2 nanotubes has been reported to exhibit much higher NO conversion as well as excellent N2 selectivity compared with that supported on TiO2 nanoparticles, owing to a strong redox property and adsorption capability.15 Furthermore, the confinement effect of nanotubes can not only effectively reduce the grain size of active components, but also prevent them from sulfation.16,17
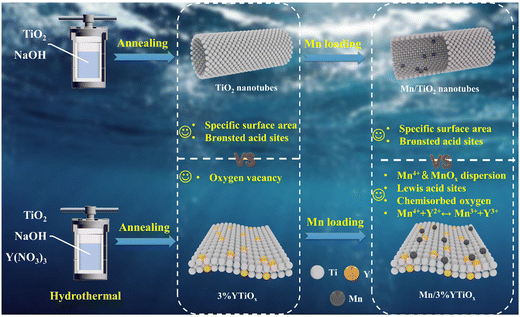
As mentioned above, both regulating the morphology of the TiO2 support and doping with rare earth metals can improve the catalytic performance and H2O/SO2 tolerance of Mn-based catalysts. Enlightened by these facts, we added rare earth metal Y to the mixture of TiO2 powder and NaOH for the hydrothermal synthesis of titanium nanotubes in this work. The impact of Y doping on the physicochemical properties of TiO2 nanotubes, and the further effect on catalytic performance of Y-doped TiO2 supported MnOx catalysts was investigated through a variety of characterization methods and tests of the catalytic ability and tolerance of H2O/SO2. In situ DRIFTS experiments were also carried out to explore the mechanism of the NH3-SCR reaction over the Y-doped TiOx supported MnOx catalyst.
2. Experimental section
2.1. Synthesis of TiO2-NT and YTiOx
The TiO2 nanotubes were synthesized by a typical hydrothermal treatment reported in the literature.18 First, 2.5 g of commercial P25 TiO2 powder (Degussa, Germany) was dissolved in 70 mL of 10 M NaOH solution in a Teflon-lined autoclave, and hydrothermally treated at 150 °C for 24 h. After the hydrothermal treatment, the slurry was filtered, washed with deionized water several times until the pH was close to 7, and then dispersed in 0.1 M HCl solution. After stirring for two hours, the mixture was washed again with deionized water until neutral, then dried at 80 °C for 12 h, ground in a mortar and calcined at 400 °C for 2.5 h. Finally, the resulting TiO2 nanotubes were prepared, and denoted TiO2-NT. The preparation process for Y-doped TiO2 with a doping amount of 1%–5% followed the aforementioned method, except that Y(NO3)3·6H2O was initially added to the mixture of TiO2 powder and NaOH, and the doping amount refers to the molar ratio of Y to Ti. The resulting Y-doped TiO2 were denoted 1%YTiOx, 3%YTiOx and 5%YTiOx, respectively.2.2. Synthesis of Mn/TiO2-NT and Mn/YTiOx
Y-doped TiO2 nanotubes with 15% manganese loading were carried out by a vacuum-assisted incipient-wetness impregnation method. An Mn(NO3)2 solution of required concentration was dropped onto the support, and the resulting mixture was left for 12 h in a vacuum environment, followed by 12 hours of drying at 80 °C and 4 hours of calcining at 450 °C. The resulting catalysts were obtained and denoted Mn/TiO2-NT, Mn/1%YTiOx, Mn/3%YTiOx and Mn/5%YTiOx, respectively, according to the doping ratio of Y on the support.2.3. Catalyst characterization
The instruments and methods used for characterization are detailed in the ESI.†2.4. Catalytic performance evaluation
The experimental description and calculation method of catalyst performance evaluation are described in ESI.†3. Results and discussion
3.1. Bulk structure analysis
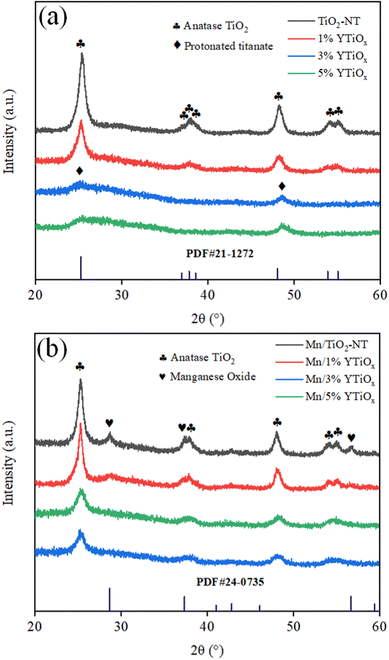
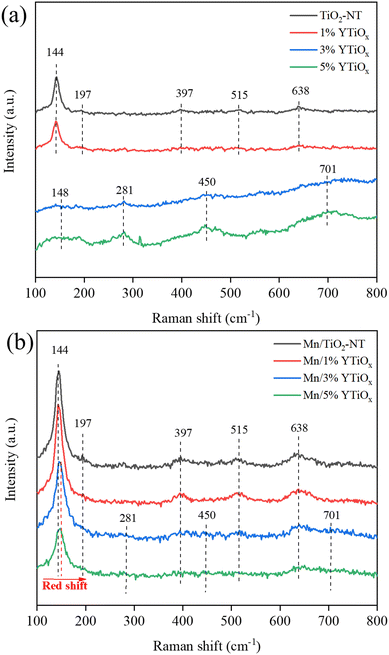
Fig. 1 shows the XRD patterns of Y-doped TiO2 and its supported MnOx catalysts. It can be observed from Fig. 1(a) that TiO2 nanotubes without Y doping exhibited peaks at 2θ = 25.3, 37.7, 48.0, 53.8, and 55.0°, which are ascribed to the standard XRD patterns of anatase (JCPDS, card 21-1272).19 This revealed that anatase TiO2 was the main crystal phase of the tube wall of TiO2 nanotubes synthesized by the traditional alkaline hydrothermal method. When doping with 1% Y, the full width at half maximum intensity of the (101) diffraction line of the anatase phase (FWHM, 2θ = 25.3°) increased from 1.03 to 1.12, suggesting a decrease in crystallinity. This was mainly due to the partial substitution of Ti4+ in the TiO2 lattice by Y3+ during hydrothermal synthesis and the lattice distortion caused by the different ionic radii of Y3+ (0.089 nm) and Ti4+ (0.068 nm). When the doping amount increased to 3% and 5%, the characteristic peaks of anatase disappeared completely accompanied by the emergence of two diffuse peaks at 2θ = 26.5 and 48.7°, which were ascribed to layered protonated titanate (JCPDS, card 47-0124) with poor crystallinity.20 In addition, no characteristic peaks related to Y2O3 can be observed in the XRD patterns of all supports owing to the low content and high dispersion of Y2O3 in titanate. After loading manganese, three peaks at 28.8, 57.4 and 37.7° can be observed on the Mn/TiO2-NT catalyst (Fig. 1b) in addition to the characteristic peaks of anatase, which were assigned to the typical XRD patterns of manganese oxide (JCPDS, card 24-0735).21 But it is worth noting that the peak intensity of manganese oxide decreased at 1% Y doping and disappeared at 3% and 5% Y doping, indicating that Y doping in TiO2 greatly improved the dispersion of manganese oxide on the TiOx support. Interestingly, the characteristic peaks of anatase rather than protonated titanate were observed in Mn/3%YTiOx and Mn/5%YTiOx, which may be due to the protonated titanate in the supports being transformed into anatase TiO2 again after manganese loading and calcination treatment.The crystalline phase structure of the supports and catalysts were studied by Raman spectroscopy. As shown in Fig. 2(a), TiO2-NT presented five Raman bands at 144, 197, 397, 515 and 638 cm−1, corresponding to the Raman vibration modes of Eg, Eg, B1g, A1g + B1g and Eg, respectively. The six Raman modes (A1g + 2B1g + 3Eg) perfectly match the crystal structure of anatase TiO2.22 With the addition of 1% Y, the FWHM of the Raman peak at 144 cm−1 increased, implying the variation of Ti–O–Ti bands in octahedral TiO6. When doping with 3% Y, the Raman bands related to anatase TiO2 disappeared, and bands at 148, 281, 450 and 701 cm−1 were observed, which were assigned to the Ti–O–Ti vibrations for layered lepidocrocite titanate (HxTi2−x/4□x/4O4, where □ represents a vacancy), a kind of protonated titanate.23 This indicated that the main component of the support had changed from anatase TiO2 to layered lepidocrocite titanate at 3% Y doping, which was consistent with the XRD results. As the doping amount increased to 5%, the Raman peaks were further enhanced in intensity. Only Raman peaks of anatase TiO2 can be observed in the Mn/TiO2-NT and Mn/1%YTiOx catalysts in Fig. 2(b). The Mn/3%YTiOx and Mn/5%YTiOx catalysts showed the Raman peaks of layered lepidocrocite titanate whose intensities were significantly lower than those of their respective supports, as well as anatase TiO2 which was not observed in their supports. This phenomenon proved again that Mn loading could lead to transformation from layered lepidocrocite titanate to anatase TiO2. It can be speculated that Mn ions were inserted into the cationic vacancies of layered lepidocrocite titanate during the process of loading, thus inducing structural re-arrangement to reach a stable state, which also explained why Y doping could improve the dispersion of MnOx. A red shift and weakening of anatase TiO2 bands can be seen from Mn/1%YTiOx to Mn/5%YTiOx, which were ascribed to the enhanced lattice distortion and increased oxygen vacancies caused by Y doping. In addition, no Raman bands for MnOx or Y2O3 were detected in the catalysts due to the good dispersion on the supports.
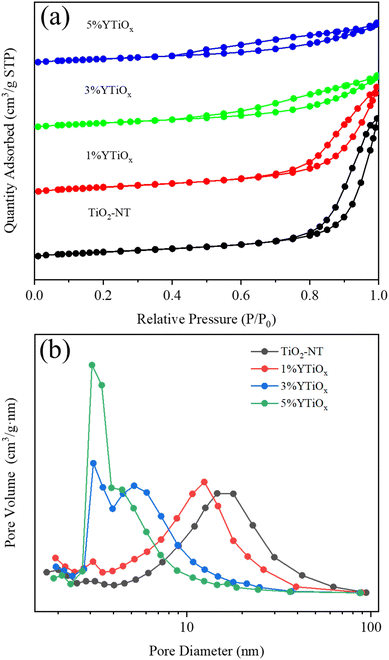
Fig. 3 displays N2 adsorption–desorption isotherms and pore size distributions of Y-doped TiO2. The textual parameters of Y-doped TiO2 are summarized in Table 1. TiO2-NT and 1%YTiOx showed typical IV curves with hysteresis loops of type H3 assigned to the characterization of crack-like pores resulting from the curling-up of nanosheets.24 Moreover, the unique hollow tubular structure of TiO2-NT led to a high specific surface area of 250.50 m2 g−1 and pore volume of 1.38 cm3 g−1. For 3%YTiOx and 5%YTiOx, the isotherms similarly exhibited a typical IV curve, but with the loop at a relative pressure above 0.4, suggesting the existence of mesopores from stacked nanosheets.25 The change in pore structure was directly reflected in the specific surface and pore volume, and pore diameter. When the doping amount increased from 1% to 5%, the specific surface area decreased from 246.01 to 191.94 m2 g−1, the pore volume decreased from 1.05 to 0.43 cm3 g−1 and the averaged pore diameter decreased from 13.21 to 5.79 nm. It can be concluded that the morphology of the support changed from nanotubes to nanosheets with the increase in Y doping, resulting in a reduction in specific surface area, pore volume and mean pore diameter. In particular, when the doping amount reached 5%, the specific surface area of the support was significantly reduced, which was unfavorable for the adsorption and diffusion of reactants.
| Sample | Specific surface area (m2 g−1) | Pore volume (cm3 g−1) | Average pore diameter (nm) |
|---|---|---|---|
| TiO2-NT | 250.50 | 1.38 | 17.87 |
| 1%YTiOx | 246.01 | 1.05 | 13.21 |
| 3%YTiOx | 218.06 | 0.55 | 7.10 |
| 5%YTiOx | 191.94 | 0.43 | 5.79 |
3.2. TEM analysis
The morphological characterization and microstructure of the supports and catalysts were further investigated through high resolution transmission electron microscopy (TEM/HR-TEM). The TEM and HR-TEM images of TiO2-NT, 1%YTiOx, 3%YTiOx, 5%YTiOx and Mn/3%YTiOx are depicted in Fig. 4. It can be observed that TiO2-NT displayed an open-ended nanotubular structure of 100–200 nm in length. The uniform outer and inner diameter for TiO2-NT were 12 nm and 6 nm, respectively (Fig. 4a). This indicated that the TiO2 nanotubes can be prepared successfully from a TiO2 precursor (Degussa P25) under current experimental conditions. Whereas well-defined nanotubes were significantly changed due to the addition of Y species, as shown in Fig. 4(b). While some nanotube structure can still be observed, a large number of nanosheets and nanorolls are present in the TEM image. The d-spacing of the lattice fringes in 1%YTiOx was measured as 0.35 nm, which is close to the (101) plane of TiO2.26 It is generally recognized that titanate nanosheets are first formed from TiO2 nanoparticles in a concentrated solution of NaOH, and then are slowly rolled into semi-finished nanotubes of short size under high temperature and high pressure, which are finally grown into finished nanotubes with a complete structure through the dissolution–reprecipitation mechanism.27 The presence of a large number of nanosheets and nanorolls, as shown in Fig. 4(b), revealed that the process of rolling nanosheets into nanotubes was greatly restricted due to the destruction of the anatase crystal phase by Y doping.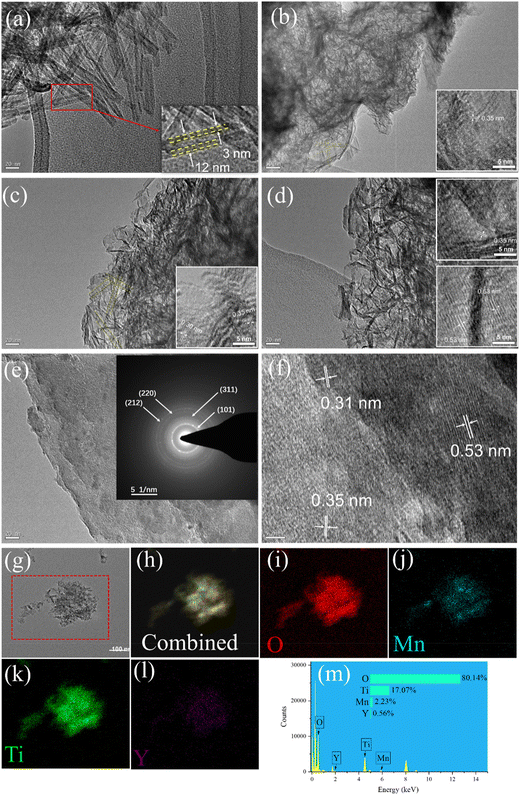 | ||
| Fig. 4 TEM and HR-TEM images of (a) TiO2-NT, (b) 1%YTiOx, (c) 3%YTiOx, (d) 5%YTiOx and (e–f) Mn/3%YTiOx and (g–m) EDX-mapping of Mn/3%YTiOx. | ||
As displayed in Fig. 4(c), when doped with 3% Y species, a small amount of nanotubes can still be observed, and the rest were mainly nanosheets. The crystal plane (101) of TiO2 and the crystal plane (222) of Y2O3 were observed, corresponding to the lattice fringes measured at 0.35 and 0.30 nm, respectively. This illustrated that Y species were well doped in the titanium nanosheets by partially substituting Ti4+ in the hydrothermal process. When doped with 5% Y, the nanotubes can hardly be observed in the obtained products, as shown in Fig. 4(d). From the HRTEM images, 5%YTiOx displayed distinct lattice fringes with an interlayer spacing of 0.35 and 0.53 nm, and the latter could be classified as the (200) plane of Y2O3. As shown in Fig. 4(e), MnOx loading makes the original nanosheets fuse together without obvious agglomeration in the Mn/3%YTiOx catalyst, indicating that the MnOx components had good dispersion on 3%YTiOx. Moreover, the distinct diffraction rings were well attributed to the (101) and (212) planes of MnO2 (400), and the (220) and (311) planes of Mn3O4. As depicted in Fig. 4(f), lattice fringes with a distance of 0.31 nm ascribed to the (110) plane of MnO2 and lattice fringes corresponding to the (200) plane of Y2O3 and the (101) plane of TiO2 were detected. As shown in Fig. 4(g–l), a high dispersion of Mn, Y, Ti and O was observed, indicating the uniform doping of Y in TiO2 and the even loading of Mn on the support.
3.3. H2-TPR analysis
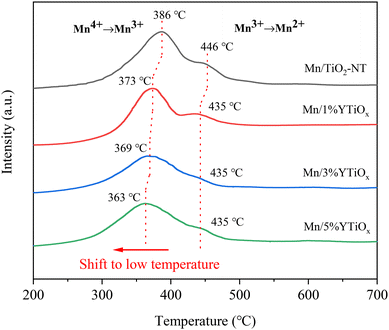
The H2-TPR results of Y-doped TiO2 and Y-doped TiO2 supported MnOx catalysts are depicted in Fig. S1† and Fig. 5. As shown in Fig. S1,† a weak peak at 573 °C for TiO2-NT was related to the reduction of Ti4+ to Ti3+, and the small peak area indicated that the reduction of TiO2 is difficult.28 However, the reduction peak at 570 °C for the Mn/1%YTiOx catalyst was mainly assigned to the reduction of Y2O3.29 It was clearly seen that the peak intensity and temperature of Y2O3 reduction increased with the increasing amount of Y doping, which may be due to the increase in Y content in TiO2 and the enhancement of the interaction between Y and TiO2, respectively. It can be observed from Fig. 5 that Mn/TiO2-NT showed two reduction peaks at 386 °C and 446 °C, which could be attributed to the reduction of Mn4+ to Mn3+ and Mn3+ to Mn2+, respectively.14,30 However, the reduction peaks of Mn4+ to Mn3+ and Mn3+ to Mn2+ shifted toward low temperature with an increase in Y doping amount, suggesting that Y doping could effectively improve the reducibility of Mn-based catalysts. In conjunction with the above discussion, the enhancement of reducibility may be related to the smaller MnOx grain size due to the high dispersion and the increased surface oxygen mobility caused by the abundant oxygen vacancies. Besides, as a rare earth element, the excellent oxygen storage and release performance of Y and the redox cycle between Y and Mn can also accelerate the surface oxygen mobility, thereby improving the redox performance of the catalyst. However, the outstanding redox performance is generally considered to greatly enhance the catalytic ability of Mn-based catalysts in the NH3-SCR reaction.3.4. NH3-TPD analysis
Considering the important role of catalyst acidity in NH3 adsorption and activation, the amount and strength of surface acid sites of Y-doped TiO2 and Y-doped TiO2 supported MnOx catalysts were investigated and the NH3-TPD profiles are presented in Fig. S2† and Fig. 6, respectively. As presented in Fig. S2,† TiO2-NT showed two NH3 desorption peaks at about 200 °C and 350 °C, corresponding to desorption of NH3 adsorbed on weak acid sites and medium strong acid sites of the catalysts, respectively. For TiO2 nanotubes, the weak acid sites are derived from Lewis acid sites brought about by the coordination of the unsaturated Ti4+ structure and the medium strong acid sites originate from Brønsted acid sites stemming from the Ti–OH groups.31 It is obvious from 1%YTiOx that Y doping can distinctly diminish the medium strong acid sites of TiO2-NT. Masaaki et al.32 reported that Brønsted acid sites could be effectively formed from the lattice distortion caused by the scrolling of titanate nanosheets. Therefore, the sharp decrease in the amount of Brønsted acid sites may be related to the morphological transformation from nanotubes to nanosheets due to Y doping. Moreover, the amount of weak acid sites was gradually reduced with the increase in Y doping amount. This can be ascribed to the increase in the amount of layered lepidocrocite titanate and the decrease in the specific surface area, and the amount of exposed Lewis acid sites on layered lepidocrocite titanate is much lower than that of anatase TiO2.32 As shown in Fig. 6(a), Mn loading reduced the amount and strength of weak acid sites by comparing TiO2-NT and Mn/TiOx-NT. Mn/TiOx-NT also showed a lower amount of medium strong acid than TiO2-NT, which was attributed to the replacement of H+ in Brønsted acid sites by Mn4+ during the impregnation process. For Y-doped TiO2 supported MnOx catalysts, they all exhibit four peaks at temperatures below 300 °C and one peak at temperatures above 300 °C, related to weak acid and medium strong acid, respectively. The strength and amount of medium strong acid decreased with an increase in Y doping, while the amount of weak acid increased first and then decreased with an increase in Y doping amount. Combined with Raman, BET and TPR results, it was believed that the increase in the amount of oxygen vacancies caused by Y doping could lead to an increase in the amount of unsaturated Ti4+ and high-valence Mn ions, which acted as Lewis acid sites, and finally showed an increase in weak acid sites from Mn/TiO2-NT to Mn/3%YTiOx catalysts. However, the sharp decrease in weak acid sites of the Mn/5%YTiOx catalyst may be related to the obvious reduction in its specific surface area and pore volume. In addition, it can obviously be observed from Fig. 6(b) that the ratio between weak acid and medium strong acid increased with an increase in doping amount.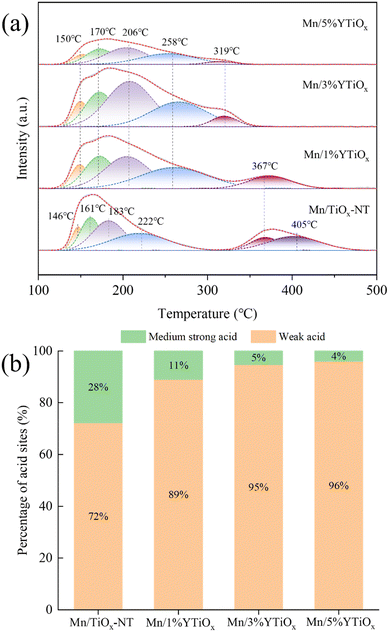 | ||
| Fig. 6 NH3-TPD profiles (a) and percentages of surface acidity (b) of Mn/TiO2-NT and Y-doped TiO2 supported MnOx catalysts. | ||
3.5. XPS analysis
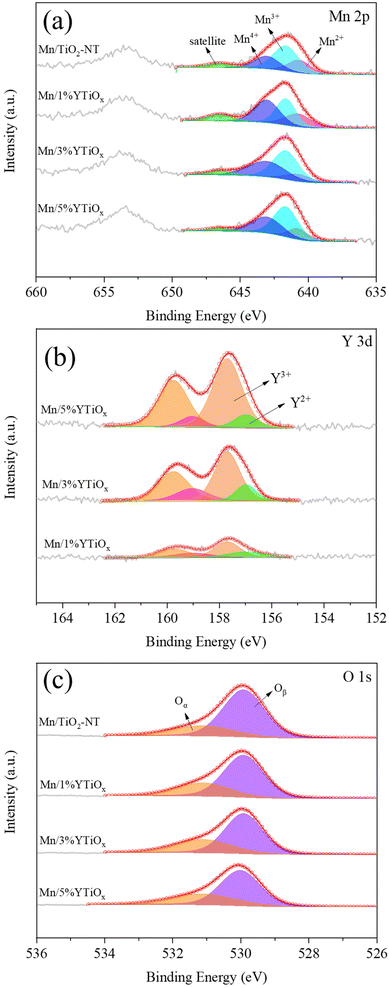
XPS was performed to analyze the surface chemical compositions and chemical states of the elements present in the catalysts. Mn 2p, O 1s, Y 3d and Ti 2p spectra of the catalysts are demonstrated in Fig. 7 and Fig. S3,† and were deconvoluted by the Gaussian–Lorentzian curve fitting method for identification of the chemical states of these elements, and the relative amount of different elements and their different valence states are summarized in Table 2 and Table S1.† The measured ratios of Y/Ti of the catalysts were consistent with the calculated values, while the measured ratios of Mn/Ti of the catalysts were slightly lower than the calculated values, as shown in Table S1.† In Fig. 7(a), two peaks at 638–648 eV and 648–658 eV can clearly be observed in the Mn 2p spectra for all catalysts, which were ascribed to the spin–orbital peaks of Mn 2p3/2 and Mn 2p1/2. Through peak-fitting deconvolution, the Mn 2p3/2 peaks were divided into four peaks centered on 640.7, 641.6, 643.0 and 646.7 eV, corresponding to Mn2+, Mn3+, Mn4+ and the satellite peak.33 As can be observed from Table 2, the ratio of Mn4+/Mn for Mn/TiO2-NT was 29.8%, but the ratio for Mn/1%YTiOx was 45.5%, and the value went up slightly and then decreased with increasing Y doping amount, reaching a maximum at 3% doping content. This indicated that the content of Mn4+ can be increased due to the presence of more oxygen vacancies caused by doping with an appropriate amount of Y, while the Mn4+ species and the redox cycle between Mn4+ and Mn3+ were considered to play a crucial role in the low-temperature NH3-SCR reaction by promoting NO oxidation to NO2.34 However, the ratio of Mn4+/Mn3+ was decreased as the Y doping amount increased from 1% to 5%, which showed that the decreased Mn4+ content of the Mn/5%YTiOx catalyst may be attributed to the enhanced reduction of Mn4+ to Mn3+.| Catalyst | Mn 2p (%) | Y 3d (%) | O 1s (%) | Surface ion ratio | ||||||
|---|---|---|---|---|---|---|---|---|---|---|
| Mn4+ | Mn3+ | Mn2+ | Y3+ | Y2+ | Oα | Oβ | Mn4+/Mn3+ | Y3+/Y2+ | Oα/Oβ | |
| Mn/TiO2-NT | 29.8 | 53.5 | 16.7 | — | — | 25.2 | 74.8 | 0.55 | — | 0.34 |
| Mn/1%YTiOx | 45.5 | 37.8 | 16.7 | 66.9 | 33.1 | 30.1 | 69.9 | 1.20 | 2.02 | 0.43 |
| Mn/3%YTiOx | 46.6 | 46.6 | 6.8 | 79.2 | 20.8 | 33.8 | 66.2 | 1.00 | 3.81 | 0.51 |
| Mn/5%YTiOx | 43.2 | 50.7 | 6.1 | 86.7 | 13.3 | 33.9 | 66.1 | 0.85 | 6.52 | 0.51 |
As exhibited in Fig. 7(b), two peaks centered at about 157.6 eV and 159.7 eV were detected in the Y 3d spectra of all the catalysts and are related to the spin–orbital peaks of Y 3d5/2 and Y 3d3/2, respectively. The Y 3d5/2 peaks were divided into two peaks centered on 156.9 and 157.7 eV, corresponding to Y2+ and Y3+, respectively.35 It can clearly be observed that the content of Y3+ and the ratio of Y3+/Y2+ were improved with increasing amount of Y doping. The opposite change in ratios of Mn4+/Mn3+ and Y3+/Y2+ with increasing Y indicated that there was electron transfer from Y to Mn in the catalysts through the redox cycle of Mn4+ + Y2+ ↔ Mn3+ + Y3+, and this redox cycle was also reflected in the H2-TPR results.
As shown in Fig. 7(c), the peaks located at 531.1 eV can be assigned to the surface oxygen species (Oα) including hydroxyl-like groups and surface chemisorbed oxygen, and the other peaks located at 529.9 eV were ascribed to the lattice oxygen species (Oβ).30 Compared with Oβ, Oα is generally considered to be more active and has higher mobility, which plays a key role in the oxidation reaction involved.36 The ratios of Oα/O of Mn/1%YTiOx, Mn/3%YTiOx and Mn/5%YTiOx were 30.1%, 33.8% and 33.9%, respectively, obviously higher than that of Mn/TiO2-NT (25.2%), although TiO2 nanotubes were claimed to be rich in surface oxygen.37 The ratios of Oα/Oβ increased with Y doping, suggesting that Y doping could increase the surface oxygen species by an imbalance of the charge on the catalyst surface, unsaturation of chemical bonds and the generation of vacancies.38 It is noteworthy that the Oβ peak of Mn/5%YTiOx shifted toward higher binding energy compared with other catalysts. As displayed in Fig. S3,† the Ti 2p spectra of Mn/TiO2-NT consisted of two peaks at 458.4 and 464.3 eV, corresponding to Ti 2p3/2 and Ti 2p1/2 sublevels, and the difference between these two binding energies (5.7 eV) illustrated that Ti was in the form of Ti4+ in the catalysts.39 The Ti 2p binding energy of Mn/Y-doped TiO2 was higher than that of Mn/TiO2-NT, and shifted toward higher binding energy with an increasing amount of Y doping, suggesting that the density of the outer electron cloud of Ti decreased. Combined with the shift of the Oβ peak of the Mn/5%YTiOx catalyst, it was speculated that the chemical environments of Ti, O and Y were affected by the strong Ti–O–Y bonds in the crystal lattice, and the electron in the conduction band of TiO2 could transfer to the Y element doped in TiO2, leading to a reduction in the outer electron cloud density of Ti and O ions.40
3.6. Catalytic performances
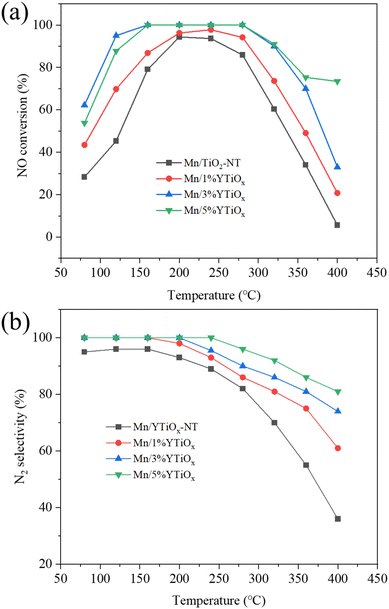
As illustrated in Fig. 8, the Y-doped TiO2 supported MnOx catalysts were examined for NO conversion and N2 selectivity at 80–400 °C. It was obvious that Mn/TiO2-NT exhibited the lowest SCR activity among these catalysts, and only showed 28% NO conversion at 80 °C, indicating poor low-temperature catalytic activity. While the increase in temperature can lead to a significant improvement in catalytic performance, and the NO conversion of the Mn/TiO2-NT catalyst reached its maximum of 94% at 200 °C, it then decreased with further temperature increment, especially when the temperature exceeded 320 °C, which was related to the over-oxidation of NH3 to nitric oxides by the O2 present.41 For the Mn/1%YTiOx catalyst, NO conversion over the entire temperature range was slightly higher than that of the Mn/TiO2-NT catalyst. When the doping amount was 3%, the NO conversion was significantly improved compared with that of the Mn/1%YTiOx catalyst. It reached 62% at 80 °C, 94% at 120 °C, and showed the maximum value of 100% in the temperature range of 160–280 °C, then declined at higher temperature. However, as the doping amount increased to 5%, the NO conversion of the Mn/5%YTiOx catalyst in the low-temperature range (<160 °C) was lower than that of the Mn/3%YTiOx catalyst, indicating a reduction in catalytic activity. Based on the above characterization analysis, it was concluded that the improvement in low-temperature NO conversion with increased amount of Y doping from 1% to 3% could mainly be attributed to the good dispersion of MnOx and more surface Lewis acid sites and chemisorbed oxygen. While 5% Y doping showed limited promotion on further increasing the surface chemisorbed oxygen but greatly reduced the specific surface area and Lewis acid sites of the catalyst, resulting in a decrease in catalytic ability. Besides, it was noted that the NO conversion of the Mn/5%YTiOx catalyst was higher than that of other catalysts at 320–400 °C, and still maintained NO conversion of 73% at 400 °C, which was due to more Y species also exhibiting catalytic activity in the higher temperature range. As can be seen from Table 3, the NO conversion of the Mn/3%YTiOx catalyst was higher than that of Mn-based catalysts obtained only through metal doping or construction of a 3D structure, indicating that the coupling of Y doping and 3D TiO2 construction can effectively improve the catalytic ability of Mn-based catalysts.| Catalyst | Reaction conditions | NO conversion (temperature range) | Ref. |
|---|---|---|---|
| Sm–Mn-0.1 | 0.05% NO, 0.05% NH3, 5% O2, 48![[thin space (1/6-em)]](https://www.rsc.org/images/entities/char_2009.gif) 600 h−1 600 h−1 |
90% (75–200 °C) | 4 |
| MnEu/TiO2 | 0.06% NO, 0.06% NH3, 5% O2, 108![[thin space (1/6-em)]](https://www.rsc.org/images/entities/char_2009.gif) 000 h−1 000 h−1 |
90% (200–400 °C) | 5 |
| PrOx–MnOx/SAPO-34 | 0.08% NO, 0.08% NH3, 5% O2, 40![[thin space (1/6-em)]](https://www.rsc.org/images/entities/char_2009.gif) 000 h−1 000 h−1 |
90% (160–280 °C) | 7 |
| Tm0.1Mn/TiO2 | 0.05% NO, 0.05% NH3, 5% O2, 36![[thin space (1/6-em)]](https://www.rsc.org/images/entities/char_2009.gif) 000 h−1 000 h−1 |
90% (120–270 °C) | 8 |
| MnCe/TiO2-FL | 0.06% NO, 0.06% NH3, 5% O2, 100![[thin space (1/6-em)]](https://www.rsc.org/images/entities/char_2009.gif) 000 h−1 000 h−1 |
90% (150–250 °C) | 11 |
| Mn/TNT | 0.09% NO, 0.01% NO2, 0.1% NH3, 10% O2, 50![[thin space (1/6-em)]](https://www.rsc.org/images/entities/char_2009.gif) 000 h−1 000 h−1 |
90% (100–250 °C) | 14 |
| Mn2Nb1Ox | 0.05% NO, 0.05% NH3, 5% O2, 50![[thin space (1/6-em)]](https://www.rsc.org/images/entities/char_2009.gif) 000 h−1 000 h−1 |
90% (125–200 °C) | 42 |
| Mn0.28–Ce0.05–Ti0.67–O | 0.06% NO, 0.06% NH3, 3% O2, 40![[thin space (1/6-em)]](https://www.rsc.org/images/entities/char_2009.gif) 000 h−1 000 h−1 |
92% (120–180 °C) | 43 |
| Mn1–Ce0.3/TiO2–graphene | 0.05% NO, 0.05% NH3, 7% O2, 67![[thin space (1/6-em)]](https://www.rsc.org/images/entities/char_2009.gif) 000 h−1 000 h−1 |
90% (140–180 °C) | 44 |
| MnFe@Ti | 0.05% NO, 0.05% NH3, 5% O2, 30![[thin space (1/6-em)]](https://www.rsc.org/images/entities/char_2009.gif) 000 h−1 000 h−1 |
80% (145–260 °C) | 45 |
| MnOx/TiO2 | 0.1% NO, 0.1% NH3, 3% O2, 30![[thin space (1/6-em)]](https://www.rsc.org/images/entities/char_2009.gif) 000 h−1 000 h−1 |
90% (144–247 °C) | 46 |
| Mn/3%YTiOx | 0.05% NO, 0.05% NH3, 5% O2, 30![[thin space (1/6-em)]](https://www.rsc.org/images/entities/char_2009.gif) 000 h−1 000 h−1 |
90% (120–320 °C) | This work |
The N2 selectivity over catalysts is given in Fig. 8(b). N2 selectivity remained around 90% over an Mn/TiO2-NT catalyst in the temperature window of 80–160 °C, and gradually declined to only 36% at 400 °C, which could probably be attributed to the N2O generated from non-selective catalytic ammonia oxidation.47 When the doping amount was only 1%, N2 selectivity was greatly increased and at least 90% of NOx was selectively converted into N2 below 240 °C. Fortunately, the N2 selectivity was further enhanced to some extent with doping by Y species, and Mn/5%YTiOx catalyst could maintain 100% N2 selectivity in the temperature range of 80–240 °C, and more than 85% N2 selectivity in the temperature range of 80–400 °C, suggesting that the bypass reaction could be restrained effectively by Y doping.
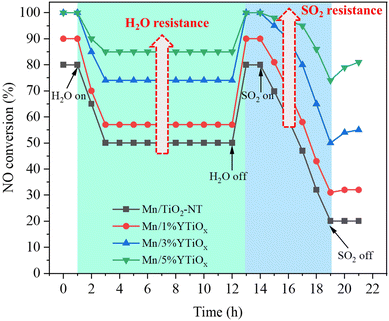
Since SO2 and water vapor are considered to be the main species responsible for the deactivation of Mn-based catalysts in the SCR reaction, the tolerance to H2O and SO2 of Y-doped TiO2 supported MnOx catalysts was investigated, and the results are exhibited in Fig. 9. As shown in Fig. 9, the resistance tests for H2O and SO2 were conducted at 180 °C under a GHSV of 30![[thin space (1/6-em)]](https://www.rsc.org/images/entities/char_2009.gif) 000 h−1, and the reaction was required to run for an hour before the addition of H2O. It can be seen from the water resistance test of 11 hours with 5 vol% water vapor that NO conversion of Mn/TiO2-NT declined from 80% to 50%, suggesting that there was strong competitive adsorption between water and reactants. However, the water resistance of the catalysts was enhanced with the increase in Y doping content; in particular, the NO conversion of the Mn/5%YTiOx catalyst was only reduced from 100% to 85%. NO conversion by all catalysts was restored to almost the initial value and remained at this stable level when the 5 vol% H2O was turned off, indicating that the deactivation was reversible. Zhang et al.48 found that competitive adsorption on Mn-based catalysts main existed between NOx and H2O by in situ DRIFT and TPD, and the labile oxygen on the catalyst surface could preferentially activate NO and restrict the adsorption of H2O on the same site. Therefore, it was conjectured that the enhancement in H2O resistance could be attributed to the increase in chemisorbed oxygen due to Y doping. Subsequently, SO2 of 100 ppm was introduced, and NO conversion of all catalysts gradually decreased as SO2 was continuously introduced. Similarly, the SO2 tolerance of the catalysts improved with an increase in the Y doping amount. The NO conversion of Mn/5%YTiOx dropped from 100% to 75% after an SO2 resistance test of 5 h, significantly better than that of other catalysts. But the NO conversion of Mn/5%YTiOx increased slightly after stopping the introduction of SO2, suggesting the irreversible deactivation of SO2 which was caused by oxidation of SO2 and sulfate deposition. Combined with the results of H2-TPR and XPS, it was speculated that the enhanced redox circle of Mn4+ + Y2+ ↔ Mn3+ + Y3+ could be responsible for the good SO2 resistance because the electron transfer from Y2+ to Mn4+ in the redox circle inhibited the electron transfer from SO2 to Mn4+, thus hindering the oxidation of SO2. In summary, the doping of Y in TiO2 can significantly enhance the resistance to water and sulfur of Mn-based catalysts in the NH3-SCR reaction.
000 h−1, and the reaction was required to run for an hour before the addition of H2O. It can be seen from the water resistance test of 11 hours with 5 vol% water vapor that NO conversion of Mn/TiO2-NT declined from 80% to 50%, suggesting that there was strong competitive adsorption between water and reactants. However, the water resistance of the catalysts was enhanced with the increase in Y doping content; in particular, the NO conversion of the Mn/5%YTiOx catalyst was only reduced from 100% to 85%. NO conversion by all catalysts was restored to almost the initial value and remained at this stable level when the 5 vol% H2O was turned off, indicating that the deactivation was reversible. Zhang et al.48 found that competitive adsorption on Mn-based catalysts main existed between NOx and H2O by in situ DRIFT and TPD, and the labile oxygen on the catalyst surface could preferentially activate NO and restrict the adsorption of H2O on the same site. Therefore, it was conjectured that the enhancement in H2O resistance could be attributed to the increase in chemisorbed oxygen due to Y doping. Subsequently, SO2 of 100 ppm was introduced, and NO conversion of all catalysts gradually decreased as SO2 was continuously introduced. Similarly, the SO2 tolerance of the catalysts improved with an increase in the Y doping amount. The NO conversion of Mn/5%YTiOx dropped from 100% to 75% after an SO2 resistance test of 5 h, significantly better than that of other catalysts. But the NO conversion of Mn/5%YTiOx increased slightly after stopping the introduction of SO2, suggesting the irreversible deactivation of SO2 which was caused by oxidation of SO2 and sulfate deposition. Combined with the results of H2-TPR and XPS, it was speculated that the enhanced redox circle of Mn4+ + Y2+ ↔ Mn3+ + Y3+ could be responsible for the good SO2 resistance because the electron transfer from Y2+ to Mn4+ in the redox circle inhibited the electron transfer from SO2 to Mn4+, thus hindering the oxidation of SO2. In summary, the doping of Y in TiO2 can significantly enhance the resistance to water and sulfur of Mn-based catalysts in the NH3-SCR reaction.
3.7. In situ DRIFTs
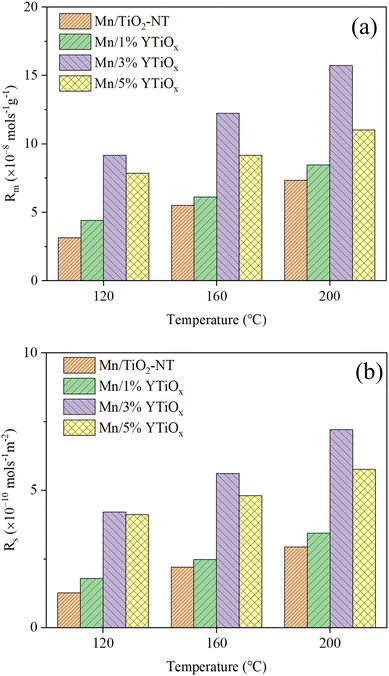 | ||
| Fig. 10 Transient rates based on the catalyst mass (a) and the specific surface area (b) of NO over catalysts at different temperatures for the NH3-SCR reaction. | ||
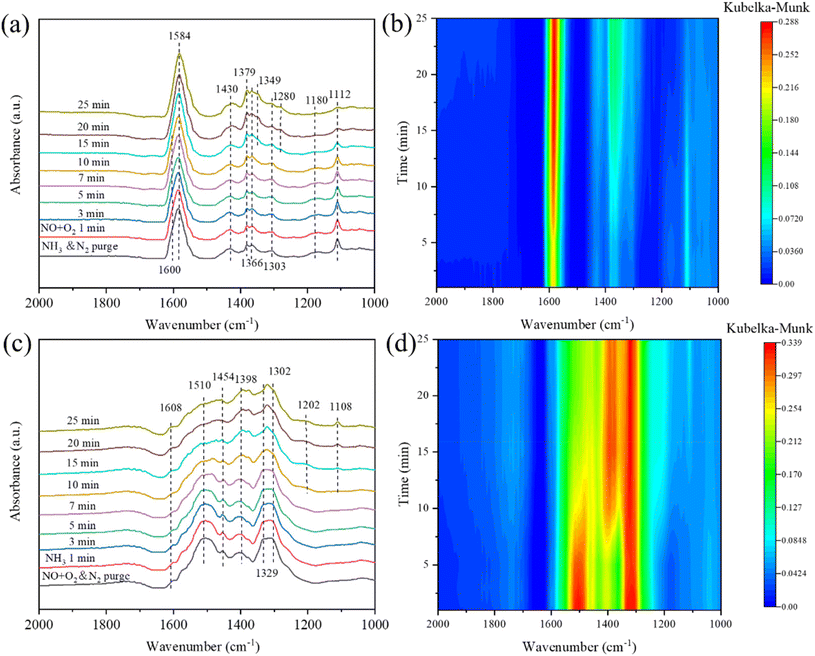 | ||
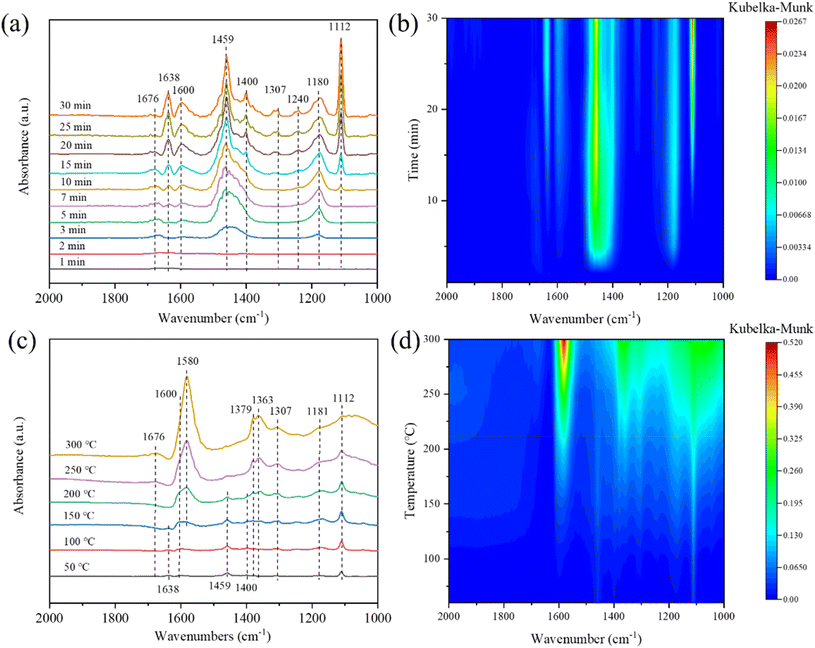
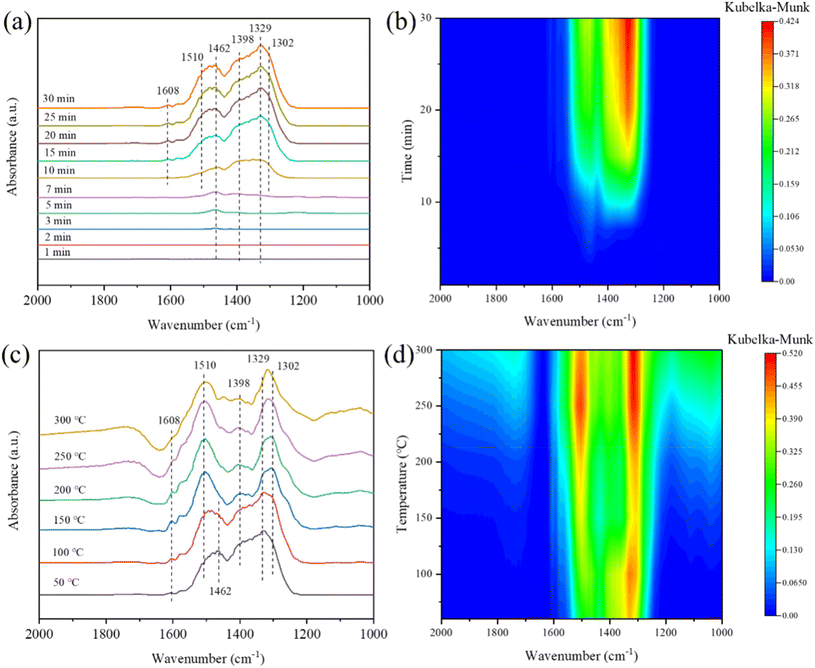
| Fig. 13 In situ DRIFT spectra of transient reaction at 180 °C over the Mn/3%YTiOx catalyst between NO + O2 and pre-adsorbed NH3 (a, b) and NH3 and pre-adsorbed NO + O2 (c, d) as a function of time. | ||
The transient reaction at 180 °C between pre-adsorbed NO + O2 and NH3 was detected by in situ DRIFTS spectra, and the results are depicted in Fig. 13(c and d). Free nitrate ions (1329), nitrito species (1398 cm−1), bidentate nitrates (1302 cm−1), monodentate nitrates (1510 cm−1), trans-NO2 (1454 cm−1) and bridging nitrates (1608 cm−1) were formed after the pre-adsorption of NO + O2. After the ammonia was pumped in, the peak intensities of bidentate nitrate, nitrito species and bridging nitrates seldom varied, suggesting they seldom participated in the reaction. While, monodentate nitrate and free nitrate ions showed a significant decrease in intensity from 7 min to 25 min, manifesting that monodentate nitrate and free nitrate ions may be the main reactive intermediate species in the NH3-SCR reaction. Moreover, the peak intensities of 1108 and 1202 cm−1 appeared and increased gradually from 7 min to 25 min, which were assigned to the coordinated NH3 due to the introduction of NH3.
4. Conclusions
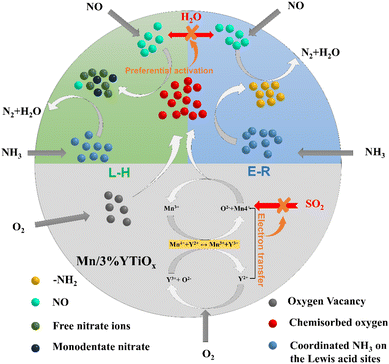
Y-Doped TiOx with a 3D structure was prepared by adding Y to a mixture of TiO2 powder and NaOH during the alkaline hydrothermal synthesis of titanium nanotubes, followed by supporting MnOx for the low-temperature NH3-SCR reaction. The effect of Y doping on the physicochemical properties of synthesized 3D TiOx and the further effect on catalytic performance of Mn/Y-doped TiOx catalysts were investigated through a series of analytical techniques and performance tests, including NO conversion, N2 selectivity and H2O/SO2 resistance. The results showed that the synthesized 3D TiOx gradually transformed from nanotubes to nanosheets with an increase in Y doping, leading to a reduction in specific surface area and Brønsted acid sites, but NO conversion by Mn/Y-doped TiOx catalysts exhibited a volcano-type tendency with an increase in the Y content. An appropriate amount of Y doping, such as 3%, can significantly improve the dispersion of MnOx, and increase the concentration of Mn4+, Lewis acid sites and surface chemisorbed oxygen of catalysts, thus effectively enhancing the catalytic ability for NH3-SCR. The Mn/3%YTiOx catalyst showed NO conversion and N2 selectivity above 90% in a wide temperature window from 120 to 320 °C under a GHSV of 30![[thin space (1/6-em)]](https://www.rsc.org/images/entities/char_2009.gif) 000 h−1. However, an excessive amount of Y doping, such as 5%, could result in a noticeable decrease in specific surface area, Lewis acid sites and surface Mn4+ content of the catalyst, which was detrimental to the NH3-SCR. Besides, the N2 selectivity and H2O/SO2 tolerance of catalysts were distinctly enhanced with an increase in Y doping, which were mainly ascribed to the abundant surface chemisorbed oxygen and the electron transfer from Y to Mn. An in situ DRIFTS study demonstrated that Lewis acid sites, –NH2 species, monodentate nitrate and free nitrate ions were the main reactive intermediate species of the NH3-SCR reaction over the Mn/3%YTiOx catalyst, and the reaction followed the Langmuir–Hinshelwood (L–H) and Eley–Rideal (E–R) reaction mechanisms, between which the L–H reaction mechanism predominated.
000 h−1. However, an excessive amount of Y doping, such as 5%, could result in a noticeable decrease in specific surface area, Lewis acid sites and surface Mn4+ content of the catalyst, which was detrimental to the NH3-SCR. Besides, the N2 selectivity and H2O/SO2 tolerance of catalysts were distinctly enhanced with an increase in Y doping, which were mainly ascribed to the abundant surface chemisorbed oxygen and the electron transfer from Y to Mn. An in situ DRIFTS study demonstrated that Lewis acid sites, –NH2 species, monodentate nitrate and free nitrate ions were the main reactive intermediate species of the NH3-SCR reaction over the Mn/3%YTiOx catalyst, and the reaction followed the Langmuir–Hinshelwood (L–H) and Eley–Rideal (E–R) reaction mechanisms, between which the L–H reaction mechanism predominated.
Conflicts of interest
The authors declare that they have no known competing financial interests or personal relationships that could have appeared to influence the work reported in this paper.Acknowledgements
This work was supported by the National Natural Science Foundation of China (22206189), the Science and Technology Planning Project of Chengguan District of Lanzhou City (2022-6-2), Lanzhou Talent Innovation and Entrepreneurship Project (2022-RC-10), the Key talent project of Gansu Province, the Major Program of the Lanzhou Institute of Chemical Physics, CAS (No. ZYFZFX-10).References
- X. Huang, F. Dong, G. Zhang, Y. Guo and Z. Tang, A strategy for constructing highly efficient yolk-shell Ce@Mn@TiOx catalyst with dual active sites for low-temperature selective catalytic reduction of NO with NH3, Chem. Eng. J., 2021, 419, 129572 CrossRef CAS.
- G. Zhang, W. Han, F. Dong, L. Zong, G. Lu and Z. Tang, One pot synthesis of a highly efficient mesoporous ceria–titanium catalyst for selective catalytic reduction of NO, RSC Adv., 2016, 6, 76556–76567 RSC.
- R. Jin, Y. Liu, Y. Wang, W. Cen, Z. Wu, H. Wang and X. Weng, The role of cerium in the improved SO2 tolerance for NO reduction with NH3 over Mn-Ce/TiO2 catalyst at low temperature, Appl. Catal., B, 2014, 148–149, 582–588 CrossRef CAS.
- D. Meng, W. Zhan, Y. Guo, Y. Guo, L. Wang and G. Lu, A highly effective catalyst of Sm-MnOx for the NH3-SCR of NOx at low temperature: Promotional role of Sm and its catalytic performance, ACS Catal., 2015, 5, 5973–5983 CrossRef CAS.
- J. Liu, R. T. Guo, M. Y. Li, P. Sun, S. M. Liu, W. G. Pan, S. W. Liu and X. Sun, Enhancement of the SO2 resistance of Mn/TiO2 SCR catalyst by Eu modification: A mechanism study, Fuels, 2018, 223, 385–393 CrossRef CAS.
- P. Sun, R. T. Guo, S. M. Liu, S. X. Wang, W. G. Pan and M. Y. Li, The enhanced performance of MnOx catalyst for NH3-SCR reaction by the modification with Eu, Appl. Catal., A, 2017, 531, 129–138 CrossRef CAS.
- C. Yu, B. Huang, L. Dong, F. Chen, Y. Yang, Y. Fan, Y. Yang, X. Liu and X. Wang, Effect of Pr/Ce addition on the catalytic performance and SO2 resistance of highly dispersed MnOx/SAPO-34 catalyst for NH3-SCR at low temperature, Chem. Eng. J., 2017, 316, 1059–1068 CrossRef CAS.
- C. H. Niu, B. R. Wang, Y. Xing, W. Su, C. He, L. Xiao, Y. R. Xu, S. Q. Zhao, Y. H. Cheng and J. W. Shi, Thulium modified MnOx/TiO2 catalyst for the low-temperature selective catalytic reduction of NO with ammonia, J. Cleaner Prod., 2021, 290, 125858 CrossRef CAS.
- S. Zhang, X. Liu, Q. Zhong and Y. Yao, Effect of Y doping on oxygen vacancies of TiO2 supported MnOx for selective catalytic reduction of NO with NH3 at low temperature, Catal. Commun., 2012, 25, 7–11 CrossRef CAS.
- L. Zong, G. Zhang, J. Zhao, F. Dong, J. Zhang and Z. Tang, Morphology-controlled synthesis of 3D flower-like TiO2 and the superior performance for selective catalytic reduction of NOx with NH3, Chem. Eng. J., 2018, 343, 500–511 CrossRef CAS.
- B. Qin, R. T. Guo, J. Zhou, L. G. Wei, T. Y. Yin and W. G. Pan, A novel flower-like MnCe/TiO2 catalyst with controlled morphology for low-temperature selective catalytic reduction of NO with NH3, Appl. Surf. Sci., 2022, 598, 153823 CrossRef CAS.
- K. Cheng, W. Song, Y. Cheng, J. Liu, Z. Zhao and Y. Wei, Selective catalytic reduction over size-tunable rutile TiO2 nanorod microsphere-supported CeO2 catalysts, Catal. Sci. Technol., 2016, 6, 4478–4490 RSC.
- Q. Li, X. Li, W. Li, L. Zhong, C. Zhang, Q. Fang and G. Chen, Effect of preferential exposure of anatase TiO2 {001} facets on the performance of Mn-Ce/TiO2 catalysts for low-temperature selective catalytic reduction of NOx with NH3, Chem. Eng. J., 2019, 369, 26–34 CrossRef CAS.
- T. Boningari, D. K. Pappas and P. G. Smirniotis, Metal oxide-confined interweaved titania nanotubes M/TNT (M = Mn, Cu, Ce, Fe, V, Cr, and Co) for the selective catalytic reduction of NOx in the presence of excess oxygen, J. Catal., 2018, 365, 320–333 CrossRef CAS.
- X. Chen, P. Wang, P. Fang, H. Wang, C. Cen, W. Zeng and Z. Wu, Design strategies for SCR catalysts with improved N2 selectivity: the significance of nano-confining effects by titanate nanotubes, Environ. Sci.: Nano, 2017, 4, 437–447 RSC.
- P. Wang, H. Wang, X. Chen and Z. Wu, Design strategies for a denitrification catalyst with improved resistance against alkali poisoning: The significance of nanoconfining spaces and acid-base balance, ChemCatChem, 2016, 8, 787–797 CrossRef CAS.
- X. B. Chen, P. L. Wang, P. Fang, T. Y. Ren, Y. Liu, C. P. Cen, H. Q. Wang and Z. B. Wu, Tuning the property of Mn-Ce composite oxides by titanate nanotubes to improve the activity, selectivity and SO2/H2O tolerance in middle temperature NH3-SCR reaction, Fuel Process. Technol., 2017, 167, 221–228 CrossRef CAS.
- R. Yuan, B. Zhou, D. Hua and C. Shi, Enhanced photocatalytic degradation of humic acids using Al and Fe co-doped TiO2 nanotubes under UV/ozonation for drinking water purification, J. Hazard. Mater., 2013, 262, 527–538 CrossRef CAS PubMed.
- F. Jiang, S. Zheng, L. An and H. Chen, Effect of calcination temperature on the adsorption and photocatalytic activity of hydrothermally synthesized TiO2 nanotubes, Appl. Surf. Sci., 2012, 258, 7188–7194 CrossRef CAS.
- B. Erjavec, R. Kaplan, P. Djinović and A. Pintar, Catalytic wet air oxidation of bisphenol A model solution in a trickle-bed reactor over titanate nanotube-based catalysts, Appl. Catal., B, 2013, 132, 342–352 CrossRef.
- X. M. Liu, S. Y. Fu and C. J. Huang, Synthesis, characterization and magnetic properties of β-MnO2 nanorods, Powder Technol., 2005, 154, 120–124 CrossRef CAS.
- S. Mathew, P. Ganguly, V. Kumaravel, J. Harrison, S. J. Hinder, J. Bartlett and S. C. Pillai, Effect of chalcogens (S, Se, and Te) on the anatase phase stability and photocatalytic antimicrobial activity of TiO2, Mater. Today: Proc., 2020, 33, 2458–2464 CAS.
- W. Hu, L. Li, G. Li, Y. Liu and R. L. Withers, Atomic-scale control of TiO6 octahedra through solution chemistry towards giant dielectric response, Sci. Rep., 2014, 4, 1–9 Search PubMed.
- Y. Zhong, S. Chang and G. Dong, Preparation and characterization of a novel double-walled Na2(TiO)SiO4 nanotube by hydrothermal process with CTAB as an assistant, Microporous Mesoporous Mater., 2017, 239, 70–77 CrossRef CAS.
- G. Srinivas, Y. Zhu, R. Piner, N. Skipper, M. Ellerby and R. Ruoff, Synthesis of graphene-like nanosheets and their hydrogen adsorption capacity, Carbon, 2010, 48, 630–635 CrossRef CAS.
- X. Chen, H. Wang, Z. Wu, Y. Liu and X. Weng, Novel H2Ti12O25-confined CeO2 catalyst with remarkable resistance to alkali poisoning based on the “shell protection effect”, J. Phys. Chem. C, 2011, 115, 17479–17484 CrossRef CAS.
- L. Q. Weng, S. H. Song, S. Hodgson, A. Baker and J. Yu, Synthesis and characterisation of nanotubular titanates and titania, J. Eur. Ceram. Soc., 2006, 26, 1405–1409 CrossRef CAS.
- G. Cheng, X. Liu, X. Song, X. Chen, W. Dai, R. Yuan and X. Fu, Visible-light-driven deep oxidation of NO over Fe doped TiO2 catalyst: Synergic effect of Fe and oxygen vacancies, Appl. Catal., B, 2020, 277, 119196 CrossRef CAS.
- G. B. Sun, K. Hidajat, X. S. Wu and S. Kawi, A crucial role of surface oxygen mobility on nanocrystalline Y2O3 support for oxidative steam reforming of ethanol to hydrogen over Ni/Y2O3 catalysts, Appl. Catal., B, 2008, 81, 303–312 CrossRef CAS.
- F. Dong, W. Han, Y. Guo, W. Han and Z. Tang, CeCoOx-MNS catalyst derived from three-dimensional mesh nanosheet Co-based metal-organic frameworks for highly efficient catalytic combustion of VOCs, Chem. Eng. J., 2021, 405, 126948 CrossRef CAS.
- E. Wada, M. Kitano, K. Nakajima and M. Hara, Effect of preparation conditions on the structural and acid catalytic properties of protonated titanate nanotubes, J. Mater. Chem. A, 2013, 1, 12768–12774 RSC.
- M. Kitano, E. Wada, K. Nakajima, S. Hayashi, S. Miyazaki, H. Kobayashi and M. Hara, Protonated titanate nanotubes with Lewis and Brønsted acidity: Relationship between nanotube structure and catalytic activity, Chem. Mater., 2013, 25, 385–393 CrossRef CAS.
- Y. J. Kim, H. J. Kwon, I. Heo, I.-S. Nam, B. K. Cho, J. W. Choung, M.-S. Cha and G. K. Yeo, Mn-Fe/ZSM5 as a low-temperature SCR catalyst to remove NOx from diesel engine exhaust, Appl. Catal., B, 2012, 126, 9–21 CrossRef CAS.
- F. Liu, H. He, Y. Ding and C. Zhang, Effect of manganese substitution on the structure and activity of iron titanate catalyst for the selective catalytic reduction of NO with NH3, Appl. Catal., B, 2009, 93, 194–204 CrossRef CAS.
- Q. Chen, F. El Gabaly, F. Aksoy Akgul, Z. Liu, B. S. Mun, S. Yamaguchi and A. Braun, Observation of oxygen vacancy filling under water vapor in ceramic proton conductors in situ with ambient pressure XPS, Chem. Mater., 2013, 25, 4690–4696 CrossRef CAS.
- S. Ali, L. Chen, Z. Li, T. Zhang, R. Li, S. u. H. Bakhtiar, X. Leng, F. Yuan, X. Niu and Y. Zhu, Cux-Nb1.1−x (x = 0.45, 0.35, 0.25, 0.15) bimetal oxides catalysts for the low temperature selective catalytic reduction of NO with NH3, Appl. Catal., B, 2018, 236, 25–35 CrossRef CAS.
- Z. P. Zhang, R. M. Li, M. J. Wang, Y. S. Li, Y. M. Tong, P. P. Yang and Y. J. Zhu, Two steps synthesis of CeTiOx oxides nanotube catalyst: Enhanced activity, resistance of SO2 and H2O for low temperature NH3-SCR of NOx, Appl. Catal., B, 2021, 282, 119542 CrossRef CAS.
- X. Ma, X. Wang, L. Xu and F. Chen, Oxygen vacancy clusters enriched TiO2 with low Pt content for superior photocatalytic activity, Catal. Lett., 2022, 152, 2585–2589 CrossRef CAS.
- T. Kubo and A. Nakahira, Local structure of TiO2-derived nanotubes prepared by the hydrothermal process, J. Phys. Chem. C, 2008, 112, 1658–1662 CrossRef CAS.
- X. Li, X. Zou, Z. Qu, Q. Zhao and L. Wang, Photocatalytic degradation of gaseous toluene over Ag-doping TiO2 nanotube powder prepared by anodization coupled with impregnation method, Chemosphere, 2011, 83, 674–679 CrossRef CAS PubMed.
- K. Gora-Marek, K. Brylewska, K. A. Tarach, M. Rutkowska, M. Jablonska, M. Choi and L. Chmielarz, IR studies of Fe modified ZSM-5 zeolites of diverse mesopore topologies in the terms of their catalytic performance in NH3-SCR and NH3-SCO processes, Appl. Catal., B, 2015, 179, 589–598 CrossRef CAS.
- Z. Lian, F. Liu, H. He, X. Shi, J. Mo and Z. Wu, Manganese-niobium mixed oxide catalyst for the selective catalytic reduction of NOx with NH3 at low temperatures, Chem. Eng. J., 2014, 250, 390–398 CrossRef CAS.
- Z. Y. Sheng, Y. F. Hu, J. M. Xue, X. M. Wang and W. P. Liao, SO2 poisoning and regeneration of Mn-Ce/TiO2 catalyst for low temperature NOx reduction with NH3, J. Rare Earths, 2012, 30, 676–682 CrossRef CAS.
- X. Lu, C. Song, S. Jia, Z. Tong, X. Tang and Y. Teng, Low-temperature selective catalytic reduction of NOx with NH3 over cerium and manganese oxides supported on TiO2-graphene, Chem. Eng. J., 2015, 260, 776–784 CrossRef CAS.
- Z. Cai, G. Zhang, Z. Tang and J. Zhang, MnFeOx@TiO2 Nanocages for selective catalytic reduction of NO with NH3 at low temperature, ACS Appl. Nano Mater., 2021, 4, 6201–6211 CrossRef CAS.
- B. Jiang, Y. Liu and Z. Wu, Low-temperature selective catalytic reduction of NO on MnOx/TiO2 prepared by different methods, J. Hazard. Mater., 2009, 162, 1249–1254 CrossRef CAS PubMed.
- Y. Xin, H. Li, N. Zhang, Q. Li, Z. Zhang, X. Cao, P. Hu, L. Zheng and J. A. Anderson, Molecular-level insight into selective catalytic reduction of NOx with NH3 to N2 over a highly efficient bifunctional V-alpha-MnOx catalyst at low temperature, ACS Catal., 2018, 8, 4937–4949 CrossRef CAS.
- N. Q. Zhang, L. C. Li, Y. Z. Guo, J. D. He, R. Wu, L. Y. Song, G. Z. Zhang, J. S. Zhao, D. S. Wang and H. He, A MnO2-based catalyst with H2O resistance for NH3-SCR: Study of catalytic activity and reactants-H2O competitive adsorption, Appl. Catal., B, 2020, 270, 118860 CrossRef CAS.
- Z. Fan, J. W. Shi, C. Gao, G. Gao, B. Wang, Y. Wang, C. He and C. Niu, Gd-modified MnOx for the selective catalytic reduction of NO by NH3: The promoting effect of Gd on the catalytic performance and sulfur resistance, Chem. Eng. J., 2018, 348, 820–830 CrossRef CAS.
- C. Liu, L. Chen, J. Li, L. Ma, H. Arandiyan, Y. Du, J. Xu and J. Hao, Enhancement of activity and sulfur resistance of CeO2 supported on TiO2-SiO2 for the selective catalytic reduction of NO by NH3, Environ. Sci. Technol., 2012, 46, 6182–6189 CrossRef CAS PubMed.
- N. Y. Topsøe, Mechanism of the selective catalytic reduction of nitric oxide by ammonia elucidated by in situ on-line Fourier transform infrared spectroscopy, Science, 1994, 265, 1217–1219 CrossRef PubMed.
- F. Liu and H. He, Structure-activity relationship of iron titanate catalysts in the selective catalytic reduction of NOx with NH3, J. Phys. Chem. C, 2010, 114, 16929–16936 CrossRef CAS.
- F. Yan, Y. Wang, J. Zhang, Z. Lin, J. Zheng and F. Huang, Schottky or Ohmic metal-semiconductor contact: Influence on photocatalytic efficiency of Ag/ZnO and Pt/ZnO model systems, ChemSusChem, 2014, 7, 101–104 CrossRef CAS PubMed.
- L. Ma, C. Y. Seo, M. Nahata, X. Chen, J. Li and J. W. Schwank, Shape dependence and sulfate promotion of CeO2 for selective catalytic reduction of NOx with NH3, Appl. Catal., B, 2018, 232, 246–259 CrossRef CAS.
- M. Casapu, O. Kröcher, M. Mehring, M. Nachtegaal, C. Borca, M. Harfouche and D. Grolimund, Characterization of Nb-containing MnOx-CeO2 catalyst for low-temperature selective catalytic reduction of NO with NH3, J. Phys. Chem. C, 2010, 114, 9791–9801 CrossRef CAS.
- J. Liu, X. Y. Li, Q. D. Zhao, J. Ke, H. N. Xiao, X. J. Lv, S. M. Liu, M. Tade and S. B. Wang, Mechanistic investigation of the enhanced NH3-SCR on cobalt-decorated Ce-Ti mixed oxide: In situ FTIR analysis for structure-activity correlation, Appl. Catal., B, 2017, 200, 297–308 CrossRef CAS.
- L. Sheng, Z. Ma, S. Chen, J. Lou, C. Li, S. Li, Z. Zhang, Y. Wang and H. Yang, Mechanistic insight into N2O formation during NO reduction by NH3 over Pd/CeO2 catalyst in the absence of O2, Chin. J. Catal., 2019, 40, 1070–1077 CrossRef CAS.
- X. Weng, X. Dai, Q. Zeng, Y. Liu and Z. Wu, DRIFT studies on promotion mechanism of H3PW12O40 in selective catalytic reduction of NO with NH3, J. Colloid Interface Sci., 2016, 461, 9–14 CrossRef CAS PubMed.
- Z. R. Ma, X. D. Wu, Z. C. Si, D. Weng, J. Ma and T. F. Xu, Impacts of niobia loading on active sites and surface acidity in NbOx/CeO2-ZrO2 NH3-SCR catalysts, Appl. Catal., B, 2015, 179, 380–394 CrossRef CAS.
- X. M. Wu, X. L. Yu, Z. W. Huang, H. Z. Shen and G. H. Jing, MnOx-decorated VOx/CeO2 catalysts with preferentially exposed {110} facets for selective catalytic reduction of NOx by NH3, Appl. Catal., B, 2020, 268, 118419 CrossRef CAS.
- L. Liu, B. Liu, L. Dong, J. Zhu, H. Wan, K. Sun, B. Zhao, H. Zhu, L. Dong and Y. Chen, In situ FT-infrared investigation of CO or/and NO interaction with CuO/Ce0.67Zr0.33O2 catalysts, Appl. Catal., B, 2009, 90, 578–586 CrossRef CAS.
- W. Yang, R. Zhang, B. Chen, D. Duprez and S. Royer, New aspects on the mechanism of C3H6 selective catalytic reduction of NO in the presence of O2 over LaFe1−x(Cu, Pd)xO3−δ perovskites, Environ. Sci. Technol., 2012, 46, 11280–11288 CrossRef CAS PubMed.
- Z. Ma, D. Weng, X. Wu and Z. Si, Effects of WOx modification on the activity, adsorption and redox properties of CeO2 catalyst for NOx reduction with ammonia, J. Environ. Sci., 2012, 24, 1305–1316 CrossRef CAS PubMed.
Footnote |
| † Electronic supplementary information (ESI) available. See DOI: https://doi.org/10.1039/d2nr07304h |
| This journal is © The Royal Society of Chemistry 2023 |

