
 Open Access Article
 This Open Access Article is licensed under a
 Creative Commons Attribution 3.0 Unported Licence
Crystal phase engineering of Ru for simultaneous selective photocatalytic oxidations and H2 production†
Michaël
Gebruers‡
a,
Chunhua
Wang‡
 b,
Rafikul A.
Saha
a,
Yangshan
Xie
a,
Imran
Aslam
a,
Li
Sun
b,
Yuhe
Liao
c,
Xuhui
Yang
d,
Taoran
Chen
d,
Min-Quan
Yang
d,
Bo
Weng
*a and
Maarten B. J.
Roeffaers
*a
b,
Rafikul A.
Saha
a,
Yangshan
Xie
a,
Imran
Aslam
a,
Li
Sun
b,
Yuhe
Liao
c,
Xuhui
Yang
d,
Taoran
Chen
d,
Min-Quan
Yang
d,
Bo
Weng
*a and
Maarten B. J.
Roeffaers
*a
acMACS, Department of Microbial and Molecular Systems, KU Leuven, Celestijnenlaan 200F, 3001 Leuven, Belgium. E-mail: bo.weng@kuleuven.be; maarten.roeffaers@kuleuven.be
bDepartment of Chemistry, KU Leuven, Celestijnenlaan 200F, 3001 Leuven, Belgium
cGuangzhou Institute of Energy Conversion, Chinese Academy of Sciences, No. 2, Nengyuan, Road, Tianhe District, Guangzhou 510641, P.R. China
dCollege of Environmental Science and Engineering, Fujian Key Laboratory of Pollution Control & Resource Reuse, Fujian Normal University, Fuzhou 350007, P.R. China
First published on 13th January 2023
Abstract
Noble metal nanoparticles are often used as cocatalysts to enhance the photocatalytic efficiency. While the effect of cocatalyst nanoparticle size and shape has widely been explored, the effect of the crystal phase is largely overlooked. In this work, we investigate the effect of Ru nanoparticle crystal phase, specifically regular hexagonal close-packed (hcp) and allotropic face-centered cubic (fcc) crystal phases, as cocatalyst decorated onto the surface of TiO2 photocatalysts. As reference photocatalytic reaction the simultaneous photocatalytic production of benzaldehyde (BAD) and H2 from benzyl alcohol was chosen. Both the fcc Ru/TiO2 and hcp Ru/TiO2 composites exhibit enhanced BAD and H2 production rates compared to pristine TiO2 due to the formation of a Schottky barrier promoting the photogenerated charge separation. Moreover, a 1.9-fold photoactivity enhancement of the fcc Ru/TiO2 composite is achieved as compared to the hcp Ru/TiO2 composite, which is attributed to the fact that the fcc Ru NPs are more efficient in facilitating the charge transfer as compared to hcp Ru NPs, thus inhibiting the recombination of electron–hole pairs and enhancing the overall photoactivity.
1 Introduction
Inorganic semiconductors, such as TiO2, are often preferred as photocatalysts (PCs) due to their relatively low price, high stability, and non-toxicity.1–3 One of the major drawbacks is the rapid photogenerated charge carrier recombination, leaving room for further improvement to maximize the photocatalytic activity.4 The addition of noble metal nanoparticles (NPs) as cocatalyst can not only slow down the electron–hole recombination by trapping photogenerated charges,5–8 they can also provide catalytically active sites.9–11 Therefore metal NP cocatalysts are crucial in the development of improved semiconductor PCs.Various noble metal NPs have been reported as cocatalysts to increase the photocatalytic activity of TiO2, including Pt,12 Au,13 and Ru.14 Of these noble metals, Ru is of specific interest due to its relatively low price compared to the other noble metals,15 and its proven efficiency as a cocatalyst in metal-based composite catalysed photocatalysis.16,17 Usually, the properties of Ru NPs are fine-tuned via size and shape engineering.18 However, the properties of Ru NPs can also be tuned by engineering its crystal phase. In bulk Ru adopts a hexagonal close-packed (hcp) phase, recently Ru NPs with a face-centered cubic (fcc) phase have been reported.19 Crystal phase engineering offers an efficient approach to modulate the physicochemical properties of (noble) metal NPs.20–24 For instance, Ye et al. studied the performance of hcp and fcc Ru cocatalysts supported on C3N4 for the photocatalytic CO2 to fuel conversion.25 It was demonstrated that hcp Ru results in increased selectivity for the formation of CO and CH4, while fcc Ru causes an increased selectivity for the formation of H2. Recently, dual-functional photocatalytic reaction systems to simultaneously trigger the reduction and oxidation reaction for achieving both reduction and oxidation productions have received extensive attention.26 However, the utilization of Ru NPs for dual-functional photocatalysis in the simultaneous production of solar fuels and organic molecules has never been reported. It is therefore of importance to study the photocatalytic properties of Ru NPs as cocatalysts to establish a structure–function relationship in dual-functional photocatalytic reaction systems toward the production of value-added chemicals.
2 Experimental section
2.1 Chemicals and reagents
Triethylene glycol (99.0%), ruthenium(III) acetylacetonate (99.9%) and trifluorotoluene (90.0%) were obtained from Alfa Aesar, ruthenium(III) chloride (99.9%) acetone (99.8%), benzyl alcohol (99.0%), Hexane (≥97.0%) and diethyl ether (≥99.5%) from Acros organics, ethylene glycol (≥98.0%) from Carl Roth, polyvinylpyrrolidone (30 k) from MP biomedicals, ethanol (99.8%) from Fisher, titanium oxide (21 nm, ≥99.5%) and Ammonium oxalate (≥99.0%) from Sigma-Aldrich, sodium sulfate (≥99.0%) from Merck, potassium persulfate (99.0%) from Chimica. All chemicals were used as obtained from the supplier.2.2 Synthesis of allotropic Ru NPs
Ru NPs with a fcc and hcp crystal phase were synthesized by a method based on the work by Kusada et al.19 Ru NPs with different crystal phases were synthesized by changing the Ru precursor and the type of solvent and reductant in the synthesis. The Ru NPs were synthesized via a chemical reduction method by using Ru(AcAc)3 as the Ru precursor for the synthesis of fcc Ru and RuCl3·H2O as the Ru precursor for hcp Ru. Triethyleneglycol (TEG) and ethylene glycol (EG) were used as the solvent and reducing agent for the synthesis of fcc and hcp Ru NPs respectively. Polyvinylpyrrolidone (PVP) was added as a stabilizing agent to avoid agglomeration of the NPs. In a typical synthesis the Ru precursor and PVP are suspended in TEG or EG at room temperature. This solution is then refluxed at 180 °C for 3 hours under continuous steering (600 rpm) in an oil bath. After 3 hours the reaction mixture was cooled down to room temperature by removing it from the oil bath. The Ru NPs were then separated from the reaction mixture by adding diethyl ether and acetone and centrifugation at 7000 rpm for 2 minutes. The Ru NPs were then washed with ethanol and diethyl ether and dried overnight under vacuum at 55 °C.2.3 Catalyst loading
Ru/TiO2 composites were prepared via a wet impregnation method. The following method was used to prepare 0.60 wt% Ru/TiO2 composites; 1.2 mL of a Ru NPs suspension in ethanol (1 mg mL−1) was added to a suspension of 200 mg of TiO2 in 20 mL hexane![[thin space (1/6-em)]](https://www.rsc.org/images/entities/char_2009.gif) :ethanol (3:1). The mixture was stirred for 16 h (400 rpm) at room temperature. The catalysts were separated from the reaction mixture via centrifugation at 3500 rpm for 5 minutes and washed three times with hexane. Finally, the Ru/TiO2 composites were dried overnight at 55 °C. Ru/TiO2 composites with different amounts of Ru loading were prepared by adjusting the amount of TiO2 and the volume of Ru NPs suspension added to the synthesis mixture.
:ethanol (3:1). The mixture was stirred for 16 h (400 rpm) at room temperature. The catalysts were separated from the reaction mixture via centrifugation at 3500 rpm for 5 minutes and washed three times with hexane. Finally, the Ru/TiO2 composites were dried overnight at 55 °C. Ru/TiO2 composites with different amounts of Ru loading were prepared by adjusting the amount of TiO2 and the volume of Ru NPs suspension added to the synthesis mixture.
2.4 Characterization
Linear sweep voltammetry (LSV) was carried out on an electrochemical workstation (Bio-Logic SP-200). The cathodic polarization curves were obtained by using the linear sweep voltammetry technique with a scan rate of 0.5 mVs−1 in an aqueous 0.2 M Na2SO4 solution. The electrochemical impedance spectroscopy (EIS) experiments were conducted on an electrochemical workstation (CHI660E) in an aqueous 0.2 M Na2SO4 solution (pH = 6.8) under a frequency range from 0.01 Hz to 100 kHz under open circuit potential.
2.5 Photocatalytic activity measurements
In a typical experiment 104 μL of benzyl alcohol, 2.5 mL of trifluorotoluene and 15 mg of catalyst were added in a glass reactor. For the control experiments, 50 μL of a scavenger in trifluorotoluene solution (1 mM) was added to the reaction mixture. The reactor was sealed and put under vacuum. The mixture was then irradiated under continuous steering (500 rpm) for 14 h under irradiation of a 300 W Xe lamp with an AM 1.5 G filter to simulate the solar light spectrum. After irradiation, 1 mL of the headspace gas was analysed by an Agilent 7890B instrument equipped with a methane convertor, a MolSieve 5A and a Porapak Q column and a thermal conductivity detector (TCD) and flame ionization detector (FID). The reaction mixture was prepared for liquid phase analysis by separating the reaction mixture from the catalyst via centrifugation for 5 minutes (8000 rpm) and transferring 1 mL of the solution to a GC vial. This solution was analysed with gas chromatography (GC), on a Shimadzu 2010 GC CP-Sil 5 with an FID detector.2.6 Density-functional theory (DFT) calculations
The first-principle calculation were conducted through the Vienna ab initio Simulation Package (VASP) using projector-augmented wave (PAW) method.27 The generalized gradient approximation (GGA)28 externalized by the Perdew–Burke–Ernzerhof (PBE) approximation was used for the influence of the exchange-correction potentials.29 A plane-wave cutoff energy was set as 600 eV, and the Γ-centered K-points mesh of 2π × 0.02 Å−1 was set. The convergence criteria for energy and maximum force were set to 10−6 eV and 0.01 eV Å−1, respectively. The (111) surface of the fcc-phase and (101) surface of the hcp-phase Ru were built by two 6-layer slab models with a vacuum of 25 Å. For absorption systems, to simulate the adsorption on the Ru surface, the three top atomic layers were relaxed and the other bottom layers were fixed.3 Results and discussion
3.1 Synthesis of hcp and fcc Ru NPs
Ru NPs with a fcc and hcp structure were synthesized via the polyol method developed by Kusada et al.19 The NP crystal phase was confirmed via XRD (Fig. 1A). Le-bail fitting of the XRD data was performed to determine the exact peak positions and corresponding hkl planes for both crystal phases. The F(111), F(200) and F(220) reflections were found at 41°, 47° and 69°, respectively, matching the peak positions reported for fcc Ru NPs;30 for hcp Ru, the H(100), H(002) and H(101) reflections were found at 38°, 42° and 44°, respectively.31 The latter two peaks are merged into one broad peak centered at 43°; this is in agreement with earlier reports of small (<5 nm) hcp Ru NPs.32–34 The size of the as-synthesized Ru NPs was determined via TEM measurements, as shown in Fig. S1 and S2 (ESI†). Both fcc and hcp Ru NPs appear spherical in shape and have a size of 2.7 ± 0.4 nm and 2.6 ± 0.4 nm, respectively.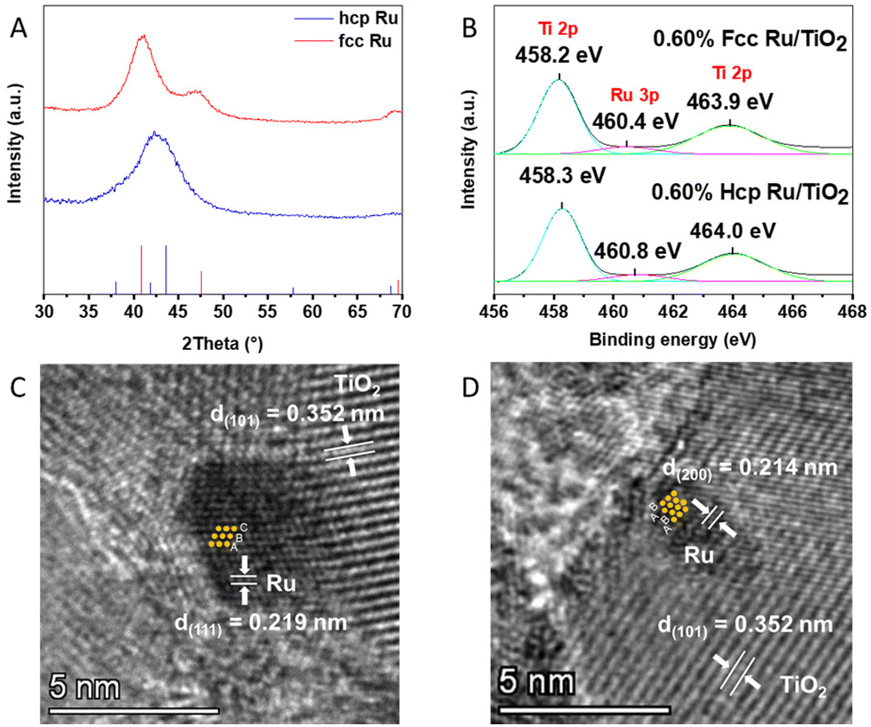 | ||
| Fig. 1 (A) X-ray diffractograms of the as synthesized fcc and hcp Ru NPs. Red and blue lines represent the locations of characteristic peaks of fcc Ru (JCPDS no. 88-2333) and hcp Ru (JCPDS no. 06-0663), respectively. (B) High-resolution XPS spectra of the core levels of Ru 3p in 0.60 wt% hcp Ru/TiO2 and 0.60 wt% fcc Ru/TiO2. HRTEM images of (C) 0.60 wt% fcc Ru/TiO2 and (D) 0.60 wt% hcp Ru/TiO2. | ||
3.2 Structural characterization of hcp and fcc Ru/TiO2 composites
The fcc and hcp Ru NPs were decorated onto the surface of TiO2via a wet impregnation method. The exact amount of Ru NPs in the Ru/TiO2 composites was confirmed by wavelength dispersive X-ray fluorescence (WDXRF), as summarised in Table S1 (ESI†).The XRD patterns of the different Ru/TiO2 composites are shown in Fig. S3 (ESI†), and all identified peaks can be assigned to TiO2. No diffraction peaks related to the presence of Ru NPs are visible, which is due to the low Ru loading (ca. 0.60 wt%). The phase composition of the Ru/TiO2 PCs was further analysed by Raman spectroscopy. As shown in Fig. S4 (ESI†), the Raman spectrum of TiO2 shows five resonances which correspond to the anatase vibration modes of TiO2: 146 cm−1 (Eg), 198 cm−1 (Eg), 399 cm−1 (Bg), 519 cm−1 (Ag/Bg) and 639 cm−1 (Eg). Notably, the peak located at 146 cm−1, representing the symmetric O–Ti–O stretching,35 is shifted towards higher wavenumbers upon functionalization with Ru NPs. This blue-shift is attributed to a microscopic structural disorder of the oxygen lattice caused by Ru loading,36 caused by a strong interaction between the Ru NPs and TiO2.
TEM images of the Ru/TiO2 composites in Fig. S5 (ESI†) show that both the fcc and hcp Ru NPs are evenly distributed on the TiO2 particles in the respective samples, and that they maintained their size upon impregnation (Fig. S6 (ESI†)) with no visible signs of coagulation. Furthermore, the crystal phases of both fcc and hcp Ru were determined by HRTEM analysis of the Ru/TiO2 composites, as shown in Fig. 1C and D. A clear ABAB stacking sequence is observed for hcp Ru in the hcp Ru/TiO2 composite while the HRTEM image of fcc Ru/TiO2 composite reveals the fcc stacking sequence of Ru, i.e., ABC. The lattice spacing of 0.352 nm, determined via Fourier transform of the TEM images, in these samples corresponds to the (101) plane of anatase TiO2.37 The valence states of the elements in the Ru/TiO2 composites were confirmed by XPS, as shown in Fig. 1B and Fig. S7 (ESI†). The peak located at 460.4 eV corresponds to Ru 3p3/2, confirming the metallic nature of Ru in the Ru/TiO2 composites.38 The other two peaks located at approximately 458.2 and 463.9 eV originate from Ti 2p3/2 and Ti 2p1/2, respectively.39
The optical absorption of 0.60 wt% hcp Ru/TiO2, 0.60 wt% fcc Ru/TiO2 and TiO2 was characterized via diffuse reflectance spectroscopy. As shown in Fig. S8 (ESI†), both the Ru/TiO2 composites exhibit a similar UV absorption fingerprint as the pure TiO2 PC. Notably, both the 0.60 wt% hcp Ru/TiO2 and 0.60 wt% fcc Ru/TiO2 composites show increased absorption in the visible light region compared to TiO2, which is derived from the light scattering and interband transitions in Ru NPs.15,40
3.3 Photocatalytic activity of the hcp and fcc Ru/TiO2 composites
The performance of the PCs i.e. pure TiO2 and the Ru/TiO2 composites were compared by performing the simultaneous benzaldehyde (BAD) and H2 production from benzyl alcohol in trifluorotoluene under simulated solar illumination (AM 1.5), shown in Scheme 1.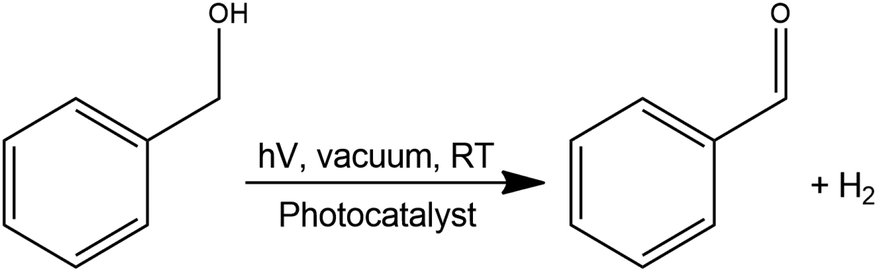 | ||
| Scheme 1 General reaction for the simultaneous photocatalytic benzaldehyde (BAD) and H2 production under simulated solar light illumination. | ||
As shown in Fig. 2A, S9 (ESI) and Table S2 (ESI†), pristine TiO2 has a BAD and H2 production rate of 246 and 228 μmol g−1 h−1, respectively; the different reaction products were confirmed by gas chromatography-mass spectrometry (Fig. S10 (ESI†)). The addition of hcp Ru NPs as cocatalysts results in a substantially increased catalytic activity. The photocatalytic activity, with 0.60 wt% hcp Ru/TiO2 as a catalyst, resulted in a BAD and H2 production rate of 1007 and 987 μmol g−1 h−1, respectively, which is a ca. 4-fold increase compared to pristine TiO2. The BAD and H2 production rates over the 0.60 wt% fcc Ru/TiO2 composite are approx. 1.9 times higher: 1877 and 1860 μmol g−1 h−1, respectively. The effect of the amount of Ru loading on the catalytic activity of the fcc Ru/TiO2 composite was investigated as well. The activity of the fcc Ru/TiO2 composites increases with an increasing amount of Ru loading (Fig. S9 (ESI†)), until an optimum is reached at 0.60 wt% of Ru loading. The photocatalytic activity decreases again upon further increasing the Ru loading due to competitive light absorption by the metal NPs.41
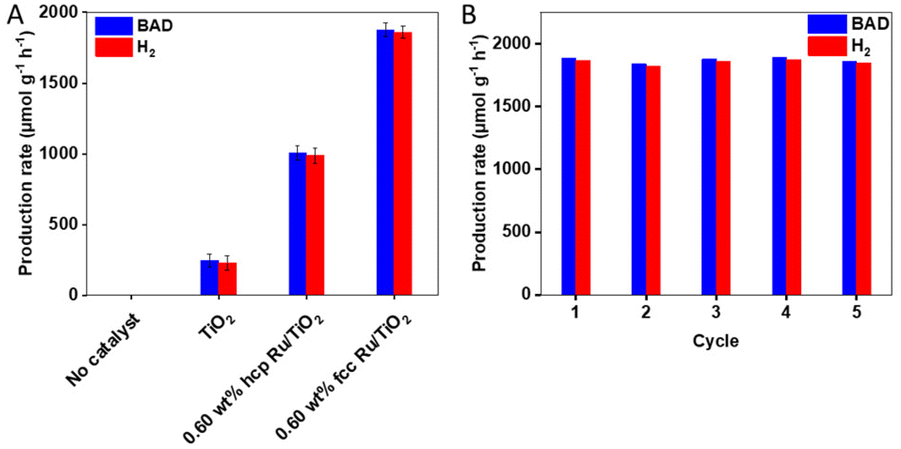 | ||
| Fig. 2 (A) Catalytic performance of TiO2, 0.60 wt% hcp Ru/TiO2 and 0.60 wt% fcc Ru/TiO2 in the simultaneous photocatalytic benzaldehyde (BAD) and hydrogen production from benzyl alcohol. (B) Recyclability of 0.60 wt% fcc Ru/TiO2 in the simultaneous photocatalytic benzaldehyde (BAD) and hydrogen production from benzyl alcohol. Reaction conditions: 1.0 mmol of benzyl alcohol, 15 mg of catalyst, 2.5 mL of trifluorotoluene, under vacuum, simulated solar light (300 W Xe lamp, AM 1.5 G), reaction time of 14 h. | ||
The stability of the fcc Ru/TiO2 catalyst was evaluated by reusing the catalyst in several consecutive experiments; Fig. 2B and Table S3 (ESI†) show the catalytic performance of 0.60 wt% fcc Ru/TiO2 in 5 consecutives cycles (total 70 h). Both the BAD and H2 production rate remained unchanged upon recycling and reuse, therefore it can be concluded that the catalyst is stable under the applied reaction conditions. XRD, performed on the fresh and used 0.60 wt% fcc Ru/TiO2 composites in Fig. S11 (ESI†), does not reveal any apparent structural changes, further supporting the high stability of the 0.60 wt% fcc Ru/TiO2 catalyst.
3.4 Origin of the improved activity of Ru/TiO2 over pristine TiO2
The origin of the activity enhancement by Ru loading was studied via photoelectrochemical characterisation. Electrochemical impedance spectroscopy (EIS) of TiO2 and the Ru/TiO2 composites was carried out to determine the charge-transfer properties between the catalyst and the solution by measuring their impedance while applying an alternating current with a frequency ranging from 0.01 Hz to 100 kHz under open circuit potential. As depicted in Fig.S12 (ESI†), the radius of the arc decreases upon loading TiO2 with Ru, with fcc Ru causing the largest reduction. A smaller arc radius means that the catalysts resistance is lower and thus possesses better charge transfer properties.42,43 This shows that the Ru/TiO2 composites, and especially fcc Ru/TiO2, have a strongly reduced charge transfer resistance with the solution compared to pristine TiO2, which leads to an enhanced photoactivity. LSV measurements were performed to measure the polarization curves and to determine the current density of the PCs. A lower overpotential at the same current density indicates a lower potential energy loss over the catalyst, resulting in a higher photocatalytic activity.44 The polarization curves (Fig. 3A) of TiO2 and the Ru/TiO2 composites show the current densities of the different PCs when applying a bias potential between the working electrode (FTO coated with a thin layer of PC) and the reference electrode (Ag/AgCl). These results show that the introduction of Ru NPs strongly increases the current densities of the Ru/TiO2 composites, compared to the bare TiO2, at a similar potential range and decreases the overpotential, this accelerates the H2 production kinetics, facilitating the reduction of protons into H2, consequently, resulting in a high H2 evolution activity.45,46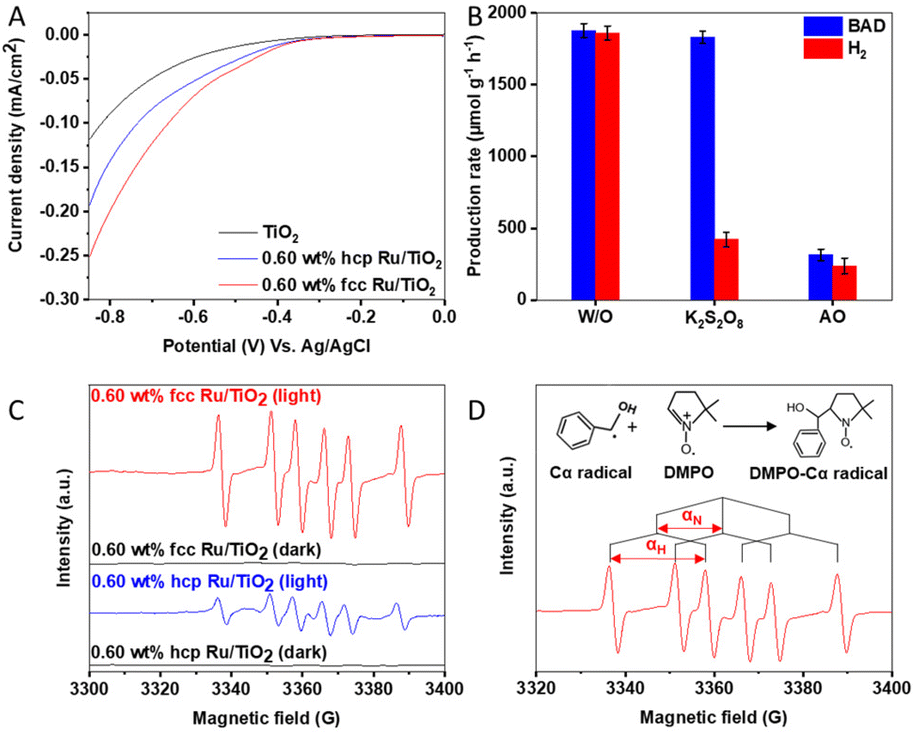 | ||
| Fig. 3 (A) Polarization curves of TiO2, 0.60 wt% hcp Ru/TiO2 and 0.60 wt% fcc Ru/TiO2 composites. (B) Catalytic performance of 0.60 wt% fcc Ru/TiO2 in the absence of scavengers (W/O), in the presence of potassium persulfate (K2S2O8) as an electron scavenger and in the presence of an ammonium oxalate (AO) as a hole scavenger in the simultaneous photocatalytic BAD and H2 production from benzyl alcohol. (C) In situ EPR of 0.60 wt% fcc Ru/TiO2 and 0.60 wt% hcp Ru/TiO2 composites in argon saturated CH3CN solution in the presence of DMPO with and without light irradiation. (D) Qualitative analysis of the EPR spectrum of 0.60 wt% fcc Ru/TiO2 composites under light irradiation in which αH = 21.8 and αN = 15.1. | ||
Photoluminescence measurements of TiO2 and the Ru/TiO2 composites were performed to probe the radiative recombination of photogenerated charge carriers.47,48 Similar PL was observed for TiO2 and the Ru/TiO2 composites, as shown in Fig. S13 (ESI†). Illumination of TiO2 with ultraviolet light results in a weak, broad visible light photoluminescence arising from the radiative recombination of charge carriers, with the emission intensity proportional to the recombination probability.36 The diminished PL intensity of Ru/TiO2 composites as compared with TiO2 confirms that the decoration of Ru NPs enhances electron hole separation and reduces the radiative charge carrier recombination.9 This is ascribed to the formation of the Schottky barrier at the Ru/TiO2 interface,39 with Ru acting as an electron sink, as depicted in Fig. 4. Moreover, the PL intensity of the 0.60 wt% fcc Ru/TiO2 composite is lower than that of the 0.60 wt% hcp Ru/TiO2 composite, which suggests a more efficient transfer of the photogenerated electrons to the Ru NPs. The increased charge carrier separation of the fcc Ru/TiO2 composite compared to the hcp Ru/TiO2 composite is directly caused by an increase of the Schottky barrier height, retarding the backflow of photogenerated electrons and decreasing the charge recombination rate.49Fig. 4 shows that the Schottky barrier height of the metal-based composite is directly related to the work function of the metal cocatalyst. Furthermore, it is reported in literature that each lattice plane has its own work function and that the work function of metal NPs is dependent on the lattice planes on the surface.50,51 Therefore, the work function of a material is strongly dependent on its size, shape and crystal phase. The fcc and hcp Ru NPs studied in this work have a similar size and are both spherical. The difference in work function between both materials thus results from the strong difference in lattice plane composition at the surface caused by their difference in crystal phase. The work function of hcp and fcc Ru was determined via density-functional theory (DFT) calculations of the main lattice plane of both crystal phases. The main lattice planes of hcp and fcc Ru were determined via analysis of the XRD data to be the H(101) and F(111) planes for hcp and fcc Ru, respectively. The optimized structures of the H(101) and F(111) lattice planes, calculated via DFT, are shown in Figs. S14 and S15 (ESI†). It was determined from these lattice planes that hcp and fcc Ru have a work function of 4.1 eV and 5.0 eV respectively. This results in a Schottky barrier height, determined via the Schottky–Mott rule,49 of respectively 0.3 and 1.2 eV for the hcp and fcc Ru/TiO2 composites. The enhanced photocatalytic performance of fcc Ru/TiO2, compared to hcp Ru/TiO2, can be directly explained by the difference in work function between the fcc and hcp Ru NPs, resulting in the different charge separation efficiency. The difference in catalytic activity of hcp and fcc Ru was further studied by calculating the H+ and H2 adsorption on both hcp and fcc Ru (Table S4 (ESI) and Fig. S14 (ESI†)). For this the most prominent crystal facet, as determined from XRD, for both was used i.e. H(101) and F(111). The increased H+ adsorption strength on fcc Ru, compared to hcp Ru, indicates that H+ will more strongly adsorb on fcc Ru, resulting in a higher availability of activated protons and hence probability of H2 formation. The weaker H2 adsorption on fcc Ru, compared to hcp Ru, suggests that fcc Ru more easily desorbs the reaction product H2. Both support the experimentally determined increased activity of fcc Ru over hcp Ru in the photocatalytic H2 production.
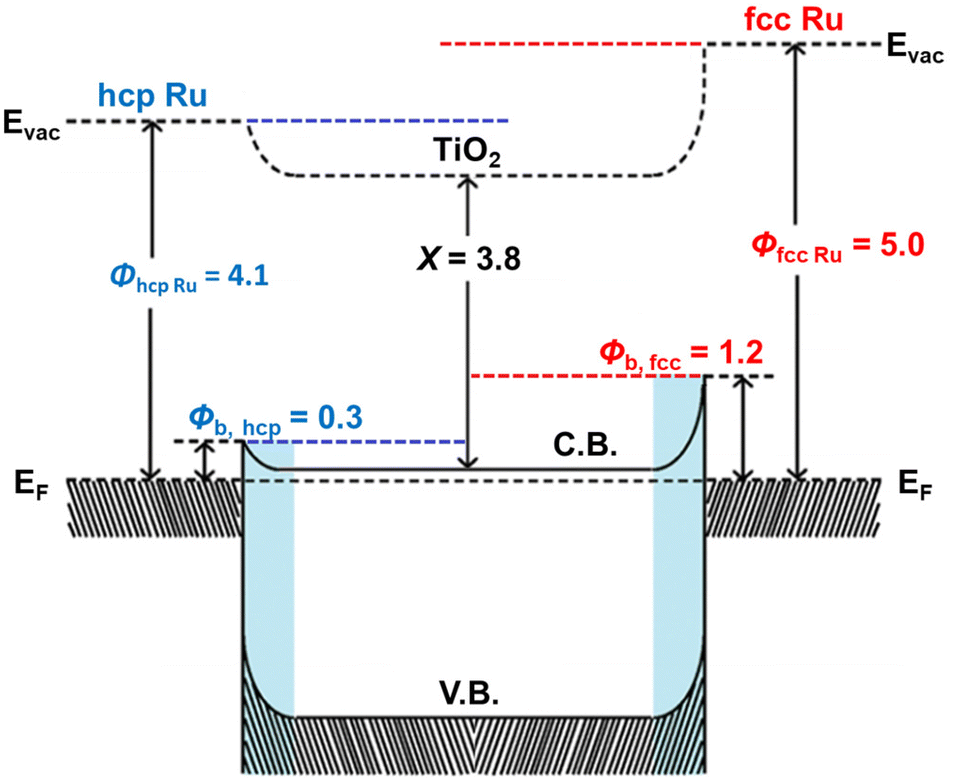 | ||
| Fig. 4 Schematic energy-band diagram of hcp Ru/TiO2 and fcc Ru/TiO2 composites in which ϕRu is the work function of Ru, ϕb the Schottky barrier height and X the electron affinity of TiO2. | ||
3.5 Reaction mechanism for simultaneous BAD and H2 production over fcc Ru/TiO2
The reaction mechanism behind the simultaneous photocatalytic BAD and H2 production over 0.60 wt% fcc Ru/TiO2 was studied in more detail by performing a series of blank and control experiments using specific radical scavengers. No BAD and H2 are produced in absence of a catalyst and/or light, confirming that the reaction is driven by a photocatalytic process (Table S5 (ESI†)). Potassium persulfate (K2S2O8) was used as an electron scavenger and ammonium oxalate (AO) as a hole scavenger and added into the reaction system,52 as shown in Fig. 3B and Table S6 (ESI†). In presence of K2S2O8, the generation of H2 is significantly decreased, while the production of BAD remains unaltered. This can be explained by the reduction of S2O82− to SO42− by the photoelectrons, thus competing with the H2 generation.45 Notably, both BAD and H2 production are decreased due to the introduction of AO, demonstrating that the protons for the H2 production originate from the BA oxidation and that the hole-induced BA oxidation is the rate determining step.In situ electron paramagnetic resonance (EPR) was performed to further unravel the reaction mechanism by demonstrating the presence of reaction intermediates during the oxidation of BA into BAD by using 5,5-dimethyl-1-pyrroline-N-oxide (DMPO) as a spin-trapping agent. As shown in Fig. 3C, six characteristic peaks are detected in the presence of light over the 0.60 wt% hcp Ru/TiO2 and 0.60 wt% fcc Ru/TiO2 composites, while no free radical signals are measured in dark. The peaks corresponding to nitrogen hyperfine splitting (αN) and hydrogen hyperfine splitting (αH) show the generation of carbon-centered radical intermediates (Fig. 3D).53 Moreover, the EPR signal intensity for 0.60 wt% fcc Ru/TiO2 is much stronger than that of 0.60 wt% hcp Ru/TiO2 under simulated solar light illumination (AM 1.5). This observation is caused by the formation of an increased amount of DMPO-Cα radical, showing that an increased amount of reaction intermediates is formed during the catalytic reaction by the fcc Ru/TiO2 composite. This demonstrates that loading TiO2 with fcc Ru NPs accelerates the catalytic reaction much stronger as compared to loading TiO2 with hcp Ru NPs.
Based on the above observations, the reaction mechanism for the simultaneous photocatalytic BAD and H2 production from benzaldehyde over fcc Ru/TiO2 is proposed in Scheme S1 (ESI†). First, TiO2 excited by solar light generates electron–hole pairs. The photogenerated holes in the valence band (VB) of TiO2 can oxidize the adsorbed benzyl alcohol to generate carbon-centered radical intermediates and protons. Then, the as-formed radicals will be further oxidized by an extra hole to form BAD. In the meantime, the photogenerated electrons in the conduction band (CB) of TiO2 will transfer to fcc Ru NPs due to the formation of a Schottky barrier to retard the recombination of charge carriers. The separated electrons will react with the released protons, reducing them to form H2.
4 Conclusions
In this work, we compared the performance of regular hcp and allotropic fcc Ru NPs as cocatalysts for the simultaneous photocatalytic production of BAD and H2 from benzyl alcohol over TiO2. The BAD and H2 production rates over the optimal 0.60 wt% fcc Ru/TiO2 composite are 1877 and 1860 μmol g−1 h−1, respectively, which are 7.6- and 8.2-times increases over the production rate of pristine TiO2. This is attributed to the formation of a Schottky barrier between Ru and TiO2 to efficiently transfer the photogenerated charge carriers. Due to the formation of this Schottky barrier, Ru acts as an electron sink. This causes the electrons to be trapped on the surface of Ru, while the holes remain on the surface of TiO2. The oxidation of BA to BAD will therefore occur on the surface of TiO2, while the reduction of protons to H2 occurs on the surface of Ru. Furthermore, the 0.60 wt% fcc Ru/TiO2 composite exhibits a 1.9-fold activity enhancement compared to the 0.60 wt% hcp Ru/TiO2 composite, which is ascribed to the fact that fcc Ru NPs are more efficient in facilitating the charge transfer as compared hcp Ru NPs. In addition, the Schottky barrier height, determined via the Schottky–Mott rule, between fcc Ru and TiO2 (1.2 eV) is higher than that in the hcp Ru/TiO2 composite (0.3 eV), which is beneficial for retarding the backflow of photoelectrons and facilitates the catalytic reactions, resulting in the improved photoactivity for the 0.60 wt% fcc Ru/TiO2 composite over the 0.60 wt% hcp Ru/TiO2 composite.Author contributions
Michaël Gebruers: conceptualization, methodology, lead investigation, writing – original draft, visualization. Chunhua Wang: supporting investigation. Rafikul A. Saha: formal analysis Yangshan Xie: supporting investigation. Imran Aslam: supporting investigation. Li Sun: supporting investigation. Yuhe Liao: supporting investigation. Xuhui Yang: supporting investigation Taoran Chen: supporting investigation. Min-Quan Yang: supervision. Bo Weng: conceptualization, writing – review & editing, supporting investigation. Maarten B. J. Roeffaers: conceptualization, validation, resources, writing – review & editing, supervision, project administration, funding acquisition.Conflicts of interest
There are no conflicts to declare.Acknowledgements
This work was financially supported by the Research Foundation – Flanders (FWO grants G098319N, 1280021N), the KU Leuven Research Fund (C14/19/079, iBOF-21-085 PERSIST), and KU Leuven Industrial Research Fund (C3/19/046).References
- L. Wang, X. Zhang, L. Yang, C. Wang and H. Wang, Catal. Sci. Technol., 2015, 5, 4800–4805 RSC.
- S. Higashimoto, N. Kitao, N. Yoshida, T. Sakura, M. Azuma, H. Ohue and Y. Sakata, J. Catal., 2009, 266, 279–285 CrossRef CAS.
- A. Fujishima, X. Zhang and D. A. Tryk, Surf. Sci. Rep., 2008, 63, 515–582 CrossRef CAS.
- F. Zhang, X. Wang, H. Liu, C. Liu, Y. Wan, Y. Long and Z. Cai, Appl. Sci., 2019, 9, 2489 CrossRef CAS.
- C. Wang, B. Weng, M. Keshavarz, M. Q. Yang, H. Huang, Y. Ding, F. Lai, I. Aslam, H. Jin, G. Romolini, B. L. Su, J. A. Steele, J. Hofkens and M. B. J. Roeffaers, ACS Appl. Mater. Interfaces, 2022, 14, 17185–17194 CrossRef CAS PubMed.
- S. Lu, B. Weng, A. Chen, X. Li, H. Huang, X. Sun, W. Feng, Y. Lei, Q. Qian and M. Q. Yang, ACS Appl. Mater. Interfaces, 2021, 13, 13044–13054 CrossRef CAS PubMed.
- S. Zhong, Y. Xi, S. Wu, Q. Liu, L. Zhao and S. Bai, J. Mater. Chem. A, 2020, 8, 14863–14894 RSC.
- S. Wang, Y. Zhang, Y. Zheng, Y. Xu, G. Yang, S. Zhong, Y. Zhao and S. Bai, Small, 2022, 2204774, 1–13 Search PubMed.
- T. Chen, M. Li, L. Shen, M. B. J. Roeffaers, B. Weng, H. Zhu, Z. Chen, D. Yu, X. Pan, M. Q. Yang and Q. Qian, Front. Chem., 2022, 10, 833784 CrossRef CAS PubMed.
- J. Ran, M. Jaroniec and S. Z. Qiao, Adv. Mater., 2018, 30, 1704649 CrossRef PubMed.
- J. Yang, D. Wang, H. Han and C. Li, Acc. Chem. Res., 2013, 46, 1900–1909 CrossRef CAS PubMed.
- L. L. Tan, W. J. Ong, S. P. Chai and A. R. Mohamed, Appl. Catal., B, 2015, 166–167, 251–259 CrossRef CAS.
- J. Long, H. Huang, J. Zhao, B. Weng, F. Lai, M. Zhang, J. Hofkens, M. B. J. Roeffaers and J. A. Steele, Angew. Chem., Int. Ed., 2022, 61, e202204563 CrossRef PubMed.
- J. Tian, J. Li, N. Wei, X. Xu, H. Cui and H. Liu, Ceram. Int., 2016, 42, 1611–1617 CrossRef CAS.
- M. Ismael, New J. Chem., 2019, 43, 9596–9605 RSC.
- K. Guo, X. Zhu, L. Peng, Y. Fu, R. Ma, X. Lu, F. Zhang, W. Zhu and M. Fan, Chem. Eng. J., 2021, 405, 127011 CrossRef CAS.
- S.-T. Zhang, C.-M. Li, H. Yan, M. Wei, D. G. Evans and X. Duan, J. Phys. Chem. C, 2014, 118, 3514–3522 CrossRef CAS.
- G. Viau, L. Brayner, L. Poul, N. Chakroune, E. Lacaze, F. Fievet-Vincent and F. Fievet, Chem. Mater., 2003, 15, 486–494 CrossRef CAS.
- K. Kusada, H. Kobayashi, T. Yamamoto, S. Matsumura, K. Sato, K. Nagaoka, Y. Kubota and H. Kitagawa, J. Am. Chem. Soc., 2013, 135, 5493–5496 CrossRef CAS PubMed.
- Z. Fan and H. Zhang, Acc. Chem. Res., 2016, 49, 2841–2850 CrossRef CAS PubMed.
- Z. Fan and H. Zhang, Chem. Soc. Rev., 2016, 45, 63–82 RSC.
- M. Zhao and Y. Xia, Nat. Rev. Mater., 2020, 5, 440–459 CrossRef CAS.
- H. Li, X. Zhou, W. Zhai, S. Lu, J. Liang, Z. He, H. Long, T. Xiong, H. Sun, Q. He, Z. Fan and H. Zhang, Adv. Energy Mater., 2020, 10, 2002019–2002030 CrossRef CAS.
- J. Liu, Q. Ma, Z. Huang, G. Liu and H. Zhang, Adv. Mater., 2019, 31, 1800696–1900715 CrossRef PubMed.
- F. Ye, F. Wang, C. Meng, L. Bai, J. Li, P. Xing, B. Teng, L. Zhao and S. Bai, Appl. Catal., B, 2018, 230, 145–153 CrossRef CAS.
- W. Shang, Y. Li, H. Huang, F. Lai, M. B. J. Roeffaers and B. Weng, ACS Catal., 2021, 11, 4613–4632 CrossRef CAS.
- J. Hafner, J. Comput. Chem., 2008, 29, 2044–2078 CrossRef CAS PubMed.
- G. Kresse and J. Hafner, Phys. Rev. B: Condens. Matter Mater. Phys., 1993, 48, 13115–13118 CrossRef CAS PubMed.
- J. P. Perdew, K. Burke and Y. Wang, Phys. Rev. B: Condens. Matter Mater. Phys., 1996, 54, 16533–16539 CrossRef CAS PubMed.
- M. Zhao, Z. D. Hood, M. Vara, K. D. Gilroy, M. Chi and Y. Xia, ACS Nano, 2019, 13, 7241–7251 CrossRef CAS PubMed.
- H. Ye, Q. Wang, M. Catalano, N. Lu, J. Vermeylen, M. J. Kim, Y. Liu, Y. Sun and X. Xia, Nano Lett., 2016, 16, 2812–2817 CrossRef CAS PubMed.
- M. Kumar, P. Devi and V. D. Shivling, Mater. Res. Express, 2017, 4, 085006 CrossRef.
- W. Z. Li, J. X. Liu, J. Gu, W. Zhou, S. Y. Yao, R. Si, Y. Guo, H. Y. Su, C. H. Yan, W. X. Li, Y. W. Zhang and D. Ma, J. Am. Chem. Soc., 2017, 139, 2267–2276 CrossRef CAS PubMed.
- Z. Wu and H. Jiang, RSC Adv., 2015, 5, 34622–34629 RSC.
- U. Balachandran and N. G. Eror, J. Solid State Chem., 1982, 42, 276–282 CrossRef CAS.
- S. K. Khore, S. R. Kadam, S. D. Naik, B. B. Kale and R. S. Sonawane, New J. Chem., 2018, 42, 10958–10968 RSC.
- B. Liu, X. Li, Q. Zhao, J. Ke, M. Tadé and S. Liu, Appl. Catal., B, 2016, 185, 1–10 CrossRef CAS.
- M. Zhao, Z. Chen, Z. Lyu, Z. D. Hood, M. Xie, M. Vara, M. Chi and Y. Xia, J. Am. Chem. Soc., 2019, 141, 7028–7036 CrossRef CAS PubMed.
- B. Weng, Q. Quan and Y. J. Xu, J. Mater. Chem. A, 2016, 4, 18366–18377 RSC.
- C. Liu, K. S. Kim, J. Baek, Y. Cho, S. Han, S. W. Kim, N. K. Min, Y. Choi, J. U. Kim and C. J. Lee, Carbon, 2009, 47, 1158–1164 CrossRef CAS.
- A. T. Kuvarega, R. W. M. Krause and B. B. Mamba, J. Phys. Chem. C, 2011, 115, 22110–22120 CrossRef CAS.
- W. Qi, C. Wang, J. Yu, S. Adimi, T. Thomas, H. Guo, S. Liu and M. Yang, ACS Appl. Energy Mater., 2022, 5, 6155–6162 CrossRef CAS.
- L. Peng, C. Yu, Y. Ma, G. Xie, X. Xie, Z. Wu and N. Zhang, Inorg. Chem. Front., 2022, 9, 994–1005 RSC.
- S. Liu, W. Qi, S. Adimi, H. Guo, B. Weng, J. P. Attfield and M. Yang, ACS Appl. Mater. Interfaces, 2021, 13, 7238–7247 CrossRef CAS PubMed.
- T. Chen, B. Weng, S. Lu, H. Zhu, Z. Chen, L. Shen, M. B. J. Roeffaers and M. Q. Yang, J. Phys. Chem. Lett., 2022, 13, 6559–6565 CrossRef CAS PubMed.
- H. Wang, P. Hu, J. Zhou, M. B. J. Roeffaers, B. Weng, Y. Wang and H. Ji, J. Mater. Chem. A, 2021, 9, 19984–19993 RSC.
- S. Liu, W. Kuang, X. Meng, W. Qi, S. Adimi, H. Guo, X. Guo, E. Pervaiz, Y. Zhu, D. Xue and M. Yang, Chem. Eng. J., 2021, 416, 129116 CrossRef CAS.
- Y. Huang, Y. Zhu, S. Chen, X. Xie, Z. Wu and N. Zhang, Adv. Sci., 2021, 8, 2003626 CrossRef CAS PubMed.
- X. Li, L. Chen, J. Wang, J. Zhang, C. Zhao, H. Lin, Y. Wu and Y. He, J. Colloid Interface Sci., 2022, 618, 362–374 CrossRef CAS PubMed.
- C. Li, W. Chen, M. Li, Q. Sun and Y. Jia, New J. Phys., 2015, 17, 053006 CrossRef.
- H. Lin, J. X. Liu, H. Fan and W. X. Li, J. Phys. Chem. C, 2020, 124, 11005–11014 CrossRef CAS.
- H. Huang, H. Yuan, J. Zhao, G. Solís-Fernández, C. Zhou, J. W. Seo, J. Hendrix, E. Debroye, J. A. Steele, J. Hofkens, J. Long and M. B. J. Roeffaers, ACS Energy Lett., 2019, 4, 203–208 CrossRef CAS.
- Q. Guo, F. Liang, X. B. Li, Y. J. Gao, M. Y. Huang, Y. Wang, S. G. Xia, X. Y. Gao, Q. C. Gan, Z. S. Lin, C. H. Tung and L. Z. Wu, Chem, 2019, 5, 2605–2616 CAS.
Footnotes |
| † Electronic supplementary information (ESI) available. See DOI: https://doi.org/10.1039/d2nr06447b |
| ‡ These authors contributed equally to this work. |
| This journal is © The Royal Society of Chemistry 2023 |