
Grain boundary sliding and distortion on a nanosecond timescale induce trap states in CsPbBr3: ab initio investigation with machine learning force field†
Dongyu
Liu
a,
Yifan
Wu
b,
Andrey S.
Vasenko
 *ac and
Oleg V.
Prezhdo
*bd
*ac and
Oleg V.
Prezhdo
*bd
aHSE University, 101000 Moscow, Russia. E-mail: avasenko@hse.ru
bDepartment of Chemistry, University of Southern California, Los Angeles, CA 90089, USA. E-mail: prezhdo@usc.edu
cI.E. Tamm Department of Theoretical Physics, P.N. Lebedev Physical Institute, Russian Academy of Sciences, 119991 Moscow, Russia
dDepartment of Physics & Astronomy, University of Southern California, Los Angeles, CA 90089, USA
First published on 5th December 2022
Abstract
Grain boundaries (GBs) in perovskite solar cells and optoelectronic devices are widely regarded as detrimental defects that accelerate charge and energy losses through nonradiative carrier trapping and recombination, but the mechanism is still under debate owing to the diversity of GB configurations and behaviors. We combine ab initio electronic structure and machine learning force field to investigate evolution of the geometric and electronic structure of a CsPbBr3 GB on a nanosecond timescale, which is comparable with the carrier recombination time. We demonstrate that the GB slides spontaneously within a few picoseconds increasing the band gap. Subsequent structural oscillations dynamically produce midgap trap states through Pb–Pb interactions across the GB. After several hundred picoseconds, structural distortions start to occur, increasing the occurrence of deep midgap states. We identify a distinct correlation of the average Pb–Pb distance and fluctuations in the ion coordination numbers with the appearance of the midgap states. Suppressing GB distortions through annealing and breaking up Pb–Pb dimers by passivation can efficiently alleviate the detrimental effects of GBs in perovskites. The study provides new insights into passivation of the detrimental GB defects, and demonstrates that structural and charge carrier dynamics in perovskites are intimately coupled.
Introduction
Metal halide perovskite (MHP) solar cells and other optoelectronic devices have drawn enormous attention because of their rapidly increasing power conversion efficiency (PCEs) and cost-effective fabrication.1–5 Since the first MHP solar cell was reported in 2009, the record efficiency has rapidly grown from 3.8% to 25.7%.6–9 This remarkable improvement is achieved by the rational design of solar cell architectures and the efficient defect passivation strategies.10–17 However, grain boundaries (GBs), which are unavoidable in the low-temperature solution-based preparation processes, still lead to significant energy losses in most MHPs.18–21 The role of GBs in MHP solar cells is unclear at present,22,23 and both beneficial and detrimental influences have been reported.24–26 GBs typically serve as charge carrier recombination centers with midgap trap states reducing the carrier lifetime.27–31 However, theoretical studies demonstrate that pristine GBs in MHPs do not generate midgap traps despite some defective configurations are formed.32–34 The defects in MHP GBs are also unlikely to produce deep traps,35 which is consistent with the so-called defect tolerance property of MHPs.36–38 Nevertheless, atomistic calculations indicate that both pristine and defective GBs accelerate the nonradiative carrier recombination by introducing localized electronic states at dangling and wrongly formed bonds, and the corresponding passivation strategies are developed.39–43 Besides, point defects are reported to have lower formation energies in the GB region than in the bulk, which leads to defect accumulation at GBs and further increases the carrier recombination rate.44–46 Furthermore, the GBs are reported to facilitate ion migration, but this effect can result in both beneficial defect healing and detrimental structural degradation.47,48 Experimentally, MHP GBs are observed to exhibit various configurations,49,50 and atomistic description of such GB configurations and electronic properties are unaffordable at the ab initio level, because of large system size and long-scale slow motions occurring in GB regions.To address the computational cost issue, machine learning (ML) is emerging as a powerful approach in both identifying GB structures and speeding up calculations.51–53 With accurate but expensive ab initio calculation results as training sets, ML force field (FF) models can provide atomistic forces and energies at the ab initio accuracy but at a much lower computational cost.54 These cost-effective ML FFs enable molecular dynamics (MD) simulations for larger systems with longer trajectories compared to ab initio MD (AIMD) simulations.55–58 Considering that calculated nonradiative recombination times of the GB systems are in nanoseconds, while AIMD simulations are limited to picoseconds,39,41 the ML-based MD (MLMD) can bridge this gap and track structure evolutions during the whole charge recombination period. Meanwhile, distinct structural fluctuations are observed in MD simulations of defective perovskites, and the resulting changes in electronic properties can dramatically affect the carrier dynamics.59–64 Therefore, combining ab initio electronic structure analysis with MLMD simulation61 can provide critical insights into the role that GBs play in MHP solar cells and other devices.
In this work, we combine ML with ab initio electronic structure theory to investigate nanosecond structural dynamics of the Σ5 (120) GB in the CsPbBr3 perovskite and its impact on the electronic structure. CsPbBr3 is a promising solar cell material with superior stability, but it suffers from a serious open-circuit voltage deficit owing to the defective interfaces and GBs.65–67 Static calculations indicate that the CsPbBr3 GBs are unlikely to introduce trap states in the forbidden band, but some GBs, such as Σ5 (120), exhibit Pb–Pb hybridization across the boundary, creating states at the band edge.33,41 Notably, Pb–Pb bonds always create midgap states in defective MHPs.68–70 We find that a symmetrical GB model slides spontaneously within a few picoseconds. The sliding elongates Pb–Pb bonds and eliminates their hybridization, increasing the band gap. However, the GB configuration is highly sensitive to thermal fluctuations, and the Pb–Pb distances can be reduced at some moments to produce transient Pb–Pb hybridized states. These states tend to be deep inside the band gap and localized, because the Pb–Pb interactions are short-range and relatively independent of the surroundings. Moreover, after several hundred picoseconds, distinct distortions start to appear in the GB region and intensify the Pb–Pb distance oscillations. We establish a correlation between the average Pb–Pb distance and the probability to form deep traps, which may help understand the experimental observations and provide guidelines for GB passivation.
Methods
The ab initio density functional theory (DFT) calculations were performed with the Vienna Ab initio Simulation Package (VASP).71–74 The Perdew–Burke–Ernzerhof (PBE) functional75 was used in conjunction with the projected-augmented wave (PAW) method76 to describe the electron–nuclei interactions. The cutoff energy of the plane wave basis was set to 300 eV. The convergence criteria for the energy and geometry optimization calculations were 10−5 eV and 0.02 eV Å−1, respectively. Grimme's D3 model with damping was adapted to include the dispersion interactions.77,78 The Σ5 (120) GB model was constructed by merging two CsPbBr3 (120) slabs in opposite directions using the Atomsk code.79 The system contained 200 atoms in total. The AIMD was performed at 300 K in the canonical ensemble, and only the Γ-point was considered in the DFT calculations because the simulation cell contained 40 unit cells. The ML FF was developed with the DeePMD-kit package,80 and the MLMD was implemented at the same temperature and ensemble as the AIMD using the LAMMPS code.81 The geometric structures and charge densities were visualized with the VESTA software package.82 More computational details are given in the ESI.†Results and discussion
Fig. 1a shows the as-built CsPbBr3 Σ5 (120) GB model. The mirror-symmetrical configuration deploys the same ion types on both sides of the boundary planes in relatively close proximity. Such coordination induces Coulomb repulsion between the same ions and makes the system unstable. Sliding along the GB directions can alleviate such ionic repulsion by increasing distances between ions of the same charge and even introducing some cation–anion attractions, which are reported to lower the GB formation energies.33,83 We calculated the energy changes when manually sliding the GB along different directions. as shown in Fig. 1b, using the computational method illustrated in Fig. S2.† The energy diagram, Fig. 1b, demonstrates that the initial structure is metastable, and that sliding in both directions in the GB plane can effectively lower the system energy. Specifically, the energy reduces faster in the [001] direction, indicating that sliding along this direction is more likely to occur spontaneously. Fig. 1c displays the potential energy evolution of the system in a 5 ps AIMD trajectory. The energy curve rapidly raises at the beginning because the atoms leave their equilibrium positions due to a thermal perturbation. The energy reaches the peak value within about 0.2 ps and then decreases in an approximately exponential trend, which indicates reconstructions toward lower energy configurations. After about 3 ps, the system enters a relatively steady state, and the potential energy only fluctuates within a small range. This condition is maintained over the longer trajectory shown in the insert of Fig. 1c. To clarify the structural transformations occurring within this period, snapshots of three configurations (i.e., states 1–3 in Fig. 1c) were drawn in Fig. 1d from different directions. The GB structure from the [001] direction (the top row) is barely changed among these states, but a distinct sliding is observed from the [2![[1 with combining macron]](https://www.rsc.org/images/entities/char_0031_0304.gif) 0] direction (the bottom row). This result is consistent with the energy calculation results that the sliding along the [001] direction is thermodynamically more favourable, Fig. 1b. Moreover, the GB region exhibits a bending after the sliding, with the local coordination notably distorted compared to the equilibrium cubic perovskite structure, suggesting that significant fluctuations may take place on longer timescales.
0] direction (the bottom row). This result is consistent with the energy calculation results that the sliding along the [001] direction is thermodynamically more favourable, Fig. 1b. Moreover, the GB region exhibits a bending after the sliding, with the local coordination notably distorted compared to the equilibrium cubic perovskite structure, suggesting that significant fluctuations may take place on longer timescales.
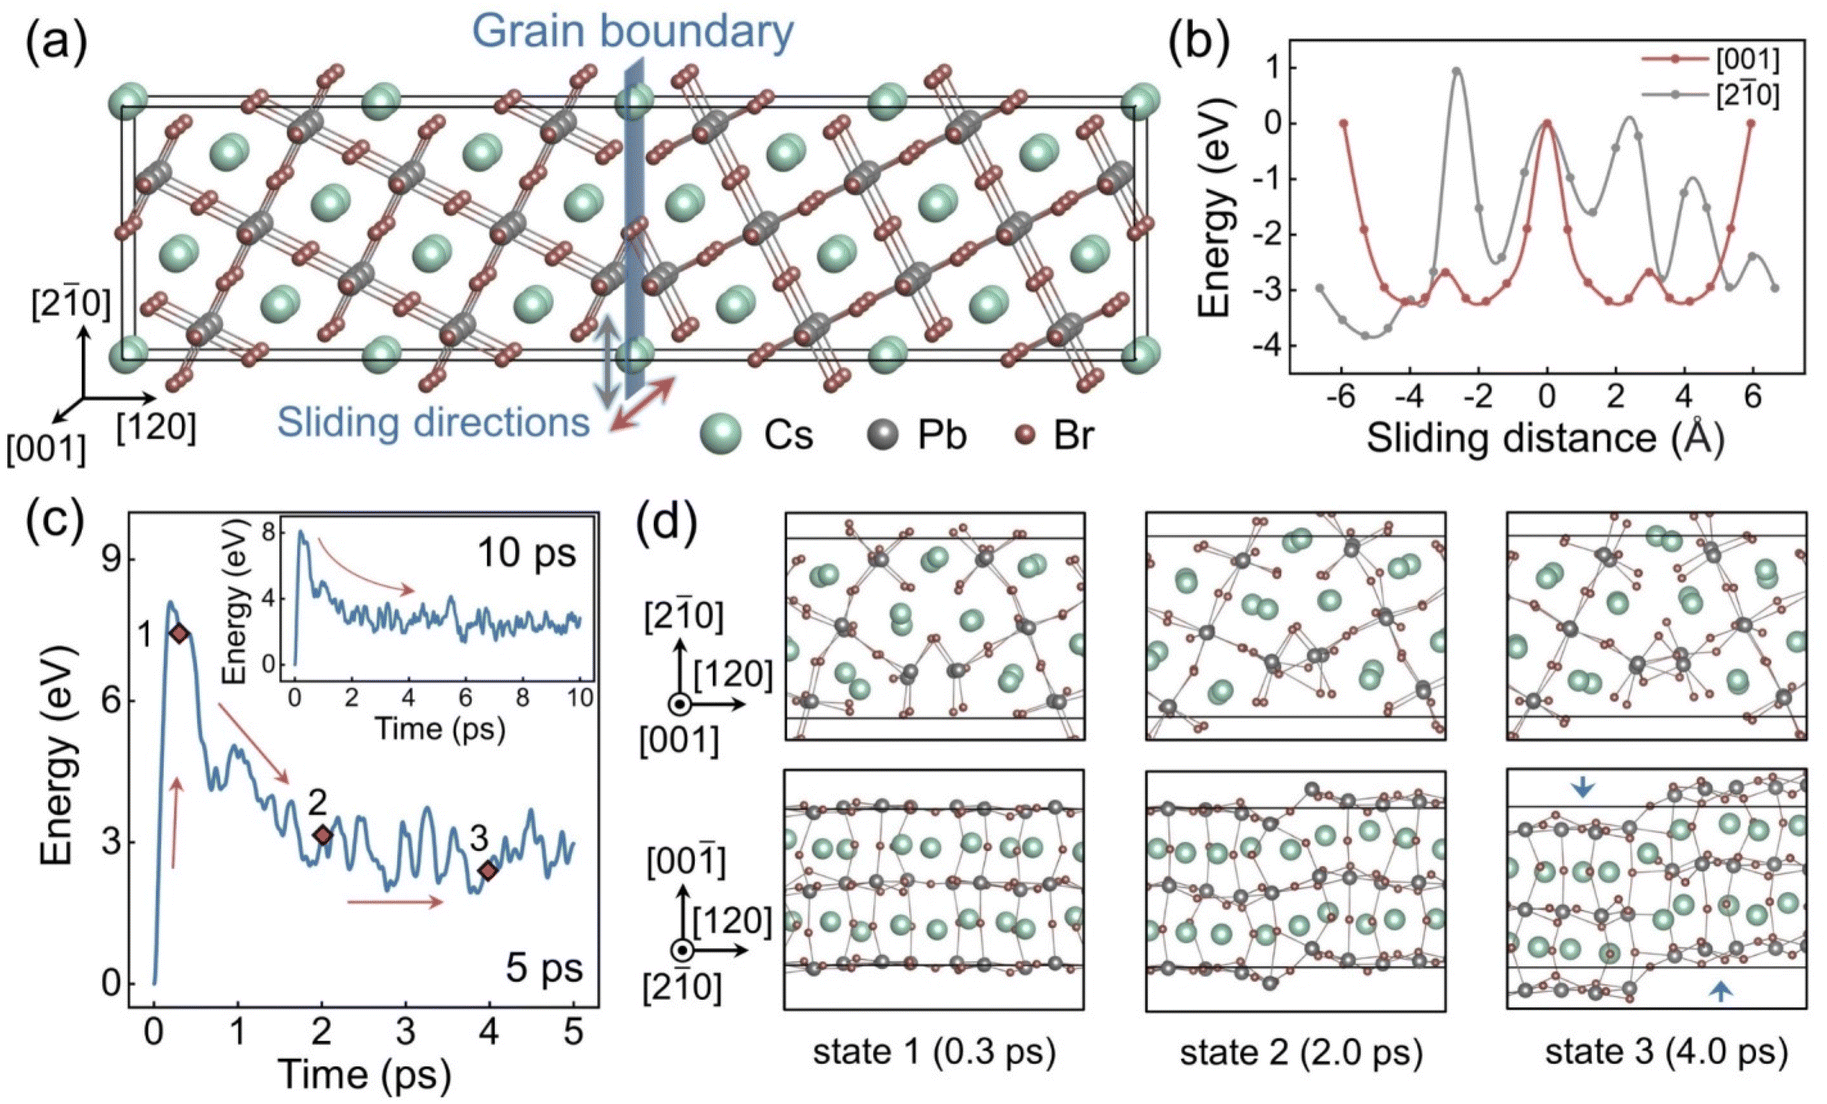 | ||
| Fig. 1 (a) Geometric structure of the CsPbBr3 Σ5 (120) grain boundary model. (b) Relative energy of the GB system sliding along the [001] and [20] directions. (c) Relative potential energy evolution in the first 5 ps AIMD trajectory (inset: 10 ps trajectory). (d) Snapshots of the GB structure in states 1–3, labelled in part (c) and shown from the [001] (top) and [20] (bottom) directions. | ||
The impact of the GB sliding on the electronic structure was further investigated. Fig. 2a shows the density of states (DOS) and frontier orbitals of the initial and slipped GB models after geometry optimization. The slipped model is obtained by sliding the GB along the [001] direction over quarter of the simulation cell. For the initial system, localized states appear below the conduction band minimum (CBM). The states arise from the Pb–Pb interaction, as indicated by the charge density of the lowest unoccupied molecular orbital (LUMO). The interaction is between the empty 6p orbitals of Pb2+ in the conduction band.69 The GB sliding eliminates such bonding states by enlarging the Pb–Pb distances from 3.54 Å to 4.34 Å and reducing the 6p orbitals hybridization. The highest occupied molecular orbital (HOMO) in the initial system mainly distributes around the Br dangling bonds. The GB sliding increases distances between these unsaturated Br anions to mitigate their repulsive interactions and changes the HOMO components. The sliding lowers the energy of the localized states at the VBM and merges them into the valence band, Fig. 2a.
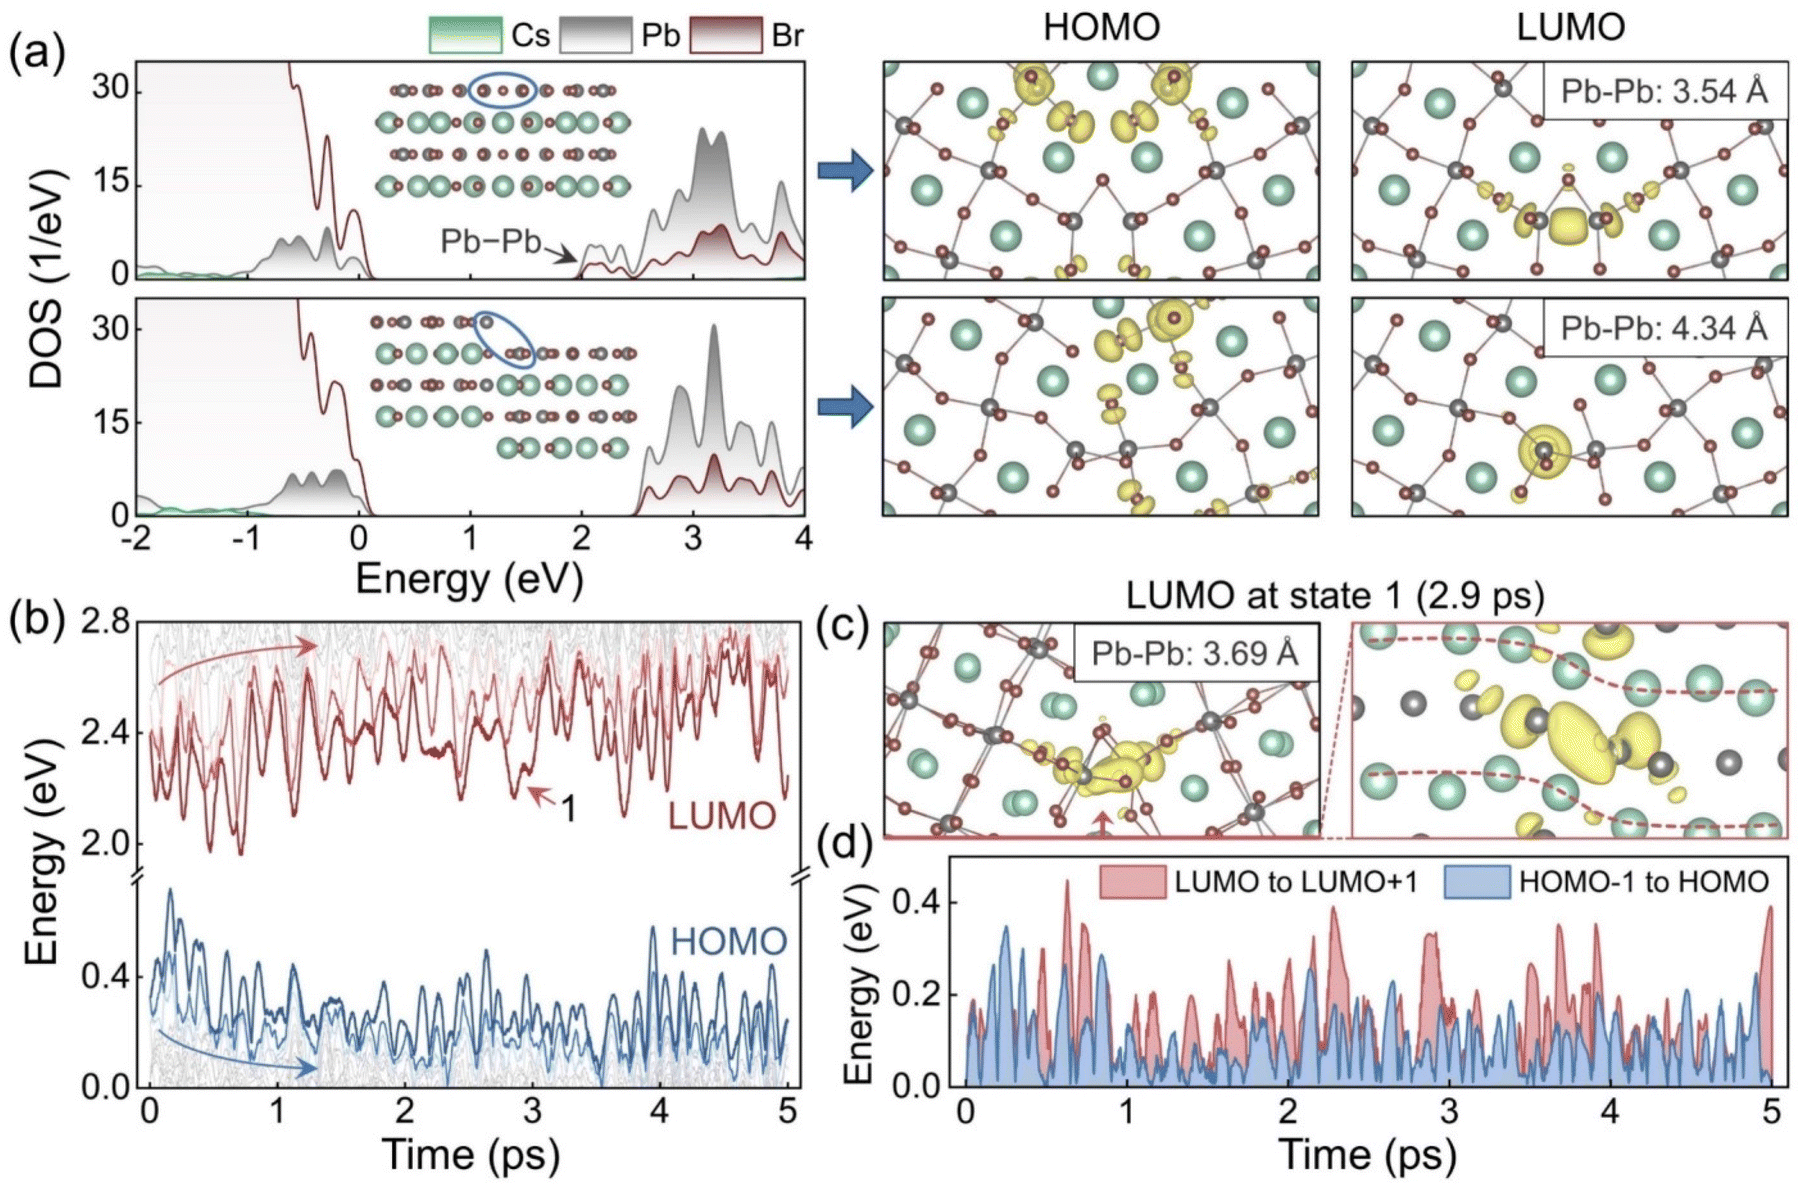 | ||
| Fig. 2 (a) Density of states (DOS) before and after the GB sliding along the [001] direction over quarter of the simulation cell, and the corresponding HOMO and LUMO charge densities. (b) Energy level evolutions in the AIMD trajectory. (c) Charge density of LUMO in state 1, Fig. 1c, shown from different directions. The Br atoms are omitted in the right panel. The inserts in the charge density plots give the shortest Pb–Pb distances. (d) Evolutions of the energy gaps from LUMO to LUMO+1 and from HOMO−1 to HOMO in the AIMD trajectory. | ||
Besides the rigid body translation, structural fluctuations in the GB region also modify the electronic structure. Fig. 2b plots evolution of the energy levels in the 5 ps AIMD trajectory. In the first 2 ps, both HOMO and LUMO move significantly, in opposite directions, and with great oscillations to increase the band gap. This is consistent with the elimination of the localized states around the band edges. However, the subsequent oscillation of the band edges can counteract these changes and make the band gap narrow again. The LUMO oscillates more than the HOMO, and the oscillation not only reduces the band gap but also increases the energy difference from LUMO to LUMO+1 and from HOMO to HOMO−1 at some moments. Such localized deep states in the forbidden band may serve as carrier traps and facilitate nonradiative carrier recombination.84 To unravel the origin of these undesirable midgap states, the LUMO at 2.9 ps was selected as an example, and the relevant charge density plots were drawn in Fig. 2c from different directions. The plots illustrate clearly that this LUMO is derived from the Pb–Pb interaction seen in the initial GB structure. The Pb–Pb distance is adjusted to a suitable degree for hybridization with the bending configuration, and the previous bonding state is reproduced. More LUMO examples are given in Fig. S3.† Note that there are four equivalent Pb–Pb pairs in our periodic model (i.e., two pairs at each GB), and either of them can form bonding states under thermal fluctuations. Since only the states around the band edges dominate the carrier recombination, we focus on such states regardless of their components. Fig. 2d displays the energy differences from LUMO to LUMO+1 and from HOMO−1 to HOMO. The LUMO state tends to appear deeper in the band gap compared to the HOMO state, and influences the carrier properties more. Energy differences between other states are provided in Fig. S4.†
AIMD analysis indicates that the electronic structure of the GB depends strongly on the coordination of the Pb atoms in the boundary region, and that these atoms exhibit various configurations under thermal fluctuations. Some distorted configurations with suitable Pb–Pb distances produce localized Pb–Pb bonding states in the forbidden band. These states may act as carrier recombination centres and facilitate nonradiative energy losses. To understand further the impact of this highly dynamic process, longer MD trajectories are needed to include slower GB fluctuations and possibly rare events. Given that the calculated carrier recombination time in the CsPbBr3 GB can be several hundred picoseconds,41 which is unaffordable for AIMD simulations, we trained a ML FF for this GB system and performed an MD simulation for 1 ns. The Pb–Pb distances are used to represent the structural changes. Fig. 3a shows a scheme of the Pb–Pb distance changes during the GB sliding and the distance evolutions of two Pb–Pb pairs as examples. Pairs of Pb atoms, that are both far from (light green) and close to (dark green) each other initially, can contribute to the midgap states after the sliding. These two Pb–Pb pairs reach the equilibrium distance of around 4.34 Å within several picoseconds and then oscillate near this value. However, after about 400 ps, step changes start to appear in the distance curves, corresponding to distinct structural distortions. The other Pb–Pb distance curves have similar patterns, as displayed in Fig. S5.† To elucidate the overall trend of the Pb–Pb distance changes, we calculated the average distance evolution as plotted in Fig. 3b. The moving average curve demonstrates a transition with the fluctuation range from small to large, which can be assigned to the structural oscillations and distortions, respectively. These results indicate that the GB can be further distorted after the sliding, and that the Pb–Pb configuration changes are consequently intensified. Such distortion also amplifies fluctuations of the Pb–Br and Cs–Br coordination as shown in Fig. S6.†
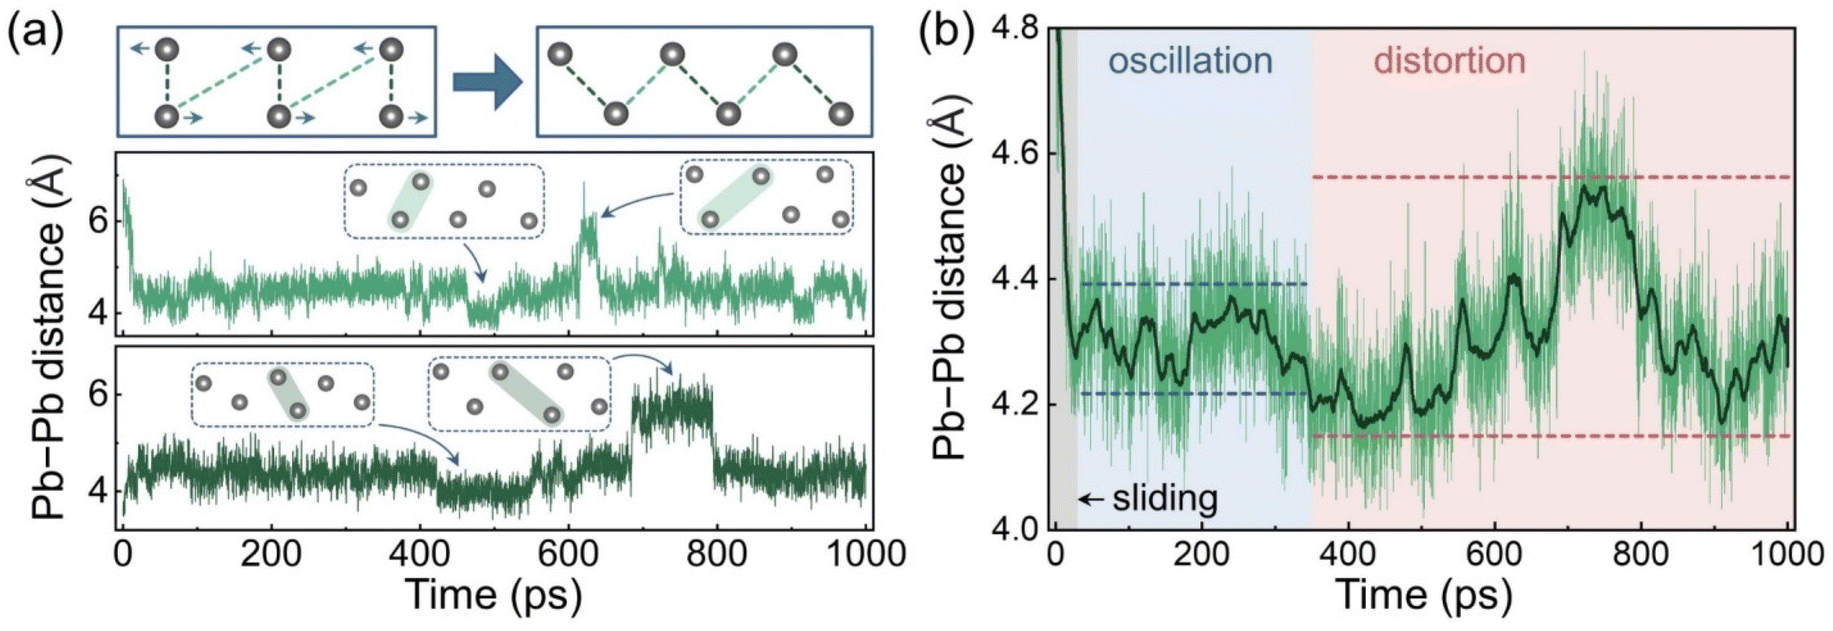 | ||
| Fig. 3 (a) Scheme of the Pb–Pb configuration change in the GB region after sliding, and distance evolutions of two Pb–Pb pairs in the MLMD trajectory. (b) Evolution of the average Pb–Pb distance in the MLMD trajectory. The dark green line is the moving average over 10 ps. | ||
DFT calculations were performed using the structures from the MLMD trajectory with a 0.5 ps timestep. Fig. 4a shows the evolutions of the potential energy relative to the mean value, and the HOMO and LUMO energy levels. The GB sliding reduces the system energy at the beginning, while the subsequent structural oscillations and distortions do not lead to significant energy changes, which implies that all these configurations have similar probabilities to appear according to the Boltzmann distribution. The energy level plot demonstrates that the LUMO level is more volatile than the HOMO level with some outliers indicated by the red circles. Fig. 4b displays the evolutions of the energy level differences and their distributions. The HOMO level remains relatively shallow relative to the HOMO−1 level with the energy differences mainly less than 0.2 eV. In contrast, the LUMO level tends to appear deep in the forbidden band, since the distribution of the gaps between LUMO and LUMO+1 shows a distinct tail towards in the large energy difference. This also reduces the gap from HOMO to LUMO and makes its distribution exhibit a similar tail.
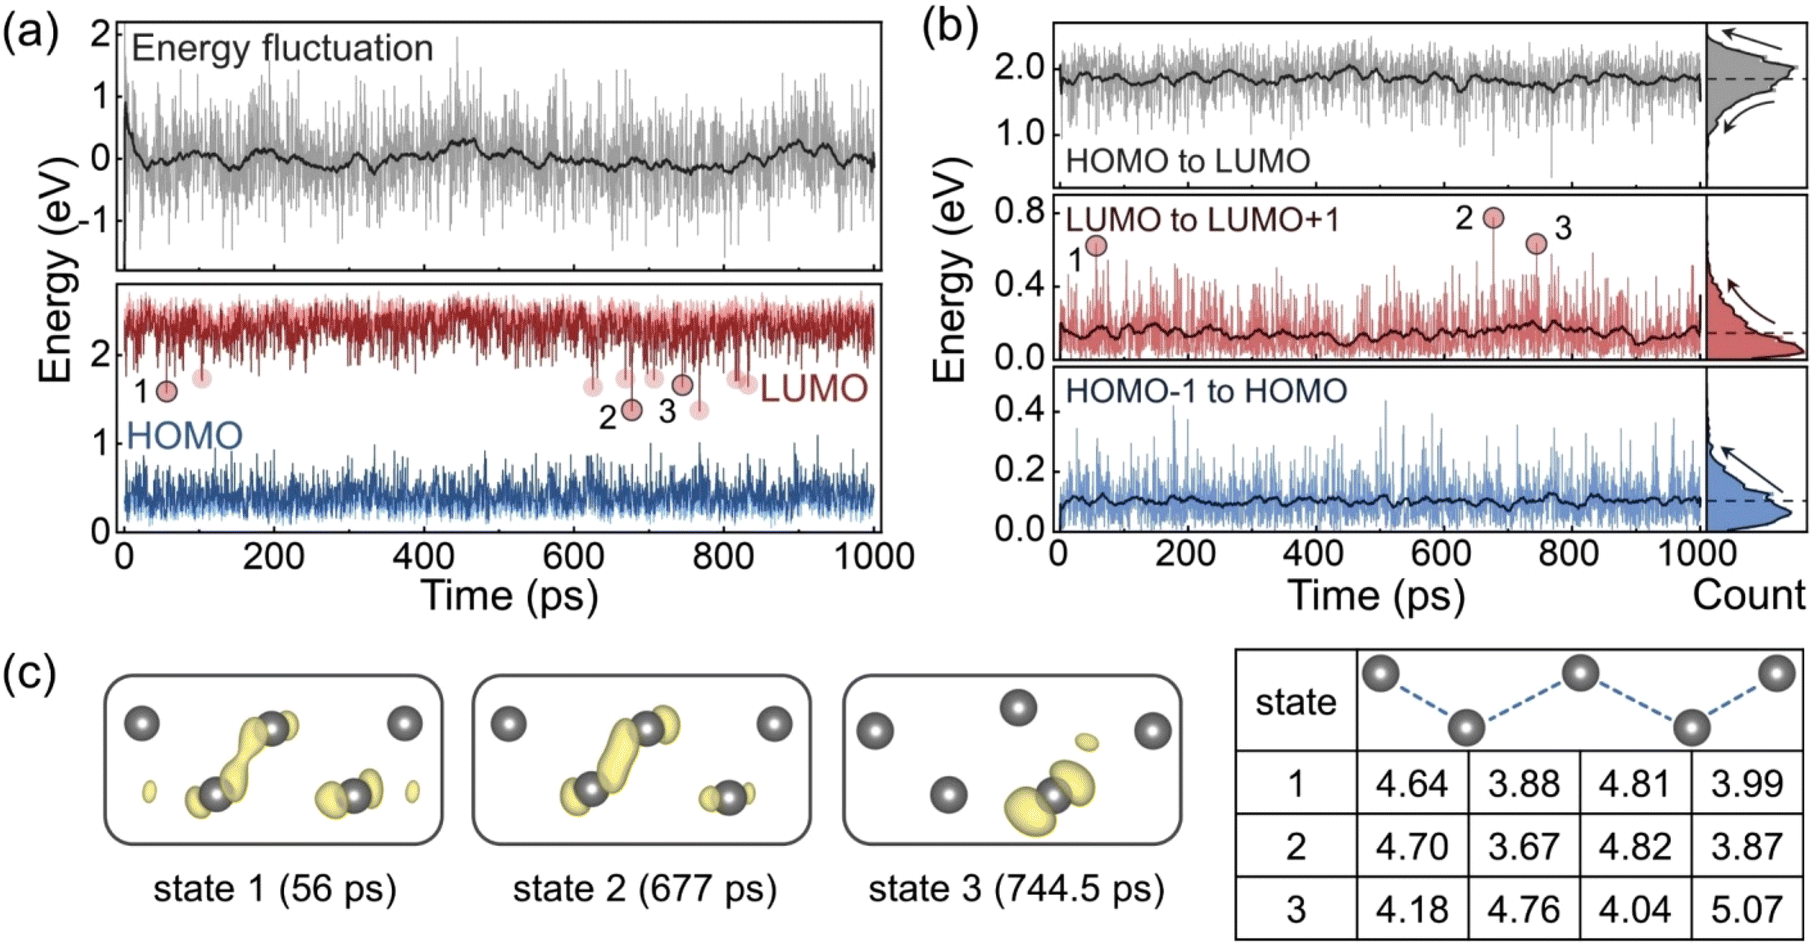 | ||
| Fig. 4 (a) Evolutions of the potential energy fluctuation and the frontier energy levels in the MLMD trajectory. The dark grey line in the top panel is the moving average over 20 ps, and the red circles in the bottom panel indicate LUMO outliers corresponding to deep traps. (b) Evolutions of the energy level differences in the MLMD trajectory and the distribution histograms. The dark and dash lines are the moving averages over 20 ps and the total averages, respectively. (c) LUMO charge densities and Pb configurations at the labelled states. The table shows the Pb–Pb distances at each state in Å. | ||
We notice that the LUMO outliers are concentrated within two time periods, which correspond to the oscillation stage at the beginning of the trajectory and the distortion stage when the Pb–Pb pairs are extended. Some outliers induce deep LUMO levels in the band gap. To identify the origin of these midgap states, we select three points as examples, and present their LUMO charge densities and Pb–Pb distances in Fig. 4c. The LUMO in both state 1 and state 2 is derived from the Pb–Pb bonding interaction, but the bonding orbital in state 2 is more localized with a shorter Pb–Pb distance. In comparison, the LUMO in state 3 is dominated by one Pd atom, and the configuration is distorted exhibiting a larger Pb–Pb pair distance. This indicates a new mechanism of lowering the LUMO level and generating the deep trap state. Compared to the oscillation stage, the distortion stage can induce more drastic structural changes to modify the energy levels.
The deep LUMO states are distributed non-uniformly during the GB distortion stage, which implies a correlation between the energy level positions and the average Pb–Pb distances. To clarify the overall trends of the energy level changes, the distribution densities of these energy level differences are drawn in the form of contour plots in Fig. 5a. The dark regions indicate that the data points are concentrated around a specific value. Pb ↔ Pb represents the oscillation stage, and the Pb–Pb↑ and Pb–Pb↓ represent the distortion stage when the Pb–Pb distance is close to the maximum and minimum values, respectively. For the oscillation stage, only the gap from LUMO to LUMO+1 changes a lot within the less dark region in the contour plot, which is contributed by the dynamic Pb–Pb interactions. At the beginning of the distortion stage, the reduced average Pb–Pb distance suppresses fluctuation of the LUMO and makes it close to the LUMO+1 level, although the deep LUMO levels are derived from the short Pb–Pb pairs. However, when the average Pb–Pb distance starts to increase, the LUMO level becomes unstable with a larger distribution range and less concentrated distribution, which also leads to a decrease in the HOMO–LUMO gap. These changes reach the maximum extent roughly around the longest average Pb−Pb distance and then gradually fade away as the average distance decreases again. Additionally, the gap from HOMO−1 to HOMO is always small regardless of the Pb–Pb distance fluctuations.
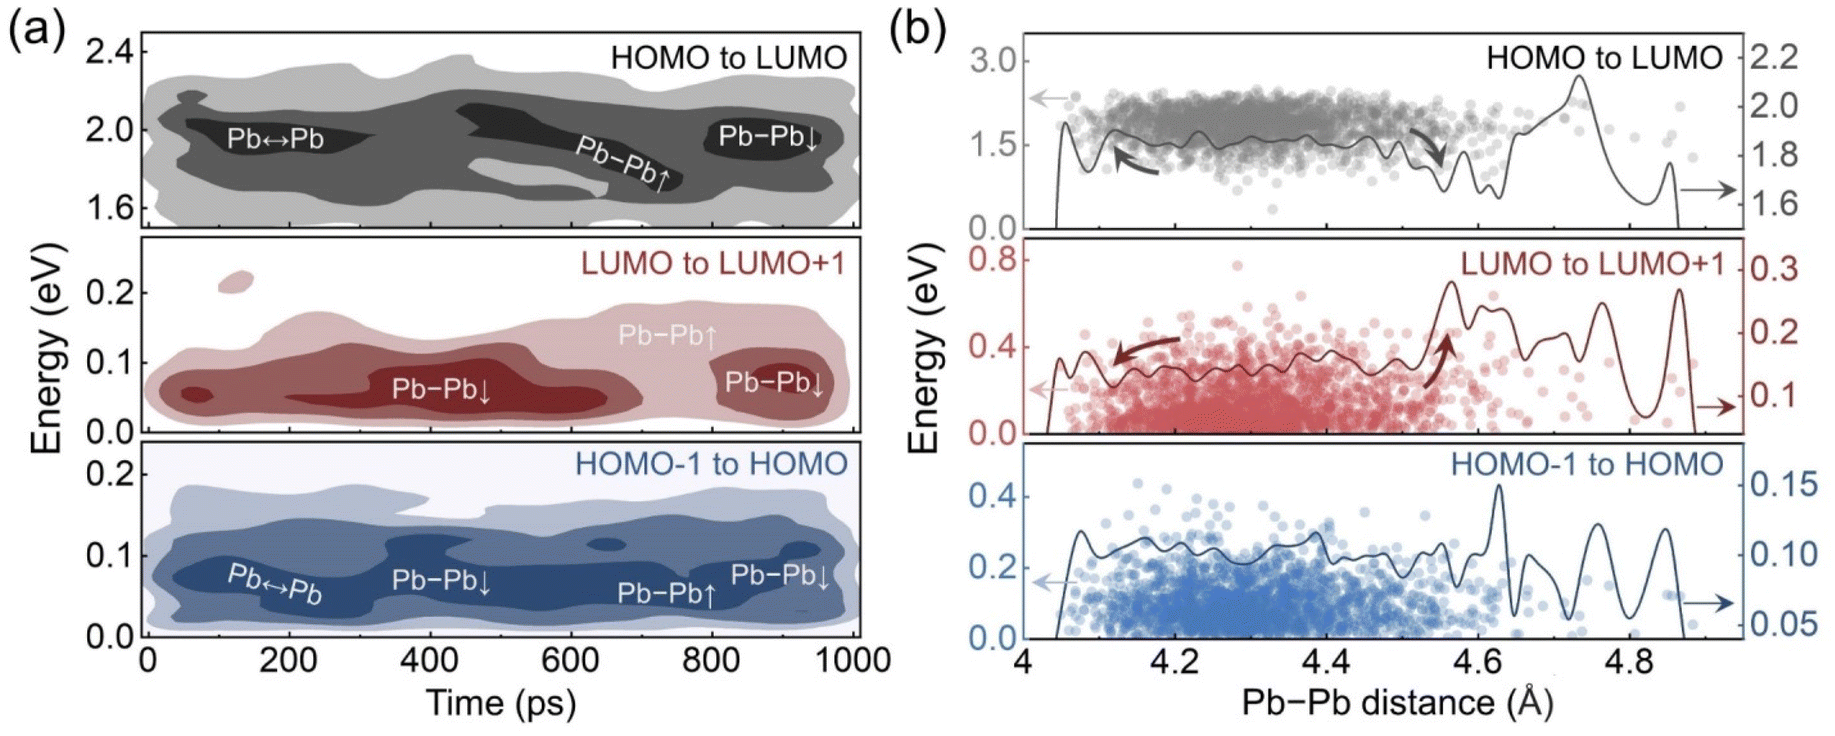 | ||
| Fig. 5 (a) Contour plots of the evolutions of the energy level differences in the MLMD trajectory. The darker regions indicate higher data distribution densities. Pb ↔ Pb corresponds to the Pb–Pb oscillation stage. Pb–Pb↑ and Pb–Pb↓ represent the Pb–Pb distance close to the maximum and minimum values in the distortion stage, respectively. (b) Energy level differences versus Pb–Pb distance. The solid lines display the moving averages over 0.015 Å. | ||
The size of the system used in the current study is limited by the computational expense of the ab initio calculation. In particular, the slab used is too narrow to fully represent the properties of bulk CsPbBr3. Therefore, the fundamental band gap is likely overestimated due to the quantum confinement effect. At the same time, since the deep trap levels are localized on the GB atoms, Fig. 2, their energies are independent of the slab thickness. Hence, the HOMO–LUMO gap between the trap states is not affected by the quantum confinement, while the HOMO to HOMO−1 and LUMO to LUMO+1 gaps, which determine how deep the trap states are, are likely overestimated. Further, increasing the system size will reduce fluctuations of the energies of the states in the valence and conduction bands, since these states are delocalized, while fluctuations of the localized trap states will not be affected. Hence, the distribution of the HOMO–LUMO gaps arising from the deep traps will change little with system size, while the distributions of the HOMO to HOMO−1 and LUMO to LUMO+1 gaps will become narrower in a larger system.
The relationships between the energy level differences and the average Pb–Pb distance are illustrated in Fig. 5b. During the oscillation stage, the moving average of the Pb–Pb distance mainly distributes between 4.2 to 4.4 Å. The moving average curves of the gaps from HOMO−1 to HOMO and from HOMO to LUMO are approximately flat in this range, while the curve of LUMO to LUMO+1 slightly rises around 4.4 Å. The distortion stage extends the Pb–Pb distance range with the moving average value from below 4.2 Å to roughly 4.6 Å. The gap from HOMO−1 to HOMO remains stable in this range, but the other two gaps show dramatic changes at the two extended ends. The enlarged average Pb–Pb distance significantly increases the gap from LUMO to LUMO+1 and reduces the HOMO–LUMO gap. The LUMO fluctuates deep into the forbidden band. In contrast, reducing the average Pb–Pb distance keeps the LUMO shallow and slightly enlarges the HOMO–LUMO gap. Since the midgap LUMO states may trap carriers and facilitate carrier recombination, such dependence indicates that the GB distortion can have both beneficial and detrimental influences on the photovoltaic performance. Moreover, considering that perovskites are soft and are known to undergo large thermal fluctuations, we would expect other grain boundaries, both high and low angle, should exhibit similar properties.
Conclusions
In summary, combining ab initio DFT and ML FF, we demonstrated that the Σ5 (120) GB in CsPbBr3 experiences a variety of structural fluctuations on the nanosecond timescale of charge carrier recombination, and dynamically generates trap states through Pb–Pb interactions across the boundary. The symmetrical GB model slides within a few picoseconds to lower the system energy by mitigating the repulsion between ions with the same charge in the boundary regions. The sliding process also eliminates the initial Pb–Pb bonding states at the bottom of the conduction band by enlarging Pb–Pb distances. However, the Pb–Pb distances can decrease under thermal fluctuations and restore the localized bonding states. These unoccupied bonding states with energies in the forbidden band gap may serve as trap states to accelerate the carrier recombination. Additionally, distinct structural distortions start to appear after several hundred picoseconds and magnify fluctuation of the Pb coordination. Counterintuitively, configurations with the longer average Pb–Pb distance across the GB correspond to more significant geometry distortions and tend to generate deep LUMO levels, although the midgap LUMO states are derived from the shortened Pb–Pb pairs. The study demonstrates complex correlation between structural and charge carrier dynamics in MHPs occurring on similar timescales. We anticipate that suppressing GB distortions by thorough annealing and breaking up Pb–Pb dimers via passivation can efficiently alleviate the detrimental effects of GBs in MHP solar cells.Conflicts of interest
There are no conflicts to declare.Acknowledgements
This research was supported in part through computational resources of HPC facilities at HSE University.85 A. S. V. acknowledges support from the Basic Research Program of the HSE University. O. V. P. acknowledges support of the USA National Science Foundation, grant CHE-2154367.References
- J. Y. Kim, J.-W. Lee, H. S. Jung, H. Shin and N.-G. Park, Chem. Rev., 2020, 120, 7867–7918 CrossRef CAS PubMed.
- Y.-F. Li, J. Feng and H.-B. Sun, Nanoscale, 2019, 11, 19119–19139 RSC.
- N. K. Kumawat, X.-K. Liu, D. Kabra and F. Gao, Nanoscale, 2019, 11, 2109–2120 RSC.
- G. Tang and F. Yan, Nano Today, 2021, 39, 101155 CrossRef CAS.
- J. Peng, Y. Xu, F. Yao and Q. Lin, Nanoscale, 2022, 14, 9636–9647 RSC.
- A. Kojima, K. Teshima, Y. Shirai and T. Miyasaka, J. Am. Chem. Soc., 2009, 131, 6050–6051 CrossRef CAS PubMed.
- H. Min, D. Y. Lee, J. Kim, G. Kim, K. S. Lee, J. Kim, M. J. Paik, Y. K. Kim, K. S. Kim, M. G. Kim, T. J. Shin and S. Il Seok, Nature, 2021, 598, 444–450 CrossRef CAS.
- M. Kim, J. Jeong, H. Lu, T. K. Lee, F. T. Eickemeyer, Y. Liu, I. W. Choi, S. J. Choi, Y. Jo, H.-B. Kim, S.-I. Mo, Y.-K. Kim, H. Lee, N. G. An, S. Cho, W. R. Tress, S. M. Zakeeruddin, A. Hagfeldt, J. Y. Kim, M. Grätzel and D. S. Kim, Science, 2022, 375, 302–306 CrossRef CAS PubMed.
- Best Research-Cell Efficiency Chart, https://www.nrel.gov/pv/cell-efficiency.html, (accessed October 21, 2022).
- G.-H. Kim and D. S. Kim, Joule, 2021, 5, 1033–1035 CrossRef.
- S. Seo, I. J. Park, M. Kim, S. Lee, C. Bae, H. S. Jung, N.-G. Park, J. Y. Kim and H. Shin, Nanoscale, 2016, 8, 11403–11412 RSC.
- Q. Guo, F. Yuan, B. Zhang, S. Zhou, J. Zhang, Y. Bai, L. Fan, T. Hayat, A. Alsaedi and Z. Tan, Nanoscale, 2019, 11, 115–124 RSC.
- H. Wang, H. Li, W. Cai, P. Zhang, S. Cao, Z. Chen and Z. Zang, Nanoscale, 2020, 12, 14369–14404 RSC.
- Z. Liu, L. Wu, X. Wang, Q. Xu, Y. Hu, K. Meng and G. Chen, Nanoscale, 2020, 12, 8425–8431 RSC.
- J. He, A. S. Vasenko, R. Long and O. V. Prezhdo, J. Phys. Chem. Lett., 2018, 9, 1872–1879 CrossRef CAS PubMed.
- J.-K. Wang, H.-Y. Hou, Y.-Q. Li and J.-X. Tang, Nanoscale, 2020, 12, 17149–17164 RSC.
- R. Shi, W.-H. Fang, A. S. Vasenko, R. Long and O. V. Prezhdo, Nano Res., 2022, 15, 2112–2122 CrossRef CAS.
- D.-Y. Son, J.-W. Lee, Y. J. Choi, I.-H. Jang, S. Lee, P. J. Yoo, H. Shin, N. Ahn, M. Choi, D. Kim and N.-G. Park, Nat. Energy, 2016, 1, 16081 CrossRef CAS.
- J. Ali, Y. Li, P. Gao, T. Hao, J. Song, Q. Zhang, L. Zhu, J. Wang, W. Feng, H. Hu and F. Liu, Nanoscale, 2020, 12, 5719–5745 RSC.
- Y. Wang, Z. Zhang, M. Tao, Y. Lan, M. Li, Y. Tian and Y. Song, Nanoscale, 2020, 12, 18563–18575 RSC.
- K. Kim, J. Han, S. Maruyama, M. Balaban and I. Jeon, Sol. RRL, 2021, 5, 2000783 CrossRef CAS.
- J.-W. Lee, S.-H. Bae, N. De Marco, Y.-T. Hsieh, Z. Dai and Y. Yang, Mater. Today Energy, 2018, 7, 149–160 CrossRef.
- A.-F. Castro-Méndez, J. Hidalgo and J.-P. Correa-Baena, Adv. Energy Mater., 2019, 9, 1901489 CrossRef.
- J. S. Yun, A. Ho-Baillie, S. Huang, S. H. Woo, Y. Heo, J. Seidel, F. Huang, Y.-B. Cheng and M. A. Green, J. Phys. Chem. Lett., 2015, 6, 875–880 CrossRef CAS PubMed.
- M. Yang, Y. Zeng, Z. Li, D. H. Kim, C.-S. Jiang, J. van de Lagemaat and K. Zhu, Phys. Chem. Chem. Phys., 2017, 19, 5043–5050 RSC.
- G. W. P. Adhyaksa, S. Brittman, H. Āboliņš, A. Lof, X. Li, J. D. Keelor, Y. Luo, T. Duevski, R. M. A. Heeren, S. R. Ellis, D. P. Fenning and E. C. Garnett, Adv. Mater., 2018, 30, 1804792 CrossRef PubMed.
- M. Takihara, T. Takahashi and T. Ujihara, Appl. Phys. Lett., 2008, 93, 021902 CrossRef.
- C. Li, Y. Wu, J. Poplawsky, T. J. Pennycook, N. Paudel, W. Yin, S. J. Haigh, M. P. Oxley, A. R. Lupini, M. Al-Jassim, S. J. Pennycook and Y. Yan, Phys. Rev. Lett., 2014, 112, 156103 CrossRef PubMed.
- Y. Yan, W.-J. Yin, Y. Wu, T. Shi, N. R. Paudel, C. Li, J. Poplawsky, Z. Wang, J. Moseley, H. Guthrey, H. Moutinho, S. J. Pennycook and M. M. Al-Jassim, J. Appl. Phys., 2015, 117, 112807 CrossRef.
- T. Gallet, D. Grabowski, T. Kirchartz and A. Redinger, Nanoscale, 2019, 11, 16828–16836 RSC.
- K. Kwak, E. Lim, N. Ahn, J. Heo, K. Bang, S. K. Kim and M. Choi, Nanoscale, 2019, 11, 11369–11378 RSC.
- W.-J. Yin, H. Chen, T. Shi, S.-H. Wei and Y. Yan, Adv. Electron. Mater., 2015, 1, 1500044 CrossRef.
- Y. Guo, Q. Wang and W. A. Saidi, J. Phys. Chem. C, 2017, 121, 1715–1722 CrossRef CAS.
- J.-S. Park and A. Walsh, Annu. Rev. Condens. Matter Phys., 2021, 12, 95–109 CrossRef CAS.
- W. Shan and W. A. Saidi, J. Phys. Chem. Lett., 2017, 8, 5935–5942 CrossRef CAS PubMed.
- H. Jin, E. Debroye, M. Keshavarz, I. G. Scheblykin, M. B. J. Roeffaers, J. Hofkens and J. A. Steele, Mater. Horiz., 2020, 7, 397–410 RSC.
- R. Shi, A. S. Vasenko, R. Long and O. V. Prezhdo, J. Phys. Chem. Lett., 2020, 11, 9100–9109 CrossRef CAS PubMed.
- Y. Wu, W. Chu, A. S. Vasenko and O. V. Prezhdo, J. Phys. Chem. Lett., 2021, 12, 8699–8705 CrossRef CAS PubMed.
- R. Long, J. Liu and O. V. Prezhdo, J. Am. Chem. Soc., 2016, 138, 3884–3890 CrossRef CAS PubMed.
- Y. Wang, W.-H. Fang, R. Long and O. V. Prezhdo, J. Phys. Chem. Lett., 2019, 10, 1617–1623 CrossRef CAS PubMed.
- Y. Wang, J. He, Y. Yang, Z. Zhang and R. Long, ACS Appl. Energy Mater., 2019, 2, 3419–3426 CrossRef CAS.
- L. Qiao, W.-H. Fang, R. Long and O. V. Prezhdo, ACS Energy Lett., 2020, 5, 3813–3820 CrossRef CAS.
- L. Qiao, W.-H. Fang and R. Long, J. Phys. Chem. Lett., 2022, 13, 954–961 CrossRef CAS PubMed.
- J.-S. Park, J. Calbo, Y.-K. Jung, L. D. Whalley and A. Walsh, ACS Energy Lett., 2019, 4, 1321–1327 CrossRef CAS.
- A. Mattoni and S. Meloni, Helv. Chim. Acta, 2020, 103, e2000110 CrossRef CAS.
- N. Phung, A. Al-Ashouri, S. Meloni, A. Mattoni, S. Albrecht, E. L. Unger, A. Merdasa and A. Abate, Adv. Energy Mater., 2020, 10, 1903735 CrossRef CAS.
- M. Pols, T. Hilpert, I. A. W. Filot, A. C. T. van Duin, S. Calero and S. Tao, ACS Appl. Mater. Interfaces, 2022, 14, 40841–40850 CrossRef CAS PubMed.
- W. Kaiser, K. Hussain, A. Singh, A. A. Alothman, D. Meggiolaro, A. Gagliardi, E. Mosconi and F. De Angelis, J. Mater. Chem. A, 2022, 10, 24854–24865 RSC.
- A. S. Thind, G. Luo, J. A. Hachtel, M. V. Morrell, S. B. Cho, A. Y. Borisevich, J. Idrobo, Y. Xing and R. Mishra, Adv. Mater., 2019, 31, 1805047 CrossRef PubMed.
- S. Cai, J. Dai, Z. Shao, M. U. Rothmann, Y. Jia, C. Gao, M. Hao, S. Pang, P. Wang, S. P. Lau, K. Zhu, J. J. Berry, L. M. Herz, X. C. Zeng and Y. Zhou, J. Am. Chem. Soc., 2022, 144, 1910–1920 CrossRef CAS PubMed.
- S. Kiyohara, H. Oda, T. Miyata and T. Mizoguchi, Sci. Adv., 2016, 2, e1600746 CrossRef PubMed.
- T. Yokoi, Y. Noda, A. Nakamura and K. Matsunaga, Phys. Rev. Mater., 2020, 4, 014605 CrossRef CAS.
- T. Nishiyama, A. Seko and I. Tanaka, Phys. Rev. Mater., 2020, 4, 123607 CrossRef CAS.
- O. T. Unke, S. Chmiela, H. E. Sauceda, M. Gastegger, I. Poltavsky, K. T. Schütt, A. Tkatchenko and K.-R. Müller, Chem. Rev., 2021, 121, 10142–10186 CrossRef CAS PubMed.
- B. Mortazavi, E. V. Podryabinkin, S. Roche, T. Rabczuk, X. Zhuang and A. V. Shapeev, Mater. Horiz., 2020, 7, 2359–2367 RSC.
- H. Zhou, Y.-J. Feng, C. Wang, T. Huang, Y.-R. Liu, S. Jiang, C.-Y. Wang and W. Huang, Nanoscale, 2021, 13, 12212–12222 RSC.
- D. Dragoni, J. Behler and M. Bernasconi, Nanoscale, 2021, 13, 16146–16155 RSC.
- B. Mortazavi, M. Shahrokhi, F. Shojaei, T. Rabczuk, X. Zhuang and A. V. Shapeev, Nanoscale, 2022, 14, 4324–4333 RSC.
- A. V. Cohen, D. A. Egger, A. M. Rappe and L. Kronik, J. Phys. Chem. Lett., 2019, 10, 4490–4498 CrossRef CAS PubMed.
- W. Li, A. S. Vasenko, J. Tang and O. V. Prezhdo, J. Phys. Chem. Lett., 2019, 10, 6219–6226 CrossRef CAS PubMed.
- B. Wang, W. Chu, Y. Wu, D. Casanova, W. A. Saidi and O. V. Prezhdo, J. Phys. Chem. Lett., 2022, 5946–5952 CrossRef CAS PubMed.
- C.-J. Tong, L. Li, L.-M. Liu and O. V. Prezhdo, J. Am. Chem. Soc., 2020, 142, 3060–3068 CrossRef CAS PubMed.
- C.-J. Tong, X. Cai, A.-Y. Zhu, L.-M. Liu and O. V. Prezhdo, J. Am. Chem. Soc., 2022, 144, 6604–6612 CrossRef CAS PubMed.
- D. Liu, C. M. Perez, A. S. Vasenko and O. V. Prezhdo, J. Phys. Chem. Lett., 2022, 13, 3645–3651 CrossRef CAS PubMed.
- S. Ullah, J. Wang, P. Yang, L. Liu, S.-E. Yang, T. Xia, H. Guo and Y. Chen, Mater. Adv., 2021, 2, 646–683 RSC.
- R. B. K. Siram, M. V. Khenkin, A. Niazov-Elkan, A. K. M. H. Weissman, E. A. Katz, I. Visoly-Fisher and B. Rybtchinski, Nanoscale, 2019, 11, 3733–3740 RSC.
- X. Liu, J. Wang, C. Ma, X. Huang, K. Liu, Z. Xu, W. Wang, L. Wang and X. Bai, Nanoscale, 2021, 13, 124–130 RSC.
- W. Li, Y.-Y. Sun, L. Li, Z. Zhou, J. Tang and O. V. Prezhdo, J. Am. Chem. Soc., 2018, 140, 15753–15763 CrossRef CAS PubMed.
- J. Kang, Phys. Rev. Mater., 2020, 4, 085405 CrossRef CAS.
- X. Feng, B. Liu, Y. Peng, C. Gu, X. Bai, M. Long, M. Cai, C. Tong, L. Han and J. Yang, Small, 2022, 18, 2201831 CrossRef CAS PubMed.
- G. Kresse and J. Hafner, Phys. Rev. B: Condens. Matter Mater. Phys., 1993, 47, 558–561 CrossRef CAS PubMed.
- G. Kresse and J. Hafner, Phys. Rev. B: Condens. Matter Mater. Phys., 1994, 49, 14251–14269 CrossRef CAS PubMed.
- G. Kresse and J. Furthmüller, Comput. Mater. Sci., 1996, 6, 15–50 CrossRef CAS.
- G. Kresse and J. Furthmüller, Phys. Rev. B: Condens. Matter Mater. Phys., 1996, 54, 11169–11186 CrossRef CAS PubMed.
- J. P. Perdew, K. Burke and M. Ernzerhof, Phys. Rev. Lett., 1996, 77, 3865–3868 CrossRef CAS PubMed.
- G. Kresse and D. Joubert, Phys. Rev. B: Condens. Matter Mater. Phys., 1999, 59, 1758–1775 CrossRef CAS.
- S. Grimme, J. Antony, S. Ehrlich and H. Krieg, J. Chem. Phys., 2010, 132, 154104 CrossRef PubMed.
- S. Grimme, S. Ehrlich and L. Goerigk, J. Comput. Chem., 2011, 32, 1456–1465 CrossRef CAS PubMed.
- P. Hirel, Comput. Phys. Commun., 2015, 197, 212–219 CrossRef CAS.
- H. Wang, L. Zhang, J. Han and W. E, Comput. Phys. Commun., 2018, 228, 178–184 CrossRef CAS.
- A. P. Thompson, H. M. Aktulga, R. Berger, D. S. Bolintineanu, W. M. Brown, P. S. Crozier, P. J. in ‘t Veld, A. Kohlmeyer, S. G. Moore, T. D. Nguyen, R. Shan, M. J. Stevens, J. Tranchida, C. Trott and S. J. Plimpton, Comput. Phys. Commun., 2022, 271, 108171 CrossRef CAS.
- K. Momma and F. Izumi, J. Appl. Crystallogr., 2011, 44, 1272–1276 CrossRef CAS.
- J.-S. Park, J. Phys. Chem. Lett., 2022, 13, 4628–4633 CrossRef CAS PubMed.
- W. Li, Y. She, A. S. Vasenko and O. V. Prezhdo, Nanoscale, 2021, 13, 10239–10265 RSC.
- P. S. Kostenetskiy, R. A. Chulkevich and V. I. Kozyrev, J. Phys.: Conf. Ser., 2021, 1740, 012050 CrossRef.
Footnote |
| † Electronic supplementary information (ESI) available. See DOI: https://doi.org/10.1039/d2nr05918e |
| This journal is © The Royal Society of Chemistry 2023 |