
 Open Access Article
 This Open Access Article is licensed under a Creative Commons Attribution-Non Commercial 3.0 Unported Licence
Colloidal synthesis of the mixed ionic–electronic conducting NaSbS2 nanocrystals†
Maria
Zubair
 ,
Syed Abdul
Ahad
,
Ibrahim Saana
Amiinu
,
Vasily A.
Lebedev
,
Mohini
Mishra
,
Hugh
Geaney
,
Shalini
Singh
* and
Kevin M.
Ryan
*
,
Syed Abdul
Ahad
,
Ibrahim Saana
Amiinu
,
Vasily A.
Lebedev
,
Mohini
Mishra
,
Hugh
Geaney
,
Shalini
Singh
* and
Kevin M.
Ryan
*
Department of Chemical Sciences and Bernal Institute, University of Limerick, Limerick, Ireland. E-mail: kevin.m.ryan@ul.ie; shalini.singh@ul.ie; Maria.Zubair@ul.ie; Syed.AbdulAhad@ul.ie; Hugh.Geaney@ul.ie
First published on 5th July 2023
Abstract
Solution-based synthesis of mixed ionic and electronic conductors (MIECs) has enabled the development of novel inorganic materials with implications for a wide range of energy storage applications. However, many technologically relevant MIECs contain toxic elements (Pb) or are prepared by using traditional high-temperature solid-state synthesis. Here, we provide a simple, low-temperature and size-tunable (50–90 nm) colloidal hot injection approach for the synthesis of NaSbS2 based MIECs using widely available and non-toxic precursors. Key synthetic parameters (cationic precursor, reaction temperature, and ligand) are examined to regulate the shape and size of the NaSbS2 nanocrystals (NCs). FTIR studies revealed that ligands with carboxylate functionality are coordinated to the surface of the synthesized NaSbS2 NCs. The synthesized NaSbS2 nanocrystals have electronic and ionic conductivities of 3.31 × 10⁻¹⁰ (e−) and 1.9 × 10⁻⁵ (Na+) S cm−1 respectively, which are competitive with the ionic and electrical conductivities of perovskite materials generated by solid-state reactions. This research gives a mechanistic understanding and post-synthetic evaluation of parameters influencing the formation of sodium antimony chalcogenides materials.
New conceptsLead halide perovskites are widely used in optoelectronics with the potential of being used as mixed ionic and electronic conductors (MIECs) as well by altering their structure. However, alternate compositions with low toxicity are required as compared to lead halide perovskites due to lead's high toxicity. The crystal structure of sodium antimony chalcogenide (NaSbS2) is analogous to the halide perovskites, making solution-based production environmentally benign and low-cost. Most of the previous reports for the synthesis of NaSbS2 involved high-temperature (600–800 °C) synthesis, using a mixture of an alkali metal source (carbonates or chalcogenides), antimony (Sb) and sulfur (S). Herein we report the detailed study on the impact of reaction parameters in determining the size, shape and crystal phase of NaSbS2 NCs using low temperature (250–310 °C) colloidal hot injection approach. We synthesized NaSbS2 NCs using widely available reagents and precursors followed by its in-depth material characterization, highlighting its growth mechanism as well. Further, the measured conductivities of NaSbS2 NCs show a promising new route to synthesize alkali metal-based MIECs with ionic conductivities comparable to lead halide perovskites. |
1. Introduction
Mixed ionic–electronic conductors (MIECs) are a class of materials that can efficiently conduct electronic charge carriers and ions, and have been investigated for a variety of applications, including electrochemical energy storage, electrochromics, separation membranes and catalysis.1,2 In the realm of MIECs, perovskites are promising materials because of their structure, which can be tailored to allow ionic and electronic conduction.3 Metal halide perovskites (MHPs) of the formula ABX3; where A is a monovalent cation (e.g. Cs), B is a divalent cation (Pb or Sn) and the X is a halide anion (e.g. Cl, Br or I) can simultaneously conduct ions and electronic charge carriers due to their defect tolerance because of high dielectric constant and well-connected soft lattice resulting the high electronic and ionic mobility.4 MHPs have both covalent and ionic bonding in the crystal structure, with the covalent backbone allowing smooth charge transport. This also allows for their dissolution in polar solvents and cost-effective solution processing.5–11 However, their widespread application is constrained by the high toxicity of lead and its water solubility. In the alternative Sn-based perovskites, the stability is very poor because of the oxidation of Sn2+ to stable Sn4+ after exposure to air. Therefore, alternative lead-free and air-stable materials with competitive electronic and ionic transport properties are needed, preferably with solution processable techniques.Ternary chalcogenides with the formula ABX2 (A = Li, Na, K, Rb, Cs, Cu, Ag; B = Sb; X = S, Se) are a class of MIECs with great technological promise due to their high ionic conductivity compared to conventional halide perovskites.12–25 Among the various alkali metal based systems, the ternary chalcogenide NaSbS2 exhibits a high dielectric constant and ionic conductivity.26–28 The NaSbS2 crystal structure, like that of lead halide perovskite consist of a network of corner sharing polyhedral. The tetrahedra SbS4 in NaSbS2 are linked together in the form of chains, which are subsequently joined together by sharing corners to form layers. The Na+ cations are positioned between these layers and in an octahedral geometry coordinated by six S atoms. While the halide ions in lead halide perovskites form a three-dimensional network by edges-sharing octahedra coordination.8,29–31
Although colloidal synthesis routes to antimony containing chalcogenides (CuSbS2, AgSbS2) are well reported with excellent control over the size and shape, the synthesis of ASbS2 based compounds where A = Li, Na, K and Cs remain underdeveloped.24,32–41 Alkali metal-based compounds e.g., NaSbS2 are generally synthesized by solid-state high temperature reactions, which result in highly aggregated or polydisperse materials. Most of the previously reported reactions involved high temperature (600–800 °C) synthesis, involving a mixture of an alkali metal source (carbonates or chalcogenides), Sb and sulphur.42–46 Previous reports on the solution synthesis of NaSbS2 have relied on sequential ionic layer adsorption technique (SILAR) followed by spray pyrolysis, in which the substrate is sprayed with a solution containing Sb2S3 and Na2S in water before being heated to high temperatures.29,47 Rahayu et al showed the synthesis of NaSbS2 nanoparticles on TiO2 electrodes using several SILAR cycles.30 Harikesh et al. synthesized cubic phase NaSbS2 thin films by a solution processing route and investigated their electronic and ionic coupled transport properties.48 Vela et al. recently described the preparation of I–V–VI2 nanocrystals (NCs) with a focus on the computational studies to describe the effect of stereoelectronic lone pair in the crystal structure of I–V–VI2 materials.49 However, there is a missing gap in the literature for a detailed study on the impact of reaction parameters in determining the size, shape and crystal phase of NaSbS2 NCs, as well as mechanistic insight for the synthesis of NCs and their transport properties using colloidal hot injection approach.
Herein we report the colloidal synthesis of NaSbS2 NCs using widely available reagents and precursors. The effect of reaction parameters (temperature, ligands and precursor molar ratio) on the formation of the NaSbS2 NCs were studied systematically to regulate the size, and shape, of the NCs. By increasing the reaction temperature from 250 to 310 °C, the particle size was found to decrease from 80 to 50 nm, with a change in a shape from cube to quasi spherical and then to cuboctahedra. Additionally, increasing the cationic precursor (Na precursor) ratio resulted in a change in shape from cube to truncated cube with increase in size from 90 to 180 nm, respectively. The cooperative role of acid and amine functionality in the synthesis of pure phase NaSbS2 NCs is shown by systematic analysis of the added ligand. We find that the cooperative role of acid and amine based ligands is independent of the chain length for the synthesis of NaSbS2 NCs. Surface chemistry evaluation by Fourier transform infrared (FTIR) spectroscopy shows that the surface of ternary NaSbS2 NCs is passivated by carboxylate ligands. Further, we study the transport properties of NaSbS2 NCs by electrochemical impedance spectroscopy and DC polarization to gain an understanding of the ionic and electronic conductivity of the NCs.
2. Results and discussion
2.1. Synthesis of NaSbS2 NCs
The NaSbS2 NCs were prepared by using a standard schlenk line apparatus and a simple hot-injection method (Scheme 1). To investigate the role of reaction parameters in determining composition, shape, size and phase of the NCs, the reaction temperature, added ligands and molar ratio of cation precursors were varied systematically. Initially, pure phase ternary NaSbS2 NCs were prepared using NaOH and Ph3Sb in a molar ratio of 3![[thin space (1/6-em)]](https://www.rsc.org/images/entities/char_2009.gif) :1 with OLA and OA as ligands at 250 °C. This synthesis approach results in the formation of monodisperse cubic NaSbS2 NCs. Fig. 1a shows a TEM image of the nanocubes produced after a 30 min reaction at 250 °C. The average size of these nanocubes is 81 ± 16 nm. The size distribution histograms are presented in Fig. S1 (ESI†). Further TEM analysis of the sample using a tilt TEM holder stage at ±30° (Fig. 1b and c) shows the side view of the nano cube, revealing the 3D morphology feature of the synthesized NaSbS2 NCs.
:1 with OLA and OA as ligands at 250 °C. This synthesis approach results in the formation of monodisperse cubic NaSbS2 NCs. Fig. 1a shows a TEM image of the nanocubes produced after a 30 min reaction at 250 °C. The average size of these nanocubes is 81 ± 16 nm. The size distribution histograms are presented in Fig. S1 (ESI†). Further TEM analysis of the sample using a tilt TEM holder stage at ±30° (Fig. 1b and c) shows the side view of the nano cube, revealing the 3D morphology feature of the synthesized NaSbS2 NCs.
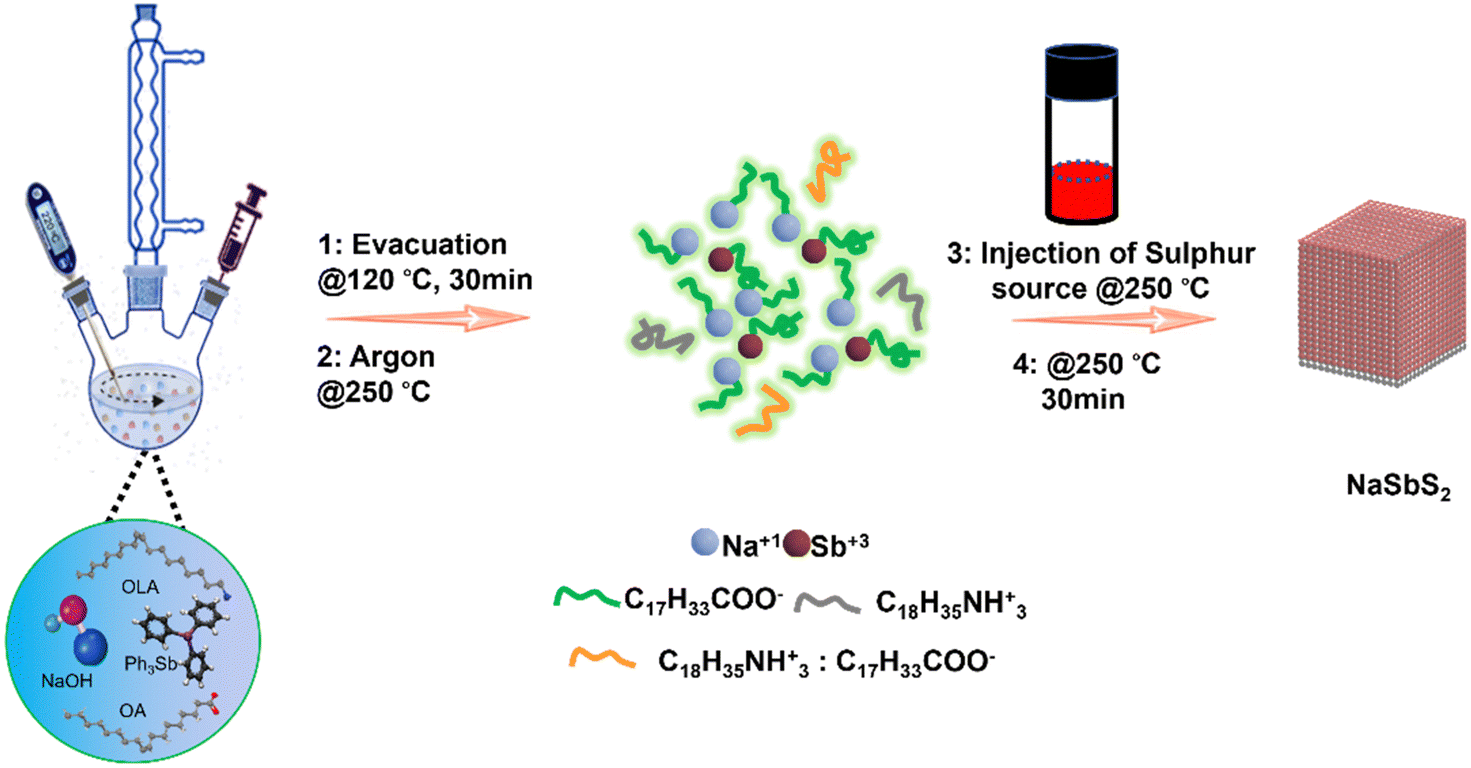 | ||
| Scheme 1 Schematic depiction of the synthetic approach for NaSbS2 NCs. | ||
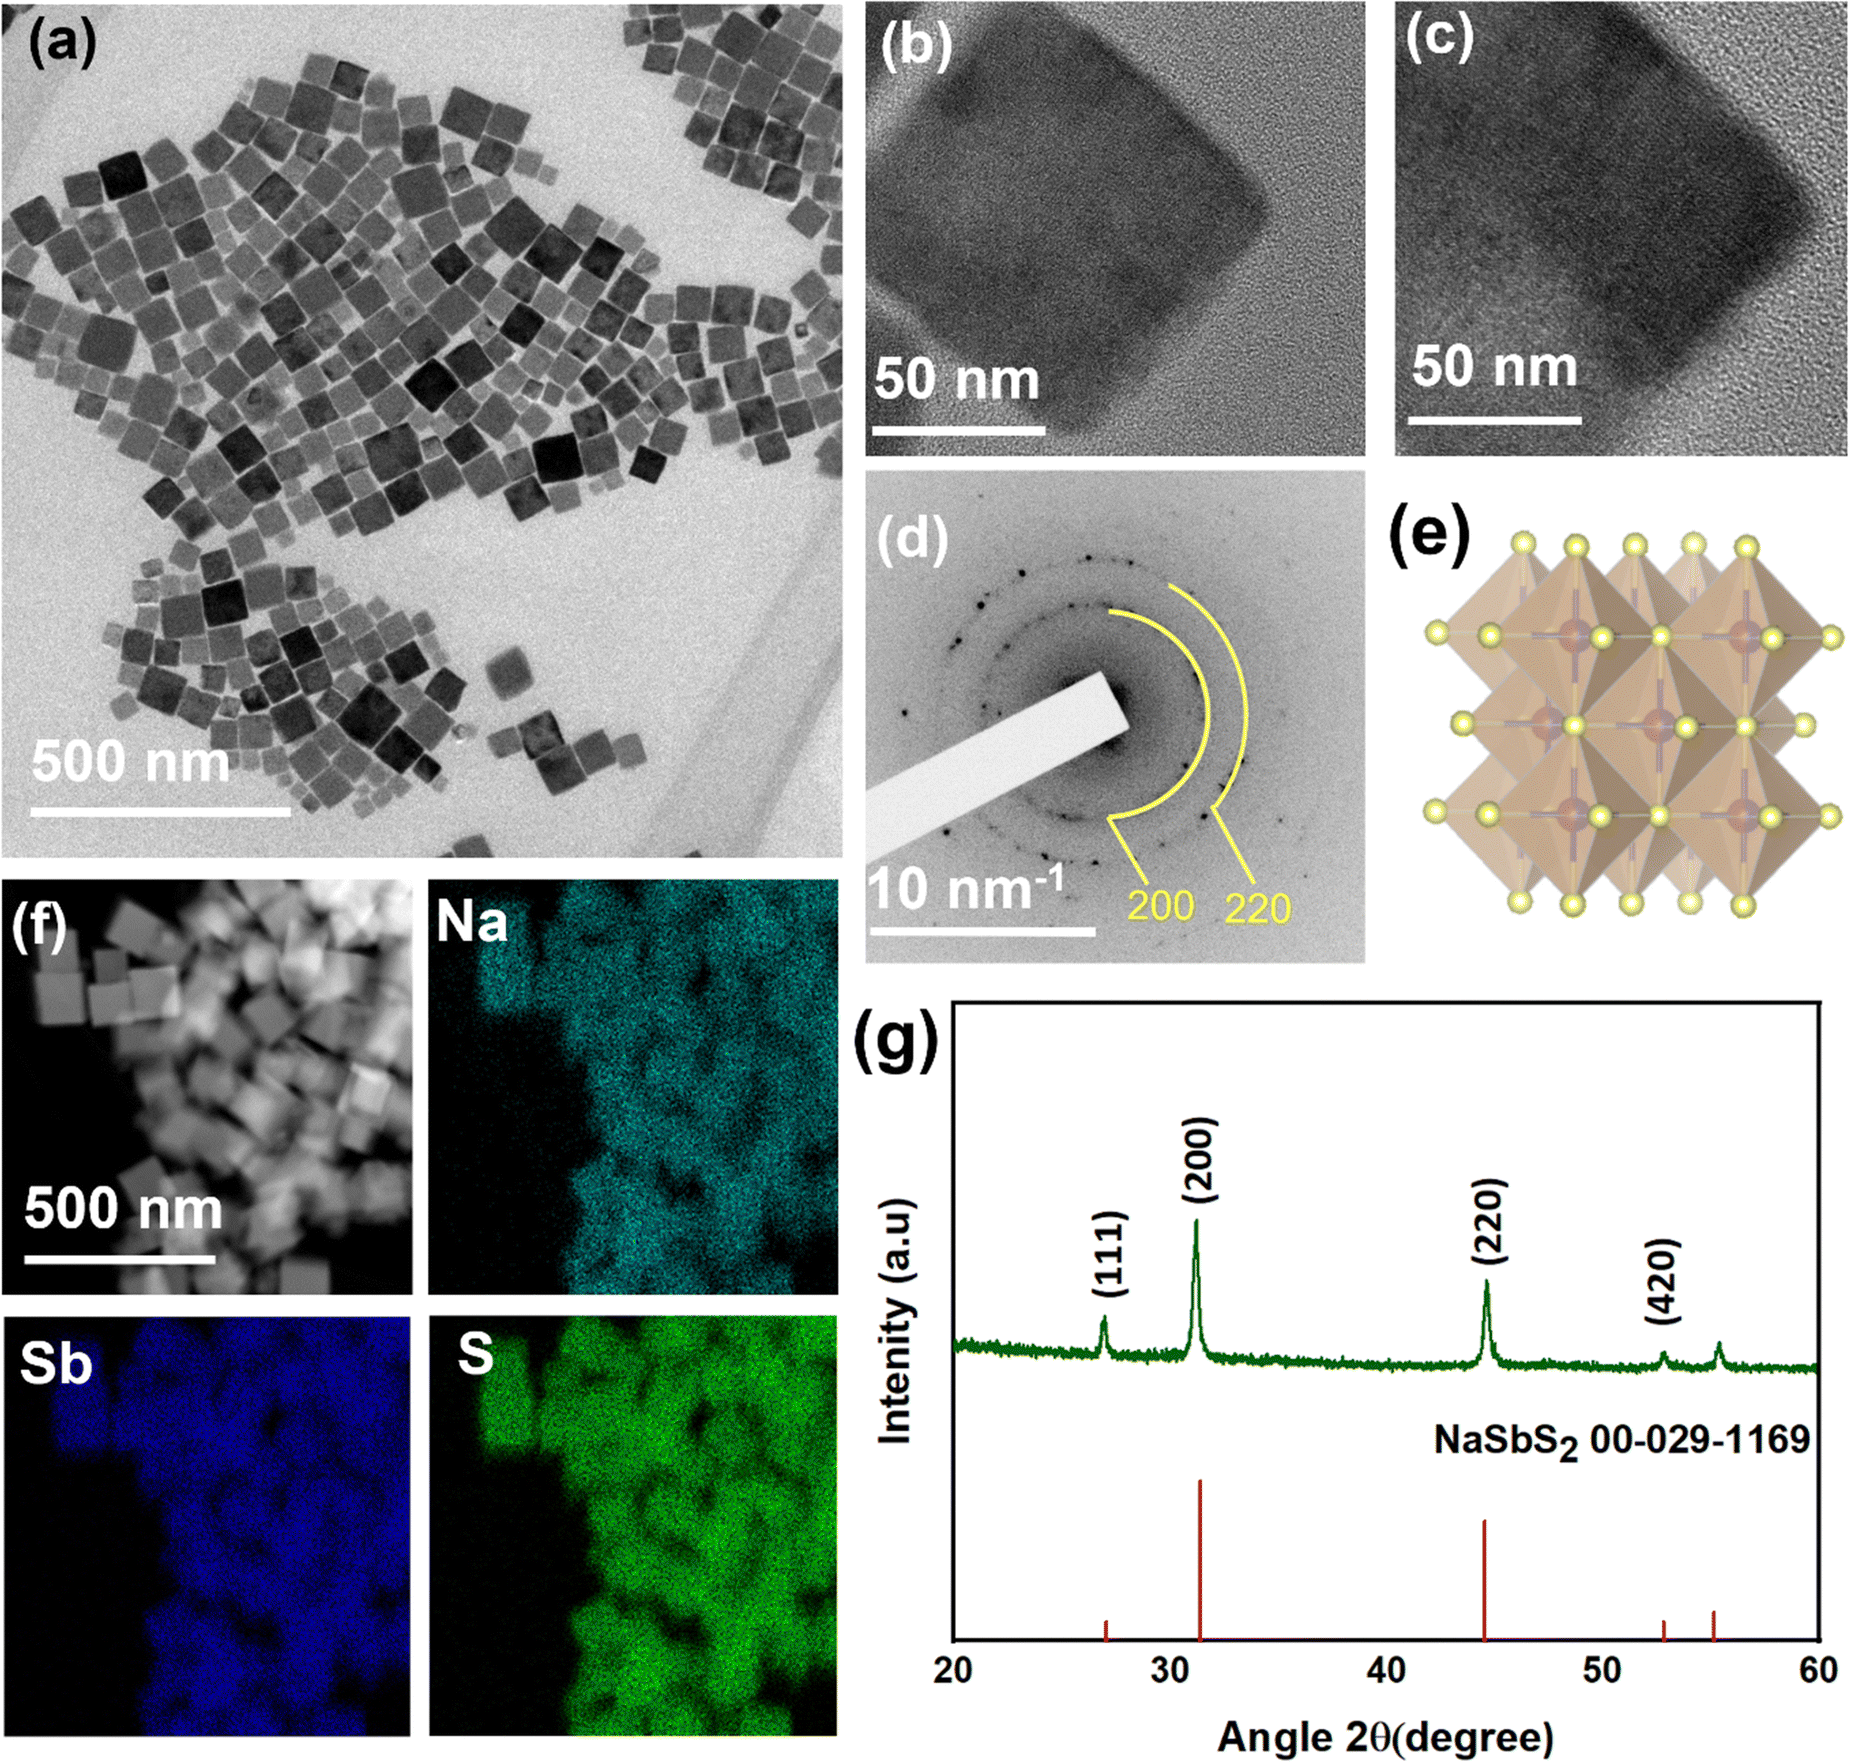 | ||
| Fig. 1 TEM image (a) of NaSbS2 NCs with (b and c) tilted TEM imaged at an angle of ±30° with (d) SAED and (e) crystal structure showing mixed cation sites of NaSbS2 yellow (S), red (Na) and blue (Sb). (f) EDX elemental mapping for distribution of the three elements and (g) XRD pattern showing match to cubic phase NaSbS2 (00-029-1169). | ||
The pattern from selected area electron diffraction (SAED) analysis (Fig. 1d) confirm that the NaSbS2 nanocubes have cubic symmetry that matches with the standard pattern for cubic NaSbS2 crystals (JCPDS no. 00-29-1169). Fig. 1e represents the crystal structure model where the mixture of monovalent and trivalent cations fill the octahedral holes while the chalcogenide forms a fcc lattice (crystal structure is modelled using the Vesta software). Energy dispersive X-ray spectroscopy (EDX) (Fig. 1f) and XRD (Fig. 1g) are used to further evaluate the composition and phase of the nanocubes. The XRD pattern is consistent with the SAED pattern, further confirming the structure of the NaSbS2 NCs. The diffraction peaks (Fig. 1g) can be indexed to the crystal planes of cubic NaSbS2 (JCPDS no. 00-29-1169).
2.2. Effect of reaction temperature and cationic precursor
Multiple experiments were conducted to gain an understanding of how the morphology, size distribution and crystallisation kinetics of the NaSbS2 NCs is affected by the key reaction parameters. Firstly, we monitored the effect of temperature on the shape, size distribution and formation of the NaSbS2 NCs by increasing the reaction temperature from 250 to 310 °C while keeping the molar ratio of NaOH (0.3 mmol) and Ph3Sb (0.1 mmol) constant. The NaSbS2 NCs adopt a cube-like shape at 250 °C (Fig. 2a) having an average side length of 81 nm. Lattice fringes in the HRTEM image (Fig. 2g) show a periodic spacing of 0.12 nm and 0.11 nm, which correspond to the (420) and (422) planes of cubic NaSbS2. We observed a transformation of the nano cubes into quasi spherical at 280 °C with an average indicative size of 62 nm (Fig. 2b). The NCs were aggregated on the TEM grid as shown in Fig. 2b. The inset image in Fig. 2b clearly shows the quasi-spherical shape of individual NCs. Periodic fringes of 0.17 and 0.20 nm calculated from the HRTEM image (Fig. 2h) correspond to the (220) and (311) lattice planes of cubic NaSbS2 NCs. The NaSbS2 NCs upon increasing the reaction temperature to 310 °C adopt cuboctahedra shape with maximum indicative size of 57 nm (Fig. 2c). The cubic crystal phase of the NaSbS2 NCs is represented by the d-spacing obtained from the HRTEM image in Fig. 2i. It was observed that NCs prepared at different reaction temperature shows defects in some areas of the crystals (Fig. S2, ESI†). The major cause of defect is assumed to be associated with the existence of a heavy element, electronic configuration of cation, and high dielectric constant.50,51 The existence of 5s2 electron of Sb3+ which has partially oxidized valence shell enhance the polarizability of cation. The large polarizable cation induce high dielectric properties which results defects in NCs.48,50 The SAED pattern (Fig. S3, ESI†) and XRD pattern of the NCs (Fig. S4, ESI†) obtained from the samples synthesized at different temperatures are consistent with the cubic phase of NaSbS2 crystal (JCPDS no. 00-29-1169). The EDX mapping (Fig. S5, ESI†) also indicates that all three elements are distributed uniformly in the NaSbS2 NCs generated at different reaction temperatures.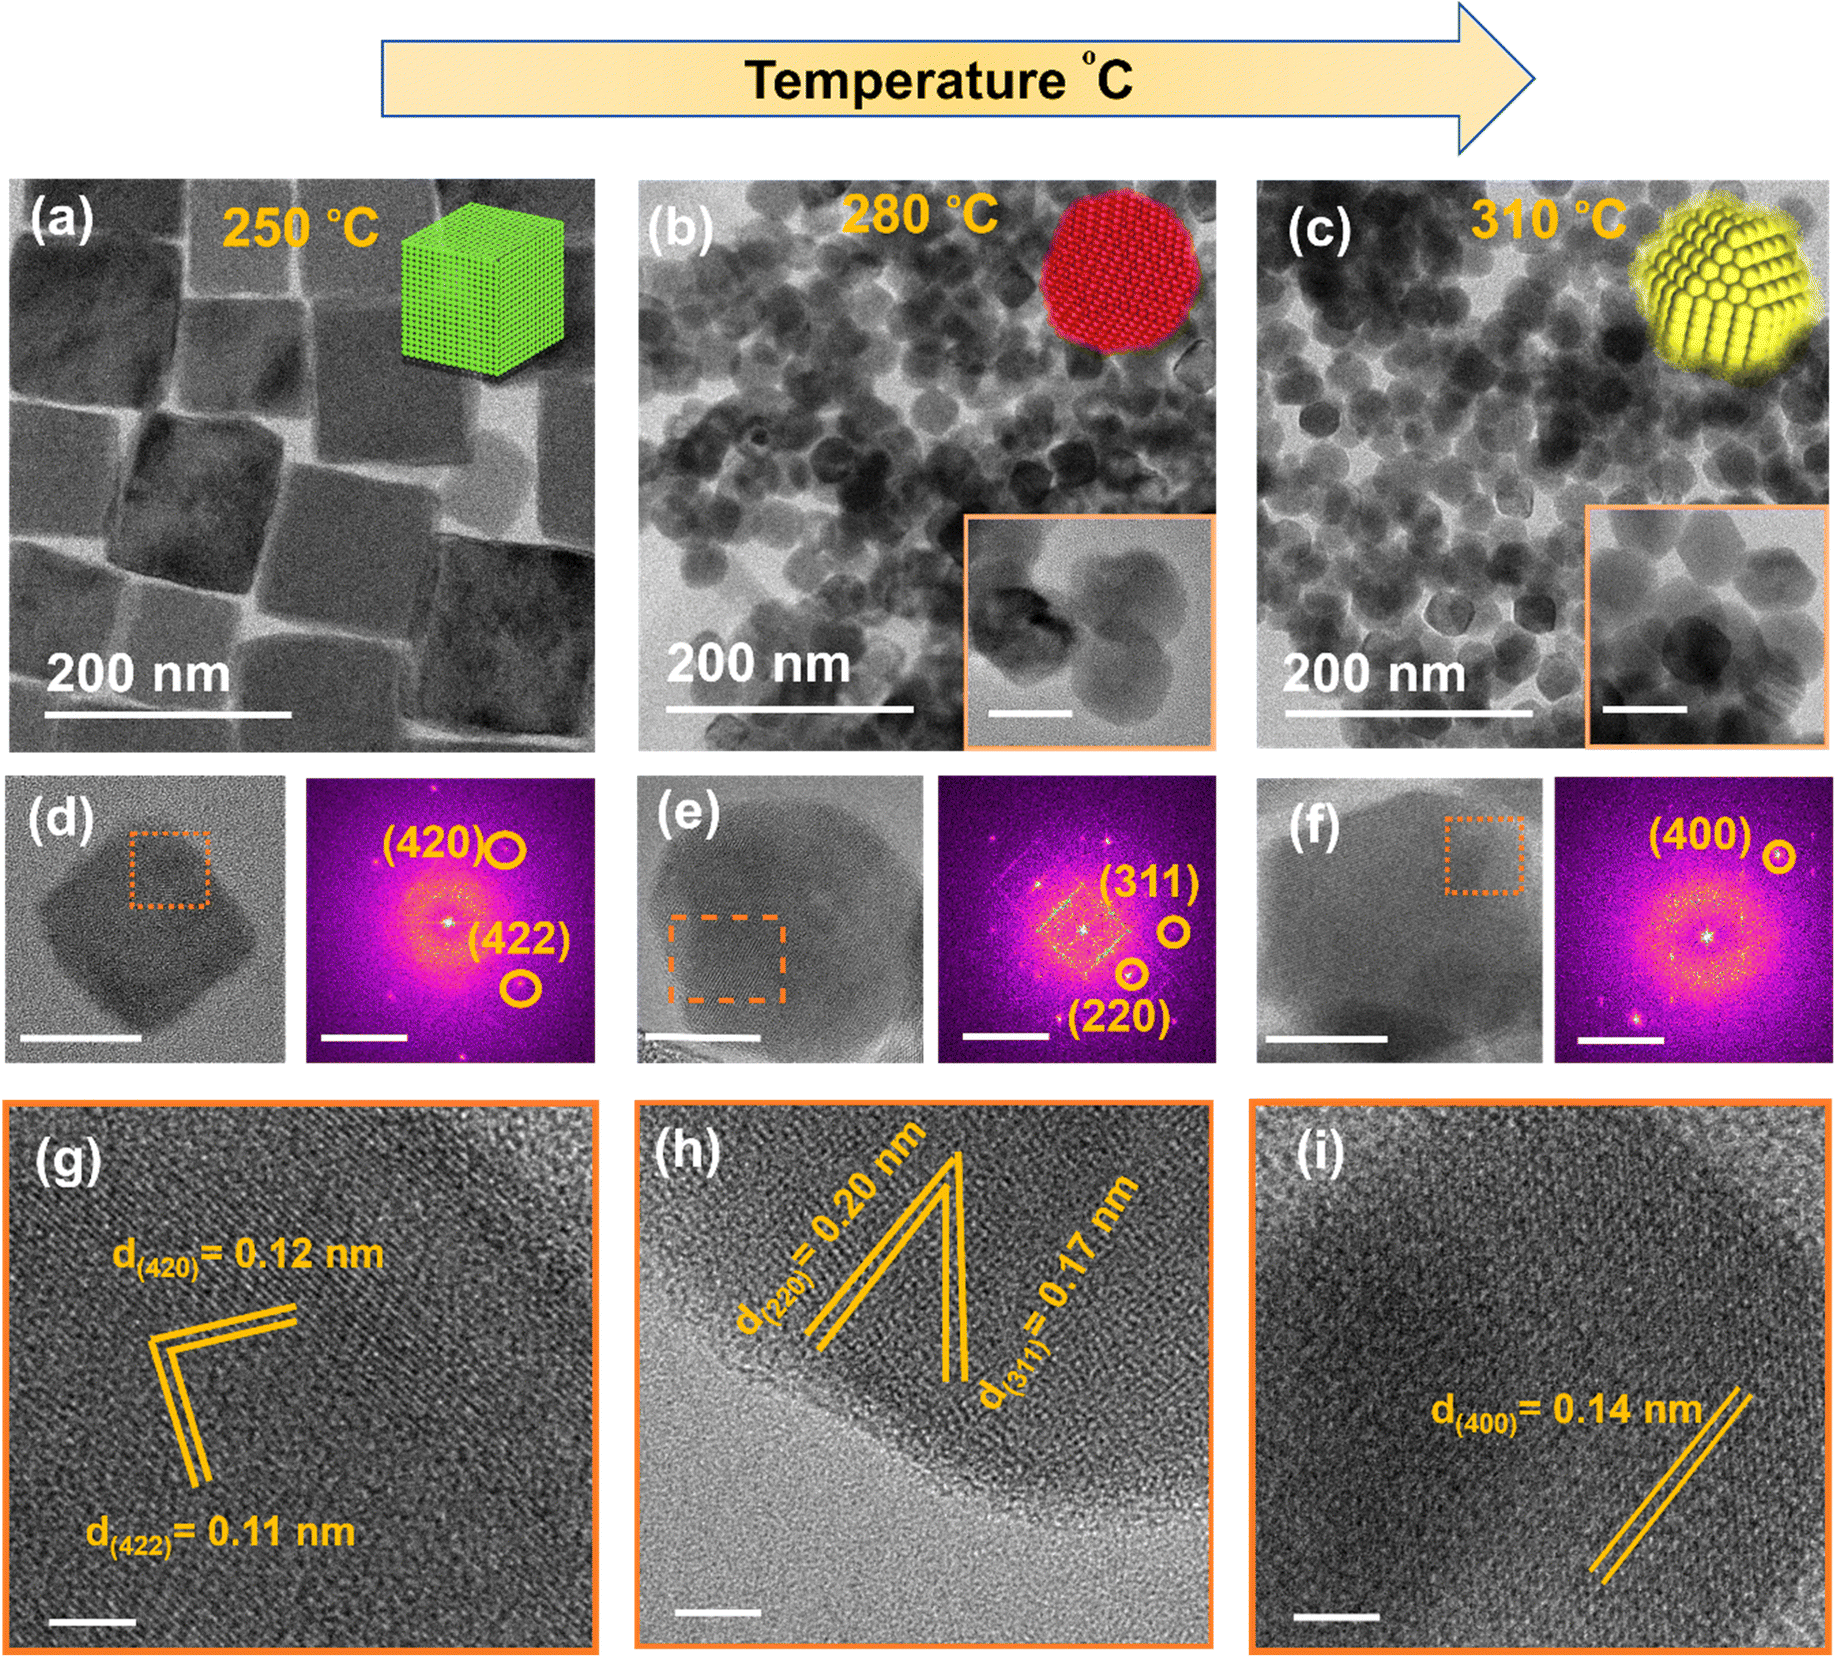 | ||
| Fig. 2 (a–c) TEM images of NaSbS2 NCs formed at 250, 280 and 310 °C, respectively the scale bar in the inset images is 50 nm. (d–f) are the magnified images (scale bar is 50 nm) and FFT patterns. (g–i) magnified images of NaSbS2 NCs. The scale in panels (g–i) is 5 nm respectively. | ||
The influence of excess cationic (NaOH and Ph3Sb) precursors in the reaction solution was studied separately while keeping the reaction temperature at 250 °C, in order to confirm the compositional flexibility of the NCs. We observed that the addition of a slight excess of the Ph3Sb precursor (0.15 mmol), while keeping all other conditions constant (0.3 mmol NaOH and reaction temperature 250 °C) did not lead to any change in the crystal structure (no change in the XRD pattern) or the shape of the NaSbS2 NCs (Fig. S6, ESI†). However, the addition of excess NaOH (from 0.3 to 0.6 mmol) with 0.1 mmol of Ph3Sb at 250 °C reaction temperature results in a change in the size and shape of the NCs with the same crystal phase (Fig. S7, ESI†). Fig. S7a and b (ESI†) shows the TEM image of the NCs prepared with 0.6 mmol of NaOH. We observed a crystal shape transformation from cubes to truncated cubes and an increase in the crystal size from 95 to 180 nm when the NaOH concentration in the reaction solution was raised from 0.3 to 0.6 mmol. The energy dispersive spectroscopy (EDS) mapping (Fig. S7c, ESI†) indicates that in both samples all the elements are evenly distributed without segregating along boundaries. XRD pattern shown in Fig. S7d, ESI† confirmed that excess Na source has been shown to have no influence on the phase purity of the resulting NCs.
Given that a cubic crystal phase was obtained for all samples with variation of temperature (Fig. S3 and S4, ESI†), the shape variation (cube to quasi spherical shape and then to cuboctahedra) with temperature can be attributed to different growth rates on different crystal facets (Fig. 3a). A common trend of surface energies for NCs as a fcc crystal is, {100} < {110} < {111}.52 Cubic particles are formed when the growth in the [111] direction is substantially greater than the growth in the [100] direction.53,54 Presence of OLA/OA in the reaction system may result in the formation of C18H35NH3+, C17H33COO− and C18H35NH3+:C17H33COO−.55 It is likely that the oleic acid in the deprotonated form in the reaction system selectively block the [100] facet at low temperature because of its highest potential to donate electrons among the other ligands, resulting in the formation of nanocubes.55,56 However, the formation of quasi spherical shaped NCs by raising the reaction temperature from 250 to 280 °C suggests that at higher temperature (280 °C), the cubic NCs were less stable with the six high surface energies [100] facets. Moreover, increasing the reaction temperature from 280 °C to 310 °C results in the formation of cuboctahedra shaped NCs. The difference in the binding energies of ligand with different facets will results different coverage of ligand and transition in shape of NCs.56 The external conditions such as reaction temperature and concentration of ligand used during the synthesis can affect the solubility, equilibrium coverage of ligand with particular facet and binding kinetics of the ligands.57,58 At 250 °C the growth along [111] direction was high which results in nanocubes, while the formation of cuboctahedra at 310 °C suggested the balanced growth of [100] and [111] which is most likely because of the transition in the equilibrium coverage of ligands with the increase in the reaction temperature. Based on the above observations for the impact of varying the molar ratio of the cationic precursor (Fig. 3b), it is suggested that increasing the amount of cationic precursor results in an increased growth rate of the [100] facets, which results in the formation of truncated nanocubes. This phenomenon was also observed for the synthesis of PbSe/S NCs with a fcc crystal structure.54,56,59,60
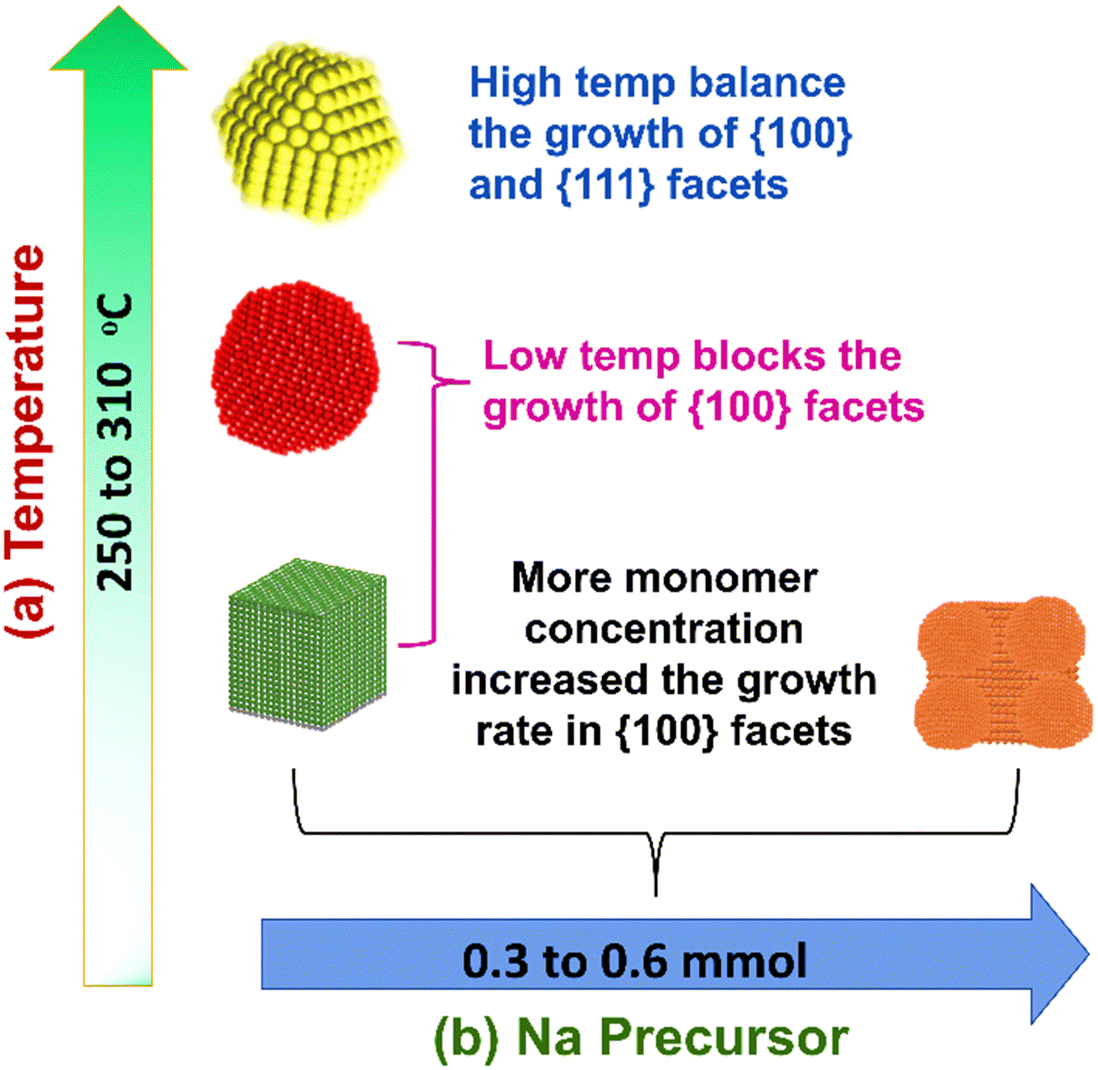 | ||
| Fig. 3 Schematic of the controlled synthesis of NaSbS2 for different reaction parameters (a) reaction temperature and (b) Na precursor molar ratio. | ||
2.3. Effect of ligands
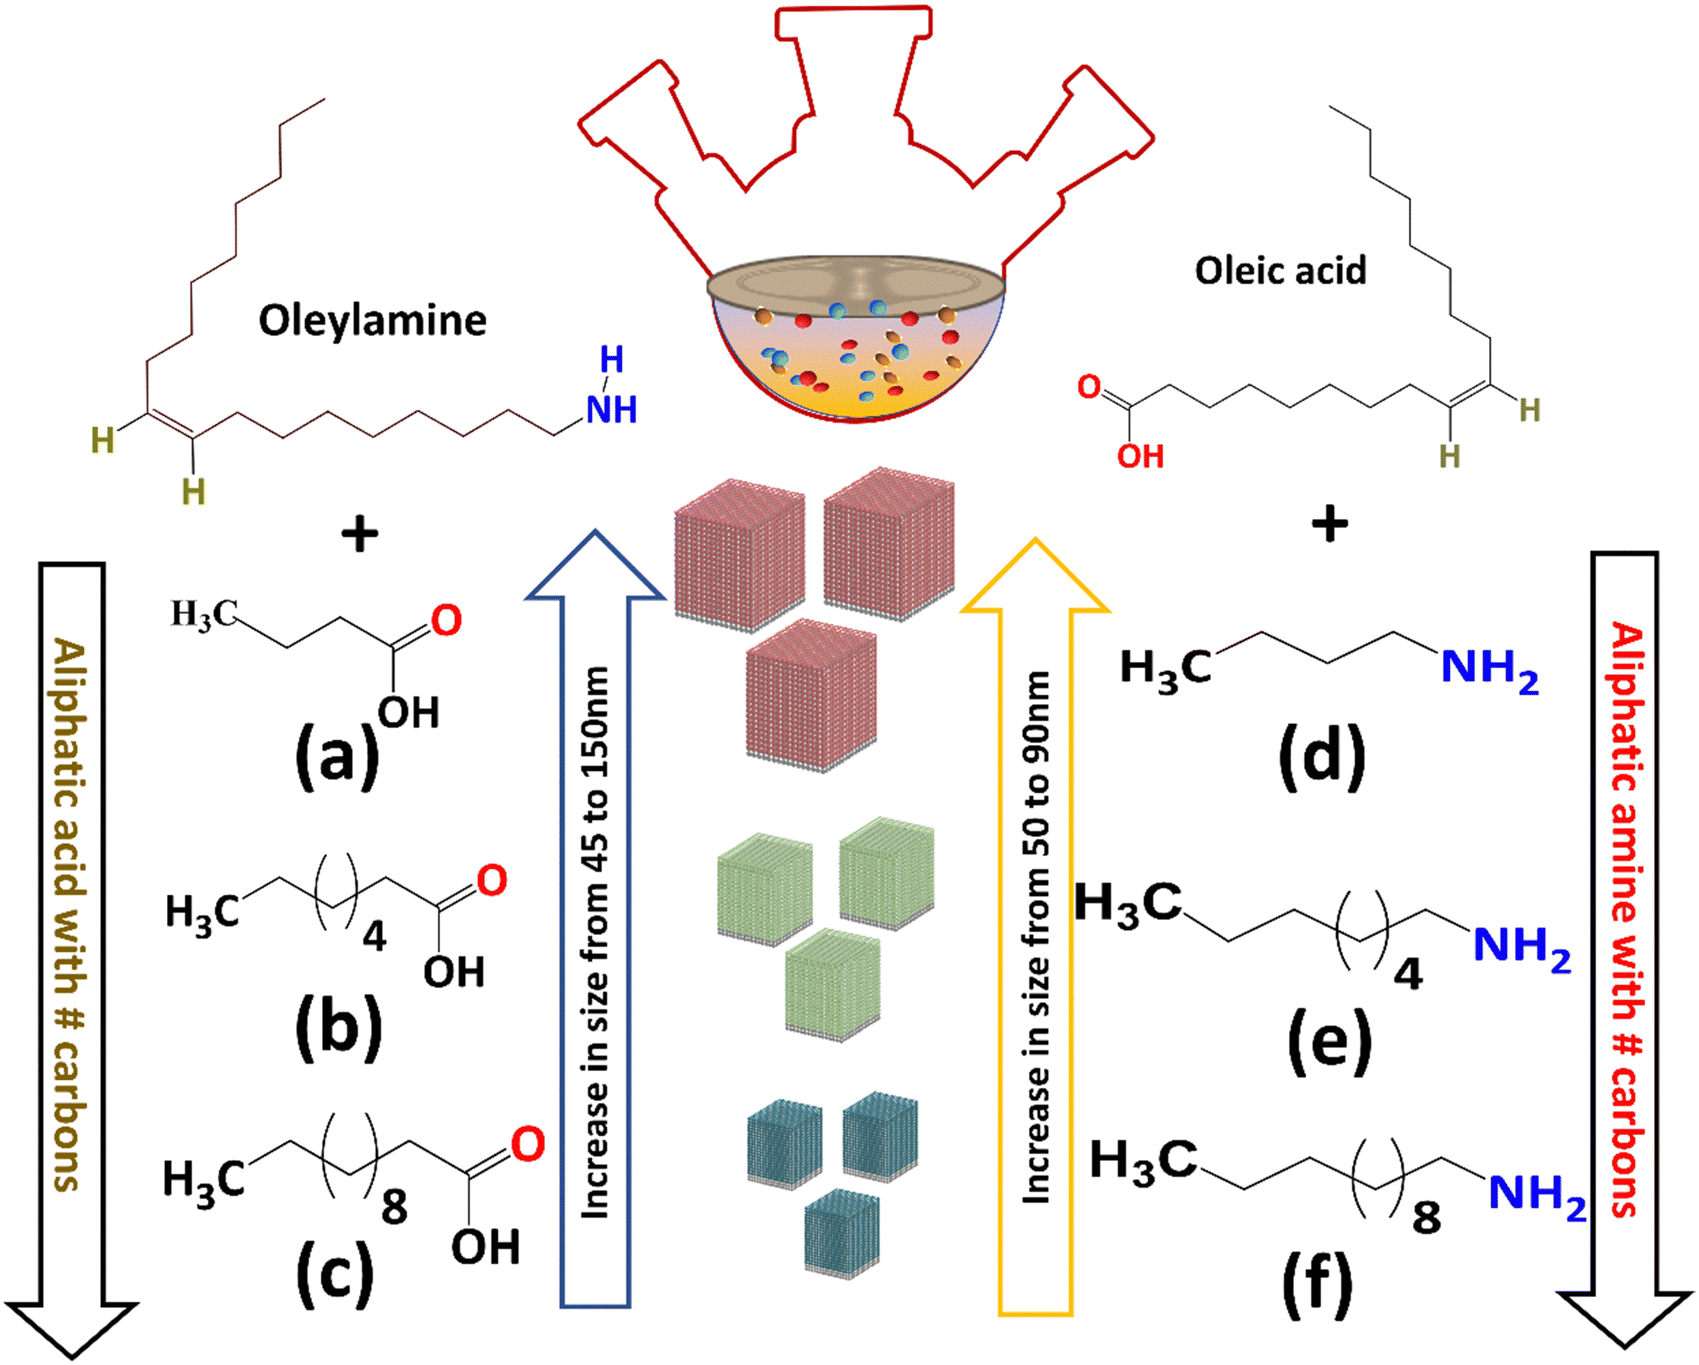
Following the examination of the reaction temperature and cationic precursor molar ratio, we also investigated the role of different ligands both individually and in different combinations for the growth of NaSbS2 NCs. Complete replacement of the combination of oleylamine and oleic acid (OLA/OA 4:1) ligands with equal moles of oleylamine (OLA) (Fig. S8, ESI†) while keeping all other conditions constant (Ph3Sb, NaOH and reaction temperature at 250 °C) results in the formation of metallic Sb. In contrast, using OA alone results in Sb2S3 nanorods. These observations show the co-operative role of OLA (amine) and OA (acid) in the formation of the NaSbS2 NCs. These observations motivated us further to explore the relationship between ligand chain length and NC size. We carried out two additional studies by varying the ligand composition, in order to rationalize the effect of different ligand chain length (amine and carboxylic acid). Either oleic acid (OA) or oleylamine (OLA) were used as the control while the counterpart (an acid or an amine) was changed to a corollary of varying chain lengths. To maintain consistency, all the samples were characterized and processed under similar conditions.
The NaSbS2 NCs were formed in all the reactions carried out using a combination of oleylamine with carboxylic acids of different chain length including C12 (lauric acid LAc), C8 (octanoic acid OctAc) and C4 (butanoic acid ButAc). Nanocubes of differing sizes were obtained from these reactions at 250 °C employing different chain length acids, as shown by TEM in Fig. S9a–c (ESI†). The average size of the nanocubes obtained from TEM images were approximately 45, 75 and 150 nm for C12, C8 and C4 carboxylic acid chain lengths, respectively. These further investigations, together with an average size of 80 nm nanocubes generated from the oleylamine-oleic acid (C18 acid-C18 base) combination, clearly indicate a link between the size of the generated NCs and ligand chain length. The size of NaSbS2 NCs decreased with increasing the chain length of the aliphatic carboxylic acid. The diffraction peaks in the XRD as shown in Fig. S10a (ESI†) are consistent with the cubic crystal phase of NaSbS2 NCs.
By extending these findings to amines, the relationship between the ligand chain length and size was further investigated. To study the effect of amine, we used the oleic acid (C18) as the organic acid but changed the amine chain length. Keeping the other conditions constant, saturated alkyl amines with fourteen (C12), eight (C8), and six (C6) carbons were used to substitute the oleylamine (C18) during the synthesis. The TEM images (Fig. S9d–f (ESI†)) indicate the formation of spherical nanoparticles from the reactions carried out using oleic acid (C18) and dodecyl amine (DDAm C12) with an average size of 50 nm. The reactions were also carried out at 250 °C for oleic acid C18 – octyl amine (OctAm C8) and oleic acid (C18) – butyl amine (ButAm C4) combinations, from which nanocubes of different size were obtained. The formation of nanocubes with average size between 65 to 90 nm were formed using amine, octyl amine (C8) and butyl amine (C4) with oleic acid (C18). The crystalline nature of all nanocubes was revealed by XRD measurements. The XRD diffractograms (Fig. S10b, ESI†) all matched well with the cubic phase of NaSbS2. FTIR analysis of samples prepared using different chain length of acid and amine are provided in (Fig. S10c and d, ESI†). These results shows that the surface bonding interaction of carboxylate is stronger than that of ammonium.
In summary, we observed the cooperative role of amine and acid functional group for the synthesis of NaSbS2 NCs whereby the NC size (Fig. 4) depends more on the chain length. The results shows that the length of the ligand chain can impact the rate of nucleation by affecting the solubility of monomers or rate of precursor conversion to monomers. Moreover, burst nucleation consumes monomers quickly, preventing further nucleation over the duration of the reaction time. Furthermore, if the nucleation rate is substantially higher than the growth, the formed nanoparticles share essentially the same growth rate throughout crystallization, allowing monodisperse size distribution.61 It appears that increasing the length of saturated alkyl chain (C4 to C12) increases the nucleation and results in the formation of numerous tiny nuclei, which leads to smaller nanocrystals. Polar ligands e.g. OLA and OA facilitate high solubility of the monomers that results in the reduction of the nucleation rate and formation of larger sized nanocrystals.61–64
 | ||
| Fig. 4 Schematic illustration of the size dependence on the chain length of carboxylic acids (a–c) and amines (d–f). | ||
Infrared (IR) spectroscopy investigations was employed to observe the ligands present on the surface of the synthesised nanocrystals. The spectra of NCs (Fig. S–S11a ESI†) after 1st and 2nd washes indicate the characteristic feature of carboxylate asymmetric and symmetric stretching vibration peak between 1550 and 1444 cm−1, as well as the N–H bending shoulder peak around 1600 cm−1 with asymmetric and symmetric stretches (v-NH2) at 3300 cm−1 which are consistent with oleylamine. The removal of the peaks related to the amine functional group and preservation of those from the carboxylate was observed in the IR spectra of NCs washed with hexane/methanol. Fig. S11b (ESI†) revealed the FTIR spectra of nanocrystals after purification. The spectra indicate the characteristic feature of carboxylate asymmetric and symmetric stretching vibration peak at 1550 and 1444 cm−1 respectively. The bidentate coordination of deprotonated oleic acid is suggested from the FTIR because of the difference of 106 cm−1 between the two characteristics bands. Peaks at 1550 cm−1 are attributed to the bidentate binding of oleic acid (–COO–M), which is consistent with the literature.25,65–69 The broad peak at 3400 cm−1 could be ascribed to the hydroxyl group of adsorbed water or methanol. The distinctive peak at 1709 cm−1 for oleic acid (free), as well as the peaks at 3300 and 1593 cm−1 for oleylamine, were not identified in the FTIR of the purified NCs, suggesting that there was no oleylamine or oleic acid (free) at the surface of synthesized NCs. Thus the IR suggest the surface binding of carboxylate ligand to the NaSbS2 NCs.
X-Ray photoelectron spectroscopy (XPS) was employed to investigate the oxidation state of the constituent elements of the NCs. The survey scan (Fig. S12a, ESI†) shows the presence of all three elements. High-resolution spectra (Fig. S12b–e, ESI†) were recorded for the individual elements. In the Na XPS (Fig. S12b, ESI†) spectrum, an intense peak at 1070.15 eV for the Na 2p1/2 was observed for Na+. For S 2p XPS spectrum, (Fig. S12c, ESI†) an intense peak for S 2p3/2 at 162 eV is consistent with the literature reported for S 2p of sulphide (S−2). The peak (Fig. S12d, ESI†) for Sb 3d3/2 at 538.37 eV and Sb 3d5/2 at 528.90, confirmed the presence of Sb(III) in the synthesized NCs. The C 1s peak (Fig. S12e, ESI†) also presents subpeaks for C–C/C![[double bond, length as m-dash]](https://www.rsc.org/images/entities/char_e001.gif) C at 284.7 eV, C–O at 285.8 eV, and OC–O at 288.6 eV species.
C at 284.7 eV, C–O at 285.8 eV, and OC–O at 288.6 eV species.
2.4. Time-lapse phase evolution of the NaSbS2 NCs
To gain further understanding of the phase evolution of the NaSbS2 NCs during synthesis, we probed the growth progression of the crystals with respect to reaction time. To this end, we quenched the reaction during the early stages (before injection of sulphur and after sulphur injection for 10, 15 and 20 min respectively) and analysed the intermediates by TEM and XRD (Fig. 5). Interestingly, the XRD analysis of the reaction mixtures before injection of sulphur (Fig. 5a) evidences the formation of amorphous material. However, FTIR analysis of the reaction mixture before injection of sulphur indicate that amorphous material is a complex of metal precursor with ligands (OLA and OA) (Fig. 5a). The carboxylates in the formed complex are confirmed to be deprotonated by FTIR analysis, which shows existence of symmetric and asymmetric stretching frequencies between 1500 and 1600 cm−1 (Fig. 5b). The slight difference observed between the symmetric and asymmetric stretching frequencies for the complex and those observed for the pre-synthesized metal oleate are consistent with the bidentate coordination (i.e., coordination through oxygen) of carboxylic acid based ligands. Immediate removal of the heating mantle after 10 min at 250 °C and isolation by centrifugation of resulting NCs reveals the formation of Na2S which upon exposure to air converted to Na2SO3 as shown in the XRD spectra (Fig. 5a). Continued reaction at 250 °C for 15 min results in a cubic NaSbS2 as a major phase with orthorhombic Sb2S3 as a minor phase (Fig. 5a). TEM images of sample collected at different reaction time is shown in the Fig. 5c and d. TEM analysis (Fig. 5d) shows that nano cubes are formed by interparticle ripening at the early stages. After 20 min of reaction pure phase NaSbS2 NCs (Fig. 5e) with well-formed cube-like morphology were observed. The observation of Na2SO3 at an early stage (Fig. 5a) suggests the formation of HS− species from the reaction of dissolved sulphur and NaOH.24,70Fig. 5f shows a schematic illustration of the time lapsed phase evolution of the NCs. To confirm the formation of NaSbS2 from metal oleate, we performed another controlled experiment. Here by injecting preformed Na-oleate and sulphur/OLA mixture into a mixture of Sb-oleate at 250 °C and keeping the reaction at 250 °C for 30 min, NaSbS2 NCs (Fig. S13, ESI†) were formed with binary by-products (Sb2S3). However, increasing the reaction time to 2 h results in pure phase NaSbS2 NCs. Fig. S14, ESI† depict the proposed reaction for the synthesis of NaSbS2 NCs. The retiveld refinement data of aliquots are provided in Fig. S15, ESI.† Table S1 (ESI†) collated all the controlled experiments done during the synthesis of NaSbS2 NCs.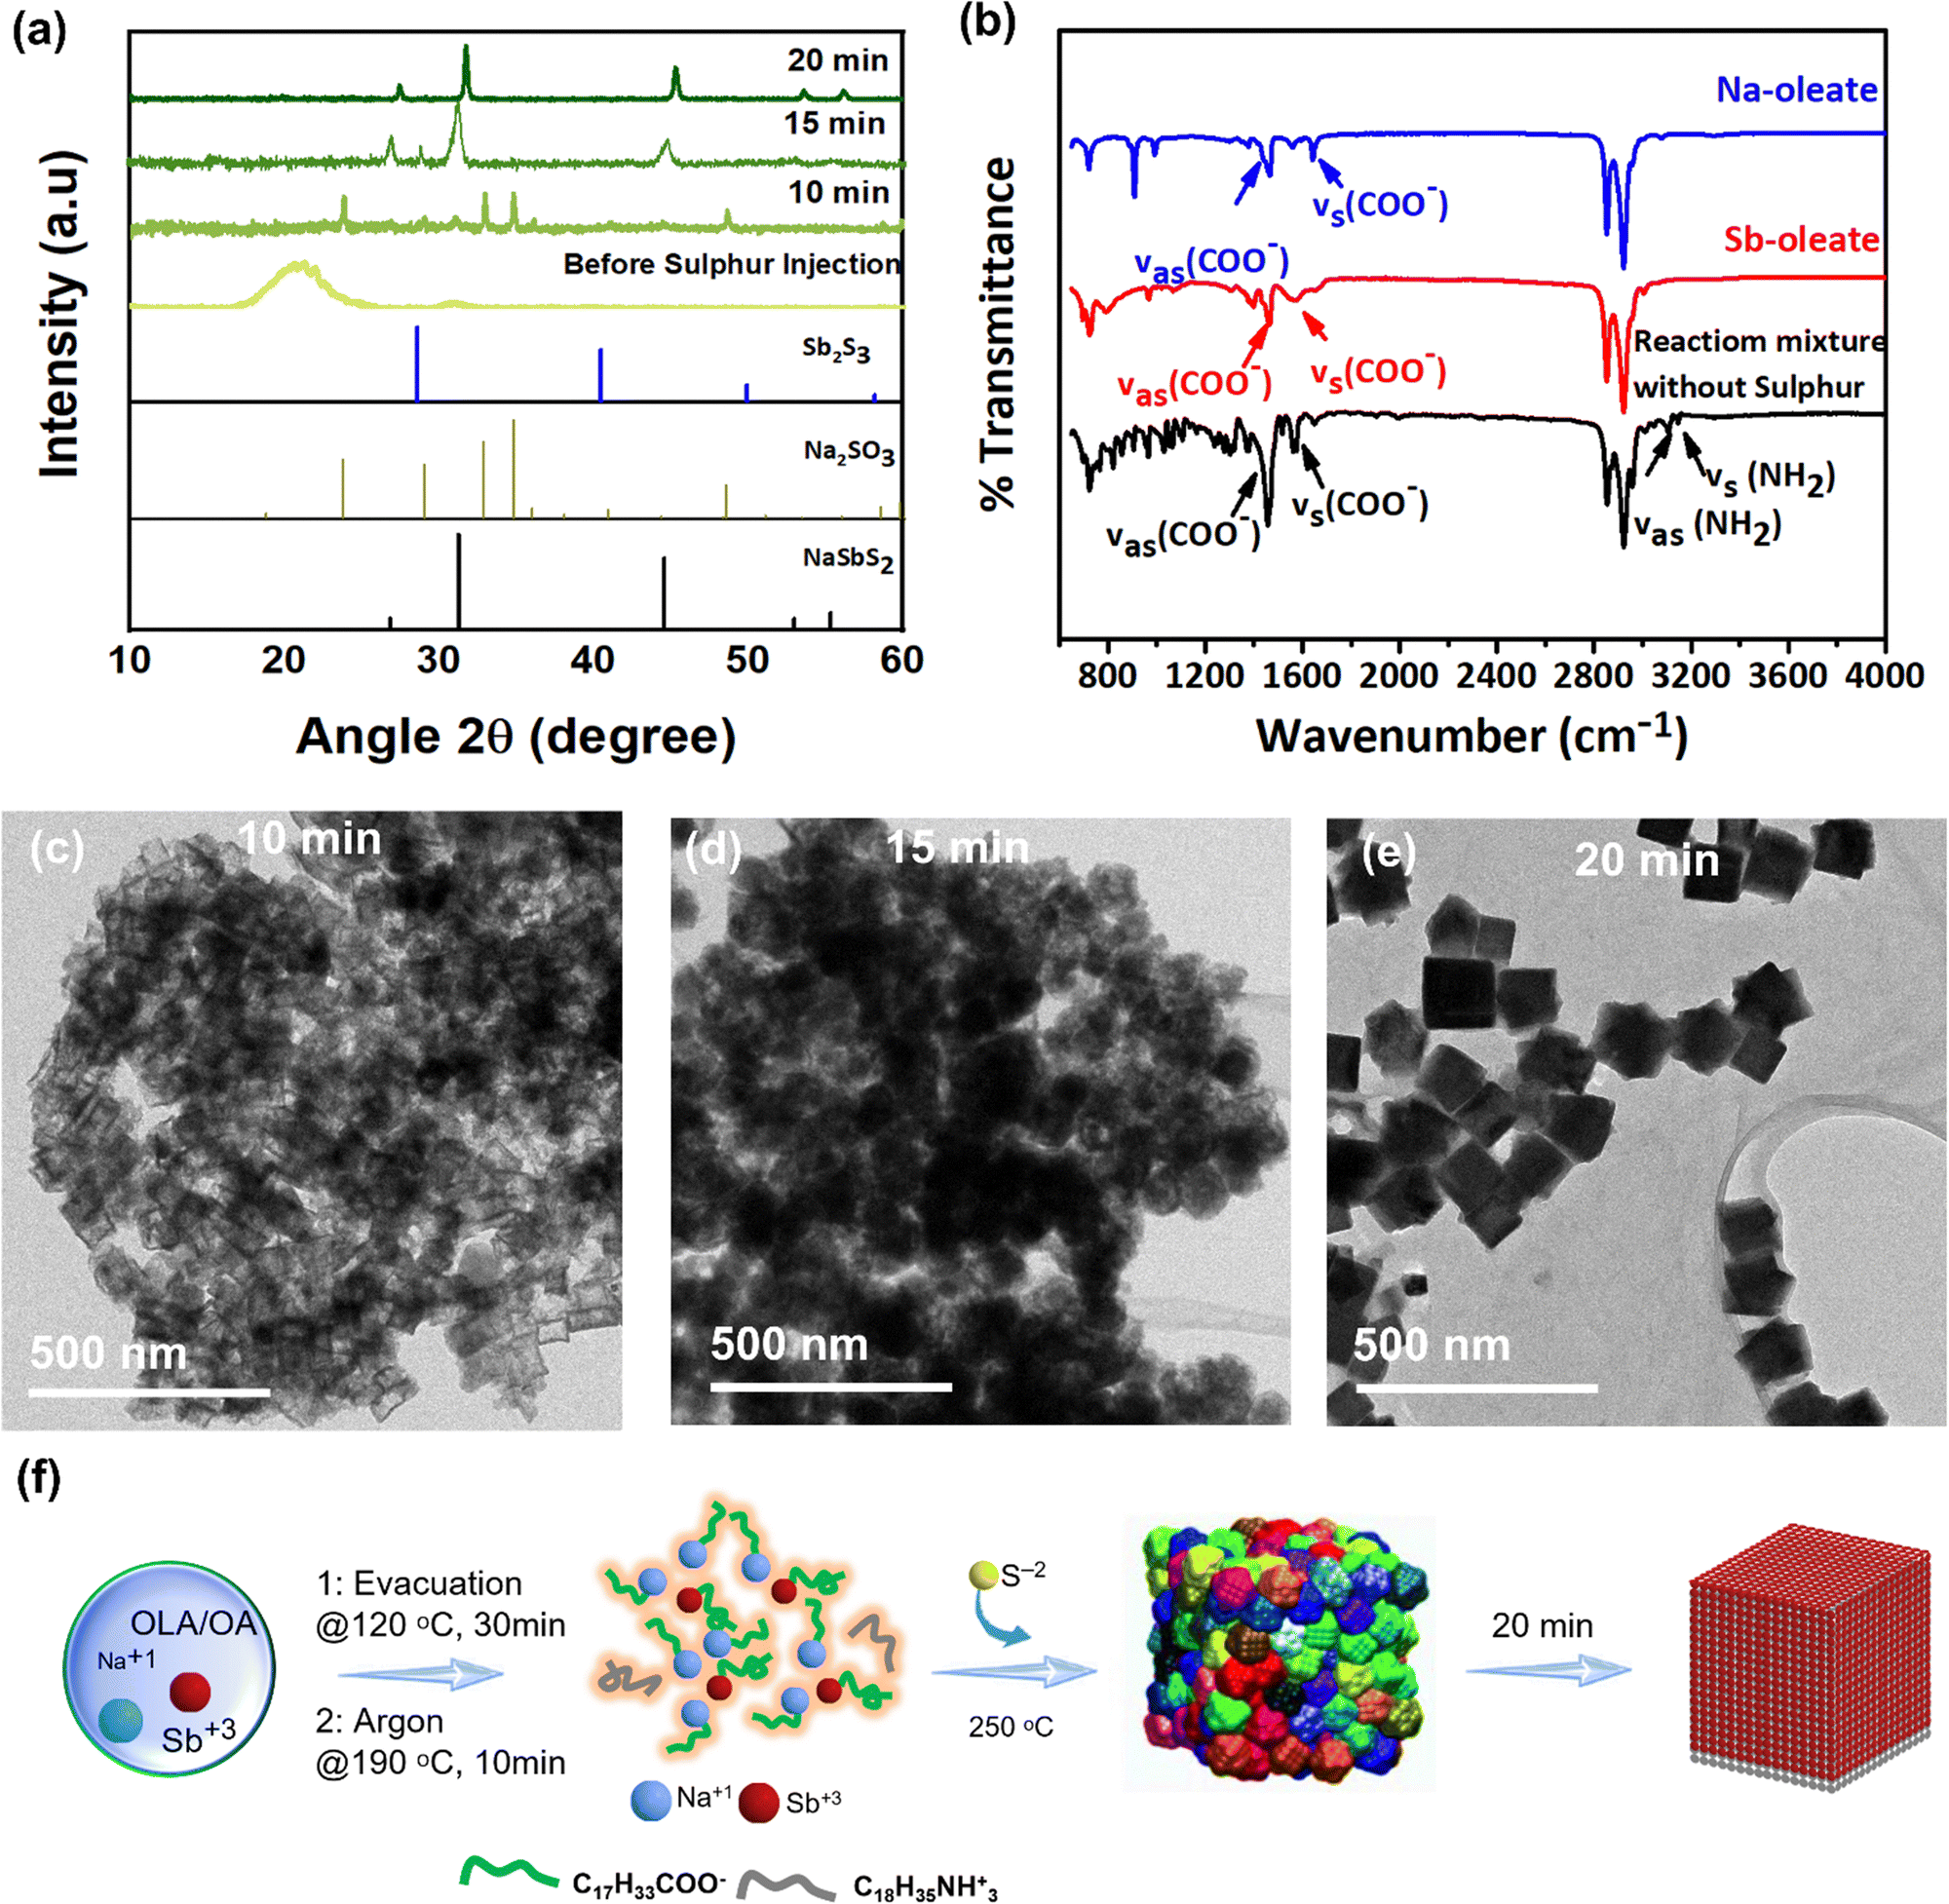 | ||
| Fig. 5 (a) XRD spectra showing the phase evolution of NaSbS2 NCs at different reaction time i.e. before injection of sulphur and after injection of sulphur precursor (10, 15 and 20 min) along with (b) FTIR spectra of aliquot taken before injection of sulphur. Panels (c and e) show the TEM images for 10, 15 and 20 min respectively. (f) Schematic depiction of time lapsed phase evolution of NCs. | ||
3. Transport properties
To gain insight into the ionic and electronic properties, electrochemical impedance spectroscopy (EIS) and DC polarization technique was applied on the NCs synthesized at 250 °C. The as-synthesized NaSbS2 NCs after several washing cycles until they remain insoluble were vacuumed dried and then 100 mg of powder was cold pressed into a 60 μm thick pellet (Fig. 6a) at a pressure of 5 MPa for 60 seconds. Decrease in the intensity of peaks for the FTIR of thoroughly washed sample indicate the maximum removal of the ligands (Fig. S16, ESI†). The XRD pattern (Fig. 6b) of the pre-dried sample and cold pressed pellet show no phase change after pressing. A symmetric swagelok cell was made with pellet sandwiched between two stainless steel (SS) current collectors in an Ar-filled glove box employing a pellet for EIS measurement. The data was collected at the frequency range of 10 mHz to 1 MHz as reported for different superionic conductors.26 The Nyquist plot for NaSbS2 is shown in Fig. 6e. The ionic conductivity of the pellet was determined using the equation based on its bulk and grain boundary resistance and size.| σ = L/RS |
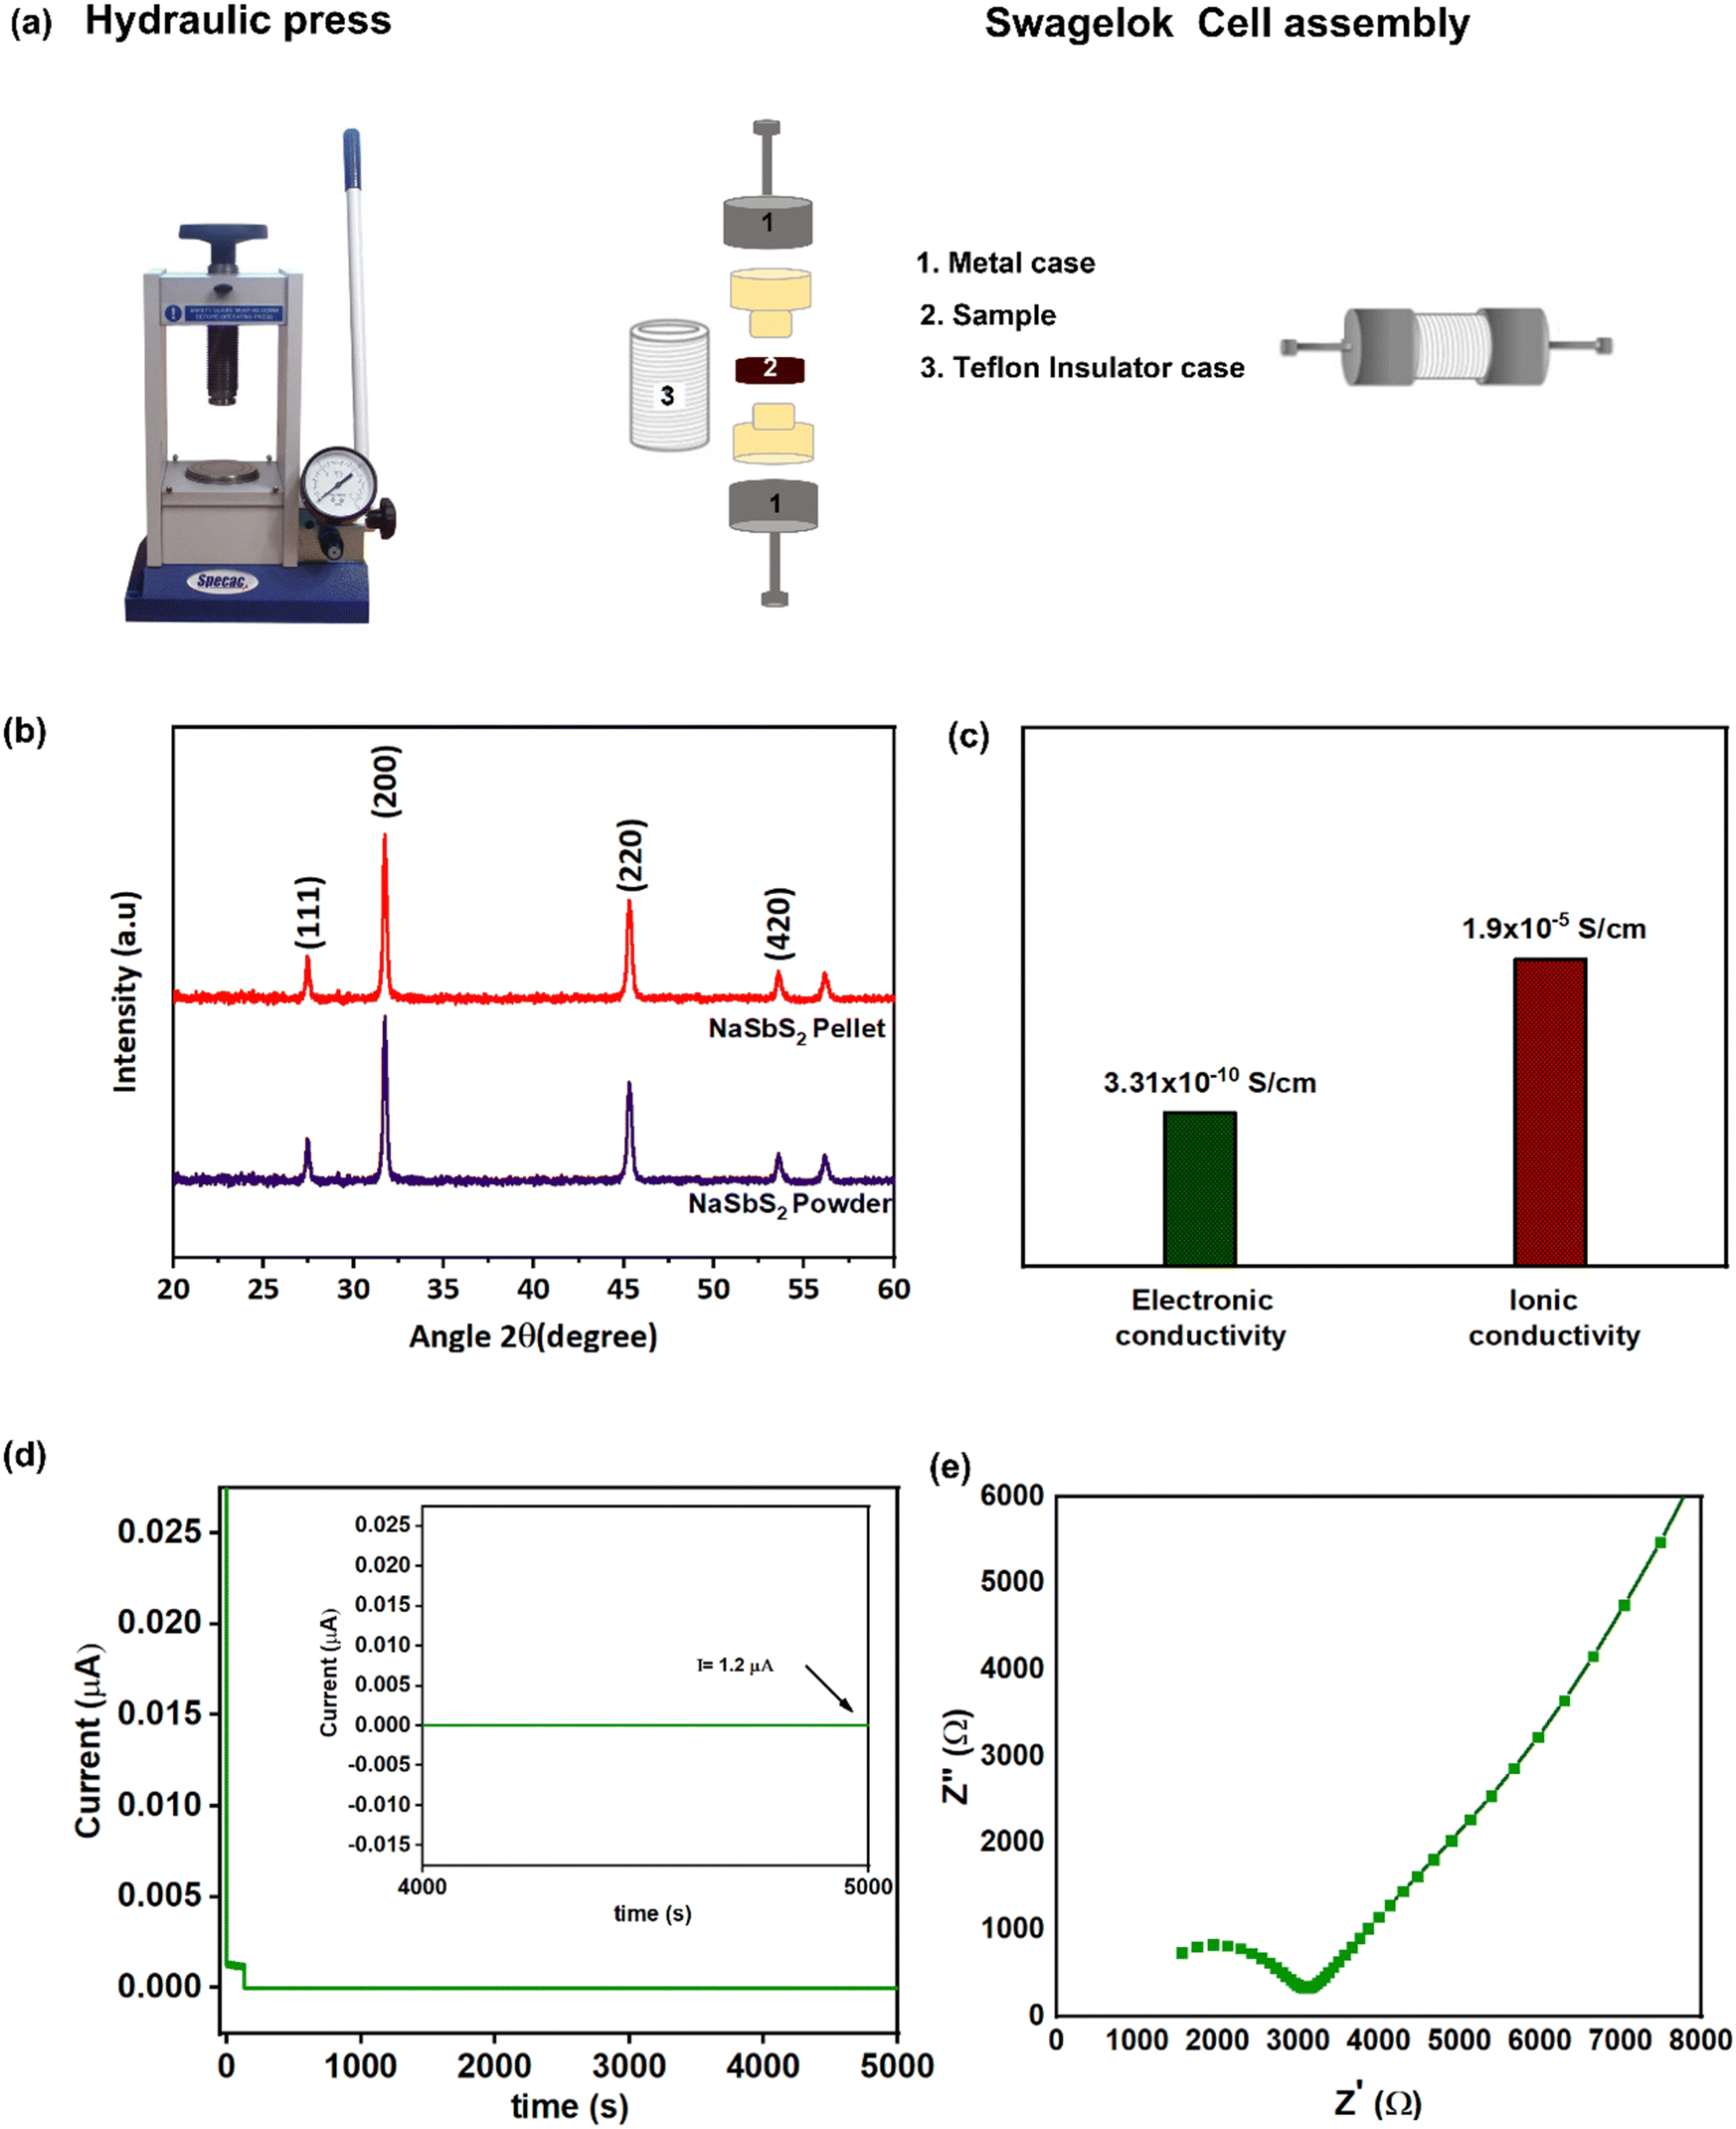 | ||
| Fig. 6 (a) Schematic for Swagelok cell assembling (b) XRD pattern of the pellet and powder NaSbS2 before and after cold press (c) bar graph of electronic and ionic conductivity (d) DC polarization of NaSbS2 with inset showing the current behaviour for duration of 5000 s (e) Nyquist plot of Electrochemical Impedance Spectroscopy (EIS) of NaSbS2 pellet. | ||
A DC polarization test (with an applied voltage of 0.5 V at RT) was utilized to determine the electronic conductivity. The ions have been stopped by the electrode, and the ultimate constant current is created by the passage of electron holes.71 As a result, the electronic conductivity, σe (S cm−1) was determined using ohms law from the stabilized voltage:
| σe = L·I/A·V |
4. Conclusions
We show a robust colloidal synthesis process capable of creating NaSbS2 NCs of various sizes and shapes by manipulating the reaction temperature, amount of Na precursor and ligands. We synthesized NCs with different sizes (50 to 90 nm) and shapes (cube, quasi spherical and cuboctahedra) by systematically changing the reaction temperature. The cooperative role of acid and amine functionality in the synthesis of pure phase NaSbS2 NCs is shown by systematic analysis of the added ligand. To explore the distinct effect of acid and amine chain length on the synthesis of NaSbS2 NCs, we have systematically changed the hydrocarbon chain composition of these species. Variations in the ligand chain length from 18 carbons to 4 carbons, have correlated with NCs in the size range of 40 to 150 nm. Control studies show that a binary system (Sb2S3 and Na2S) and interparticle ripening of nanoparticles to obtain a well-formed cubic shape are responsible for the formation of NaSbS2. FTIR spectroscopy revealed the coordination of carboxylate and amine functionality to the surface of the NCs. The measured conductivities of NaSbS2 are 3.31 × 10⁻¹⁰ (e−) and 1.9 × 10⁻⁵ (Na+) S cm−1. We believe the results described in this work show a promising new route to synthesize alkali metal based MIECs with ionic conductivities comparable to lead halide perovskites.Author contributions
All authors have given approval to the final version of the manuscript.Conflicts of interest
There are no conflicts to declare.Acknowledgements
The authors acknowledge financial support from the Department of Chemical Sciences, University of Limerick, Science Foundation Ireland (SFI), Grant Number 16/IA/4629. KR further acknowledges SFI Research Centres MaREI, AMBER, and CONFIRM 12/RC/2278_P2, 12/RC/2302_P2, 16/RC/3918 and IRCLA/2017/285. I. S. A. acknowledges support from the SFI Industry RD & I Fellowship Programme (21/IRDIF/9876) and the EU Horizon 2020 research and innovation program under the Marie Sklodowska-Curie Individual Fellowship Grant (843621). We thank Karrina McNamara and Fathima Laffire for XPS meaurements.References
-
P. J. Gellings, Handbook of solid state electrochemistry, CRC press, 2019 Search PubMed
.
- X. Wu, A. Surendran, J. Ko, O. Filonik, E. M. Herzig, P. Müller-Buschbaum and W. L. Leong, Adv. Mater., 2019, 31, 1805544 CrossRef PubMed
- W. Tress, J. Phys. Chem. Lett., 2017, 8, 3106–3114 CrossRef CAS PubMed
- K. A. Bush, K. Frohna, R. Prasanna, R. E. Beal, T. Leijtens, S. A. Swifter and M. D. McGehee, ACS Energy Lett., 2018, 3, 428–435 CrossRef CAS
- R. E. Brandt, J. R. Poindexter, P. Gorai, R. C. Kurchin, R. L. Hoye, L. Nienhaus, M. W. Wilson, J. A. Polizzotti, R. Sereika and R. Zaltauskas, Chem. Mater., 2017, 29, 4667–4674 CrossRef CAS
- J.-M. Yang, E.-S. Choi, S.-Y. Kim, J.-H. Kim, J.-H. Park and N.-G. Park, Nanoscale, 2019, 11, 6453–6461 RSC
- Z. Xiao, Y. Yuan, Y. Shao, Q. Wang, Q. Dong, C. Bi, P. Sharma, A. Gruverman and J. Huang, Nat. Mater., 2015, 14, 193–198 CrossRef CAS PubMed
- B. Ghosh, B. Wu, X. Guo, P. Harikesh, R. John and T. Baikie, Adv. Energy Mater., 2018, 8, 1802051 CrossRef
- C. Muthu, A. Resmi, J. K. Pious, G. Dayal, N. Krishna, K. Jinesh and C. Vijayakumar, J. Mater. Chem. C, 2021, 9, 288–293 RSC
- Y. Shao, Y. Fang, T. Li, Q. Wang, Q. Dong, Y. Deng, Y. Yuan, H. Wei, M. Wang and A. Gruverman, Energy Environ. Sci., 2016, 9, 1752–1759 RSC
- Y. Yuan, T. Li, Q. Wang, J. Xing, A. Gruverman and J. Huang, Sci. Adv., 2017, 3, e1602164 CrossRef PubMed
- S.-C. Lim, H.-P. Lin, W.-L. Tsai, H.-W. Lin, Y.-T. Hsu and H.-Y. Tuan, Nanoscale, 2017, 9, 3747–3751 RSC
- N. Kapuria, M. Conroy, V. A. Lebedev, T. E. Adegoke, Y. Zhang, I. S. Amiinu, U. Bangert, A. Cabot, S. Singh and K. M. Ryan, ACS Nano, 2022, 16, 8917–8927 CrossRef CAS PubMed
- N. Kapuria, N. N. Patil, K. M. Ryan and S. Singh, Nanoscale, 2022, 14, 2885–2914 RSC
- N. Kapuria, U. V. Ghorpade, M. Zubair, M. Mishra, S. Singh and K. M. Ryan, J. Mater. Chem. C, 2020, 8, 13868–13895 RSC
- M. Mishra, N. N. Patil, M. Zubair, N. Kapuria, V. Lebedev, T. E. Adegoke, K. M. Ryan and S. Singh, Nanotechnology, 2022, 33, 305602 CrossRef PubMed
- N. Kapuria, S. Imtiaz, A. Sankaran, H. Geaney, T. Kennedy, S. Singh and K. M. Ryan, Nano Lett., 2022, 22, 10120–10127 CrossRef CAS PubMed
- M. R. Scimeca, N. Mattu, I. J. Paredes, M. N. Tran, S. J. Paul, E. S. Aydil and A. Sahu, J. Phys. Chem. C, 2021, 125, 17556–17564 CrossRef CAS
- M. W. Kim, Y. Yuan, S. Jeong, J. Chong, H. Mølnås, A. Alaei, I. J. Cleveland, N. Liu, Y. Ma and S. Strauf, Adv. Funct. Mater., 2022, 32, 2207326 CrossRef CAS
- O. O. Otelaja, D. H. Ha, T. Ly, H. Zhang and R. D. Robinson, ACS Appl. Mater. Interfaces, 2014, 6, 18911 CrossRef CAS PubMed
- E. A. Hernández-Pagán, E. H. Robinson, A. D. La Croix and J. E. Macdonald, Chem. Mater., 2019, 31, 4619–4624 CrossRef
- J. Macdonald, E. Hernandez-Pagan, E. Robinson, J. Rhodes, Y. Zhao and J. Veglak, Organochalcogenide reagents for the phase control of transition metal sulphides and selenides, Abstracts of Papers of the American Chemical Society, 1155 16th St NW, Washington, DC 20036, USA, American Chemical Society, 2019, vol. 258 Search PubMed.
- A. M. Medina-Gonzalez, B. A. Rosales, U. H. Hamdeh, M. G. Panthani and J. Vela, Chem. Mater., 2020, 32, 6085–6096 CrossRef CAS
- B. A. Rosales, M. A. White and J. Vela, J. Am. Chem. Soc., 2018, 140, 3736–3742 CrossRef CAS PubMed
- E. Tavasoli, Y. Guo, P. Kunal, J. Grajeda, A. Gerber and J. Vela, Chem. Mater., 2012, 24, 4231–4241 CrossRef CAS
- S. Xiong, Z. Liu, H. Rong, H. Wang, M. McDaniel and H. Chen, Sci. Rep., 2018, 8, 1–7 CAS
- C. Pompe and A. Pfitzner, Z. Anorg. Allg. Chem., 2012, 638, 2158–2162 CrossRef CAS
- V. Bazakutsa, N. Gnidash, A. Kul'Chitskaya and A. Salov, Soviet Phys. J., 1975, 18, 472–475 CrossRef
- W.-C. Sun, S. U. Rahayu and M.-W. Lee, IEEE J. Photovolt., 2018, 8, 1011–1016 Search PubMed
- S. U. Rahayu, C.-L. Chou, N. Suriyawong, B. A. Aragaw, J.-B. Shi and M.-W. Lee, APL Mater., 2016, 4, 116103 CrossRef
- W. W. Leung, C. N. Savory, R. G. Palgrave and D. O. Scanlon, J. Mater. Chem. C, 2019, 7, 2059–2067 RSC
- M. I. Nugraha, H. Kim, B. Sun, M. A. Haque, F. P. G. de Arquer, D. R. Villalva, A. El-Labban, E. H. Sargent, H. N. Alshareef and D. Baran, Adv. Energy Mater., 2019, 9, 1803049 CrossRef
- E. H. Sargent, Nat. Photonics, 2012, 6, 133–135 CrossRef CAS
- H. Li, Q. Li, P. Wen, T. B. Williams, S. Adhikari, C. Dun, C. Lu, D. Itanze, L. Jiang and D. L. Carroll, Adv. Mater., 2018, 30, 1705796 CrossRef PubMed
- G. H. Carey, A. L. Abdelhady, Z. Ning, S. M. Thon, O. M. Bakr and E. H. Sargent, Chem. Rev., 2015, 115, 12732–12763 CrossRef CAS PubMed
- C. Yang, Z. Wang, Y. Wu, Y. Lv, B. Zhou and W.-H. Zhang, ACS Appl. Energy Mater., 2018, 2, 182–186 CrossRef
- J. van Embden and Y. Tachibana, J. Mater. Chem., 2012, 22, 11466 RSC
- J. van Embden, K. Latham, N. W. Duffy and Y. Tachibana, J. Am. Chem. Soc., 2013, 135, 11562 CrossRef CAS PubMed
- M. Zubair, V. A. Lebedev, M. Mishra, T. E. Adegoke, I. S. Amiinu, Y. Zhang, A. Cabot, S. Singh and K. M. Ryan, Chem. Mater., 2022, 34, 10528–10537 CrossRef CAS PubMed
- D. Cadavid, K. Wei, Y. Liu, Y. Zhang, M. Li, A. Genç, T. Berestok, M. Ibáñez, A. Shavel and G. S. Nolas, Materials, 2021, 14, 853 CrossRef CAS PubMed
- C. Coughlan, M. Ibáñez, O. Dobrozhan, A. Singh, A. Cabot and K. M. Ryan, Chem. Rev., 2017, 117, 5865–6109 CrossRef CAS PubMed
- M. Bernechea, N. C. Miller, G. Xercavins, D. So, A. Stavrinadis and G. Konstantatos, Nat. Photonics, 2016, 10, 521–525 CrossRef CAS
- V. Lazarev, A. Salov and S. Berul, Zh. Neorg. Khim., 1979, 24, 563–580 CAS
- S. Kang, Y. Hong and Y. Jeon, Bull. Korean Chem. Soc., 2014, 35, 1887–1890 CrossRef CAS
- Z. Liu, J. Liang, S. Li, S. Peng and Y. Qian, Chem. – Eur. J., 2004, 10, 634–640 CrossRef CAS PubMed
- L. Shi, C. Wu and J. Ding, J. Alloys Compd., 2016, 684, 112–115 CrossRef CAS
- Z. Xia, F.-X. Yu, S.-C. Lu, D.-J. Xue, Y.-S. He, B. Yang, C. Wang, R.-Q. Ding, J. Zhong and J. Tang, Chin. Chem. Lett., 2017, 28, 881–887 CrossRef CAS
- P. C. Harikesh, A. Surendran, B. Ghosh, R. A. John, A. Moorthy, N. Yantara, T. Salim, K. Thirumal, W. L. Leong and S. Mhaisalkar, Adv. Mater., 2020, 32, 1906976 CrossRef CAS PubMed
- A. M. Medina-Gonzalez, P. Yox, Y. Chen, M. A. Adamson, B. A. Rosales, M. Svay, E. A. Smith, R. D. Schaller, K. Wu and A. J. Rossini, Chem. Mater., 2022, 34, 7357–7368 CrossRef CAS
- R. E. Brandt, V. Stevanović, D. S. Ginley and T. Buonassisi, MRS Commun., 2015, 5, 265–275 CrossRef CAS
- M. H. Du, J. Mater. Chem. A, 2014, 2, 9091–9098 RSC
- Z. Wang, Journal, 2000, 104, 1153–1175 CAS
- Y. Kang, J. B. Pyo, X. Ye, R. E. Diaz, T. R. Gordon, E. A. Stach and C. B. Murray, ACS Nano, 2013, 7, 645–653 CrossRef CAS PubMed
- H. Li, D. Chen, L. Li, F. Tang, L. Zhang and J. Ren, CrystEngComm, 2010, 12, 1127–1133 RSC
- W. Bu, Z. Chen, F. Chen and J. Shi, J. Phys. Chem. C, 2009, 113, 12176–12185 CrossRef CAS
- C. R. Bealing, W. J. Baumgardner, J. J. Choi, T. Hanrath and R. G. Hennig, ACS Nano, 2012, 6, 2118–2127 CrossRef CAS PubMed
- C.-Y. Chiu, Y. Li, L. Ruan, X. Ye, C. B. Murray and Y. Huang, Nat. Chem., 2011, 3, 393–399 CrossRef CAS PubMed
- Y. Yin and A. P. Alivisatos, Nature, 2005, 437, 664 CrossRef CAS PubMed
- S. Shen, Y. Zhang, L. Peng, B. Xu, Y. Du, M. Deng, H. Xu and Q. Wang, CrystEngComm, 2011, 13, 4572–4579 RSC
- C. Li, T. Bai, F. Li, L. Wang, X. Wu, L. Yuan, Z. Shi and S. Feng, CrystEngComm, 2013, 15, 597–603 RSC
- K. De Nolf, R. K. Capek, S. Abe, M. Sluydts, Y. Jang, J. C. Martins, S. Cottenier, E. Lifshitz and Z. Hens, J. Am. Chem. Soc., 2015, 137, 2495–2505 CrossRef CAS PubMed
- D. Battaglia and X. Peng, Nano Lett., 2002, 2, 1027–1030 CrossRef CAS
- D. W. Lucey, D. J. MacRae, M. Furis, Y. Sahoo, A. N. Cartwright and P. N. Prasad, Chem. Mater., 2005, 17, 3754–3762 CrossRef CAS
- D. A. Brewster, D. J. Sarappa and K. E. Knowles, Polyhedron, 2019, 157, 54–62 CrossRef CAS
- J. Owen, Science, 2015, 347, 615–616 CrossRef CAS PubMed
- M. Green, J. Organomet. Chem., 1995, 500, 127–148 CrossRef CAS
- V. Zeleňák, Z. Vargová and K. Györyová, Spectrochim. Acta, Part A, 2007, 66, 262–272 CrossRef PubMed
- J. Zhang, H. Zhang, W. Cao, Z. Pang, J. Li, Y. Shu, C. Zhu, X. Kong, L. Wang and X. Peng, J. Am. Chem. Soc., 2019, 141, 15675–15683 CrossRef CAS PubMed
- H. G. Bagaria, E. T. Ada, M. Shamsuzzoha, D. E. Nikles and D. T. Johnson, Langmuir, 2006, 22, 7732–7737 CrossRef CAS PubMed
- E. Sada, H. Kumazawa, I. Hashizume, M. Shimono and T. Sakaki, Ind. Eng. Chem. Res., 1987, 26, 1782–1787 CrossRef CAS
- L. Ran, A. Baktash, M. Li, Y. Yin, B. Demir, T. Lin, M. Li, M. Rana, I. Gentle and L. Wang, Energy Storage Mater., 2021, 40, 282–291 CrossRef
- T. Y. Yang, G. Gregori, N. Pellet, M. Grätzel and J. Maier, Angew. Chem., 2015, 127, 8016–8021 CrossRef
- R. Jalem, B. Gao, H.-K. Tian and Y. Tateyama, J. Mater. Chem. A, 2022, 10, 2235–2248 RSC
- R. Sa, Q. Zhang, Y. Yang and D. Liu, Mater. Res. Bull., 2022, 152, 111862 CrossRef CAS
Footnote |
| † Electronic supplementary information (ESI) available: Additional data of experimental procedure, characterization techniques, size distribution histograms, and XPS of the synthesized nanocrystals. See DOI: https://doi.org/10.1039/d3nh00097d |
| This journal is © The Royal Society of Chemistry 2023 |