Single-atom alloy Ir/Ni catalyst boosts CO2 methanation via mechanochemistry†
Rui
Tu‡
,
Yujie
Zhang‡
,
Yuchun
Xu
,
Junxia
Yang
,
Ling
Zhang
,
Keran
Lv
,
Guoqing
Ren
 ,
Shengliang
Zhai
,
Tie
Yu
,
Shengliang
Zhai
,
Tie
Yu
 * and
Weiqiao
Deng
 *
*
Institute of Molecular Sciences and Engineering, Institute of Frontier and Interdisciplinary Science, Shandong University, Qingdao, Shandong 266237, China. E-mail: dengwq@sdu.edu.cn; yutie043116@tju.edu.cn
First published on 14th March 2023
Abstract
A new catalytic approach is pioneered to achieve CO2 methanation via a single atom alloy Ir/Ni catalyst using a ball-milling method. This Ir/Ni catalyst exhibits a TOFCH4 of 10244 h−1 and a 220 h lifetime at 350 °C without deactivation, illustrating excellent catalytic efficiency in the presence of mechanical energy.
New conceptsThis work achieved the CO2 methanation reaction through a mechanical catalysis method in a ‘gas–gas’ system. The mechanical energy induced by the collision between the vessel and the grinding medium (metal balls) was able to activate reactants under mild conditions using a different rationale compared with thermo-catalysis, electro-catalysis, or photo-catalysis methods, with a higher efficiency of the mechanical energy to stimulate methanation. Mechanical catalysis requires the catalyst to integrate with the grinding medium, and therefore we constructed an atomically dispersed Ir–Ni alloy structure on the surface of Ni balls to simultaneously serve as the grinding medium and catalyst. Single-atom Ir significantly increased the catalytic efficiency, and the Ir–Ni alloy structure greatly inhibited noble metal sintering. The collision between the metal balls or/and vessel removed the deposited coke on the metal surface, and therefore mechanical catalysis greatly increased the catalyst lifetime without deactivation as compared with a fixed-bed reactor. An efficiency comparison between mechanical catalysis and thermo-catalysis methods for CO2 conversion revealed that mechanical energy exhibits the desired catalytic efficiency. This work utilized CO2 methanation as a ‘gas–gas’ model reaction to prove the high catalytic efficiency of the mechanical catalysis approach and pioneers a new direction for single-atom metals as catalysts in mechanochemistry fields. |
Introduction
A shortage of energy is one of the significant challenges for human society, and exploring new resources or recycling wastes that can be used as substitutes for fossil fuels could yield suitable candidates. CO2 is one of the greenhouse gases and is released on a massive scale from exhaust gases. It has been widely studied as an energy-generation scaffold with considerable experimentation to produce methane, syngas, formic acid, hydrocarbons, and other valuable chemicals.1–5 During various conversion routes, CO2 methanation produces CH4 directly as an energy resource. If the H2 could be generated from the photolysis of water, the utilization of green H2 during the CO2 methanation reaction presents an unprecedented technological advantage in this specific area.In 1902, Paul Sabatier and Jean-Baptiste Senderens discovered CO and CO2 methanation.6,7 After a century of development, CO2 methanation mechanistic studies and catalyst R&D have sufficiently advanced so that industrialization of this technology is the next step. There have been many catalysts utilized to increase the CH4 production efficiency, including noble metal catalysts (Ru, Rh, and Pd)8–10 and transition metal catalysts (Co, Fe, and Ni).11–13 There has been intensive research on Ni catalysts due to their low cost and high activity under high temperature. However, Ni catalysts present low CO2 conversion at low temperatures, while the high reaction temperature during methanation causes catalyst deactivation during metal sintering and carbon deposition, along with low energy efficiency.14
To improve the application potential of Ni-based catalysts, additional metallic elements are normally employed as promoters, and the strong interaction between various metal alloy structures increases the catalytic activity and stability. Previously reported metal promotors include Co, Fe, Ru, Rh, Pt, Pd, and Re in Ni–M bimetallic catalysts.15 In addition to their promoter action, the catalyst carrier also exhibits a significant effect on CO2 activation during the methanation process.13,16–18 Therefore, constructing an alloy structure for an active metal to determine the optimal support for CO2 adsorption and activation are considered in this study to explore an efficient methanation catalyst.
Except for the catalyst design, this work pioneers a new approach for the mechanical catalysis method to be applied in increasing CO2 methanation efficiency in the presence of mechanical energy. Mechanical catalysis utilizes mechanical energy from the collision between milling balls and vessel to induce the catalytic reaction, and the collision pattern includes friction, shearing, and collision between two mediums. Mechanocatalysis has been considered as one of the top ten emerging technologies in chemistry, and a previous mechanocatalysis method was utilized to achieve C–N and C–C cross-coupling, cycloaddition, polymer reaction, and C–H activation in previously reported ‘solid–solid’ systems.19,20 Recently, the mechanical catalysis method was successfully applied to synthesize ammonia from N2 and H2, and the reports noted that the efficiency was greater when mechanical energy was used to activate N2, with this method greatly moderating the reaction conditions in the batch reaction system.21,22
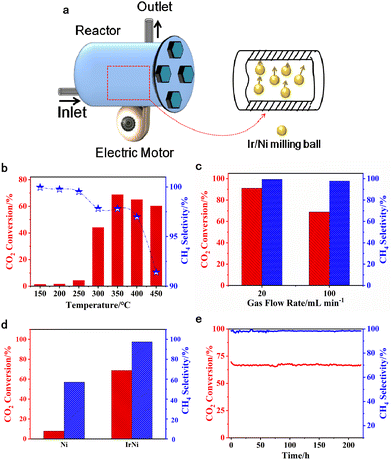
Consequently, we utilized a custom-built vibration reactor (Fig. 1a) to explore mechanical reactions in a continuous gas flow. The active metal species was loaded on metallic milling balls, which simultaneously acted as the catalyst and collision medium. The mechanical energy is produced from the collision between the milling balls and the reactor inner wall, which occurs with a vertical motion. The collision frequency is regulated by the electric motor under the vibration reactor.
Because decreasing the active metal size, especially the atomic dispersion, boosts its catalytic activity,23–27 iridium (Ir) was impregnated on Ni metal balls to form a single atomic alloy structure in this work. The optimum reaction conditions were firstly investigated to maximize the CH4 yield, and the Ir distribution and charge were also estimated to understand the bulk structure of the Ir/Ni catalyst. Additionally, the catalytic stability was examined, and a mechanistic study was undertaken to propose a plausible rationale for CO2 methanation under mechanical catalysis conditions.
Results and discussion
Fig. 1 shows the methanation performance over Ni and Ir/Ni catalysts. Fig. 1b presents the methanation performance from 150–450 °C over the Ir/Ni catalyst, and the desired CO2 conversion was achieved at 350 °C and began to decrease above 350 °C. Because CO2 methanation is a thermodynamically unfavorable process, the higher temperature inhibited an increase in CO2 conversion. Additionally, the CH4 selectivity in effluent decreased with the increasing reaction temperature due to the formation of CO as byproduct, and the reason for this might be the occurrence of a reverse water–gas reaction at high temperatures (CO2 + H2 = H2O + CO).With respect to CO formation, the chromatograph spectra detected the CO in the product, and it increased from 150 to 450 °C. In addition, increasing the space velocity decreased the CO2 conversion and the CH4 selectivity at 350 °C and 800 rpm, as shown in Fig. 1c. The Ir doping significantly increased the CO2 conversion from 8% to 69%, and the CH4 selectivity rose from 57% to 98%, as shown in Fig. 1d. It was more intriguing to improve the CH4 selectivity and inhibit CO generation on Ir/Ni, illustrating the modification of the reaction pathway due to the presence of Ir. Finally, a stability test of CO2 methanation over Ir/Ni was conducted at 350 °C, 800 rpm, and 100 mL min−1 inlets. The CO2 conversion and CH4 selectivity were maintained at 64% and 98%, respectively, over 220 h in Fig. 1(e), indicating the superior stability of Ir/Ni for CO2 methanation.
As a control experiment, an Ir–Ni/Al2O3 catalyst (0.5 wt% for Ir loading, and 10 wt% for Ni loading) was also synthesized by an impregnation method, and its lifetime test is shown in Fig. S1 (ESI†). It only presented 34% CO2 conversion and 99% CH4 selectivity, while the reactivity continuously decreased with time on stream. Fig. S2 (ESI†) compares some representative catalysts and their methanation performance over the past few decades. The Ir/Ni catalyst exhibited excellent reactivity and stability through the mechanical catalysis method at a moderate temperature range.
Fig. 2 shows the appearance of Ir/Ni and Ir–Ni/Al2O3 milling balls. Fresh Ir–Ni/Al2O3 presents with a cyan color in Fig. 2c, which turned to black after CO2 methanation, as shown in Fig. 2d. The color variation was mainly induced by Ni2+ reduction and coke during the reaction process, and the 3.5% weight loss above 400 °C from the thermogravimetric (TG) profiles in Fig. S3 (ESI†) proved the coke formation. Nevertheless, the Ir/Ni catalysts did not significantly change before or after the reaction (Fig. 2a and b). Also, no coke was detected on the Ir/Ni metal surface, which implied the complete dissociation of CO2 into C atoms or inhibition of other coke-generation reactions over the Ir/Ni catalyst in contrast to metal oxide catalysts.
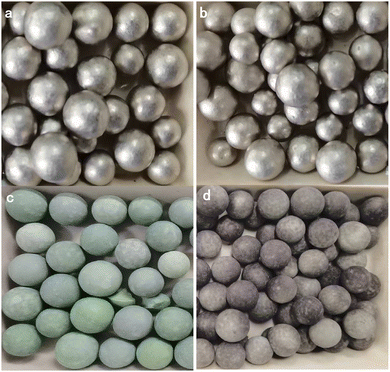 | ||
| Fig. 2 Appearance of (a) fresh and (b) used Ir/Ni. Appearance of (c) fresh and (d) used Ir–Ni/Al2O3 catalysts. | ||
The scanning electron microscopy (SEM) images in Fig. 3 reveal the morphology of the Ir/Ni metal surface. The fresh Ir/Ni surface was uniform and flat in Fig. 3a and b, but the surface became slightly rough and compact after 220 h of reaction, as shown in Fig. 3c and d. Moreover, many small holes existed on the pristine Ni metal surface that were maintained after calcination and reaction, and they increased the surface defects. The element mapping spectra for the metal surface (Fig. 3e–l) were further used to analyze the metal dispersion. For a fresh Ir/Ni sample, C, O, and Ni were uniformly distributed, and no Ir signal was recorded (Fig. 3e–h), which was caused by its low loading and a signal that was too weak for adequate dispersion. For the used Ir/Ni sample, the surface atom dispersion did not change after 220 h of reaction (Fig. 3i–l), proving that no metal sintering or aggregation occurred during the reaction process. The surface morphology change might be induced by the preparation process and mechanical collision during the reaction process. In the Supplementary Information, an additional energy dispersive X-ray spectroscopy (EDS) spectrum of the raised particle on the metal surface is shown in Fig. S4 (ESI†), and only Ni, O, and C were recorded. Therefore, there was no relationship between the distortion of the metal surface and the Ir sintering.
 | ||
| Fig. 3 SEM images of (a and b) fresh and (c and d) used Ir/Ni metal surfaces. Elements mapping spectra of (e)–(h) fresh Ir/Ni and (i)–(l) used Ir/Ni samples. | ||
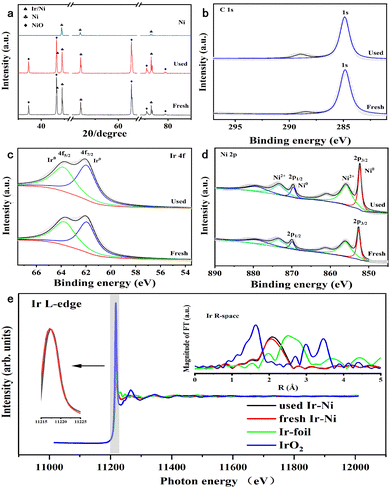
The X-ray diffraction (XRD) pattern in Fig. 4a revealed that the Ni metal only presented peaks for the Ni fcc structure. After Ir loading, the Ni and NiO phase were detected, and no Ir or IrO2 phases were recorded. The new shoulder peaks appearing over the Ir/Ni sample at 43° were assigned to the Ir–Ni alloy.28 The partial NiO phase indicated that the annealing treatment during the preparation process was not able to completely reduce the surface metal elements. In addition, the characteristic peaks of the used Ir/Ni catalyst were identical to those of the fresh Ir/Ni catalyst without change, which illustrated the catalytic stability.
X-ray photoelectron spectroscopy (XPS) was used to investigate the valence state of the metallic elements on the metal surface of the Ir/Ni catalyst before and after the reaction. In Fig. 4d, the surface Ni exhibited reduced Ni0 and oxidative Ni2+ states, and their molar ratio (Ni0/Ni2+) equaled 1 from the peak-fitting results. This was also supported by the NiO phase from the XRD results. The Ir 5f spectra in Fig. 4c only presented reduced Ir0 species, while the Ir 5f binding energy (61.9 eV) shifted to a higher binding energy direction, implying the electron deficiency on Ir atoms.29 It should be noted that in the O 1s XPS spectra in Fig. S5 (ESI†), the Ni and Ir valence states on the metal surface of the used Ir/Ni catalyst did not change, confirming that the Ir–Ni structure was intact during the methanation reaction. In Fig. 4b, no new carbide species were found from the C 1s spectrum after comparison of the fresh and used Ir/Ni samples, which was consistent with the above result demonstrating no coke generation on the Ir/Ni catalyst.
The X-ray absorption near-edge spectroscopy (XANES) and extended X-ray absorption fine structure (EXAFS) were measured to examine the coordination structure of Ir species on the Ir/Ni catalyst, as shown in Fig. 4e. The intensity of the white line represents the charge of the Ir species, and the increasing intensity denotes the charge increase. The white line intensity for the Ir/Ni catalyst was between that of Ir foil and IrO2, but similar to that of Ir foil, which illustrates that the Ir charge was near 0, but presented an electron-deficient state.
The Fourier transform spectra of EXAFS in R-space exhibited a primary peak at 2.12 Å, which was assigned to the Ir–Ni alloy structure because this coordination path was clearly different with Ir–Ir from Ir foil or Ir–O from IrO2. Additionally, the EXAFS spectra also proved that there was no existence of Ir particles over the Ir/Ni metal surface. The profile fitting results in R-space demonstrated that the Ir coordination number was 6 for the Ir–Ni band in Table S1 (ESI†), which further proved the formation of atomically dispersed Ir species on the Ni surface. Compared with the fresh Ir/Ni catalyst, the used Ir/Ni sample presented the identical Ir XANES spectra, and their profiles almost overlapped. The Ir–Ni coordination path in the FT EXAFS spectra was the same, implying that the Ir–Ni structure was intact during the CO2 methanation reaction.
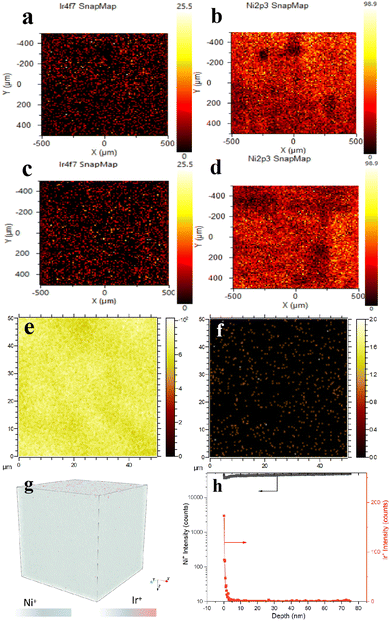
Because the Ir/Ni milling ball in this work is in a pure metallic phase and too thick, the XPS element mapping spectra in Fig. 5 presented its advantages in examining the surface atom dispersion. The element mapping spectra in Fig. 5a demonstrated that the doped Ir atoms were well dispersed on the Ni metal surface, and no Ir particles were detected in the scanning area. The mapping spectra for the used Ir/Ni catalyst shown in Fig. 5c and d presented identical results, consisting of well-dispersed Ir species and a Ni substrate that illustrated no detected change in the Ir/Ni structure during the CO2 methanation process.
Time-of-flight secondary ion mass spectrometry (TOF-SIMS) is a sensitive surface analytical technique that can be adequately used to reflect Ir spatial localization on the Ni substrate. Fig. 5e–h revealed that Ir was well dispersed on the surface of the Ni substrate without aggregation, and the distribution depth of Ir from 0–3 nm was induced by the rough geometry of the Ni surface, as shown in Fig. S6 (ESI†). The spent Ir/Ni sample presented an Ir dispersion that was identical to that of the fresh Ir/Ni sample in Fig. S7 (ESI†), which proved the intact Ir/Ni structure. Fig. 4 combines the XRD and XANES results for Ir distribution, and it was identified that only atomically dispersed Ir species were formed on the Ir/Ni catalyst.
Fig. 6 presents the CO2 + H2 diffuse reflectance infrared Fourier transform spectroscopy (DRIFTS) results over the Ni and Ir/Ni catalysts. Prior to this test, the CO2 adsorption behavior over those two samples was estimated using DRIFTS, as shown in Fig. S8a and b (ESI†). Characteristic peaks after CO2 adsorption appeared in three regions: 1300–1800 cm−1, 2200–2400 cm−1, and 3500–3800 cm−1, which were ascribed to carbonate/formate-like species,30–32 gaseous absorbed CO2 species, and hydrogen carbonates/hydroxyls, respectively.31,33 Notably, the identical DRIFTS results for CO2 adsorption in Fig. S8a and b (ESI†) over two samples demonstrated that the doped Ir species exhibited inferior CO2 adsorption ability, and Ni was the main CO2 adsorption site. Nevertheless, when CO2 + H2 was introduced onto the catalysts, the Ir/Ni catalyst presented many more carbonates and formate species than the Ni catalyst, as shown in Fig. 6, and the corresponding peak intensities greatly strengthened. (The remainder of the DRIFTS results is shown in Fig. S8c and d, ESI.†)
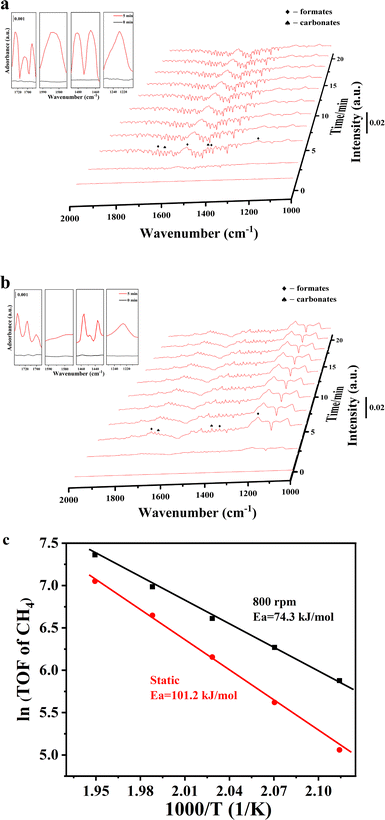 | ||
| Fig. 6 In situ DRIFTS studies of CO2 + H2 over (a) Ir/Ni and (b) Ni catalysts under 150 °C. (c) The apparent activation energy from a kinetic activity test. | ||
Specifically, the peaks at 1130, 1361, and 1735 cm−1 in Fig. 6a were assigned to formate species, and the peak at 1530 cm−1 belongs to the O–C–O asymmetric vibration in formate species.30,31 The peaks at 1653 and 1434 cm−1 were ascribed to carbonate species.32 It has been documented that monodenate carbonates are easily hydrogenated into formate species during the CO2 methanation process, and therefore, additional formate species were recorded on the Ir/Ni catalyst as compared to carbonate species. In addition, no adsorbed CO species were detected at 1900–2000 cm−1 in Fig. 6, which indicates that the CO route was not the dominant reaction pathway for CH4 generation and explained the lower CO selectivity in this work. It was concluded that formate species were the main intermediates for CO2 methanation over the Ir/Ni catalyst, and Ir–Ni possessed much higher reactivity than Ni for CO2 activation and its subsequent hydrogenation process.
To boost the impact of mechanical energy on the CO2 methanation reaction, kinetic experiments under static mode and vibration mode (800 rpm) were performed, and are shown in Fig. 6c. The Ir/Ni catalyst under the mechanical catalysis method exhibited higher reaction rates as compared to the thermo-catalysis method. The lower apparent activation energy of mechanical catalysis implied that the addition of mechanical energy introduced variation into the methanation rationale and enhanced the CO2 conversion efficiency.
The heating effect induced by the mechanical collision between milling balls and vessel is examined in Fig. S9 (ESI†). The slight temperature change demonstrated that the heating effect was not the main mechanical energy transformation pattern. Additionally, the collisional electric charge on the Ir/Ni and Ni balls after collision with steel plates in Fig. S10 and S11 (ESI†) revealed that the doped Ir species greatly increased the electric charge on the Ir/Ni balls as compared with Ni balls, which probably boosted CO2 activation and energy transformation from mechanical collision into reactant conversion.
The energy consumption under static mode and vibration mode (800 rpm) was also measured by an electricity meter. Under 350 °C, CO2 methanation under vibration mode and static mode consumed 0.137 kW h and 0.140 kW h energy, respectively. The additional energy consumption from the mechanical vibration was 1.4%, while the obvious improvement in the CO2 conversion rates as shown in Fig. 6c proved the high catalytic efficiency of mechanical energy during this reaction process. Further studies on mechanistic research and energy transformation patterns would greatly promote the application of this technology for catalytic conversion between energy molecules.
Conclusions
The Ir/Ni single atom alloy catalyst was prepared by an impregnation method and utilized for CO2 methanation through a mechanical catalysis method. The reaction activity showed that the Ir/Ni catalyst exhibited a superior CO2 conversion rate and state-of-the-art reaction stability. The bulk characterization results proved that Ir was atomically dispersed and coordinated with surface Ni atoms in the form of an Ir–Ni alloy, and reduced Ir0 species presented an electron-efficient state. The Ni atoms on the metal surface possessed reduced Ni0 and oxidative Ni2+ states at the same time. The Ni sites were the main CO2 adsorption sites, and an Ir–Ni alloy was the reaction site for H2 activation and the subsequent hydrogenation reaction. After 220 h of reaction, the Ir/Ni catalyst exhibited identical surface atom distribution and valence states, and the stable Ir–Ni alloy structure enabled its long lifetime. Compared with the oxide-supported Ir–Ni/Al2O3 catalyst, the Ir/Ni catalyst exhibited excellent coke-resistant performance, and the mechanochemical catalysis method effectively boosted the reaction efficiency with the addition of mechanical energy.Author contributions
T. R. and Z. Y. J. designed the experiments, analyzed the data, and wrote the manuscript. Y. J. X. and X. Y. C conducted the XRD, XPS, and XANES analyses. Z. L. and Z. S. L. performed the DRIFTS experiments. L. K. R. integrated the studies, and reviewed and edited the manuscript. Y. T. conceived the idea, planned and directed the studies, and wrote the manuscript. D. W. Q. oversaw the project. All authors confirmed the data in the manuscript.Conflicts of interest
The authors declare no conflicts of interest.Acknowledgements
This work was supported by the National Key Research and Development Program of China (No. 2022YFA1503104, 2017YFA0204800), Natural Science Foundation of Shandong Province (ZR2020QB056), the Fundamental Research Funds of Shandong University (No. 2019GN111), Research Funding from Suzhou Institute of Nano-Tach and Nano-Bionics (No. D22005), and the Shandong University Future Program for Young Scholars (No. 62460082064083, No. 62460082164128). The authors thanks for the help from Wind-sand Electrical Mechanism Research Laboratory, Institute of Civil Engineering and Mechanics, Lanzhou University for the collisional charge tests. The authors also thank Xiaoju Li and Haiyan Sui from the Shandong University Core Facilities for Life and Environmental Sciences for their assistance with the TEM.Notes and references
- A. I. Osman, M. Hefny, M. I. A. Abdel Maksoud, A. M. Elgarahy and D. W. Rooney, Environ. Chem. Lett., 2021, 19, 797–849 CrossRef CAS.
- J. Long, S. Chen, Y. Zhang, C. Guo, X. Fu, D. Deng and J. Xiao, Angew. Chem., Int. Ed., 2020, 59, 9711–9718 CrossRef CAS PubMed.
- T. A. Atsbha, T. Yoon, P. Seongho and C. J. Lee, J. CO2 Util., 2021, 44, 101413–101434 CrossRef CAS.
- W. Wang, S. Wang, X. Ma and J. Gong, Chem. Soc. Rev., 2011, 40, 3703–3727 RSC.
- G. Tian, C. Zhang and F. Wei, Nanoscale Horiz., 2022, 7, 1478–1487 RSC.
- S. Roensch, J. Schneider, S. Matthischke, M. Schlueter, M. Goetz, J. Lefebvre, P. Prabhakaran and S. Bajohr, Fuel, 2016, 166, 276–296 CrossRef CAS.
- M. Thema, F. Bauer and M. Sterner, Renewable Sustainable Energy Rev., 2019, 112, 775–787 CrossRef CAS.
- A. Beuls, C. Swalus, M. Jacquemin, G. Heyen, A. Karelovic and P. Ruiz, Appl. Catal., B, 2012, 113–114, 2–10 CrossRef CAS.
- G. Garbarino, D. Bellotti, P. Riani, L. Magistri and G. Busca, Int. J. Hydrogen Energy, 2015, 40, 9171–9182 CrossRef CAS.
- C. Yan, C. H. Wang, M. Lin, D. Bhalothia, S. S. Yang, G. J. Fan, J. L. Wang, T. S. Chan, Y. L. Wang, X. Tu, S. Dai, K. W. Wang, J. H. He and T. Y. Chen, J. Mater. Chem. A, 2020, 8, 12744 RSC.
- H. Kierzkowska-Pawlak, J. Tyczkowski, J. Balcerzak and P. Tracz, Catal. Today, 2019, 337, 162–170 CrossRef CAS.
- J. Kirchner, C. Zambrzycki, S. Kureti and R. Güttel, Chem. Ing. Tech., 2020, 92, 603–607 CrossRef CAS.
- K. Ray and G. Deo, Appl. Catal., B, 2017, 218, 525–537 CrossRef CAS.
- S. Rönsch, J. Schneider, S. Matthischke, M. Schlüter, M. Götz, J. Lefebvre, P. Prabhakaran and S. Bajohr, Fuel, 2016, 166, 276–296 CrossRef.
- A. I. Tsiotsias, N. D. Charisiou, I. V. Yentekakis and M. A. Goula, Nanomaterials, 2021, 11, 28 CrossRef CAS PubMed.
- P. Panagiotopoulou, Appl. Catal., A, 2017, 542, 63–70 CrossRef CAS.
- X. Jia, X. Zhang, N. Rui, X. Hu and C. J. Liu, Appl. Catal., B, 2019, 244, 159–169 CrossRef CAS.
- S. Renda, A. Ricca and V. Palma, Int. J. Hydrogen Energy, 2021, 46, 12117–12127 CrossRef CAS.
- S. Hwang, S. Graetz and L. Borchardt, Chem. Commun., 2022, 58, 1661–1671 RSC.
- F. R. Fan, S. Xie, G. W. Wang and Z. Q. Tian, Sci. China: Chem., 2021, 64, 1609–1613 CrossRef CAS.
- G. F. Han, F. Li, Z. W. Chen, C. Coppex, S. J. Kim, H. J. Noh, Z. Fu, Y. Lu, C. V. Singh, S. Siahrostami, Q. Jiang and J. B. Baek, Nat. Nanotechnol., 2021, 16, 325–330 CrossRef CAS PubMed.
- S. Reichle, M. Felderhoff and F. Schüth, Angew. Chem., Int. Ed., 2021, 60, 26385–26389 CrossRef CAS PubMed.
- Z. Zhang, C. Shen, K. Sun, X. Jia, J. Ye and C. J. Liu, Mater. Chem. A, 2022, 10, 5792–5812 RSC.
- B. Chang, S. Wu, Y. Wang, T. Sun and Z. Cheng, Nanoscale Horiz., 2022, 7, 1340–1387 RSC.
- Z. Kou, W. Zang, P. Wang, X. Li and J. Wang, Nanoscale Horiz., 2020, 5, 757–764 RSC.
- R. T. Hannagan, G. Giannakakis, R. Reocreux, J. Schumann, J. Finzel, Y. C. Wang, A. Michaelides, P. Deshlahra, P. Christopher, M. Flytzani-Stephanopoulos, M. Stamatakis and E. C. H. Sykes, Science, 2021, 372, 1444 CrossRef CAS.
- G. Kyriakou, M. B. Boucher, A. D. Jewell, E. A. Lewis, T. J. Lawton, A. E. Baber, H. L. Tierney, M. Flytzani-Stephanopoulos and E. C. H. Sykes, Science, 2012, 335, 1209 CrossRef CAS PubMed.
- K. Sasaki, K. A. Kuttiyiel, L. Barrio, D. Su, A. I. Frenkel, N. Marinkovic, D. Mahajan and R. R. Adzic, J. Phys. Chem. C, 2011, 115, 9894–9902 CrossRef CAS.
- J. Park, S. Choi, A. Oh, H. Jin, J. Joo, H. Baik and K. Lee, Nanoscale Horiz., 2019, 4, 727–734 RSC.
- Y. H. Lee, J. Y. Ahn, D. D. Nguyen, S. W. Chang, S. S. Kim and S. M. Lee, RSC Adv., 2021, 11, 17648–17657 RSC.
- Q. Pan, J. Peng, S. Wang and S. Wang, Catal. Sci. Technol., 2014, 4, 502–509 RSC.
- Q. Pan, J. Peng, T. Sun, S. Wang and S. Wang, Catal. Commun., 2014, 45, 74–78 CrossRef CAS.
- P. A. U. Aldana, F. Ocampo, K. Kobl, B. Louis, F. Thibault-Starzyk, M. Daturi, P. Bazin, S. Thomas and A. C. Roger, Catal. Today, 2013, 215, 201–207 CrossRef CAS.
Footnotes |
| † Electronic supplementary information (ESI) available: Experimental details, SEM, TEM, XPS, TG, Electrochemical performance, Computations. See DOI: https://doi.org/10.1039/d3nh00040k |
| ‡ These authors contributed equally to this work. |
| This journal is © The Royal Society of Chemistry 2023 |

