
Plasma extracellular vesicle phenotyping for the differentiation of early-stage lung cancer and benign lung diseases†
Liwen
Yuan‡
a,
Yanpin
Chen‡
b,
Longfeng
Ke
c,
Quan
Zhou
 d,
Jiayou
Chen
e,
Min
Fan
a,
Alain
Wuethrich
*d,
Matt
Trau
*df and
Jing
Wang
*a
d,
Jiayou
Chen
e,
Min
Fan
a,
Alain
Wuethrich
*d,
Matt
Trau
*df and
Jing
Wang
*a
aKey Laboratory of OptoElectronic Science and Technology for Medicine of Ministry of Education, Fujian Provincial Key Laboratory of Photonics Technology, Fujian Normal University, Fuzhou 350117, China. E-mail: jing.wang@fjnu.edu.cn
bDepartment of Pathology, Clinical Oncology School of Fujian Medical University, and Fujian Cancer Hospital, Fuzhou, Fujian 350014, China
cLaboratory of Molecular Pathology, Clinical Oncology School of Fujian Medical University and Fujian Cancer Hospital, Fuzhou, Fujian 350014, China
dCentre for Personalized Nanomedicine, Australian Institute for Bioengineering and Nanotechnology (AIBN), The University of Queensland, Brisbane, QLD 4072, Australia. E-mail: a.wuethrich@uq.edu.au; m.trau@uq.edu.au
eDepartment of Radiology, Clinical Oncology School of Fujian Medical University and Fujian Cancer Hospital, Fuzhou, Fujian 350014, China
fSchool of Chemistry and Molecular Biosciences, The University of Queensland, Brisbane, QLD 4072, Australia
First published on 16th March 2023
Abstract
The development of a minimally invasive technique for early-stage lung cancer detection is crucial to reducing mortality. Phenotyping of tumor-associated extracellular vesicles (EVs) has the potential for early-stage lung cancer detection, yet remains challenging due to the lack of sensitive, integrated techniques that can accurately detect rare tumor-associated EV populations in blood. Here, we integrated gold core–silver shell nanoparticles and nanoscopic mixing in a microfluidic assay for sensitive phenotypic analysis of EVs directly in plasma without EV pre-isolation. The assay enabled multiplex detection of lung cancer-associated markers PTX3 and THBS1 and canonical EV marker CD63 by surface-enhanced Raman spectroscopy, providing a squared correlation coefficient of 0.97 in the range of 103–107 EVs mL−1 and a limit of detection of 19 EVs mL−1. Significantly, our machine learning-based nanostrategy provided 92.3% sensitivity and 100% specificity in differentiating early-stage lung cancer from benign lung diseases, superior to the CT scan-based lung cancer diagnosis (92.3% sensitivity and 71.4% specificity). Overall, our integrated nanostrategy achieved an AUC value of 0.978 in differentiating between early-stage lung cancer patients (n = 28) and controls consisting of patients with benign lung diseases (n = 23) and healthy controls (n = 26), which showed remarkable diagnostic performance and great clinical potential for detecting the early occurrence of lung cancer.
New conceptsA nanostrategy that combines bright core–shell-nanostructured surface-enhanced Raman scattering probes, a nanomixing chip, and machine learning was proposed for the direct readout of trace populations of tumor-associated extracellular vesicles (EVs) for early lung cancer detection. This nanostrategy enabled the direct detection of EVs from clinical plasma samples without pre-isolation and enrichment of EVs in a miniaturized chip. In a head-to-head comparison against clinical computed tomography (CT), our nanostrategy correctly differentiated early malignant and benign nodules without requiring invasive bronchoscopy which is frequently used to confirm diagnosis after an initial CT scan. The generated EV phenotypes of patients revealed intrapatient heterogeneity that could potentially assist in accurate early lung cancer screening and treatment selection. |
1. Introduction
Lung cancer is one of the most common forms of cancers and the leading cause of cancer-related deaths worldwide.1,2 Despite significant advances in tumor management in recent years, lung cancer still has a high mortality rate because most patients are diagnosed at advanced stages (stage III/IV).3 Early diagnosis of lung cancer when the tumor is small and typically asymptomatic could significantly reduce mortality.4 Low-dose computed tomography (LDCT) is the only recommended screening for lung cancer, but can only provide limited information (e.g., size and opacity) of the lung tissue. Furthermore, LDCT is challenging to assess if a nodule is malignant or benign, which has led to a high number of false positives. To confirm the initial LDCT finding, additional testing based on invasive tissue sampling is required, which has substantial risks for patients. Thus, developing a blood-based assay for early-stage lung cancer detection, particularly with the capability of differentiating benign from malignant lung diseases is to date an unmet clinical need.Tumor-associated extracellular vesicles (EVs) could serve as blood markers for cancer detection.5–9 Tumor-associated EVs are secreted into the bloodstream by all cancer cells within tumors and can be minimal-invasively sampled by blood collection. The biological component of tumor-associated EVs has been shown to reflect the cell of origin, rendering EV phenotyping promising for early lung cancer detection.10 However, EV phenotypic characterization via conventional methods is lengthy and requires large amounts of samples, which limits its further clinical applications. Additionally, the amount of tumor-associated EVs in circulation might be extremely low when the tumor is small and localized to one area; therefore, a sensitive platform is essential for early lung cancer detection.
To enable sensitive phenotypic characterization of tumor-associated EVs in plasma, we used antibody-conjugated and Raman reporter-embedded gold core–silver shell nanoparticles (Au@Ra@Ag NPs) for EV labeling, combined with a nanomixing chip for enhanced antibody–antigen interaction. Au@Ra@Ag NPs exhibited strong and stable surface-enhanced Raman spectroscopy (SERS) signals due to the enhanced electromagnetic field and the shell protection (minimizing reporter detachment and signal interferences from nontargets in complex plasma samples), respectively.11,12 The circulating nanomixing forces increased the collision frequency of EVs and Au@Ra@Ag NPs, while shearing off the non-specific binding towards the chip surface.13 In combination with spherical Au NPs as SERS labels, this nanomixing chip has been previously applied to differentiate serum EV phenotypes between early-stage melanoma patients and healthy controls.5
In addition to the challenge of sensitive EV phenotyping, the differentiation between early-stage lung cancer and benign lung diseases might be more challenging given the lack of clinically validated lung cancer-specific EV markers. Machine learning has attracted extensive attention for biomedical applications because it can classify large and complicated data based on patterns that are otherwise not easily recognizable. A typical example includes the application of machine learning to extract the RNA signature of EVs for cancer diagnosis.14 To enable the accurate recognition of subtle differences between cancer and benign diseases, different machine learning algorithms were tested and applied to maximize the separation between early-stage lung cancer and benign lung diseases and to provide an objective cancer diagnosis that is less likely to be biased by subjective factors. These machine learning algorithms included linear discriminant analysis (LDA), partial least squares-discriminant analysis (PLS-DA), support vector machine (SVM), multiple logistic regression (MLR), and K-nearest neighbors (KNN).
Herein, we set out to evaluate the clinical performance of our EV phenotyping nanostrategy—combining Au@Ra@Ag NPs, a nanomixing chip, and machine learning—for differentiating early-stage lung cancer and benign lung diseases, without EV isolation and purification. We strategically sought to characterize two reported protein markers on the plasma EV surface, including long pentraxin-3 (PTX3) and thrombospondin 1 (THBS1). Particularly, PTX3 and THBS1 were identified as potential markers for lung cancer diagnosis given their higher levels in plasma or EVs derived from lung cancer patients and healthy controls.15–18 As recommended by the International Society for Extracellular Vesicles (ISEV),19 CD63 as one of the most common EV markers was used to confirm the specific capture of EVs. We did not use CD63 as the capture biomarker given that CD63 is widely expressed in EVs derived from normal cells, which might saturate chips with non-target EVs. The nanostrategy was tested in a clinical cohort composed of 28 early-stage lung cancer patients, 23 patients with benign lung diseases, and 26 healthy controls. A head-to-head comparison of our nanostrategy against CT scans was performed in patients with early malignant and benign nodules.
2. Results and discussion
2.1. Core–shell nanoparticle characterization
To enable sensitive target detection, Au@Ra@Ag NPs were synthesized and used as SERS nanotags for enhanced signal readouts. As indicated in Fig. 1(A), Raman reporters served as anchors for the deposition of Ag atoms around the surface of Au cores. To confirm the successful synthesis of Au@Ra@Ag NPs, energy dispersive spectroscopy (EDS), UV-vis spectrometry, and transmission electron microscopy (TEM), were applied for characterization. The EDS analysis in Fig. 1(B) indicated the spatial distribution of elements Au (from the Au core), S (from the embedded Raman reporter molecule), and Ag (from the Ag shell), indicating the successful embedding of Raman reporters between the Au core and Ag shell. We further characterized the localized surface plasmon resonance (LSPR) bands of Au NPs, Au NPs with Raman reporters (Au@Ra NPs), and Au@Ra NPs with Ag shells (Au@Ra@Ag NPs) (Fig. 1(C)). We found that the conjugation of 2-mercapto-4-methyl-5-thiazoleacetic acid (MMTAA) Raman reporters to Au NP surfaces resulted in a slight blueshift and an increase in absorbance at high wavelengths (650–700 nm). In contrast, neither a blueshift nor the appearance of new LSPR bands were observed after Au NP surface modification with 4-mercaptobenzoic acid (MBA) and 2,3,5,6-tetrafluoro-4-MBA (TFMBA) reporters. Compared to Au@Ra NPs, a blueshift of LSPR and new LSPR peaks at 378-398 nm were further observed in the UV-vis spectra of Au@Ra@Ag NPs (Fig. 1(C)), suggesting the formation of Ag shells.20 Representative TEM images showed the core–shell nanostructure of Au@TFMBA@Ag NPs (Fig. 1(D)). To investigate the thickness of Ag shells, we performed nanoparticle tracking analysis (NTA) before and after Ag coating. The size distributions of Au@TFMBA and Au@TFMBA@Ag NPs are shown in Fig. S1 (ESI†), with average diameters of 34.4 ± 0.4 and 37.4 ± 0.1 nm, respectively. The thickness of Ag shells was thus about 3 nm, which was consistent with the EDS mapping (Fig. 1(B)) and the TEM image (Fig. 1(D)). It has been previously reported that SERS signals will increase with the thickness of Ag layers.21,22 Compared to Au@TFMBA NPs, Au@TFMBA@Ag NPs generated 3–4 times stronger Raman signals due to a plasmonic coupling effect (Fig. 1(E)), which was essential for the sensitive detection of tumor-associated EVs in early-stage lung cancer patient plasmas. We further evaluated the signal brightness of Au@TFMBA@Ag NPs by comparing with the Raman signal of 20 mM TFMBA molecules in water (Fig. S2, ESI†), yielding an enhancement factor of 4.74 × 10⁵. Details for the calculation of the enhancement factor are indicated in the ESI.† Additionally, the Ag shell also helped to minimize the spectral cross-talk in multiplex detection and interferences of non-targets in complex clinical plasma samples.23 Au@Ra@Ag NPs were further functionalized with antibodies for specifically targeting EV surface proteins, with antibody-Raman reporter pairs of CD63-MBA, PTX3-MMTAA, and THBS1-TFMBA. Their corresponding SERS signals were exhibited in Fig. 1(F), showing characteristic peaks at 1080, 1287, and 1632 cm−1, respectively (Fig. 1(F)).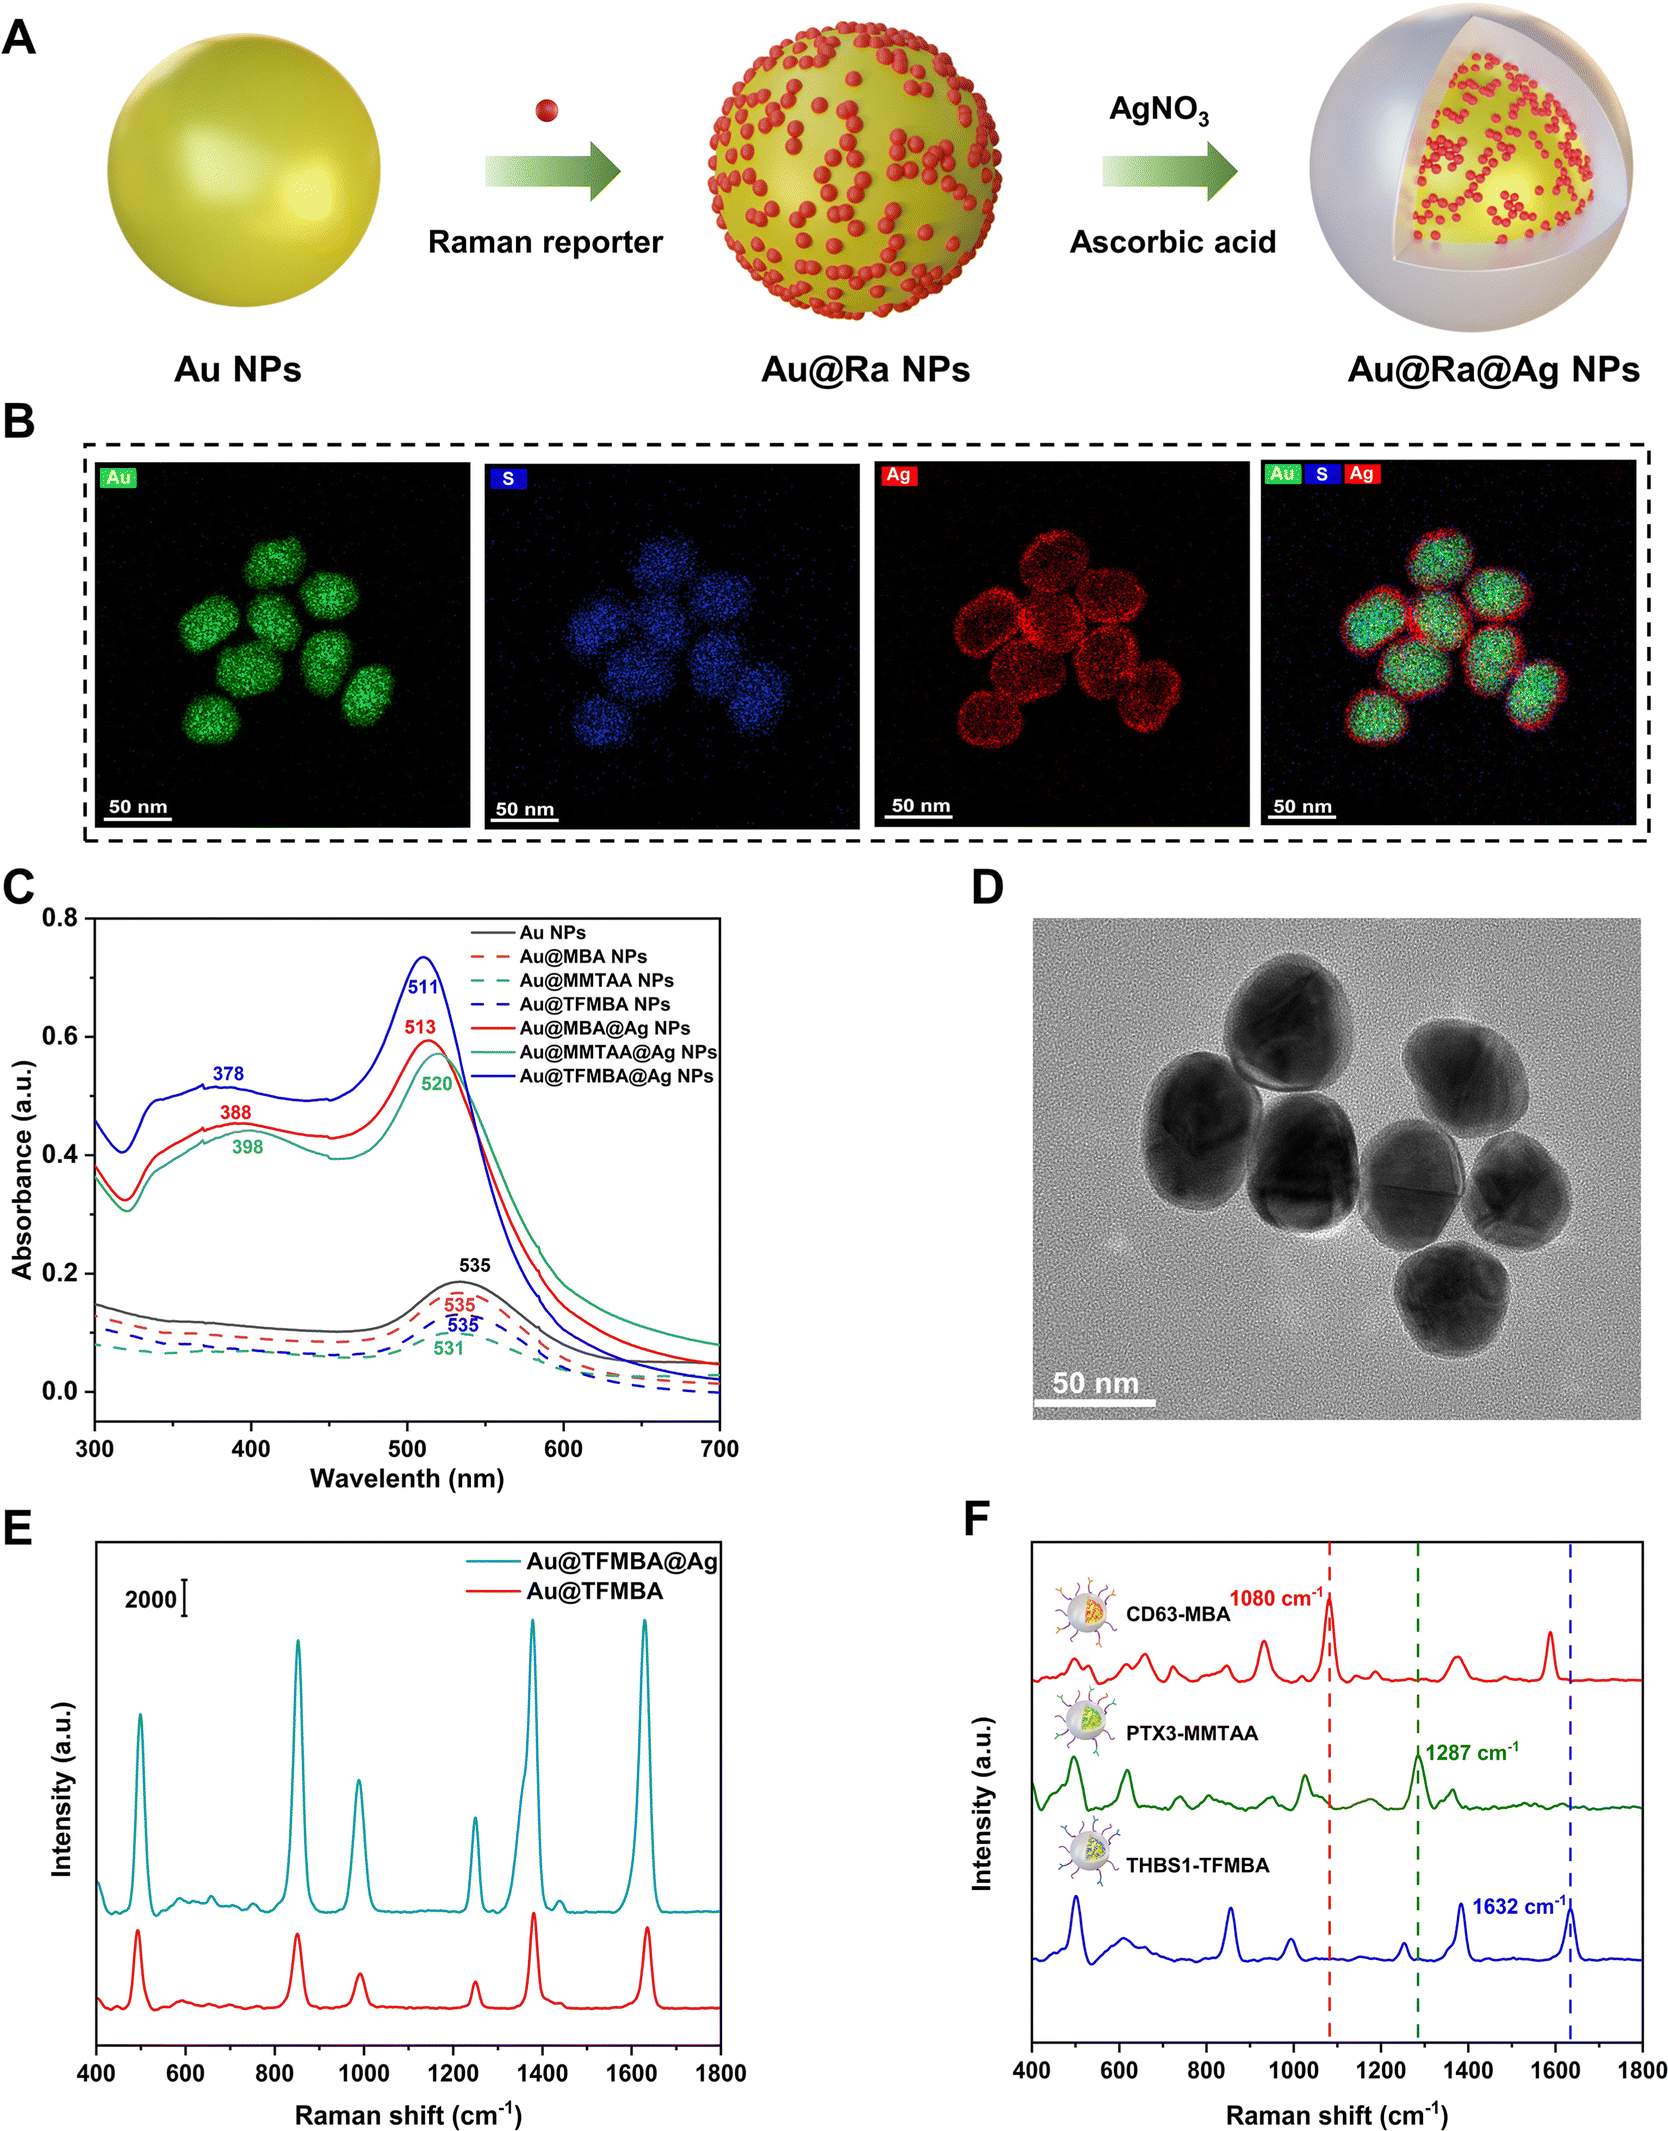 | ||
| Fig. 1 Preparation and characterization of SERS nanotags. (A) The synthesis of Au@Ra@Ag NPs using Raman reporter molecules as anchors. (B) EDS mapping of Au@TFMBA@Ag NPs. (C) UV-vis absorption spectra of Au NPs, Au@Ras NPs, and Au@Ras@Ag NPs. (D) A TEM image of Au@TFMBA@Ag NPs. (E) SERS spectra of Au@TFMBA NPs and Au@TFMBA@Ag NPs in water. (F) SERS signals of Au@Ra@Ag NPs with antibody-Raman reporter pairs of CD63-MBA, PTX3-MMTAA, and THBS1-TFMBA. | ||
2.2. Working scheme
Fig. 2 shows the schematic workflow of integrating Au@Ra@Ag NPs, the nanomixing chip, and machine learning for extracting lung cancer-associated EV phenotypes for early-stage lung cancer detection. Briefly, tumor-associated EVs were first immuno-enriched from complex plasma samples by the nanomixing chip, followed by on-chip, multiplex barcoding of EV surface proteins for SERS readouts. The nanomixing chip was arrayed with multiple pairs of asymmetric gold electrodes consisting of inner circular electrodes and outer ring electrodes (Fig. S3, ESI†). The application of an alternating current electric field induces a circulating nanomixing force on the electrode surface. As illustrated in Fig. 2(A), 50 μL of diluted plasma (5-fold dilution with phosphate buffer saline (PBS) buffer) was directly loaded onto the electrodes without EV pre-isolation. To specifically enrich lung cancer-associated EVs, the electrodes were functionalized with capture antibodies against PTX3 and THBS1 (Fig. 2(A)-i). The plasma EVs were immuno-captured (Fig. 2(A)-ii) and then subject to simultaneous 3-plex SERS nanotag labeling (Fig. 2(A)-iii). In the process of EV capture and labeling, the circulating nanomixing force was applied to increase the collisions of EVs and SERS nanotags, as well as reduce nonspecific binding on the electrode surface.5,24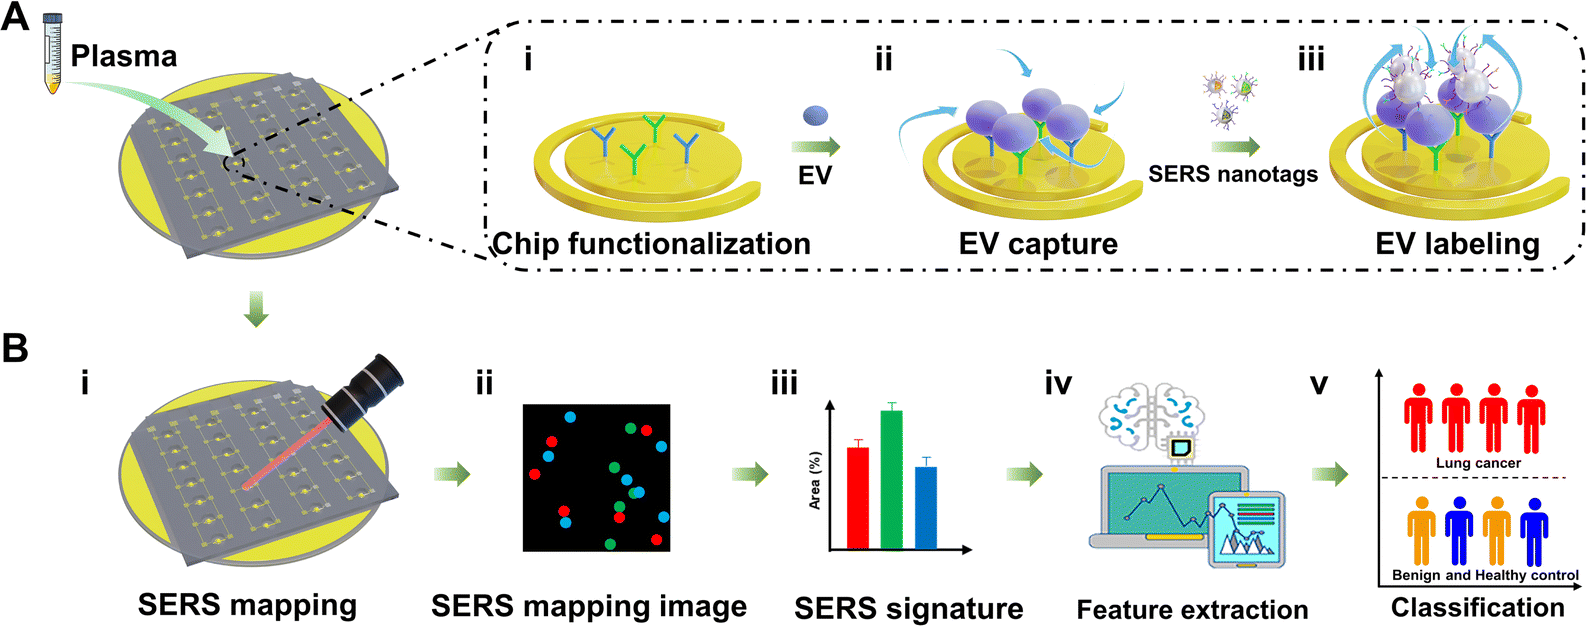 | ||
| Fig. 2 Schematic diagram for the identification of lung cancer-associated EV phenotypes applied for lung cancer screening. (A) Plasma samples were loaded onto the nanomixing chip for specific capture and labeling of lung cancer-associated EVs. (i) The electrode of the nanomixing chip was functionalized with antibodies against PTX3 and THBS1 for EV capture. (ii) EVs were captured and (iii) labeled by 3-plex SERS nanotags under the circulating nanomixing forces. (B) After EV labeling, (i) on-chip SERS mapping was performed to read out the SERS nanotags. (ii) The false-color SERS mapping image was established based on the characteristic peak intensities of SERS nanotags that were tagged to the EV surface proteins. (iii) The corresponding SERS signature was plotted by calculating the percentages of signal dot areas to mapping areas. Machine learning was applied for (iv) the extraction of lung cancer-associated EV phenotypes and (v) the classification of lung cancer patients and controls (patients with benign lung diseases and healthy controls). | ||
After EV labeling, on-chip SERS mapping was performed as signal readouts (Fig. 2(B)-i). The SERS mapping image was a false-color image (Fig. 2(B)-ii) and was established based on the characteristic peak signals of SERS nanotags (CD63-MBA, PTX3-MMTAA, and THBS1-TFMBA SERS nanotag). The signal dots on SERS mapping images indicated the presence of the corresponding SERS nanotag-targeted EVs. We hypothesized that the percentages of signal dot areas to mapping areas (referred to as “SERS signatures”) positively correlated with the expression levels of the corresponding markers on EV surfaces (Fig. 2(B)-iii). Because EVs reflect the cell of origin,10 the underlying EV features that could differentiate early-stage lung cancer patients from patients with benign lung diseases and healthy controls were analyzed using machine learning (i.e., LDA, PLS-DA, SVM, MLR, and KNN) (Fig. 2(B)-iv).
We hypothesized that the difference in EV phenotypes between benign and early malignant lung lesions would be small, thus requiring a highly sensitive assay for analysis. Our assay provided three key features to address the clinical challenge of EV phenotyping for lung cancer screening: (i) core–shell NPs as SERS nanotags to achieve multiplex and sensitive EV phenotyping with strong and stable Raman signals; (ii) a parallelized nanomixing device for enhanced capture and identification of rare tumor-associated EV populations via introducing a circulating nanoscopic flow to increase the collisions of EVs and SERS nanotags; and (iii) improved patient classification accuracy using machine learning. We expected that these unique features of our assay would enable reliable assessment of proteomic phenotypes of lung cancer-associated EVs for sensitive, accurate detection of early-stage lung cancer patients (Fig. 2(B)-v).
2.3. Assay specificity
To investigate the assay specificity in detecting lung cancer-associated EVs, we analyzed EVs present in the conditioned culture media (CCM) of the lung cancer cell line A549. To evaluate the degree of non-specific binding that commonly occurs in immunoassays, the nanomixing chip without capture antibodies and SERS nanotags without detection antibodies were used as controls. To mimic EVs released from healthy lung tissue, we also studied the phenotype of EVs derived from the lung epithelial cell line BEAS-2B. The presence of EVs in CCM as well as their physical properties were first evaluated using NTA and TEM. Fig. 3(A) shows the size distribution of particles in CCM with a median size of 204.5 nm. The cup-shaped morphology of an A549-derived EV was observed in the TEM image of Fig. 3(B). Fig. 3(C) displays the obtained representative SERS mapping images. The successful isolation of lung cancer-associated EVs was evidenced by strong signals of CD63-MBA, PTX3-MMTAA, and THBS1-TFMBA SERS nanotags detected from EVs of A549 cells. By contrast, negligible signals were obtained from EVs derived from BEAS-2B cells and other control experiments. This was an encouraging finding for potential use in lung cancer screening. These results further highlighted the powerful ability of nanomixing forces in minimizing non-specific binding towards gold electrodes. The SERS signatures of EVs derived from A549 and BEAS-2B cells as well as controls were averaged from three replicates and are presented in Fig. 3(D), showing consistent results to the representative SERS mapping images (Fig. 3(C)). To validate the SERS results, high-resolution flow cytometry was performed to evaluate the expression of CD63, PTX3, and THBS1 on the EV surface. As indicated in Fig. S4 (ESI†), A549-derived EVs showed expression of all three markers, demonstrating the detection ability of our nanostrategy in analyzing tumor-associated EVs in CCM.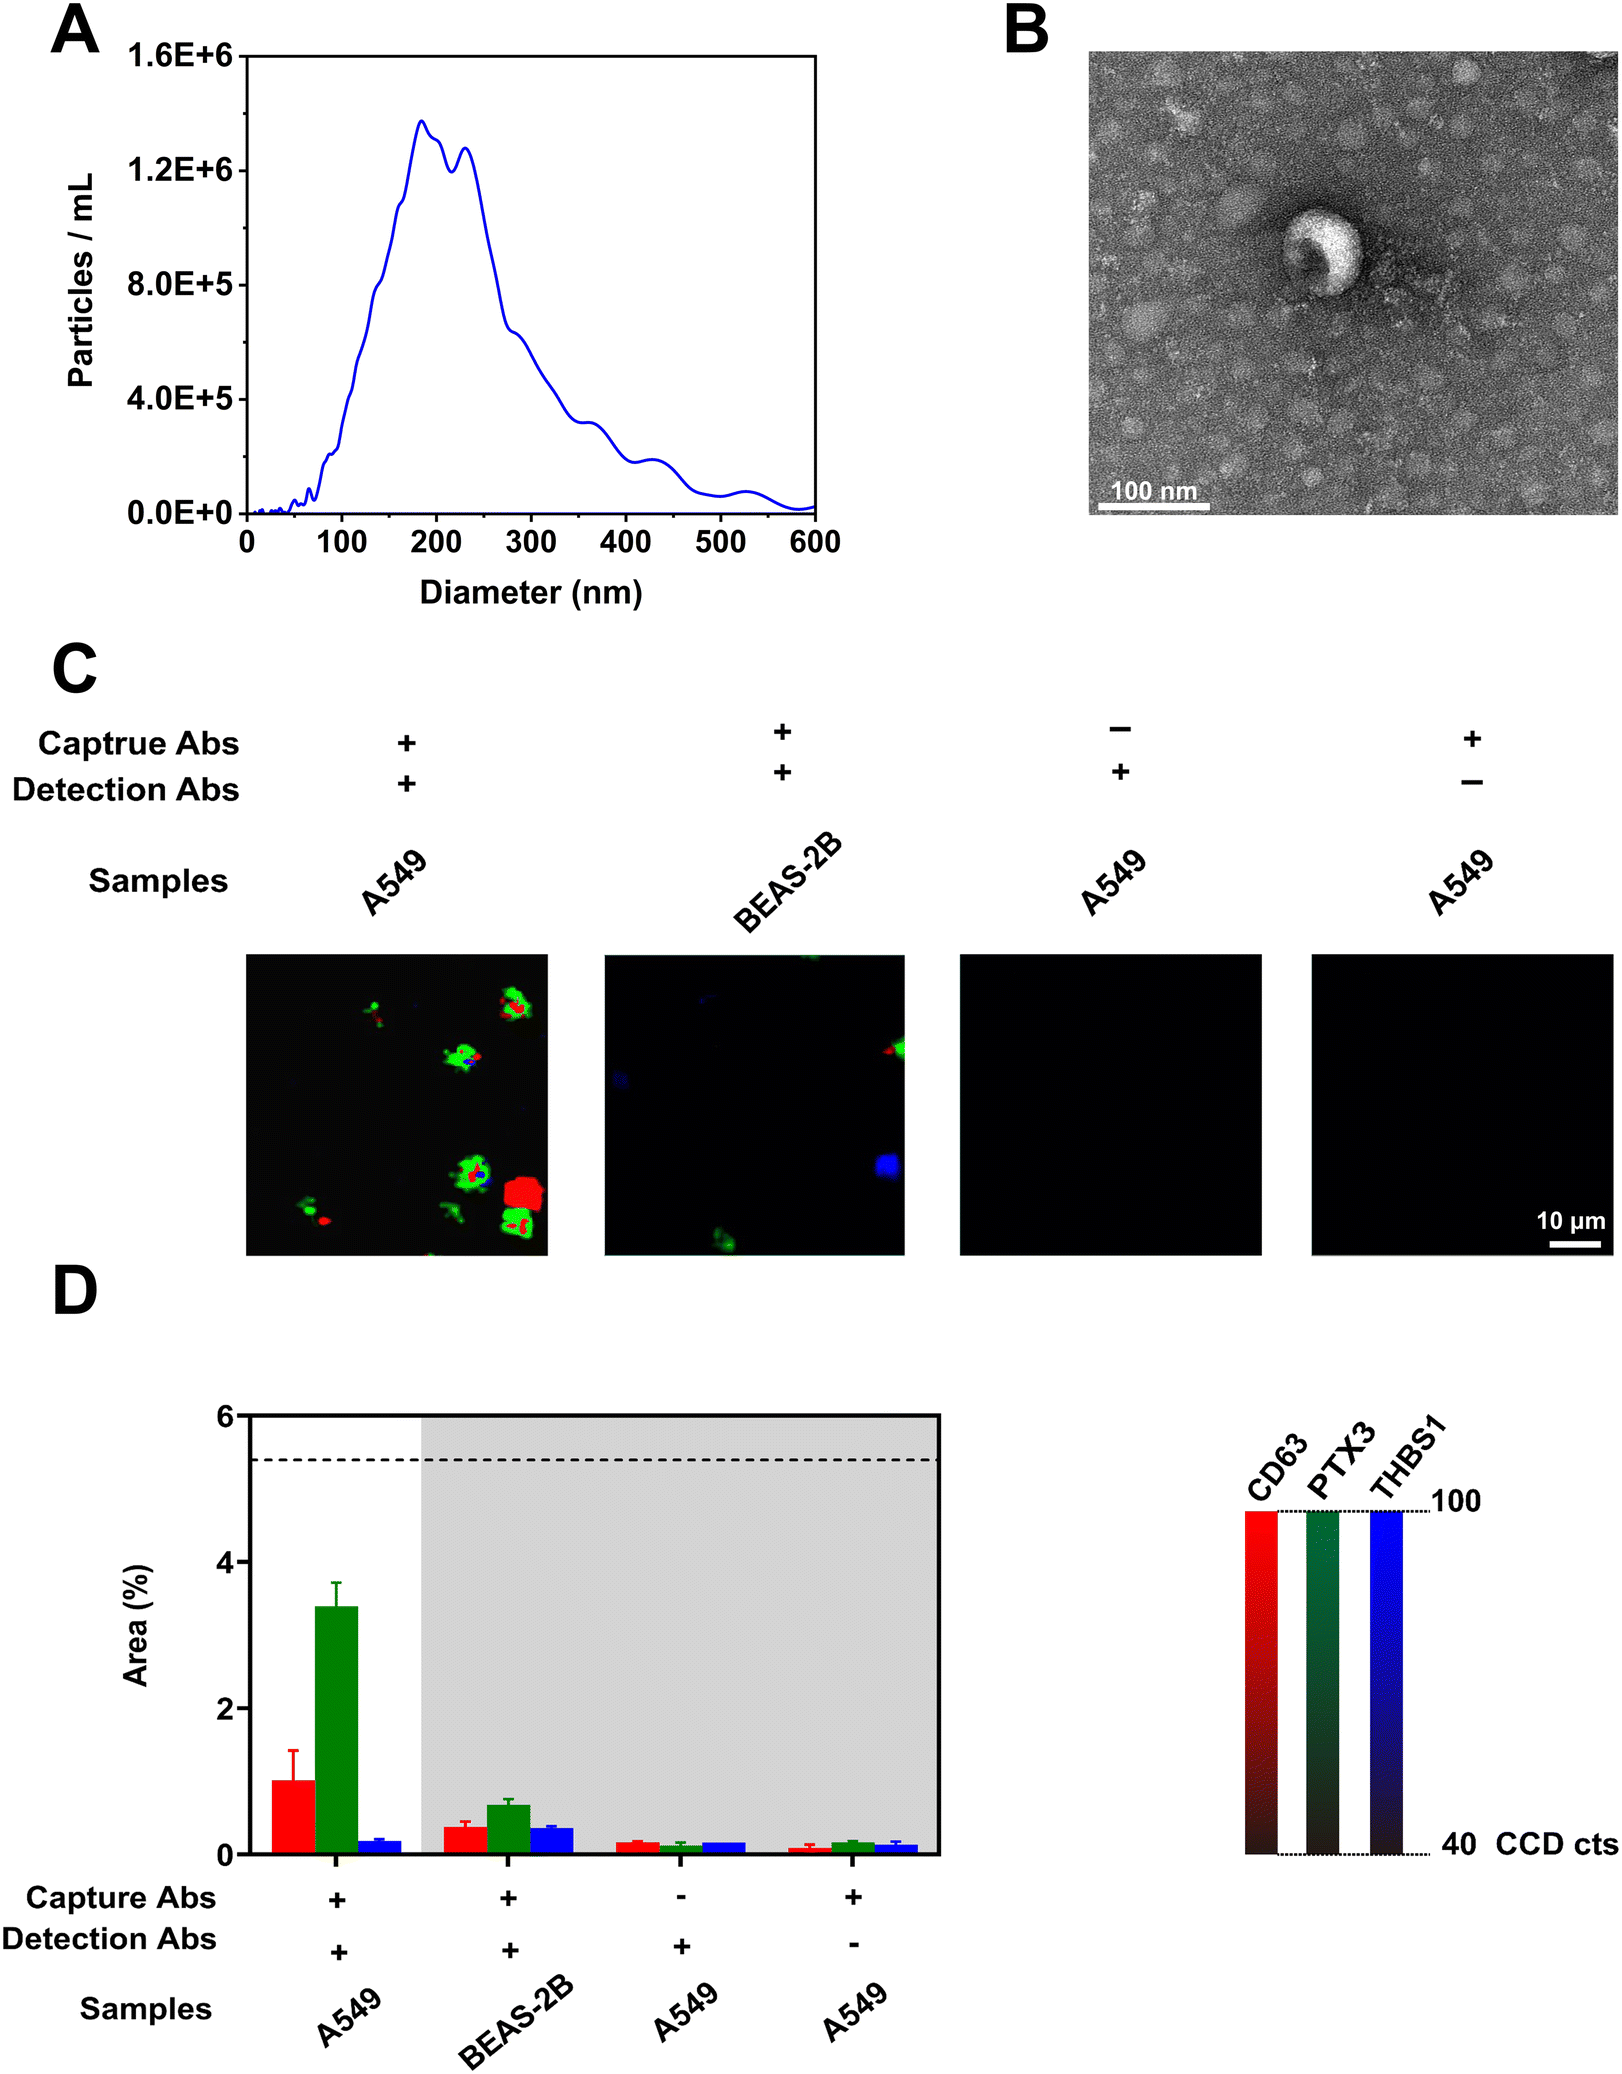 | ||
| Fig. 3 Assay specificity. (A) The size distribution of A549-derived EVs in CCM. (B) TEM image of an A549-derived EV. (C) Representative false-color SERS mapping images and (D) average SERS signatures of EVs derived from lung cancer cell line A549 and lung epithelial cell line BEAS-2B, which were captured with antibodies against PTX3 and THBS1 on the nanomixing chip and labeled with SERS nanotags functionalized with antibodies against CD63, PTX3, and THBS1. The control experiments included running A549-derived EVs on the nanomixing chip without capture antibodies or detected with SERS nanotags without detection antibodies. SERS mapping images were established based on the characteristic peak intensities of CD63-MBA (red), PTX3-MMTAA (green), and THBS1-TFMBA (blue) SERS nanotags, respectively. The percentages of signal dot areas to mapping areas were calculated to plot SERS signatures. The data in (D) are represented as mean ± standard deviation, where error bars represent the standard deviation of three independent experiments. | ||
2.4. Assay sensitivity
To determine the assay sensitivity in the phenotypic characterization of lung cancer-associated EVs, we examined the SERS signal intensities in response to different concentrations of A549 cell-derived EVs. As indicated in Fig. 4(A), the representative SERS mapping images showed that SERS signals decreased proportionally with decreasing EV concentrations, and no signals were observed in the absence of lung cancer-associated EVs. The characterization and detection sensitivity were further determined by analyzing SERS signatures obtained from different EV concentrations (Fig. 4(B)). It was observed that the average SERS signatures obtained from high EV concentrations (105–108 EVs mL−1) were similar. As such, the lowest EV concentration to generate a reliable SERS signature was 105 EVs mL−1. We further determined the detection sensitivity based on the total signal areas from three markers instead of single markers. As shown in Fig. S5 (ESI†), the total percentages of signal dot areas to mapping areas linearly increased with the common logarithm of EV concentrations with a squared correlation coefficient (R2) of 0.97 in the range from 103–107 EVs mL−1, providing the limit of detection (LOD) of 19 EVs mL−1.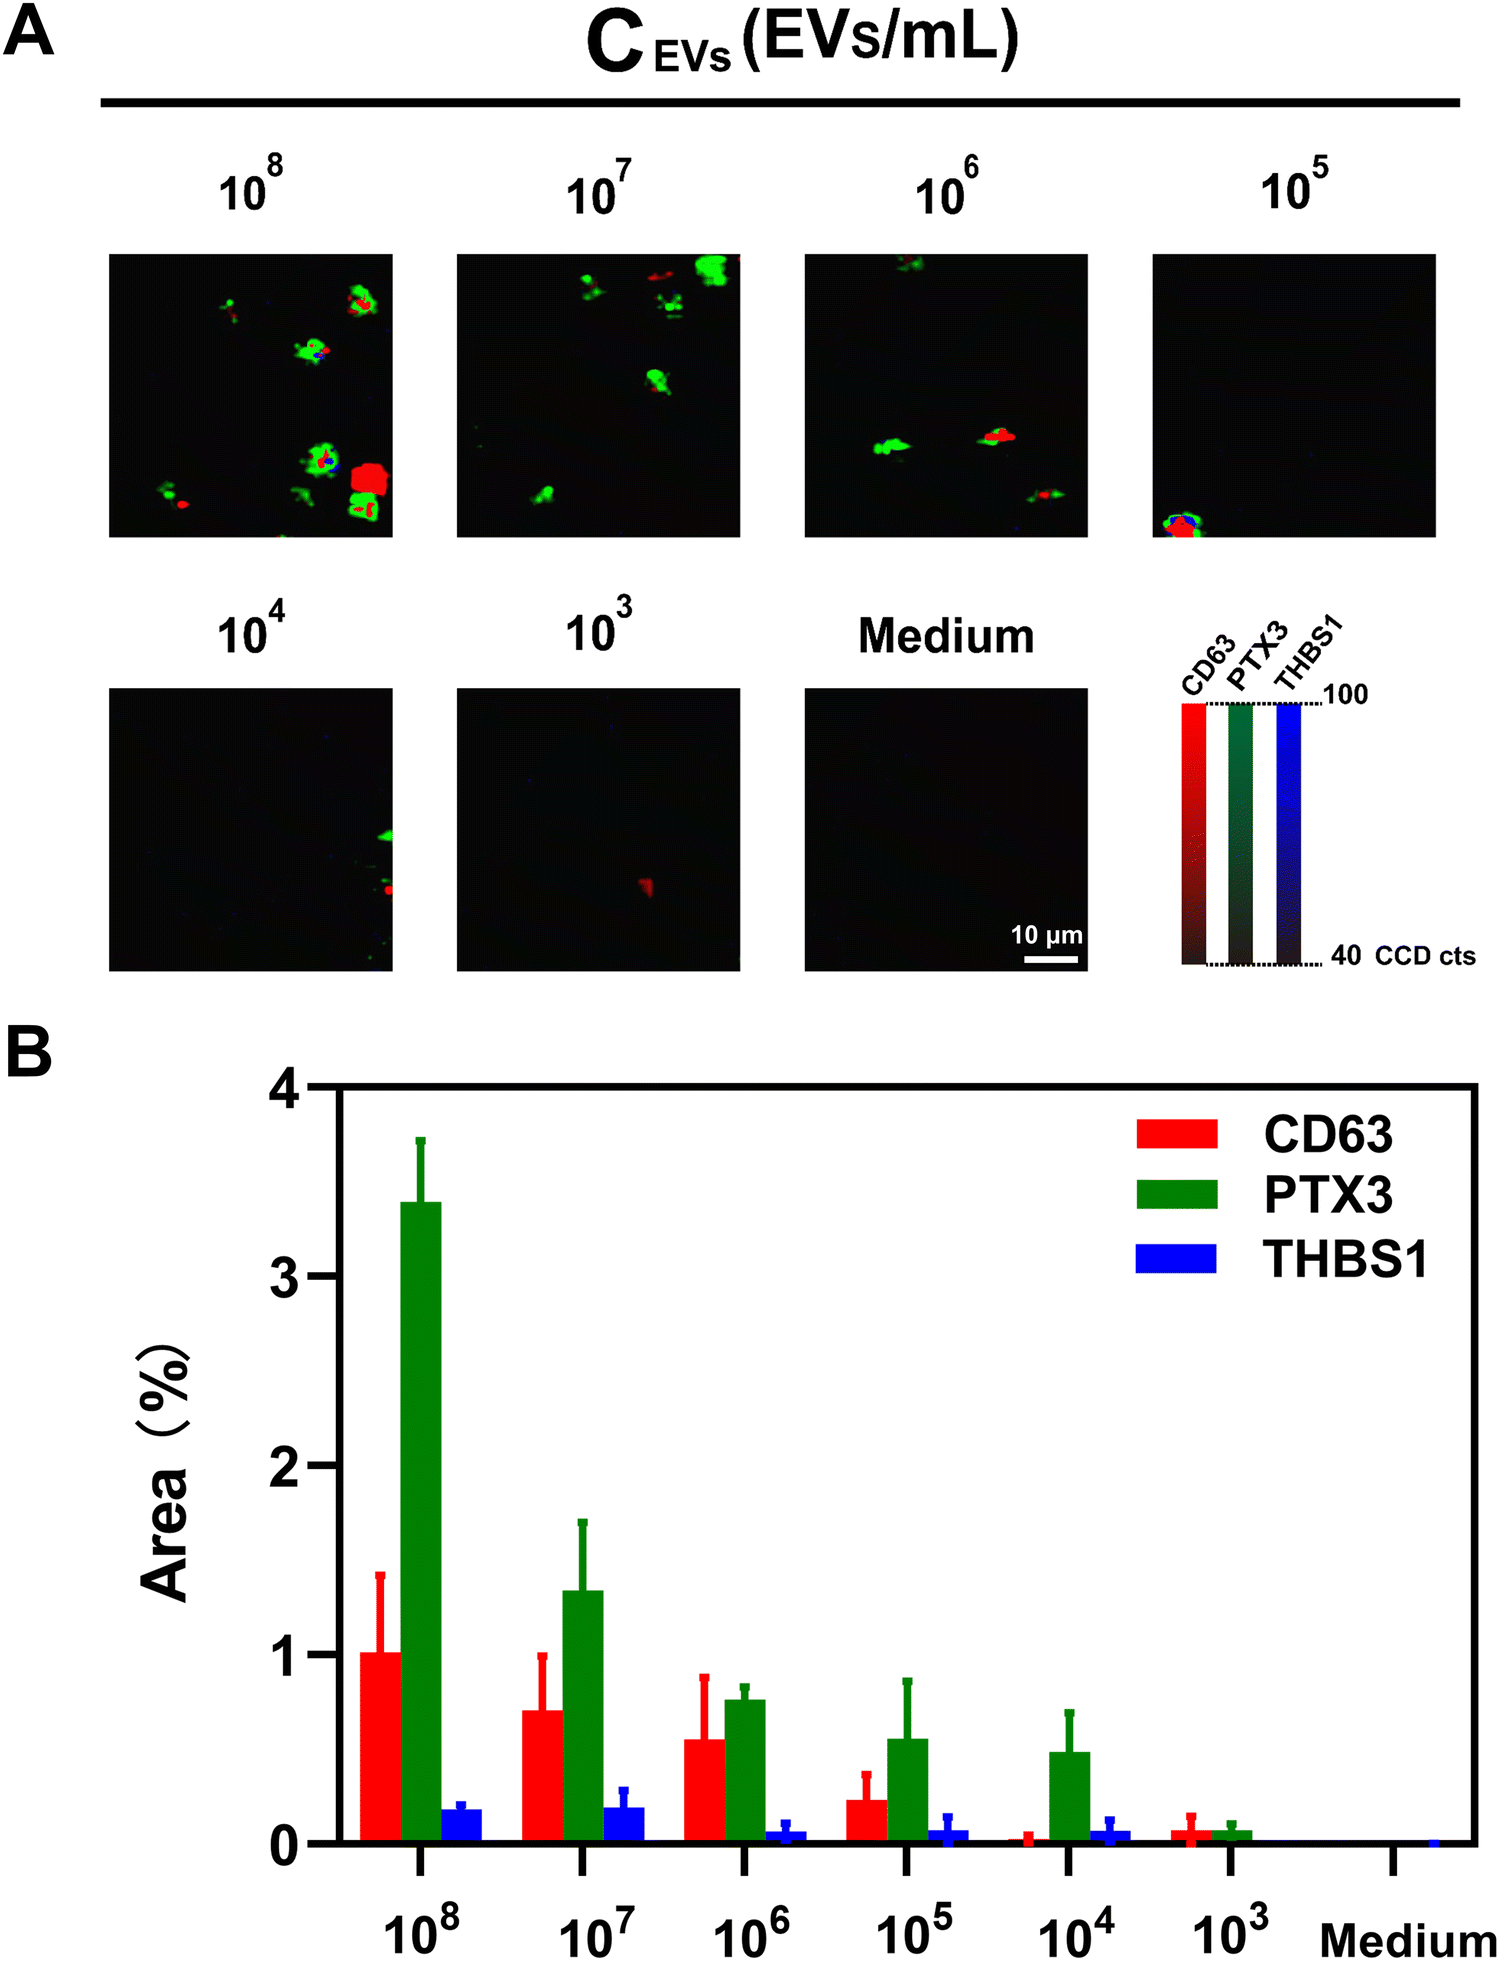 | ||
| Fig. 4 Assay sensitivity in the phenotypic characterization of lung cancer-associated EVs. (A) Representative false-color SERS mapping images and (B) average SERS signatures in detecting A549-derived EVs in the range from 103 to 108 EVs mL−1. The data in (B) are represented as mean ± standard deviation, where error bars represent the standard deviation of three independent experiments (n = 3). | ||
2.5. Clinical samples
To evaluate the potential of our nanostrategy for early detection of lung cancer, EV phenotyping was performed on plasma samples from patients diagnosed with early-stage lung cancer (n = 28), and benign lung diseases (n = 23), as well as healthy controls (n = 26). Given that it is particularly challenging to diagnose the malignant potential and heterogeneous characteristics of nodules with ground-glass (GG) opacity in CT images,25 5 pure GG nodules (GGNs) and 13 mixed GGNs were included to challenge our nanostrategy. As CT scans have been widely used for lung cancer screening, a CT scan was performed on 26 lung cancer patients and 21 benign patients for a head-to-head comparison of the diagnostic performance. All clinical patient samples were pathologically examined, which is the gold standard for lung cancer confirmation. The demographic data and clinical information of all participants have been summarized in Table 1 and Table S1 (ESI†). Fig. 5 provides the representative CT images of 3 early-stage lung cancer patients and 3 patients with benign lung diseases. As shown in the CT images (Fig. 5(A)), it was difficult to discriminate malignant and benign lung nodules as they shared similar features. By contrast, the representative SERS mapping images in Fig. 5(B) and average SERS signatures in Fig. S6 (ESI†) showed clear differences in plasma EV phenotypes, which were reflected by the phenomenon that more signal dots were detected from early-stage lung cancer patients (P2, P11, and P13) than from patients with benign lung diseases (B9, B10, and B19). Weak signals in patients with benign lung diseases might come from the low abundance of PTX3- or THBS1-expressing EVs in plasma.| Lung cancer (n = 28) | Benign (n = 23) | Healthy controls (n = 26) | ||
|---|---|---|---|---|
| Abbreviations: adenocarcinoma in situ, AIS; minimally invasive adenocarcinoma, MIA; invasive adenocarcinoma, IAC. | ||||
| Age | 20–30 | 0 | 0 | 18 |
| 30–40 | 2 | 1 | 5 | |
| 40–50 | 5 | 6 | 3 | |
| 50–60 | 5 | 9 | 0 | |
| 60–70 | 14 | 4 | 0 | |
| 70–80 | 1 | 3 | 0 | |
| 80–90 | 1 | 0 | 0 | |
| Gender | Male | 12 | 14 | 15 |
| Female | 16 | 9 | 11 | |
| Nodule classification | Solid | 11 | 19 | N/A |
| Pure GGN | 4 | 1 | ||
| Mixed GGN | 11 | 2 | ||
| Unknown | 2 | 1 | ||
| Stage | 0 | 4 | N/A | N/A |
| I | 24 | |||
| Pathology | AIS | 5 | N/A | N/A |
| MIA | 9 | |||
| IAC | 14 | |||
 | ||
| Fig. 5 Representative (A) CT images and (B) false-color SERS mapping images of early-stage lung cancer patients (P2, P11, and P13) and patients with benign lung diseases (B9, B10 and B19). | ||
To evaluate the diagnostic potential of each EV marker, we compared the average percentages of SERS signal dots among the three clinical groups (Fig. 6(A)). The average percentages of SERS signal dots of target markers were significantly higher in early-stage lung cancer patients than patients with benign lung diseases and healthy controls. No obvious differences in each marker expression on EVs were observed between patients with benign lung diseases and healthy controls. The heat map result was used to represent the average SERS signatures from three independent experiments. As shown in Fig. 6(B), the expression level of each target marker on PTX3+ THBS1+ lung cancer-associated EVs was consistent with the representative SERS mapping images (Fig. 5(B)) and average signatures (Fig. S6, ESI†). Additionally, we observed heterogeneous EV phenotypes within each clinical group in both Fig. 6(A) and (B), highlighting the importance of combining multiple markers for early lung cancer detection.
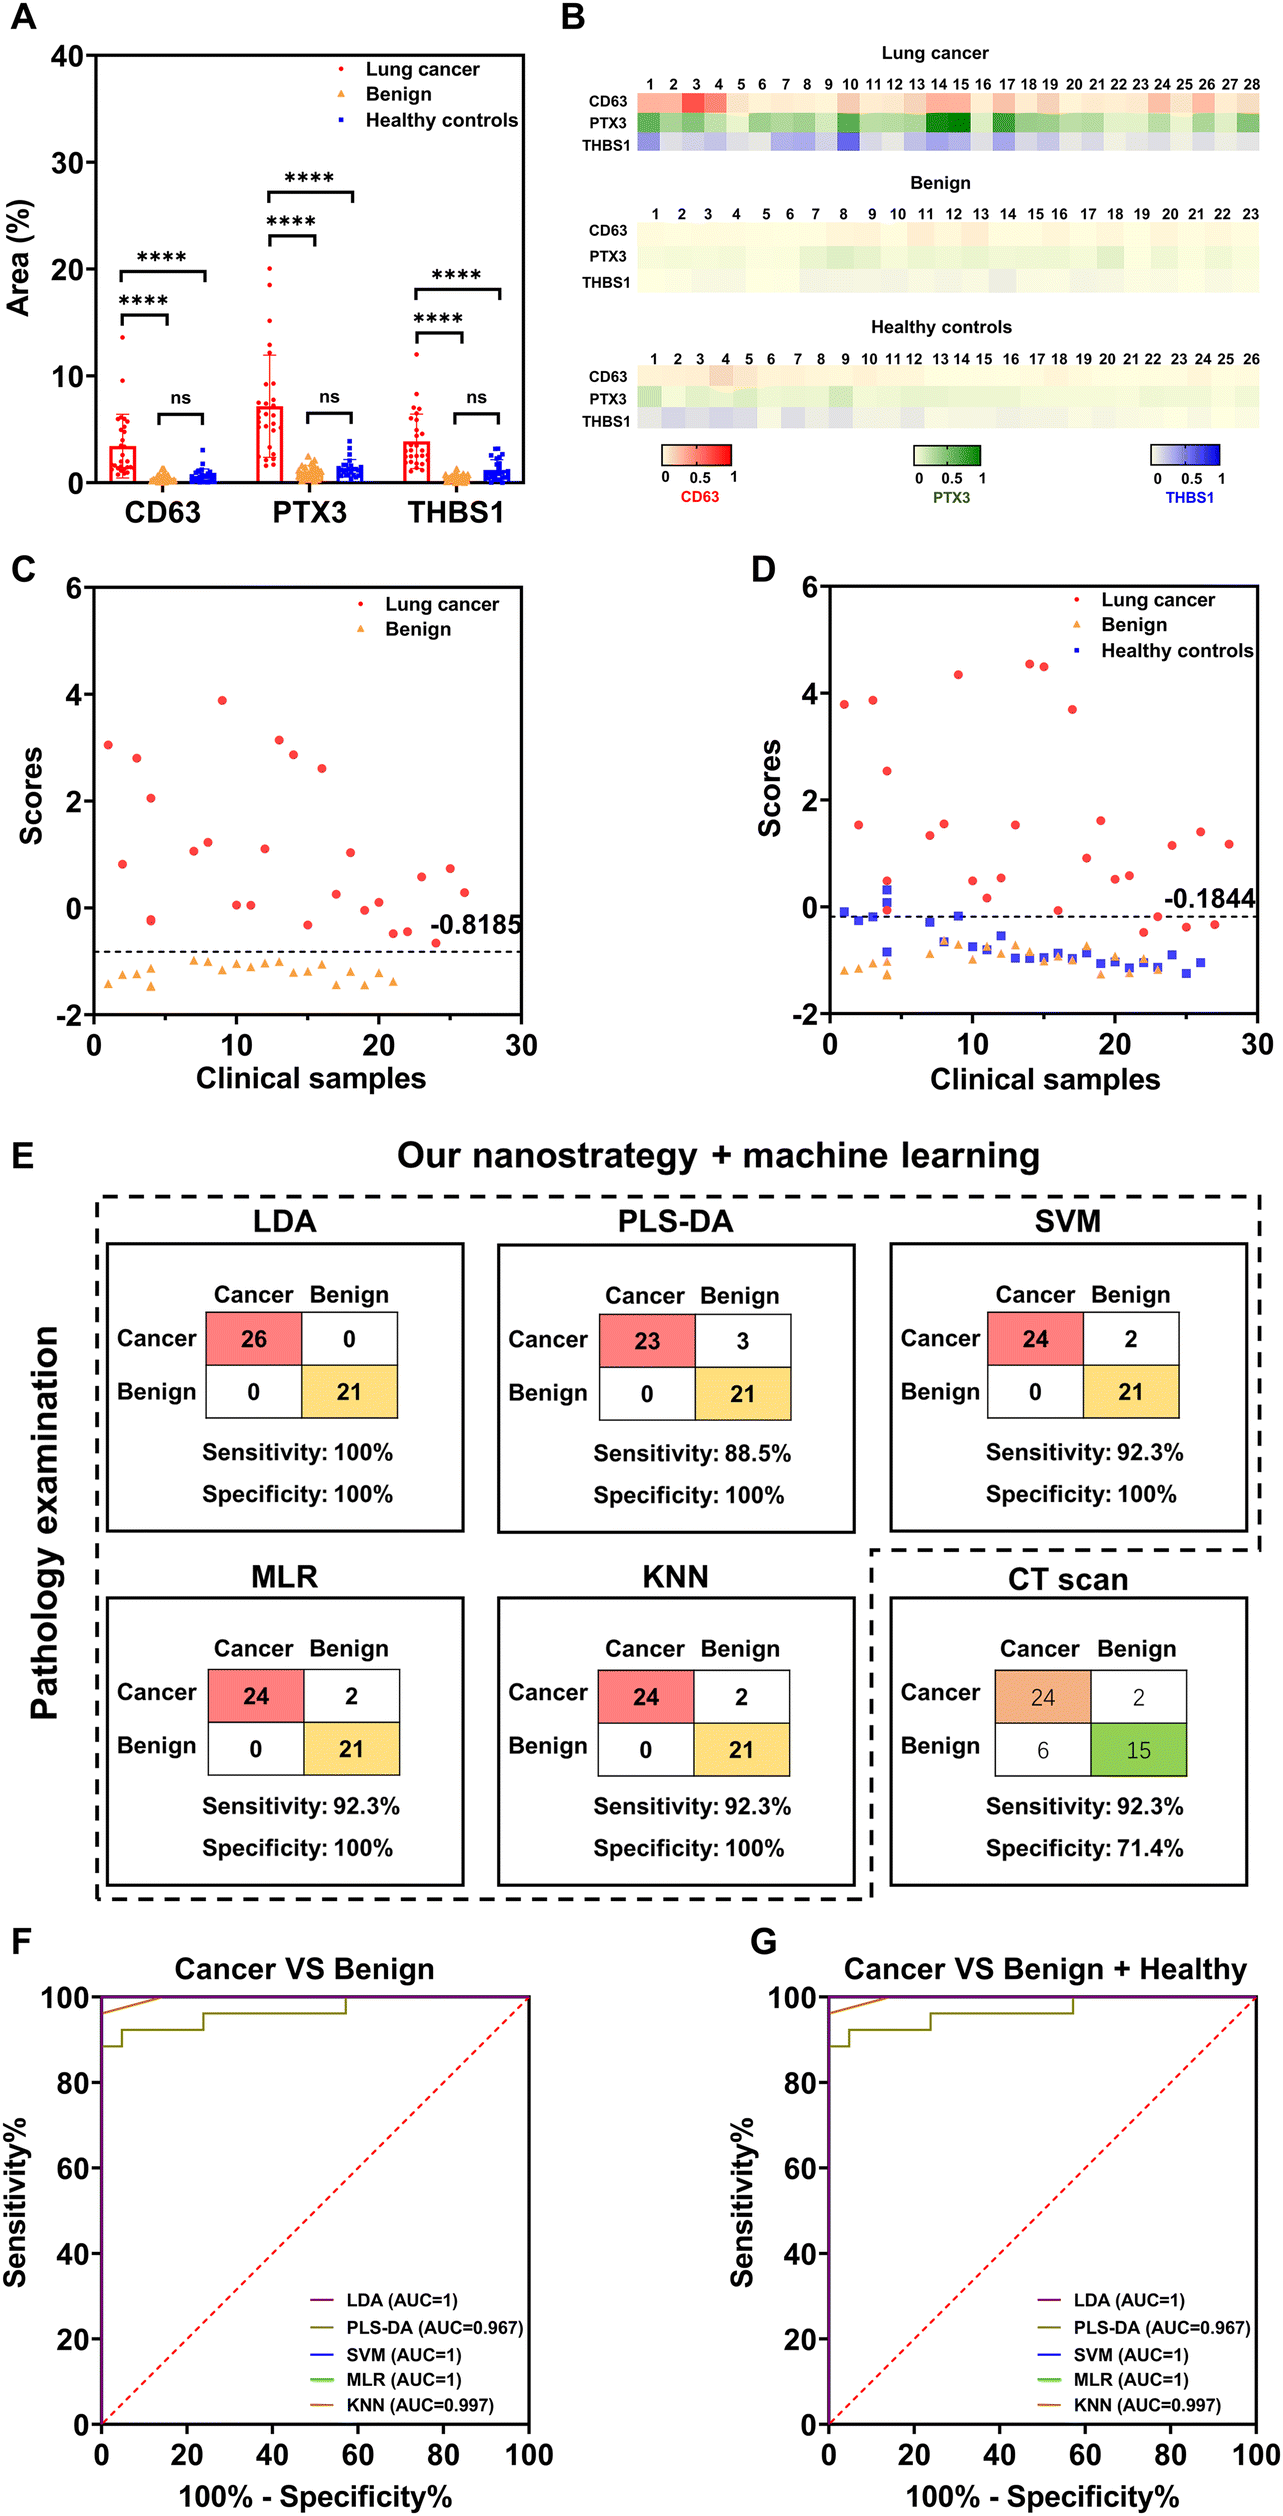 | ||
| Fig. 6 Clinical sample analysis. (A) SERS measurements of target marker levels on the surface of plasma EVs among clinical groups. (B) Heat map results representing the EV SERS signature of individuals. (C) LDA discriminant scores obtained from a discriminant model for classifying 26 early-stage lung cancer patients and 21 patients with benign lung diseases. (D) LDA discriminant scores obtained from a discriminant model for differentiating 28 early-stage lung cancer patients and controls consisting of 23 patients with benign lung diseases and 26 healthy controls. (E) The clinical detection sensitivity and specificity of our nanostrategy in combination with machine learning algorithms (LDA, PLS-DA, SVM, MLR, or KNN) and a CT scan differentiating 26 early-stage lung cancer patients and 21 patients with benign lung diseases. ROC curves reflected the diagnostic ability of our nanostrategy in combination with different machine learning algorithms for the differentiation of (F) early-stage lung cancer and benign lung diseases, and (G) early-stage lung cancer and controls (benign lung diseases and healthy controls). Data in (A) are represented as mean ± standard deviation, where error bars represent the standard deviation of biological replicates. ****P < 0.0001; ns, not significant. | ||
For accurate and objective differentiation of malignant and benign nodules, machine learning (i.e., LDA) was further applied to extract lung cancer-associated EV phenotypes and build the discriminant model. As indicated in Fig. 6(C) and (D), the early-stage lung cancer group showed a dispersive distribution of discriminant scores, suggesting the heterogeneity of EV phenotypes among early-stage lung cancer patients. In contrast, patients with benign lung diseases and healthy controls clustered together and separated well from the early-stage lung cancer group (Fig. 6(D)).
Given the small clinical cohort, leave-one-out cross-validation (LOOCV) analysis was applied to evaluate the performance of the established discriminant model, in which the learning algorithm was applied once for each sample using the selected sample as a single-item test set and all other samples as a training set (Fig. 6(E)). LOOCV analysis showed that our nanostrategy combined with LDA achieved a clinical detection sensitivity of 76.9% and specificity of 100% in differentiating early-stage lung cancer and benign lung diseases (Fig. 6(E)). We next sought to evaluate whether other machine learning algorithms (PLS-DA, SVM, MLR, and KNN) could achieve better clinical detection sensitivity and specificity. As summarized in Fig. 6(E), a clinical sensitivity of 80.8–92.3% and a specificity of 100% were achieved, showing the higher sensitivity of these machine learning algorithms than LDA. These results thus highlighted that combining our nanostrategy and appropriate machine learning algorithms can provide excellent accuracy for differentiating early-stage lung cancer and benign lung diseases.
For comparison, CT scan-based lung cancer diagnosis was performed with the same patient cohort by an experienced radiologist, resulting in the clinical detection sensitivity of 92.3% and specificity of 71.4% (Fig. 6(E)). However, it is noted that CT scan-based lung cancer diagnosis is based on subjective interpretation and thus might suffer from inter-observer variability. Overall, our nanostrategy showed superior clinical specificity to CT scans in differentiating early malignant and benign lung nodules.
ROC analysis was further performed to evaluate the discriminant performance of our nanostrategy in combination with different machine learning algorithms, over a range of trade-offs between sensitivity and specificity. The area under the curve (AUC) was used as a combined measure of sensitivity and specificity for assessing inherent validity of a diagnostic test. An AUC value of 1 indicates a perfect performance in differentiating diseased with non-diseased subjects, without any false positive and false negative results. Fig. 6(F) and (G) show the AUC values ranging from 0.967 to 1 in differentiating patients with early-stage lung cancer and benign lung diseases and from 0.877 to 0.978 in separating cancer patients from non-cancer patients (patients with benign lung diseases and healthy donors). ROC results thus showed excellent diagnostic performance of our nanostrategy combined with machine learning in early lung cancer screening, particularly the differentiation of patients with malignant from benign nodules.
3. Conclusion
Identification of tumor-associated liquid biopsy markers is of great importance for minimally invasive lung cancer screening. In this study, we combined Au@Ra@Ag NPs, a nanomixing chip, and machine learning to discover plasma EV phenotypes that were unique to early-stage lung cancer patients. Our nanostrategy provided an R2 of 0.97 within a linear range of 103–107 EVs mL−1 and a LOD of 19 EVs mL−1. This detection sensitivity enabled the direct phenotypic characterization of EVs from 10 μL of plasma samples without any EV pre-isolation. We found that early-stage lung cancer patients had significantly higher levels of PTX3 and THBS1 on plasma EV surfaces than patients with benign lung diseases and healthy controls. In a head-to-head comparison with CT scan-based lung cancer diagnosis (92.3% sensitivity and 71.4% specificity), our nanostrategy achieved 92.3% sensitivity and 100% specificity in differentiating early malignant and benign lung nodules. Overall, our nanostrategy achieved an AUC value of 0.978 in the differentiation between the early-stage lung cancer patients and controls consisting of patients with benign lung diseases and healthy controls. This result thus highlighted that EVs as liquid biopsy markers could be sampled and profiled to detect the early occurrence of lung cancer.4. Experimental section
4.1. Clinical sample acquisition
This study was conducted according to the International Ethical Guidelines for Biomedical Research Involving Human Subjects and the National Statement on Ethical Conduct in Human Research. Ethical approvals were obtained from the Human Research Ethics Committees of Fujian Cancer Hospital (SQ2020-025-01) and Fujian Normal University, respectively. All experiments related to human samples were performed in accordance with the approved guidelines. All patients have provided their written informed consent for the research study protocol. Plasma samples were collected from patients with early-stage lung cancer (n = 28), patients with benign lung diseases (n = 23), and healthy controls (n = 26) from Fujian Cancer Hospital. All blood samples were collected in ethylenediaminetetraacetic acid (EDTA) tubes, which were gently inverted up and down 8–10 times and stored vertically at 4 °C. Blood samples were centrifuged at 1100 × g for 15 min at room temperature. Subsequently, the plasma supernatant was collected, dispensed in lyophilized tubes and stored at −80 °C. The demographic data and clinical information of all participants are summarized in Table 1 and Table S1 (ESI†).4.2. Cell culture and CCM collection
Human lung cancer cell line A549 and a non-tumorigenic lung epithelial cell line BEAS-2B were obtained from American Type Culture Collection. Cells were cultured in the RF10 medium consisting of RPMI 1640 medium (Gibco), 10% fetal bovine serum (FBS, Gibco), 100 U mL−1 penicillin-streptomycin (Gibco) and 2 mM GlutaMAX. All cells were maintained at 37 °C with 5% CO2 in a humidified incubator. The old culture media were removed when the cell confluency reached 80%. Cells were rinsed with PBS three times and cultured in serum-free media. After 24 h culture, the supernatant (i.e., CCM) was collected and stored at −80 °C before future analysis. The concentration and the particle size distribution of EVs in CCM were characterized using a ZetaView × 30 (Particle Metrix, Germany) by Shiyanjia Lab (https://www.shiyanjia.com). The EV morphology was visualized using a Hitachi HT7700 TEM operated at 100 kV.4.3. Nanoflow cytometry characterization of EV surface proteomics
To isolate EVs, the CCM sample was sequentially centrifuged at 2000 × g for 30 min, 10![[thin space (1/6-em)]](https://www.rsc.org/images/entities/char_2009.gif) 000 × g for 45 min, and 100000 × g for 70 min twice at 4 °C. PBS was used as the washing and resuspension buffer. The characterization of CD63, PTX3, and THBS1 was performed individually on 109 EVs. The expression of CD63 on EVs was detected by staining EVs with FITC-conjugated CD63 antibodies (BD Biosciences, 556019). The corresponding control was EVs with FITC-conjugated IgG antibodies (BioLegend, Cat. 400108). The PTX3 and THBS1 levels on EVs were measured by staining EVs with either anti-PTX3 antibodies (Novus biologicals, MAB1826) or anti-THBS1 antibodies (Novus biologicals, MAB3074), followed by the FITC-labeled anti-IgG antibodies (Bioss antibodies, bs-0296G). The corresponding control was EVs with FITC-labeled anti-IgG antibodies. Samples were incubated at 37 °C for 30 min and purified with the Hitachi ultracentrifuge (CP100MX) at 110000 × g for 70 min at 4 °C. The samples were subsequently analyzed using a NanoFCM instrument (N30E). Data were collected using NF Profession 1.17 software and analyzed with FlowJo_v10.7.1.
000 × g for 45 min, and 100000 × g for 70 min twice at 4 °C. PBS was used as the washing and resuspension buffer. The characterization of CD63, PTX3, and THBS1 was performed individually on 109 EVs. The expression of CD63 on EVs was detected by staining EVs with FITC-conjugated CD63 antibodies (BD Biosciences, 556019). The corresponding control was EVs with FITC-conjugated IgG antibodies (BioLegend, Cat. 400108). The PTX3 and THBS1 levels on EVs were measured by staining EVs with either anti-PTX3 antibodies (Novus biologicals, MAB1826) or anti-THBS1 antibodies (Novus biologicals, MAB3074), followed by the FITC-labeled anti-IgG antibodies (Bioss antibodies, bs-0296G). The corresponding control was EVs with FITC-labeled anti-IgG antibodies. Samples were incubated at 37 °C for 30 min and purified with the Hitachi ultracentrifuge (CP100MX) at 110000 × g for 70 min at 4 °C. The samples were subsequently analyzed using a NanoFCM instrument (N30E). Data were collected using NF Profession 1.17 software and analyzed with FlowJo_v10.7.1.
4.4. SERS nanotag synthesis
Au NPs were synthesized via the citrate-reduction according to the previous literature.26 1 mL of Au NP solution was then incubated with different amounts of Raman reporters (2 μL of 1 mM MBA, 4 μL of 1 mM TFMBA, 4 μL of 1 mM MMTAA in ethanol) for 5 h at room temperature. After incubation, centrifugation was performed to remove the residuals. The concentrate was then resuspended in 1 mL of Milli-Q water (18.2 MΩ·cm at 25 °C). To form Ag shells on the surface of Au NPs, 30 μL of 1% w/v trisodium citrate, 10 μL of 10 mM sodium hydroxide, and 135 μL of 1 mM silver nitrate were sequentially added into the solution under magnetic stirring. After that, 202 μL of 10 mM ascorbic acid was added dropwise into the mixture and shaken for 0.5 h. The core–shell NPs were then purified via centrifugation and then resuspended in 1 mL of Milli-Q water. The core–shell NPs were then incubated with 2 μL of 1 mM dithiobis(succinimidyl propionate) (DSP) at room temperature for 5 h. The free DSP was then removed via centrifugation. After centrifugation, the concentrate was resuspended in 200 μL of 0.1 mM PBS and incubated with 1 μg of primary antibodies against CD63 (Novus biologicals, NBP2-42225), PTX3 (Novus biologicals, MAB1826), or THBS1 (Novus biologicals, MAB1826) for 30 min at room temperature. The mixture was then centrifuged at 4 °C to remove free antibodies and resuspended in 200 μL of 0.1% w/v bovine serum albumin (BSA).4.5. Nanoparticle characterization
TEM and EDS images of SERS nanotags were taken by a FEI Talos 200S operated at 200 kV. The UV-vis absorption spectra of NPs were measured using a PerkinElmer Lambda 950 UV-vis spectrometer. The concentrations and particle size distributions of NPs were determined using a NanoSight N300 (Malvern Panalytical, UK). For each sample, three videos of 60 s duration were recorded and were analyzed using NTA software.4.6. Chip fabrication and functionalization
The chip was made of a glass substrate with arrays of gold electrodes, which were architected into an asymmetric structure—an inner circular electrode (diameter = 1000 μm) and an outer ring-shaped electrode (width = 120 μm) that were separated by a distance of 1000 μm. The chip was fabricated using photolithography according to previous literature.5,12,13 Briefly, the photomask of electrode structures was designed (L-Edit, Tanner Research, USA) and written to a chrome mask (5 inch, Shenzhen Qingyi Precision Mask Making, Singapore) using a direct laser writer (Heidelberg μPG 101, Germany). A 4 inch Borofloat® wafer (Bonda Technology Pte Ltd, Singapore) was dehydrated at 150 °C for 25 min, spin-coated with AZnLOF 2020 (Microchemicals GmbH, Germany) at 3000 rpm for 30 s, and then transferred to a hot plate at 110 °C for 2 min. UV exposure was then performed on the coated wafer with a constant dose of 150 mJ cm−1 using an EVG 620 mask aligner (EVG Group, Austria). The negative electrode structure was subsequently revealed by baking at 110 °C for 1 min and wafer development for 45 s in AZ® 726 MIF (Microchemicals GmbH, Germany). The developed wafer was coated with a 10 nm layer of Ti and 200 nm of gold using a Temescal FC-2000 electron beam evaporator (Ferrotec, USA). The final electrode structure of the wafer was obtained by overnight lift-off in Remover PG (Microchemicals GmbH, Germany).A polydimethylsiloxane (PDMS) microwell array was prepared by curing the activated silicon elastomer solution (Sylgard® 184, Dow, USA) in a vacuum drying oven at 80 °C for 20 min and then punching microwell arrays (diameter = 6 mm) according to the positions of gold electrodes on the chip. The PDMS microwell array was thermally bound to the chip at 65 °C for 7 h to complete the device preparation.
4.7. Chip functionalization
After binding the PDMS microwell array to the chip, 20 μL of 5 mM DSP in dimethyl sulfoxide was loaded into each well for 2 h incubation, followed by one wash with ethanol and three washes with PBS buffer in sequence. The gold electrodes were then incubated with 10 μL of 10 μg mL−1 antibodies against PTX3 (Novus biologicals, MAB1826) and THBS1 (Novus biologicals, MAB3074) for 2 h and blocked with 1% w/v BSA for another 2 h at room temperature. All steps were performed at room temperature. Microwells were rinsed with PBS buffer prior to usage.4.8. Capture and labeling of EVs
50 μL of CCM or diluted plasma (5-fold dilution) was added to the microwells to perform immune capture of EVs from complex samples under the field condition of 800 mV and 500 Hz. After 45 min reaction, microwells were rinsed with the washing buffer (PBS buffer with 1% w/v BSA). 20 μL of diluted SERS nanotags (25-fold dilution) was then added to microwells for EV labeling for 20 min under the above field conditions (i.e., 800 mV and 500 Hz), followed by rinsing with the washing buffer.4.9. SERS measurements
SERS spectral mapping was performed using a confocal HORIBA Raman spectrometer (XploRA™PLUS) equipped with a 785 nm laser, a 1200 g mm−1 grating blazed at 750 nm, a confocal hole of 300 μm, 100 μm entrance, and an electron multiplying charge-coupled device. SERS spectral imaging was performed at an area of 60 μm × 60 μm (60 pixels × 60 pixels) with 1 μm spatial resolution using a 50× microscope objective (×50_VIS_LWD). Correspondingly, one SERS spectrum in the range of 400–1800 cm−1 was taken from each pixel by irradiation with a laser power of 38 mW for 0.05 s integration time. Before SERS measurements, the characteristic peak of a silicon wafer at 520 cm−1 was used as the reference to calibrate the spectrometer. All SERS spectra were collected and background-corrected using the LabSpec 6 software.The collected signal spectrum was baseline-corrected using LabSpec6 software to remove the background noise. After baseline correction, false-color SERS mapping images were established based on characteristic peak intensities of SERS nanotags: 1080 cm−1 for CD63-MBA (red), 1287 cm−1 for PTX3-MMTAA (green), and 1632 cm−1 for THBS1-TFMBA (blue) SERS nanotags, respectively. The background signal was set to black. The area of colored pixels was calculated using ImageJ and divided by the total mapping area to determine the EV SERS signature. EV SERS signatures were calculated from three SERS spectral images obtained from three independent experiments.
4.10. Limit of detection
The LOD was calculated according to the equation below:| LOD (area ratio) = mean of blank + 3 × standard deviation of blank |
The LOD (EV concentration) was calculated by converting the LOD (area ratio) using the formula obtained from the calibration curve.
4.11. Statistical analysis
SERS signatures derived by calculating the percentages of signal dot areas of three SERS nanotags to mapping areas, were used as input variables to the LDA, PLS-DA, SVM, MLR, and KNN. These machine learning analyses were performed using the SPSS 24.0 software package (SPSS Inc., USA). One-way analysis of variance and ROC analysis were carried out using GraphPad Prism 9.Author contributions
J. W., M. T., A. W., and Y. C. conceived the project and designed the experiments. L. Y., L. K., Q. Z., J. C., and M. F. performed the experiments. L. Y., A. W., Q. Z., and J. W. wrote the manuscript. All authors contributed to revising the manuscript.Conflicts of interest
There are no conflicts to declare.Acknowledgements
J. W. acknowledges the support from the National Natural Science Foundation of China (No. 12074069) and the Minjiang scholar plan. Y. C. and J. W. would like to acknowledge the support from Joint Funds for the innovation of science and Technology, Fujian province (No. 2021Y9228). M. T. and A. W. are grateful for the support of the Australian Research Council (DP210103151 and DE200100345), Cancer Australia (AppID_2010799), and the National Health and Medical Research Council (APP1173669, APP1185907). The authors would like to acknowledge the Shiyanjia Lab (http://www.shiyanjia.com) for performing particle concentration and size distribution characterization using ZetaView, TEM, EDS mapping, and nanoflow cytometry characterization.References
- R. L. Siegel, K. D. Miller, H. E. Fuchs and A. Jemal, Ca-Cancer J. Clin., 2022, 72, 7–33 CrossRef PubMed.
- H. Sung, J. Ferlay, R. L. Siegel, M. Laversanne, I. Soerjomataram, A. Jemal and F. Bray, Ca-Cancer J. Clin., 2021, 71, 209–249 CrossRef PubMed.
- S. Blandin Knight, P. A. Crosbie, H. Balata, J. Chudziak, T. Hussell and C. Dive, Open Biol., 2017, 7, 170070 CrossRef PubMed.
- T. B. Richards, A. Soman, C. C. Thomas, B. VanFrank, S. J. Henley, M. S. Gallaway and L. C. Richardson, Morb. Mortal. Wkly. Rep., 2020, 69, 201–206 CrossRef PubMed.
- J. Wang, Y. C. Kao, Q. Zhou, A. Wuethrich, M. S. Stark, H. Schaider, H. P. Soyer, L. L. Lin and M. Trau, Adv. Funct. Mater., 2021, 32, 2010296 CrossRef.
- A. Hoshino, H. S. Kim, L. Bojmar, I. R. Matei, W. R. Jarnagin and D. Lyden, Cell, 2020, 182, 1044–1061 CrossRef CAS PubMed.
- T. Saleem, A. Sumrin, M. Bilal, H. Bashir and M. B. Khawar, Saudi J. Biol. Sci., 2022, 29, 2063–2071 CrossRef CAS PubMed.
- F. Tian, S. Zhang, C. Liu, Z. Han and J. Sun, Nat. Commun., 2021, 12, 2536 CrossRef CAS PubMed.
- J. Deng, S. Zhao, J. Li, Y. Cheng, C. Liu, Z. Liu, L. Li, F. Tian, B. Dai and J. Sun, Angew. Chem., Int. Ed., 2022, 61, e202207037 CAS.
- A. Möller and R. J. Lobb, Nat. Rev. Cancer, 2020, 20, 697–709 CrossRef PubMed.
- W. Shen, X. Lin, C. Jiang, C. Li, H. Lin, J. Huang, S. Wang, G. Liu, X. Yan, Q. Zhong and B. Ren, Angew. Chem., Int. Ed., 2015, 127, 7416–7420 CrossRef.
- J. Wang, K. M. Koo, Y. Wang and M. Trau, Adv. Sci., 2019, 6, 1900730 CrossRef CAS PubMed.
- J. Wang, A. Wuethrich, R. J. Lobb, F. Antaw, A. A. I. Sina, R. E. Lane, Q. Zhou, C. Zieschank, C. Bell, V. F. Bonazzi, L. G. Aoude, S. Everitt, B. Yeo, A. P. Barbour, A. Möller and M. Trau, ACS Sens., 2021, 6, 3182–3194 CrossRef CAS PubMed.
- J. Ko, N. Bhagwat, S. S. Yee, N. Ortiz, A. Sahmoud, T. Black, N. M. Aiello, L. McKenzie, M. O’Hara, C. Redlinger, J. Romeo, E. L. Carpenter, B. Z. Stanger and D. Issadore, ACS Nano, 2017, 11, 11182–11193 CrossRef CAS PubMed.
- E. P. Diamandis, L. Goodglick, C. Planque and M. D. Thornquist, Clin. Cancer Res., 2011, 17, 2395–2399 CrossRef CAS PubMed.
- M. Infante, P. Allavena, C. Garlanda, M. Nebuloni, E. Morenghi, D. Rahal, M. Roncalli, S. Cavuto, S. Pesce, M. Monari, S. Valaperta, A. Montanelli, D. Solomon, E. Bottoni, V. Errico, E. Voulaz, M. Bossi, G. Chiesa, E. Passera, A. Mantovani and M. Alloisio, J. Cancer, 2016, 138, 983–991 CAS.
- W.-T. Huang, I.-W. Chong, H.-L. Chen, C.-Y. Li, C.-C. Hsieh, H.-F. Kuo, C.-Y. Chang, Y.-H. Chen, Y.-P. Liu, C.-Y. Lu, Y.-R. Liu and P.-L. Liu, Cancer Lett., 2019, 442, 287–298 CrossRef CAS PubMed.
- R. Lobb and A. Möller, US Pat., 20220365089-A1, 2022 Search PubMed.
- C. Théry, K. W. Witwer, E. Aikawa and M. J. Alcaraz, J. Extracell. Vesicles, 2018, 7, 1535750 CrossRef PubMed.
- R. Borah and S. W. Verbruggen, J. Phys. Chem. C, 2020, 124, 12081–12094 CrossRef CAS.
- Y. Li, Q. Shi, P. Zhang, Y. Xiahou, S. Li, D. Wang and H. Xia, J. Mater. Chem. C, 2016, 4, 6649–6656 RSC.
- W. Liao, Q. Lin, Y. Xu, E. Yang and Y. Duan, Nanoscale, 2019, 11, 5346–5354 RSC.
- S. Max and S. Schlücker, J. Raman Spectrosc., 2016, 47, 1012–1016 CrossRef.
- J. Wang, A. Wuethrich, A. A. I. Sina, R. E. Lane, L. L. Lin, Y. Wang, J. Cebon, A. Behren and M. Trau, Sci. Adv., 2020, 6, eaax3223 CrossRef CAS PubMed.
- J.-T. Zhang, H. Qin, F. K. M. Cheung, J. Su, D.-D. Zhang, S.-Y. Liu, X.-F. Li, J. Qin, J.-T. Lin, B.-Y. Jiang, S. Dong, R.-Q. Liao, N. Qiang, X.-N. Yang, H.-Y. Tu, Q. Zhou, J.-J. Yang, X.-C. Zhang, Y.-N. Zhang, Y.-L. Wu and W.-Z. Zhong, J. Extracell. Vesicles, 2019, 8, 1663666 CrossRef CAS PubMed.
- G. Frens, Nat. Phys. Sci., 1973, 241, 20–22 CrossRef CAS.
Footnotes |
| † Electronic supplementary information (ESI) available. See DOI: https://doi.org/10.1039/d2nh00570k |
| ‡ Equal contribution. |
| This journal is © The Royal Society of Chemistry 2023 |