
Homotypic and heterotypic adhesion of cancer cells revealed by force-induced remnant magnetization spectroscopy†
Jinxiu
Zhan
ab,
Di
Zhang
ab,
Feng
Feng
ab,
Min
Xu
 ab and
Li
Yao
*ab
ab and
Li
Yao
*ab
aState Key Laboratory for Structural Chemistry of Unstable and Stable Species, Institute of Chemistry, Chinese Academy of Sciences, CAS Research/Education Center for Excellence in Molecular Sciences, Beijing 100190, China. E-mail: yaoli@iccas.ac.cn
bUniversity of Chinese Academy of Sciences, Beijing 100049, China
First published on 5th June 2023
Abstract
Intercellular interaction has tremendous impacts on physiological processes, while unsuccessful cell–cell interaction causes diseases, such as tumorigenesis and metastasis. In-depth investigation of cell–cell adhesions is of great significance to understand the pathological state of cells, and for the rational design of drugs and therapies. Herein, we developed a force-induced remnant magnetization spectroscopy (FIRMS) method to measure cell–cell adhesion in a high throughput way. Our results showed that FIRMS is capable of quantifying and identifying cell–cell adhesion with high detection efficiency. Specifically, we quantified homotypic and heterotypic adhesion forces during tumor metastasis using breast cancer cell lines. We observed that homotypic and heterotypic adhesion forces of cancer cells were associated with degrees of malignancy. In addition, we revealed that CD43-ICAM-1 was a ligand–receptor pair mediating heterotypic adhesion of breast cancer cells to endothelial cells. These findings contribute to advance in-depth understanding of the process of cancer metastasis and provide insight into targeting intercellular adhesion molecules as a potential strategy to inhibit cancer metastasis.
New conceptsCurrent approach in diagnosis focuses mainly on microbiological, immunological, and pathological aspects rather than on the biomechanics of diseases. Nowadays, mechanical properties of living cells have been proposed to grade cancer cell metastasis potential with the development of measurement techniques, such as atomic force microscopy and magnetic tweezers. However, these manipulate techniques are applied to measure mechanical properties at single-cell level and have a relatively low detection throughput. Herein, we report a force-induced remnant magnetization spectroscopy (FIRMS) method based on MNPs probe for measuring cell–cell adhesion with high throughput. We demonstrate for the first time that FIRMS will be a valuable tool for exploring correlations between biomechanics and disease progression and for further cancer diagnosis. In addition, our study proves that cell adhesion mechanical phenotype is promising as a quantitative diagnostic method and as a potential target for therapeutics of cancer. |
Introduction
Cell–cell interaction plays crucial roles in tissue morphogenesis and homeostasis.1 It drives numerous physiological processes and enables coordinating cellular functions.2 Nowadays, it is broadly appreciated that cells are capable of establishing various homotypic and heterotypic cell–cell interactions to direct diverse processes. For instance, the immunological synapse formed between the lymphocyte and the antigen-presenting cell can regulate lymphocyte activation and the directional secretion of cytokines,3,4 epithelial cells assemble tight cell–cell junctions to maintain tissue structural integrity against mechanical perturbation while compartmentalizing physiological function,5–8 circulating leukocytes undergo sequential and dynamic cell–cell adhesion to bind to and then migrate across the endothelium toward the site of inflammation,9 myoblast cells form a fusogenic interface to recruit specific actin structures to ultimately drive fusion.1 Despite their distinct features and functional diversity, cell–cell interactions are generally tasked with integrating and interpreting multiple inputs (both biophysical and biochemical) and with generating sensitive and selective responses that drive a specific function.1 Disruption or alterations to these cell interaction events would lead to diseases, such as tumorigenesis and metastasis.10–13 Studies have shown that cancer cells undergo coordinated changes in adhesion molecule expression, cytoskeletal architecture and intracellular signalling to dynamically adjust intercellular interactions.14,15 During metastasis, cancer cells actively reduce homotypic adhesions to neighboring cells, escape from their primary site, and enter the blood systems. Subsequently, cancer cells translocate, interact with the endothelium lining the walls of blood vessels of distant tissues and exit from the blood systems. Finally, they survive and adapt to the microenvironment of distant tissues and form secondary tumors.16The molecular components that mediating intercellular interactions have begun to be understood thanks to remarkable advances in increasing array of molecular, biophysical and imaging techniques. One notable molecule is CD43, a cancer-specific marker, that involved in the adhesion and transmigration of cancer cells. It is detected in a variety of solid tumors, including breast, colon, gastric, and squamous cell lung cancers, but not in relative normal tissues and benign lesions.17–19 Park et al. reported that high expression of CD43 on the cell surface inhibits cellular adhesion to laminin and collagen IV, two components of extracellular matrix (ECM), thus favoring colorectal carcinoma cells to invade and metastasize.20 Fu et al. reported that targeting CD43 with small-interfering RNA in A549 lung cancer cells increased homotypic adhesion, decreased heterotypic adhesion and transendothelial migration, thereby inhibiting the spread of primary tumors in nude mice.14 Particularly, the expression level of CD43 in breast cancer cells correlated with the progression stage of the disease.21 Quantitative analysis of the intercellular interactions mediated by biochemical, genetic and biophysical signals can help elucidate how cancer cells regulate their adhesion and understand the specific correlation between cell adhesion of cancer cells and their metastatic potential from an analytical, diagnostic and cancer biology context.
Several techniques have been developed to investigate cell–cell interaction, including atomic force microscopy (AFM),19,22 optical tweezers23,24 and magnetic manipulation.15 However, these single-cell techniques employed to quantify intercellular adhesion are at a single cell level, thus requiring hundreds of repeated measurements. And the dynamic nature of cell–cell interaction requires more practical environment. Due to the ability of obtaining all of the interactions in a single measurement, force-induced remnant magnetization spectroscopy (FIRMS) can achieve high-throughput quantification of interactions at molecular or cell level. Based on our previous work in measuring intermolecular forces and cell–substrate forces,25–27 herein, we developed a method based on magnetic nanoparticles (MNPs) for high-throughput identifying and quantifying cell–cell interactions using FIRMS. Specifically, we quantified homotypic and heterotypic adhesion force during tumor metastasis using breast cancer cell lines with varying degrees of malignancy. Moreover, we unraveled the key molecule CD43 involved in the heterotypic adhesion of cancer cells to endothelial cells (ECs). These results add to our understanding of the process of metastasis and reveal the specific correlation between cell adhesion mechanical property of cancer cells and their metastatic potential. Using FIRMS method, alterations in cell adhesion, analyzed at tens of thousands of cells level, are promising to be identified as a feasible indicator of cancer-related changes and as a potential target for therapeutics of cancer.
Results and discussion
Experimental design of measuring the cell–cell adhesion force using FIRMS
Utilizing FIRMS for intercellular adhesion measurement, we developed a method for high-throughput quantification of cell–cell adhesion force. The general scheme is that the confluent lower monolayer cells are immobilized firmly on the PDMS substrates coated with fibronectin by 12 h adhesion, and the MNPs-labelled upper cells are seeded to the lower layer cells allowing for 30 min adhesion (Fig. 1a). Subsequently, the non-adherent cells were removed, the attached cells were magnetized 2 minutes using a magnet from same distance and direction to allow producing aligned magnetic dipoles in these magnetically labelled cells (Fig. 1b). After applying the external centrifugal force with increasing amplitude to cells, the overall magnetic signal of the MNPs-labelled cells is detected by FIRMS. Since the binding force varies with regard to the interaction time,28,29 long-time adhesion force between the lower cells and substrate far exceeds short-time adhesion force between the lower cells and upper cells. And the detachment of MNP-labelled cells caused random magnetic dipole orientations which means the decrease of the remanence signal recorded by FIRMS. Thus, the cell–cell dissociation rather than cell–substrate dissociation is indicated by a decrease in the magnetic signal. The relative cell–cell adhesion force was defined as the force corresponding to the half maximum signal. | ||
| Fig. 1 (a) Schematic illustration of the magnetic labelling of cells and adhesion assay. (b) Schematic of measuring the cell–cell interaction through FIRMS. | ||
Measurement of cell–cell adhesion force using FIRMS
To demonstrate the feasibility of the FIRMS technique for measuring cell–cell adhesion, we first validate the stability of long-time adhesion between cells and the substrates (Fig. 2a right panel). We labeled MDA-MB-231 cells with MNPs and seeded them on modified PDMS substrates to form confluent monolayers, and then performed the FIRMS measurements. The red line of Fig. 2b shows a typical relative remanence signal-force curve in a force range of 0–48 nN for the monolayer cells adhering to substrate. As the centrifugal force gradually increased to 48 nN, the magnetic signal remained constant which means MDA-MB-231 cells were still firmly attached to the substrate. It indicates the stability of long-time adhesion between cells and the substrates. Based on the stable adhesion of cell–substrate, we further tested the cell–cell adhesion between cells in the upper and lower layers (Fig. 2a left panel). Similarly, MNPs-labeled MDA-MB-231 cells were seeded on PDMS well modified with monolayers of MDA-MB-231 cells, and relative remanence signal-force curve was measured by FIRMS. The black curve of Fig. 2b indicates that the MNPs-labeled MDA-MB-231 cells gradually detached from the lower cells as the magnetic signal decreased with increasing force amplitude. Moreover, Fig. 2b shows that the dissociation force of cell–cell interaction is less than 48 nN, which further demonstrates that the decrease of magnetic signal is owing to the dissociation of cell–cell interaction rather than dissociation of cell–substrate. To exclude the possibility that the decrease in magnetic signal was caused by the instability of MNP probes, we tested the stability of magnetic probes incubated in cells. As shown in Fig. 2c, the magnetic signal remained unchanged within 36 h, further confirming that the decrease in signal was attributed to the intercellular dissociation. In addition, we investigated the relationship between intercellular force and adhesion time. The results showed no difference in intercellular adhesion between 0.5 and 2 h, but an obvious increase in 8 h (see Fig. S1, ESI†). Therefore, to exclude the variable of time, the FIRMS measurements and static cell–cell adhesion experiments were all conducted at a fixed adhesion time. Taken together, these observations suggest that FIRMS technique is capable for quantification of intercellular adhesion.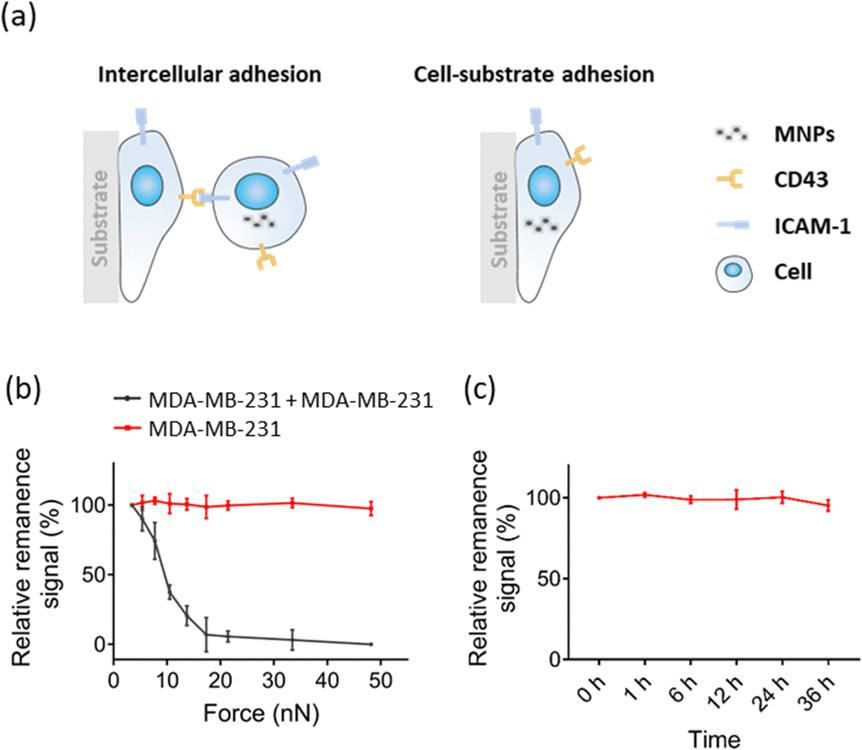 | ||
| Fig. 2 (a) Schematic illustration of measuring intercellular adhesion and cell–substrate adhesion. (b) Curve of the force-induced remanence signal decrease recorded by FIRMS. The black trace is the homotypic interaction of MDA-MB-231. The red trace is a control experiment which measures the long-time adhesion between monolayer cells (MDA-MB-231) and the substrate. (c) Curve of time-dependent remanence signal stability of cell–cell interaction without external force exertion. n = 3 replicates. Data are mean ± s.d. | ||
Quantification of homotypic adhesion of breast cancer cells
Cancer cells are tightly bound to neighboring cells and underlying basement membranes by adherens junctions, tight junctions, desmosomes and hemi-desmosomes, effectively immobilizing them in primary sites initially. However, as a tumor progresses, carcinoma cells liberate themselves from these associations and begin to migrate.16 Furthermore, it has been reported that migration and invasion potentials of cancer cell positively correlate with its malignancy.30 Therefore, it is of great significance to study the interaction between cancer cells with different malignancy. Based on the above method of cell–cell adhesion measured by FIRMS, herein, we explored the cell–cell interaction of a nonneoplastic, human mammary epithelial cell line MCF-10A and two breast cancer cell lines (MDA-MB-231 and MCF-7) with different levels of malignancy. As shown in Fig. 3a, the homotypic adhesion of three cancer cells exhibited different unbinding force ranges. Cancer cells with higher malignancy have weaker homotypic intercellular adhesion. The relative adhesion force was defined as the force corresponding to the half maximum signal. Fig. 3b shows that the homotypic intercellular adhesion force of MDA-MB-231 and MCF-7 is 7 ± 1 nN and 9 ± 1 nN, respectively. In comparison to 12 ± 1 nN of MCF-10A, this demonstrates that homotypic cell–cell interaction is weaker in breast cancer cells relative to the nonneoplastic cell line. This result is consistent with the cellular forces obtained by other techniques.31 To further verify the accuracy of the results, static adhesion assays were performed. We calculated the percentage of adhered cells for two breast cancer cell lines (MDA-MB-231 and MCF-7) with respect to the control (MCF-10A). As shown in Fig. 3c, MDA-MB-231 and MCF-7 exhibited an ∼55% and ∼16% decrease in homotypic adhesion in comparison with non-malignant epithelial cell MCF-10A. Previous studies suggested that reduced homotypic cell–cell interactions facilitate tumor cells escaping from their primary site and adhering to the collagen fibers of the matrix, thereby favoring the migration of tumor cells and the formation of metastasis site.32,33 Altogether, the above results indicate that FIRMS technique could be applied to identify tumor cells with varying degrees of malignancy by quantifying cell–cell adhesion.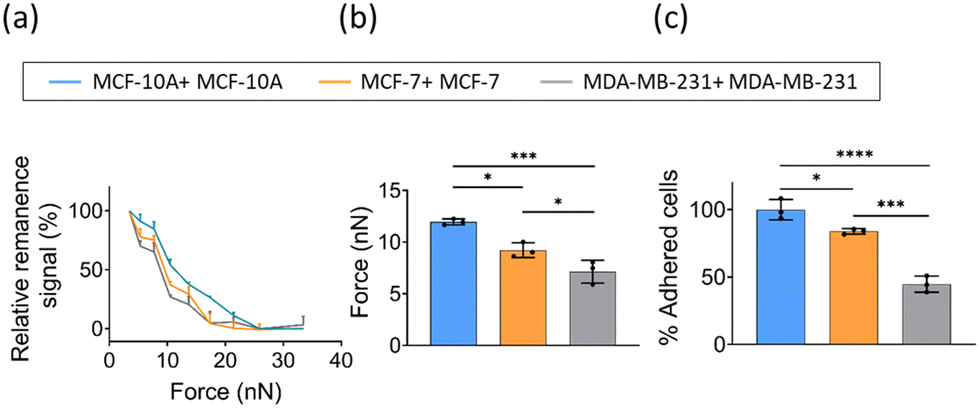 | ||
| Fig. 3 (a) Curve of the force-induced remanence signal decrease of homotypic adhesion of breast cancer cells (MDA-MB-231, MCF-7, and MCF-10A) recorded by FIRMS. (b) Force of homotypic cell-cell adhesion measured by FIRMS. (c) The percentage of homotypic adhesion of three cancer cell lines in comparison with non-malignant epithelial cell MCF-10A. The blue, orange, and grey traces represent the homotypic interactions of MCF-10A, MCF-7, and MDA-MB-231 cells, respectively. n = 3 replicates. Data are mean ± s.d. * P ≤ 0.05, ** P ≤ 0.01, *** P ≤ 0.001, **** P ≤ 0.0001, one-way ANOVA. | ||
Quantification of heterotypic adhesion between breast cancer cells and ECs
Homotypic adhesion of tumor cells refers to the adhesion between tumor cells, while heterotypic adhesion of tumor cells is the adhesion of tumor cells to other cells or extracellular matrix (Fig. 4a). The heterotypic adhesion of cancer cells to endothelial cells represents a crucial step involved in intravasation and extravasation during cancer metastasis. To explore whether the heterotypic adhesion force varies with the malignancy of cancer cells, we evaluated the interaction of ECs and cancer cells with different levels of malignancy (MDA-MB-231, MCF-7, and MCF-10A). Similarly, FIRMS experiments were performed using a HUVEC monolayer as the substrate and MNP-labeled cancer cells were added to the HUVEC monolayer. Force curves were analyzed and the heterotypic adhesion forces between ECs and three breast cancer cell lines were obtained. The results in Fig. 4b showed a similar signal decrease with the force increasing to 48 nN. The heterotypic unbinding force for breast cancer cells ranged between 3 nN and 48 nN.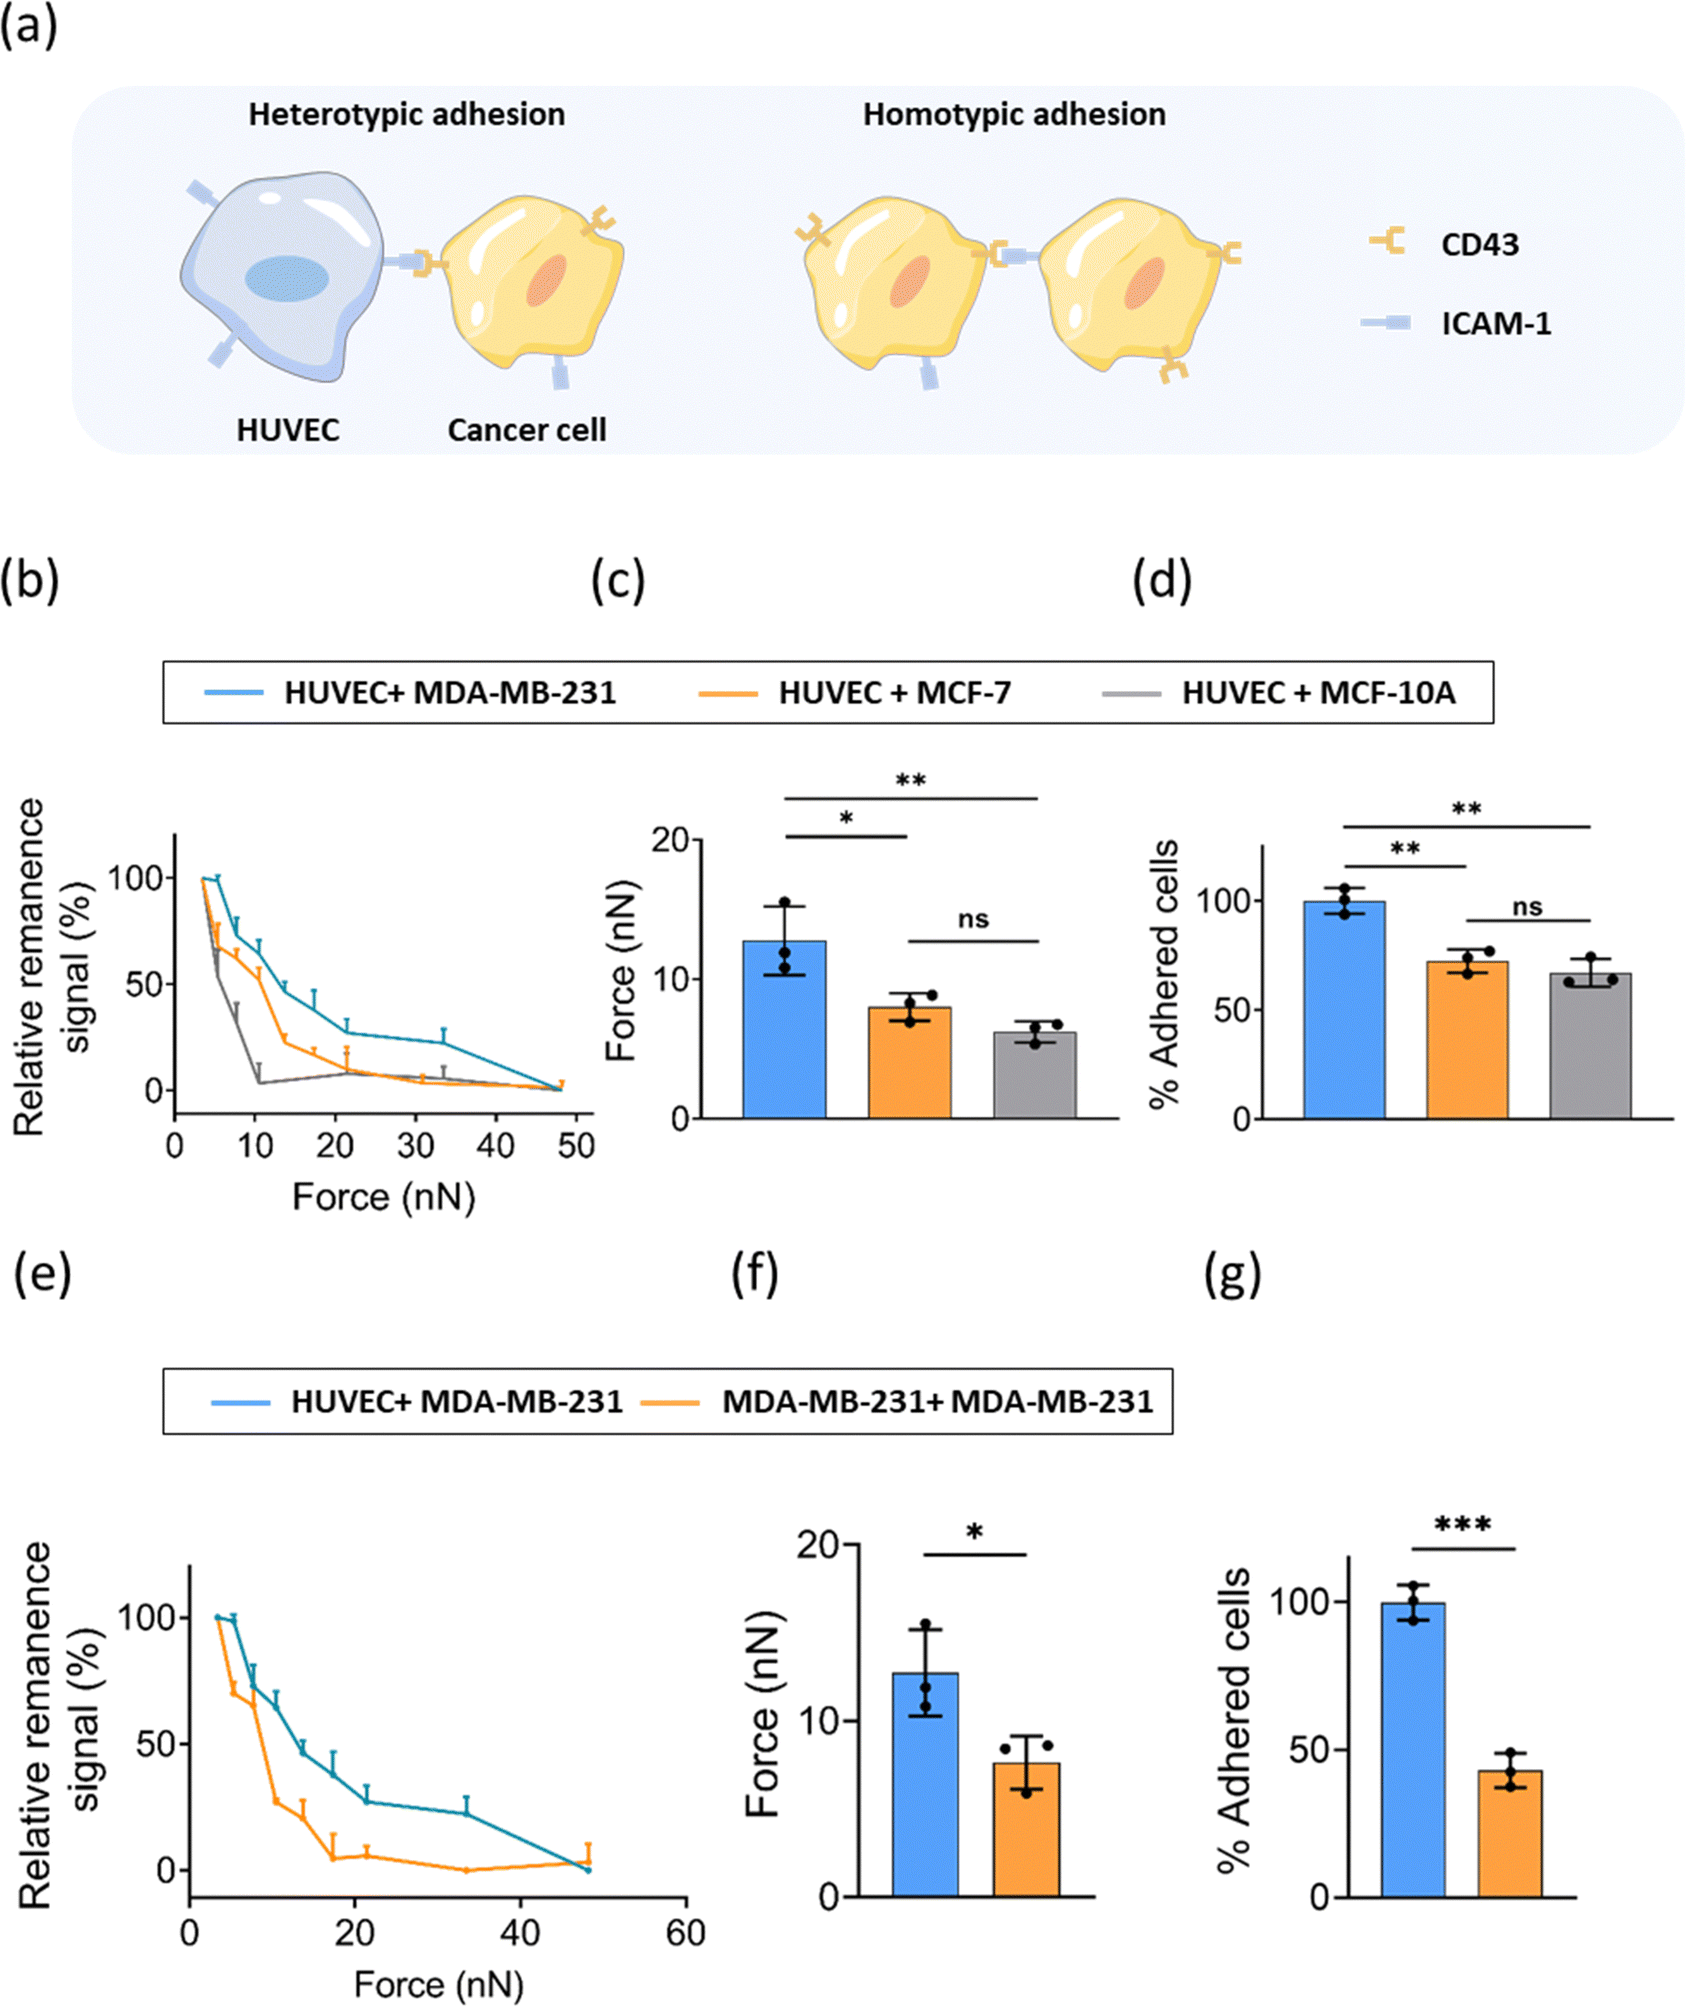 | ||
| Fig. 4 (a) Schematic illustration of heterotypic adhesion and homotypic adhesion. (b) Curve of the force-induced remanence signal decrease of three types of heterotypic cell–cell interactions recorded by FIRMS. The blue, orange, and gray traces represent the heterotypic interactions of MDA-MB-231, MCF-7, and MCF-10A cells with ECs, respectively. (c) Heterotypic cell–cell adhesion force measured by FIRMS. (d) The percentage of heterotypic adhesion of three cancer cells adhering to ECs in comparison with MDA-MB-231. (e) Curve of the force-induced remanence signal decrease of homotypic interactions of MDA-MB-231 and heterotypic interactions between MDA-MB-231 and ECs. (f) Homotypic interaction force of MDA-MB-231 and heterotypic interaction force between MDA-MB-231 and ECs measured by FIRMS. (g) The percentage of homotypic adhesion of MDA-MB-231 in comparison with heterotypic adhesion between MDA-MB-231 and ECs. n = 3 replicates. Data are mean ± s.d. ns: no significant difference, * P ≤ 0.05, ** P ≤ 0.01, *** P ≤ 0.001, **** P ≤ 0.0001, one-way ANOVA. | ||
The most invasive MDA-MB-231 cells exhibited the strongest unbinding forces of 13 ± 2 nN among three cell lines, whereas the moderate malignancy cancer cell MCF-7 and non-malignant epithelial cell MCF-10A exhibited unbinding forces of 8 ± 1 nN and 6 ± 1 nN, respectively (Fig. 4c). The enhanced heterotypic adhesion ability of tumor cells means that cells are easier to adhere to extracellular matrix or other cells during metastasis, promoting transendothelial migration.14 The normalized results of static adhesion assays supported the FIRMS results (Fig. 4d). MCF-7 and MCF-10A exhibited an ∼28% and ∼33% decrease in heterotypic adhesion compared with MDA-MB-231. Surprisingly, we only observed statistically significant heterotypic adhesion differences between MDA-MB-231 cell line and the other two cell lines in both FIRMS results and static adhesion results. No statistical difference was found between MCF-7 and MCF-10A cell line. This is possibly because MCF-7 is a noninvasive and nonmetastatic cell line,34 which may share a similar heterotypic adhesion property with epithelial cell line MCF-10A. These results indicate that, to a certain extent, adhesion properties of cancer cells may not correlate with malignancy. Diverse factors need to be taken into account to comprehensively evaluate the malignancy of cancer cells.
Moreover, we further compared the homotypic adhesion and heterotypic adhesion of MDA-MB-231. It is notable that the heterotypic cell–cell adhesion between MDA-MB-231 and ECs was obviously stronger than homotypic adhesion of MDA-MB-231 cells (Fig. 4e–g). As tumor develops, tumor cells detach from the primary site and adhere to endothelial cells of blood vessels, thus metastasizing to other sites. Our findings provide specific experimental values support for the tendency towards weak homotypic adhesion and strong heterotypic adhesion during tumor metastasis.
Unraveling the receptor–ligand interactions between cancer cell and HUVEC using FIRMS
Cancer cells display specific adhesion molecules that enable them to adhere to microvessels in specific organs. CD43 (sialophorin) was reported to be a cancer-specific molecule that participates in cell–cell adhesion, intracellular signaling, migration, proliferation, and apoptosis.35 It was found to inhibit the homotypic adhesion of cancer cells,20 as well as cell adhesion to ECM, and to favor adhesion to endothelial cells.14,36 Furthermore, the expression of CD43 in lung, cervix, colon, breast, and salivary gland cancers has been associated with malignancy.18,36,37 Studies show that CD43 plays a role in cell–cell adhesion probably via interactions with its putative ligand ICAM-1.19,38,39 ICAM-1 is a cell-surface glycoprotein consisting of five extracellular immunoglobulin-like domains, which is expressed on various cells, including ECs, leukocytes, B cells, T cells and some cancer cells.40–42 Given that the molecules involved in the adhesion of breast cancer cells to ECs are not yet as clearly identified, we next explore whether CD43-ICAM-1 mediates the interaction between breast cancer cells to ECs using FIRMS. We first evaluated the role of CD43 in the adhesion of cancer cells to ECs in vitro. We detected the expression of CD43 in cancer cells with different levels of malignancy (MDA-MB-231, MCF-7 and MCF-10A). Immunofluorescence staining assay and western blot assay showed that CD43 was expressed by these cell lines at different levels. Weak expression of CD43 was observed on MCF-7 and MCF-10A cells, whereas more invasive MDA-MB-231 cells showed a higher expression of CD43 (Fig. 5a–c). Additionally, we observed that CD43 showed a polarity distribution in MDA-MB-231 cells, which is in agreement with the results from other reports that CD43 tends to polarized distribution in different cell types.43,44 Meanwhile, we observed that heterotypic adhesion force increased with the invasiveness of cancer cells (to see Fig. 4b–d), which was consistent with the expression of the adhesion molecule CD43 in different cancer cells. This may indicate that heterotypic adhesion of breast cancer cells to ECs is mediated by CD43.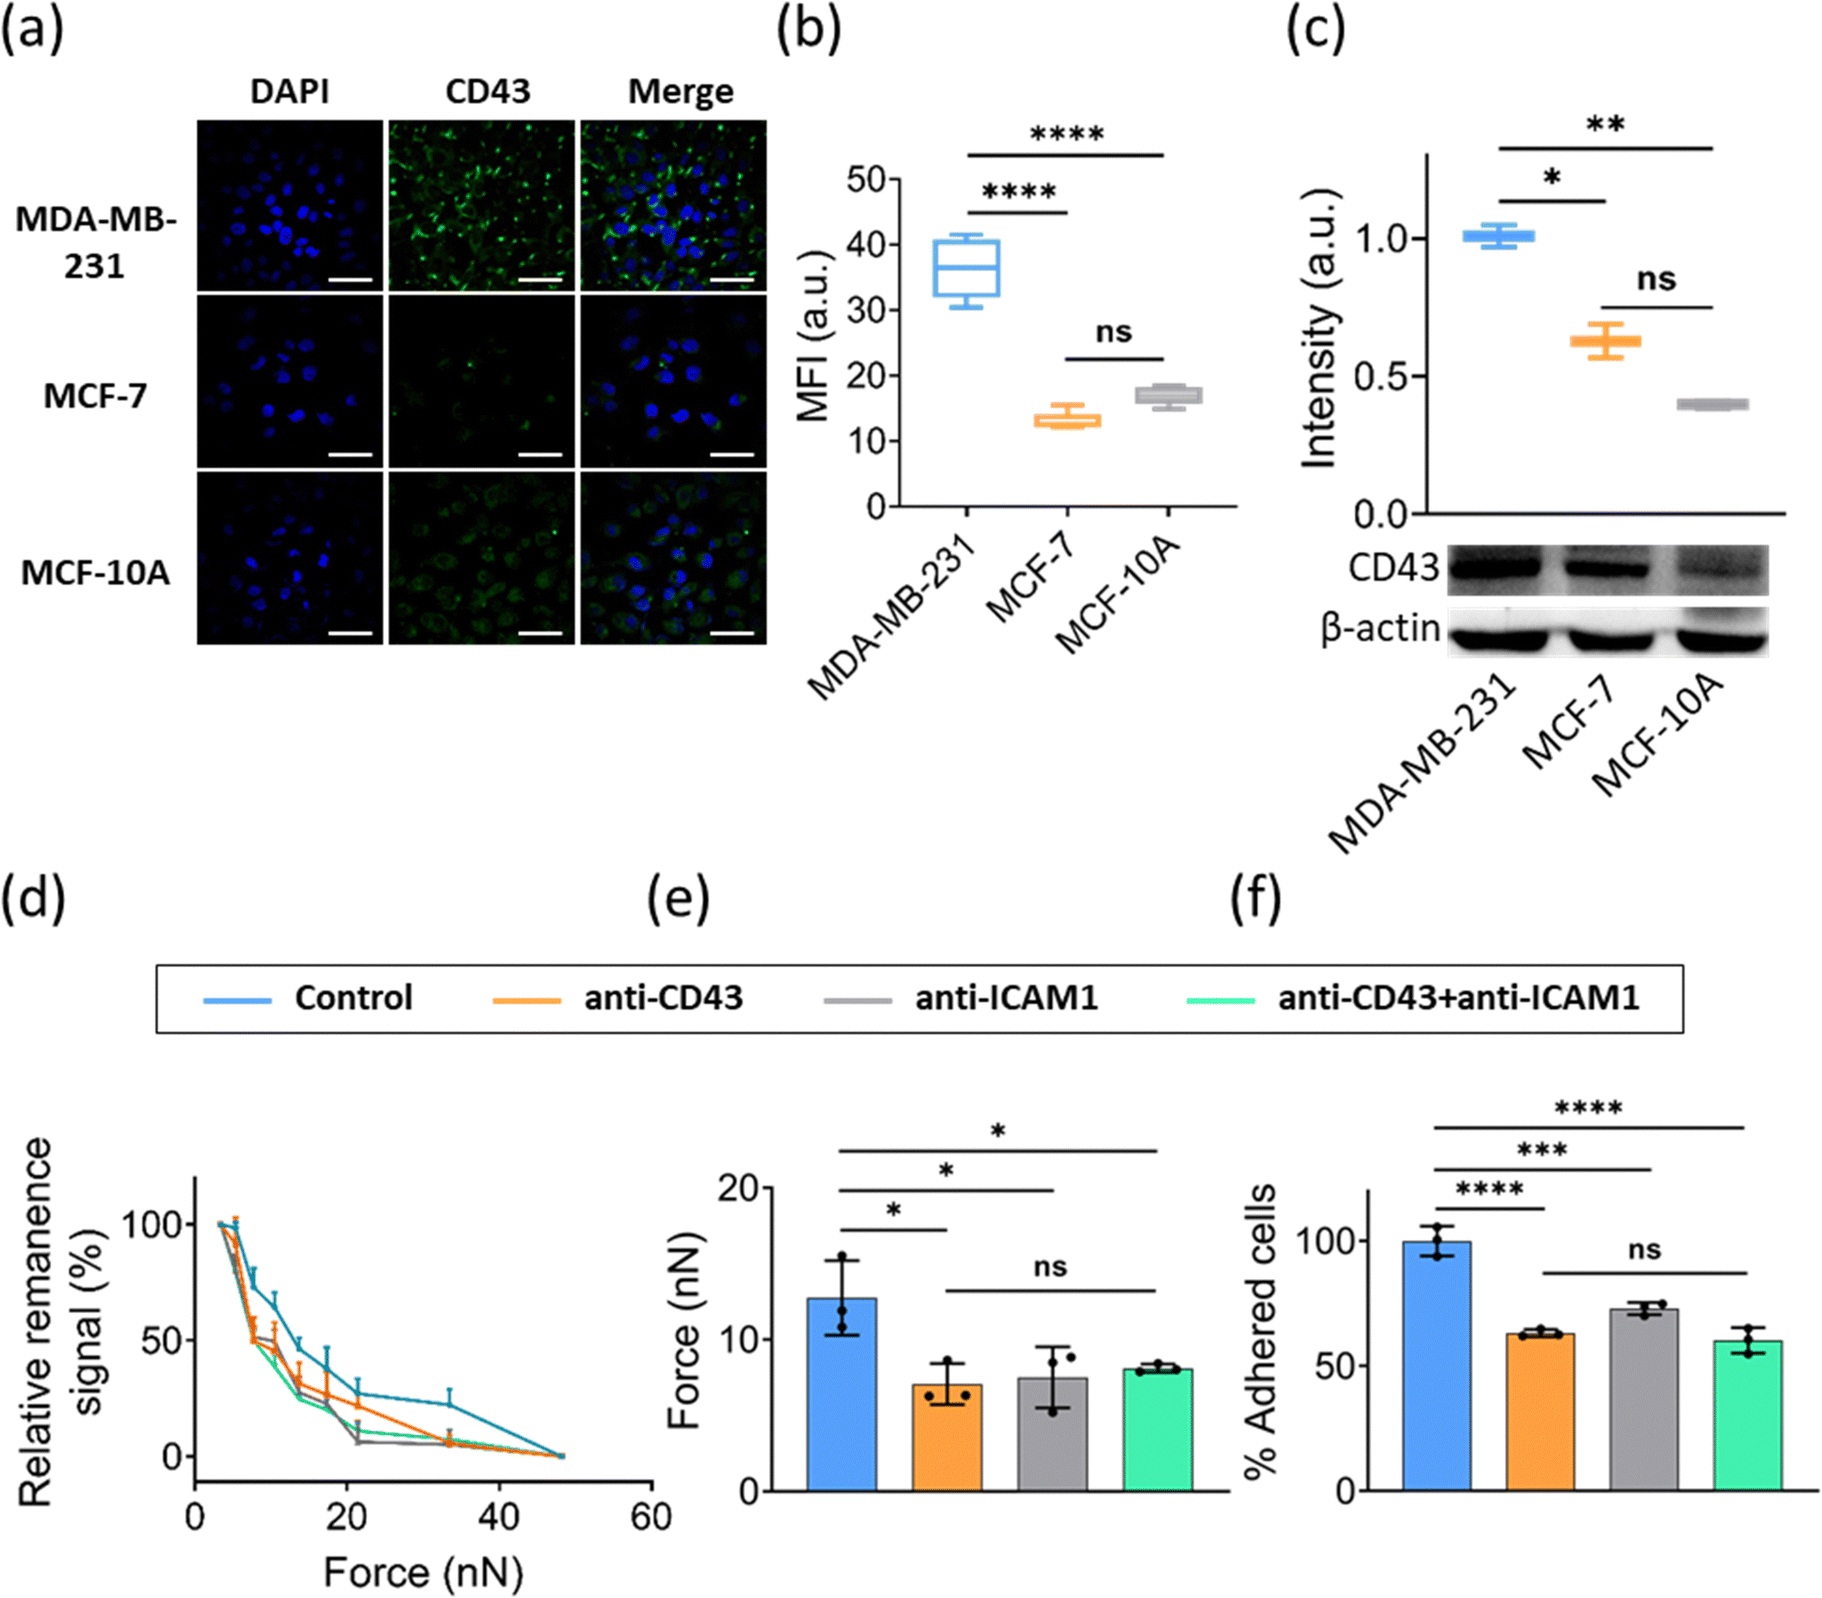 | ||
| Fig. 5 (a) Representative immunofluorescence images of MDA-MB-231, MCF-7 and MCF-10A cells stained with CD43 and DAPI. Scale bar is 50 μm. (b) Statistical analysis of CD43 fluorescence intensity in (a). (c) Western blot analysis of CD43 expression in MDA-MB-231, MCF-7 and MCF-10A cells. The intensity is calculated by the ratio of the gray value between CD43 and β-actin. (d) FIRMS measurement of interaction force between HUVECs and MDA-MB-231 cells with or without blocking ICAM-1, CD43, and ICAM-1 + CD43. (e) FIRMS measurement of heterotypic adhesion force between MDA-MB-231 cells and HUVECs while blocking ICAM-1, CD43, and ICAM-1 + CD43. (f) The percentage of heterotypic adhesion of MDA-MB-231 cells adhering to ECs while blocking ICAM-1, CD43, and ICAM-1 + CD43. n = 3 replicates. Data are mean ± s.d. ns: no significant difference, * P ≤ 0.05, ** P ≤ 0.01, *** P ≤ 0.001, **** P ≤ 0.0001, one-way ANOVA. | ||
To ascertain whether the CD43 expressed on cancer cells mediates the adhesion of cancer cells to endothelial cells via interaction with ICAM-1, MDA-MB-231 cells were used for the subsequent experiments because they express a higher level of CD43 as compared with other two cell lines (see Fig. 5a–c). Specific monoclonal antibodies were used to block ICAM-1 expressed on ECs and CD43 expressed on MDA-MB-231 before the FIRMS measurements and heterotypic static adhesion assays. As the FIRMS result shown in Fig. 5d, force ranges reduced in all blocking sets. Force histograms demonstrated that blocking CD43, ICAM-1, or CD43 + ICAM-1 as compared with the control without antibodies treatment showed a 36–43% decrease of heterotypic adhesion force (Fig. 5e). Static adhesion assays showed a similar result (Fig. 5f and Fig. S2, ESI†). The percentage of normalized adhesion after blocking CD43, ICAM-1, or CD43 + ICAM-1 decreased 37%, 27%, and 40% as compared with the control, respectively. Taken altogether, these results suggest that the interaction of MDA-MB-231 cells with HUVECs is mainly mediated by CD43-ICAM-1, and add to our understanding of the process of metastasis that the sites of cancer metastasis probably depend on where cancer cells adhere to the endothelium and extravasate through interaction of CD43 with its ligand ICAM-1.
Conclusions
In summary, a MNP-based FIRMS method is developed for measuring cell–cell adhesion in a high-output way. Our results showed that FIRMS is a valuable tool to quantify and identify cell–cell adhesion with high detection efficiency. Specifically, we quantified the homotypic and heterotypic adhesions of cancer cells with different levels of invasiveness. Our results demonstrated that cell–cell adhesion forces vary with invasiveness of cancer cells. We revealed that cancer cells with high invasiveness harbor lower homotypic adhesion and stronger heterotypic adhesion with ECs, which provides specific experimental evidence for the fact that cancer cells with high invasiveness are more likely to metastasize. In addition, we proved that CD43–ICAM1 mediated the adhesion of breast cancer cells to ECs.Current diagnosis approach concentrates mainly on pathological, microbiological, and immunological aspects rather than on the biomechanics of diseases. The links between biomechanics and pathological state of diseases are gradually being recognized with the development of force measurement technologies.45,46 Cell adhesion is a typical mechanical property that correlates with the physiological states and functions of cells.47,48 The results presented here show that cell adhesion mechanical property can be used to grade the metastatic potential of cell populations. The sensitive measurements of mechanical properties using FIRMS, can be performed in short periods of time, providing potentially unique information about the patient's cancer including metastatic potential. These insights into biomechanical changes during cancer progression indicate that pathways regulating these mechanical phenotypes are novel targets for molecular therapy of cancer. Additionally, despite the advancements made by force measurement technologies, many challenges remain to detailed analysis of cell interactions. For example, the primary limitation of FIRMS is that it measures the interactions of large number of cells with low temporal resolution of minute level. Further efforts will be made to improve FIRMS technique to monitor the dynamic process of cell interactions with high temporal resolution and enhance the compatibility of this technique within in vivo systems.
Author contributions
Jinxiu Zhan conceived the project, designed and performed all experiments, analyzed the data, and wrote the manuscript; Di Zhang proposed the method of measuring the intercellular force using FIRMS; Feng Feng and Min Xu assisted with analysis of fluorescence data and FIRMS data, respectively; Li Yao supervised all experiments and revised the manuscript.Conflicts of interest
There are no conflicts to declare.Acknowledgements
This research was supported by grants from the National Natural Science Foundation of China (22177114, 21778055), the National Key Research and Development Program of China (2018YFA0208800), the Chinese Academy of Sciences (YJKYYQ20210010).References
- B. Belardi, S. Son, J. H. Felce, M. L. Dustin and D. A. Fletcher, Nat. Rev. Mol. Cell Biol., 2020, 21, 750–764 CrossRef CAS.
- T. J. Bechtel, T. Reyes-Robles, O. O. Fadeyi and R. C. Oslund, Nat. Chem. Biol., 2021, 17, 641–652 CrossRef CAS PubMed.
- M. Huse, Nat. Rev. Immunol., 2017, 17, 679–690 CrossRef CAS.
- M. L. Dustin, A. K. Chakraborty and A. S. Shaw, Cold Spring Harbor Perspect. Biol., 2010, 2, a002311 CAS.
- B. M. Gumbiner, Cell, 1996, 84, 345–357 CrossRef CAS.
- S. Tyler, Integr. Comp. Biol., 2003, 43, 55–63 CrossRef PubMed.
- M. Takeichi, Nat. Rev. Mol. Cell Biol., 2014, 15, 397–410 CrossRef CAS PubMed.
- C. Zihni, C. Mills, K. Matter and M. S. Balda, Nat. Rev. Mol. Cell Biol., 2016, 17, 564–580 CrossRef CAS.
- S. Yamada and W. J. Nelson, Annu. Rev. Biochem., 2007, 76, 267–294 CrossRef CAS.
- P. Friedl and S. Alexander, Cell, 2011, 147, 992–1009 CrossRef CAS PubMed.
- M. Janiszewska, M. C. Primi and T. Izard, J. Biol. Chem., 2020, 295, 2495–2505 CrossRef CAS.
- E. Farahani, H. K. Patra, J. R. Jangamreddy, I. Rashedi, M. Kawalec, R. K. R. Pariti, P. Batakis and E. Wiechec, Carcinogenesis, 2014, 35, 747–759 CrossRef CAS PubMed.
- J. S. Desgrosellier and D. A. Cheresh, Nat. Rev. Cancer, 2010, 10, 9–22 CrossRef CAS PubMed.
- Q. W. Fu, S. E. Cash, J. J. Andersen, C. R. Kennedy, D. G. Oldenburg, V. B. Zander, G. R. Foley and C. S. Shelley, Int. J. Cancer, 2013, 132, 1761–1770 CrossRef CAS PubMed.
- A. Labernadie, T. Kato, A. Brugues, X. Serra-Picamal, S. Derzsi, E. Arwert, A. Weston, V. Gonzalez-Tarrago, A. Elosegui-Artola, L. Albertazzi, J. Alcaraz, P. Roca-Cusachs, E. Sahai and X. Trepat, Nat. Cell Biol., 2017, 19, 224–237 CrossRef CAS PubMed.
- C. L. Chaffer and R. A. Weinberg, Science, 2011, 331, 1559–1564 CrossRef CAS PubMed.
- F. M. Tuccillo, C. Palmieri, G. Fiume, A. D. Laurentiis, M. Schiavone, C. Falcone, E. Iaccino, R. Galandrini, C. Capuano, A. Santoni, F. P. D'Armiento, C. Arra, A. Barbieri, F. D. Piaz, D. Venzon, P. Bonelli, F. M. Buonaguro, I. Scala, M. Mallardo, I. Quinto and G. Scala, Mol. Cancer Ther., 2014, 13, 752–762 CrossRef CAS PubMed.
- J. Fernandez-Rodriguez, C. X. Andersson, S. Laos, D. Baeckstrom, A. Sikut, R. Sikut and G. C. Hansson, Tumour Biol., 2002, 23, 193–201 CrossRef CAS PubMed.
- V. Sundar Rajan, V. M. Laurent, C. Verdier and A. Duperray, Biophys. J., 2017, 112, 1246–1257 CrossRef CAS PubMed.
- W. S. Park, H. J. Kim, G. K. Lee, H. S. Son and Y. Bae, Exp. Mol. Pathol., 2012, 92, 82–89 CrossRef CAS PubMed.
- P. Tassone, P. Bonelli, F. Tuccillo, H. M. Bond, F. P. D'Armiento, E. Galea, C. Palmieri, P. Tagliaferri, P. G. Natali and S. Venuta, Anticancer Res., 2002, 22, 2333–2340 CAS.
- J. Dehullu, C. Valotteau, P. Herman-Bausier, M. Garcia-Sherman, M. Mittelviefhaus, J. A. Vorholt, P. N. Lipke and Y. F. Dufrene, Nano Lett., 2019, 19, 3846–3853 CrossRef CAS PubMed.
- A. J. Crick, M. Theron, T. Tiffert, V. L. Lew, P. Cicuta and J. C. Rayner, Biophys. J., 2014, 107, 846–853 CrossRef CAS PubMed.
- S. N. Kariuki, A. Marin-Menendez, V. Introini, B. J. Ravenhill, Y. C. Lin, A. Macharia, J. Makale, M. Tendwa, W. Nyamu, J. Kotar, M. Carrasquilla, J. A. Rowe, K. Rockett, D. Kwiatkowski, M. P. Weekes, P. Cicuta, T. N. Williams and J. C. Rayner, Nature, 2020, 585, 579–583 CrossRef CAS PubMed.
- M. Xu, X. Feng, F. Feng, H. Pei, R. Liu, Q. Li, C. Yu, D. Zhang, X. Wang and L. Yao, Nanoscale, 2020, 12, 14573–14580 RSC.
- L. Yao, Y. Li, T. W. Tsai, S. J. Xu and Y. H. Wang, Angew. Chem., Int. Ed., 2013, 52, 14041–14044 CrossRef CAS PubMed.
- Q. Hu and S. Xu, Angew. Chem., Int. Ed., 2014, 53, 14135–14138 CrossRef CAS PubMed.
- V. Dupres, F. D. Menozzi, C. Locht, B. H. Clare, N. L. Abbott, S. Cuenot, C. Bompard, D. Raze and Y. F. Dufrene, Nat. Methods, 2005, 2, 515–520 CrossRef CAS PubMed.
- H. Kim, K. Ishibashi, K. Matsuo, A. Kira, T. Okada, K. Watanabe, M. Inada and C. Nakamura, Anal. Chem., 2019, 91, 10557–10563 CrossRef CAS PubMed.
- B. Wang, P. Guo and D. T. Auguste, Biomaterials, 2015, 57, 161–168 CrossRef CAS PubMed.
- S. P. Palecek, J. C. Loftus, M. H. Ginsberg, D. A. Lauffenburger and A. F. Horwitz, Nature, 1997, 385, 537–540 CrossRef CAS.
- T. T. Onder, P. B. Gupta, S. A. Mani, J. Yang, E. S. Lander and R. A. Weinberg, Cancer Res., 2008, 68, 3645–3654 CrossRef CAS PubMed.
- L. Shapiro, A. M. Fannon, P. D. Kwong, A. Thompson, M. S. Lehmann, G. Grubel, J. F. Legrand, J. Alsnielsen, D. R. Colman and W. A. Hendrickson, Nature, 1995, 374, 327–337 CrossRef CAS PubMed.
- J. Welsh, in Animal Models for the Study of Human Disease, ed. P. M. Conn, Academic Press, Boston, 2013, pp. 997–1018 DOI:10.1016/B978-0-12-415894-8.00040-3.
- J. R. Ostberg, R. K. Barth and J. G. Frelinger, Immunol. Today, 1998, 19, 546–550 CrossRef CAS PubMed.
- Q. Fu, S. E. Cash, J. J. Andersen, C. R. Kennedy, A. R. Madadi, M. Raghavendra, L. L. Dietrich, W. A. Agger and C. S. Shelley, Br. J. Cancer, 2014, 110, 146–155 CrossRef CAS PubMed.
- D. Vega-Mendoza, A. Canas-Linares, A. Flores-Alcantar, R. Espinosa-Neira, E. Melchy-Perez, R. Vera-Estrella, C. Auvynet and Y. Rosenstein, J. Cell. Physiol., 2021, 236, 6643–6656 CrossRef CAS PubMed.
- Y. Rosenstain, J. K. Park, W. C. Hahn, F. S. Rosen, B. E. Bierer and S. J. Burakoff, Nature, 1991, 354, 233–235 CrossRef PubMed.
- P. Ziprin, N. A. Alkhamesi, P. F. Ridgway, D. H. Peck and A. W. Darzi, Biol. Chem., 2004, 385, 755–761 CAS.
- X. H. Zhang, A. Chen, D. D. Leon, H. Li, E. Noiri, V. T. Moy and M. S. Goligorsky, Am. J. Physiol.: Heart Circ. Physiol., 2004, 286, H359–H367 CrossRef CAS PubMed.
- X. H. Zhang, E. Wojcikiewicz and V. T. Moy, Biophys. J., 2002, 83, 2270–2279 CrossRef CAS PubMed.
- L. A. Stanciu and R. Djukanovic, Eur. Respir. J., 1998, 11, 949–957 CrossRef CAS PubMed.
- E. Gubina, T. Chen, L. Zhang, E. F. Lizzio and S. Kozlowski, Blood, 2002, 99, 2518–2525 CrossRef CAS PubMed.
- N. D. L. Savage, S. L. Kimzey, S. K. Bromley, K. G. Johnson, M. L. Dustin and J. M. Green, J. Immunol., 2002, 168, 3740–3746 CrossRef CAS PubMed.
- M. Krieg, G. Flaschner, D. Alsteens, B. M. Gaub, W. H. Roos, G. J. L. Wuite, H. E. Gaub, C. Gerber, Y. F. Dufrene and D. J. Muller, Nat. Rev. Phys., 2019, 1, 41–57 CrossRef.
- W. D. Zhao, M. J. Cai, H. J. Xu, J. G. Jiang and H. D. Wang, Nanoscale, 2013, 5, 3226–3229 RSC.
- J. Zhan, F. Feng, M. Xu, L. Yao and M. Ge, Acta Phys. -Chim. Sin., 2020, 36, 1905076 Search PubMed.
- D. Zhang, F. Feng, R. Liu, W. Zhu and L. Yao, Chin. Chem. Lett., 2019, 30, 7–14 CrossRef CAS.
Footnote |
| † Electronic supplementary information (ESI) available. See DOI: https://doi.org/10.1039/d2nh00410k |
| This journal is © The Royal Society of Chemistry 2023 |