 Open Access Article
Investigation of a two-dimensional photovoltaic thermal system using hybrid nanofluids and a rotating cylinder
Mohammad
Akram
a,
Abid A.
Memon
b,
M. Asif
Memon
 bc,
A. M.
Obalalu
d and
Umair
Khan
 *e
*e
aDepartment of Mathematics, Faculty of Science, Islamic University of Madinah, P.O. Box 170, Madinah 42351, Saudi Arabia. E-mail: akramkhan_20@rediffmail.com
bDepartment of Mathematics and Social Sciences, Sukkur IBA University, Sukkur, 65200, Sindh, Pakistan. E-mail: abid.ali@iba-suk.edu.pk; asif-memon@iba-suk.edu.pk
cDepartment of Mathematics and Statistics, Faculty of Applied Sciences and Technology, Universiti Tun Hussein Onn, Malaysia Batu Pahat 86400, Johar, Malaysia
dDepartment of Mathematical Sciences, Augustine University Ilara-Epe, Lagos, Nigeria. E-mail: adebowale.obalalu17@kwasu.edu.ng
eDepartment of Computer Science and Mathematics, Lebanese American University, Byblos, Lebanon. E-mail: umair.khan@lau.edu.lb
First published on 21st September 2023
Abstract
This article focuses on a numerical investigation aimed at enhancing the electrical performance of a two-dimensional photovoltaic thermal system (PV/T) through the application of cooling using hybrid nanofluids. The hybrid nanofluids consist of titanium oxide and silver nanoparticles suspended in water, while the PV/T system is based on polycrystalline silicon, copper, and a flow channel with a rotating cylinder. PV/T devices generate electricity from sunlight, but their performance degrades over time due to the heat generated by solar radiation. Therefore, nanofluids can be circulated through the bottom flow channel to cool the device. This study utilizes 2D incompressible Navier–Stokes equations to control fluid flow and energy equations to manage energy distribution. The COMSOL 6.0 finite element software is employed for comprehensive modeling and simulation. To enhance the performance of the PV/T system, a parametric study is conducted by varying the Reynolds number (ranging from 100 to 1000), cylinder rotational speed (varying from 0.01 to 0.2 m s−1), and silver volume fraction (ranging from 0.01 to 0.2). The results show that increasing the Reynolds number and the volume fraction of silver leads to a reduction in the maximum temperature of the cell. The maximum temperature of the cell also decreases with the rotational speed of the cylinder but only for high Reynolds numbers. By applying the present model, the cell's efficiency is improved by 5.93%.
1. Introduction
It is evident that in the development of any country, particularly those in the process of development, electrical energy plays a pivotal role in running both governmental and private industries. Traditionally, energy has been generated using fossil fuels, a practice that raises global environmental concerns and contributes to global warming.1–4 However, as we consider the growing demand for electrical energy, it becomes apparent that the availability of fossil fuel resources for electricity generation is limited and poses challenges for developing nations. Hence, there is an urgent need to transition to renewable and sustainable energy sources that are environmentally friendly.5–7 Harnessing electrical power from solar energy stands out as a highly sustainable and renewable alternative, surpassing other available options. This transition is particularly advantageous for countries with abundant sunlight throughout most of the year, as it can provide a consistent source of energy.Photovoltaic thermal systems represent a highly advanced method for electricity generation using direct solar radiation. However, when a PV/T module is exposed to sunlight, the surrounding atmospheric temperature can adversely affect its performance, leading to a reduction in the solar panel's electrical efficiency.8–10 To address this issue, a flow channel is integrated behind the PV/T module, allowing a coolant such as water, air, or nanofluids to circulate and effectively lower the temperature of the PV/T system. The heated fluid produced by this process can also serve other heating purposes, particularly in industrial settings. A photovoltaic thermal system is designed to simultaneously produce both heat and electricity. Numerous research articles have focused on enhancing and advancing photovoltaic systems by introducing new designs and configurations.11–15 Due to its ability to efficiently harness both electrical and thermal energy through various techniques, the photovoltaic thermal system has gained significant recognition as a prominent tool within the realm of solar energy production.
A variety of PV/T systems have been subjected to numerical investigations by Zondag et al.16 to enhance their efficiency. The electrical efficiency of nine distinct photovoltaic thermal systems was evaluated to offer valuable insights to journal reviewers. The results revealed that the system employing a sheet and tube configuration demonstrated exceptional performance, primarily due to its streamlined construction process. Selmi and colleagues17 employed Computational Fluid Dynamics (CFD) software to analyze a solar collector comprising a flat plate immersed in water. In this numerical investigation, they focused on heat transfer through convection and radiation. To validate their findings with the CFD simulation model, an experimental setup for a PV/T system with a similar configuration was conducted.
Siddiqui et al.18 developed a comprehensive three-dimensional numerical model for photovoltaic/thermal (PV/T) systems. They combined multiple electrical and thermal components to explore the cooling system of PV/T through simulation. The study investigated the impact of various parameters such as inlet velocity, temperature, radiation absorption, and thermal resistance on the cooling system's performance. The results highlighted the exceptional advantages of these systems in regions with high solar radiation and ambient temperatures. Prototype PV/T systems were installed in a building to provide hot water for domestic use and validate the computational model with experimental data. Corbin and Zhai19 reported that this experiment led to a 5.3% increase in cell efficiency and an overall maximum electrical plus thermal efficiency of 34.9%. Bhattarai et al.20 developed a numerical model to assess the performance of a photovoltaic/thermal (PV/T) system employing a tube and sheet configuration, comparing it to another type of solar collector. However, their research was conducted in one dimension and focused on solving the principles of energy conservation for different components of the systems. They achieved favorable numerical results that were in good agreement with experimental data, demonstrating that the solar collector exhibited a daily thermal performance surpassing PV/T by an impressive margin of 18%.
Syafiqah et al.21 employed ANSYS software to enhance the electrical performance of a PV thermal system. They separately utilized both air and water cooling in their numerical approach. The study aimed to investigate the weather conditions in Dhahran, Saudi Arabia. The researchers found that the highest recorded ambient temperature in the area was 21 °C, with solar intensity peaking at 979 W m−2. This investigation concluded that using water as the coolant in a PV/T system is more effective than using air.
Soltani et al.22 conducted a comprehensive numerical study that incorporated both natural convection and forced convection phenomena within the flow channel of PV/T systems. A comparative analysis was performed to examine temperature variations in PV/T systems using different types of nanofluids—water, Fe3O4–water, and SiO2–water. Utilizing nanomaterials as primary fluids in water has been suggested as a more efficient alternative compared to using water alone.
SiO2 and water have demonstrated enhanced cooling capabilities and improved electrical performance in solar cells. Rejeb et al.23 investigated a PV/T system composed of tube and sheet using four different combinations of nanofluids: Al2O3, Cu, water, and ethylene glycol. Their experiment incorporated data from three distinct cities: Mashhad, Lyon, and Monastir. The researchers concluded that nanofluids with water as the base were more efficient for electricity generation compared to those with glycol as the base. Khanjari et al.24 analyzed a PV/T system for both energy and exergy considerations using water-based nanofluids. The numerical investigation revealed that Ag/water nanofluids outperformed Al2O3/water nanofluids, leading to improved energy and exergy efficiencies. They also noted that the overall energy and exergy efficiency increased with a higher concentration of nanoparticles in the base fluids but decreased with increasing velocity in the channel.
Xu and Kleinstreuer25 examined a high photovoltaic thermal system using water-based nanofluids for cooling purposes. They found that increasing nanoparticle concentration improved the electrical efficiency of PV/T systems while minimizing entropy generation. Additionally, they suggested that lowering the inlet temperature would result in an increase in electricity output. Elmir et al.26 conducted a numerical simulation of a PV/T system with varying alumina Al2O3 concentrations in water, ranging from 0% to 10%. The PV/T system comprised a silicon layer and was exposed to sunlight at a 30-degree angle. Their findings indicated a 27% increase in heat transfer rate when the volume fraction of alumina was fixed at 10% and the Reynolds number was set to 5.
An investigation was carried out by Naidu et al.27 using the finite element method to explore different types of meshing elements for solving the three-dimensional Darcy–Brinkmann equation. This test revealed that meshing elements of quartic order provide better accuracy. Finally, it was suggested that this method can be easily employed for irregular shapes. A study was conducted by Devi and Nagaraja,28 applying high-order triangular meshing alongside the finite element method to enhance the performance of wind turbine blades in the 4-digit series. The governing equations were solved numerically. Performance and increased energy production were tested with varying attack angles and non-dimensional Reynolds numbers. The results provide valuable suggestions for optimizing blade shapes to achieve improved performance, even in icing and morphing conditions. Another study was discovered29 that focused on the application of nanofluids. In this study, the Darcy equation and Fourier's law of heat conduction were employed to investigate heat transfer characteristics, including conduction, convection, and radiation, within a porous fin featuring an exponential profile. The governing equations were converted into non-dimensional forms using non-dimensional terms. The study deduced that introducing porosity to the fin and utilizing the exponential profile effectively increased the rate of heat transfer. Furthermore, the use of nanomaterials enhanced heat transfer beyond what was initially expected. A curved surface was analyzed with the application of Casson-based nanoliquid, considering the effects of porosity and thermal radiation.30 The ordinary differential equations (ODEs) used to obtain the numerical solution for the actual problem resulted from a non-dimensional formulation. It was observed that increasing the curvature of the surface increased velocity but decreased temperature. Furthermore, it was demonstrated that improving thermal radiation increased both temperature and the Hartmann number. These findings may be applied to enhance the performance of heat exchangers and devices intended for cooling purposes. Many of the literature can be viewed31–37 that contains the application of nanomaterials in the applied engineering.
After reviewing the existing literature on photovoltaic thermal systems and the use of nanofluids to enhance heat transfer rates for various applications, including photovoltaic thermal systems, this article aims to improve the electrical performance of a PV/T (photovoltaic/thermal) system. This improvement is achieved by introducing hybrid nanofluids, created by mixing titanium oxide and silver nanoparticles in water. The configuration of this PV/T system is kept simple, consisting of a flow channel containing a rotating circular cylinder, an absorber to increase the heat gain from solar radiation, and polycrystalline silicon, a well-known component for electricity generation. To simulate this approach, incompressible Navier–Stokes and energy equations are employed in COMSOL multiphysics to obtain numerical solutions for velocity field components, pressure, and temperature. To enhance the PV/T system's performance, we conducted trials varying parameters such as Reynolds number, volume fraction, and the rotational velocity of the cylinder. The first section of this article outlines the problem formulation, including the construction of the photovoltaic thermal system, geometrical measurements of the PV/T system, thermophysical properties of both the cell construction and hybrid nanofluids, and the governing partial differential equations. In the subsequent part of this article, we verify the numerical results against available correlations and conduct a mesh-independent study to ensure precision and minimize errors in the numerical work. The results discussion section presents velocity, pressure, and temperature data against the increasing values of the selected parameters. Following this, we assess the efficiency of the PV/T system, which is the central focus of this article. Finally, the conclusion section summarizes the key findings and contributions of the study.
2. Problem formulation
In this study, we will analyze a photovoltaic thermal system composed of three distinct components: polycrystalline silicon, copper as an absorber, and a flow channel that incorporates a metallic cylinder (see Fig. 1). Due to the channel's symmetry along the z-axis, we model the problem in two dimensions. Consider a cylinder with a radius (R) fitted at the center of the channel, which is rotated along the y-direction with a velocity ω. We define an aspect ratio of 0.15, representing the ratio between the channel's height and the cylinder's radius. Our study aims to investigate the influence of forced convection on a mixture of nanoparticles, including titanium oxide and silver, dispersed in a water-based fluid. This mixture is introduced into the flow channel through the left entrance with an initial velocity (uin), which varies based on the Reynolds number (Re). The nanoparticles blend is introduced at a constant temperature (Tin = 50 °C) into the fluid system. At the right exit of the channel, a zero pressure condition is imposed, while all other walls are considered to have no-slip boundary conditions, as shown in Fig. 1. Solar radiation falls on the system, undergoing a bifurcation, with one part harnessed for electrical energy generation and the other part transmitted through the system to raise its temperature. Our primary objective is to enhance the performance of PV/T systems by actively cooling them using hybrid nanofluids. This cooling process will lower the temperature, optimizing electrical energy production. Table 1 summarizes the construction of the PV/T system.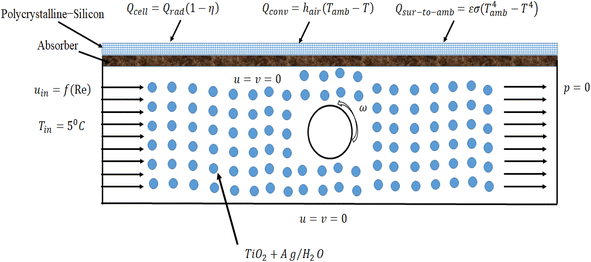 | ||
| Fig. 1 Construction of photovoltaic thermal system (PV/T) with boundary conditions for finite element investigation. | ||
| Symbols | Values | Description |
|---|---|---|
| H in | 20 [mm] | Inlet height |
| H out | H 2 | Outlet height |
| L cell | 100 [mm] | Length of channel |
| H absorber | 1 [mm] | Height of the absorber |
| H silicon | 1 [mm] | Height of the silicon panel |
| A | L cell H in − πR2 [mm2] | Flow channel's area |
| P | 2Lcell + 2Hin + 2πR [mm] | Perimeter of the flow channel |
| d h | 4 × A/P [mm] | Hydraulic diameter of the flow channel |
| A r | 0.15 | Aspect ratio from cylinder's radius to the channel's height |
| R | aH in [mm] | Radius of the cylinder |
| ω | 0.01, 0.05, 0.09, 0.1, 0.2 [m s−1] | Velocity of cylinder |
In this numerical investigation, we will focus on pure conduction within the top two layers of the PV/T system, consisting of silicon and a copper absorber. To examine this phenomenon, it is crucial to determine the thermophysical characteristics of these two solid materials, which are presented in Table 2. Our primary objective is to reduce the temperature of the PV/T system since an increase in its temperature can adversely affect electricity generation levels. By concentrating on temperature reduction within the PV/T system, we aim to optimize and enhance its electrical output. It is well-known that increasing the fluid velocity can lead to temperature reduction. In this computational simulation of photovoltaic/thermal (PV/T) systems, our goal is to improve electrical efficiency by increasing the Reynolds number and elevating the circular cylinder's velocity. This study aims to provide valuable insights for optimizing PV/T performance. As a result, the numerical investigation will span Reynolds numbers ranging from 100 to 1000, with an increase in the number of rotations from 0.01 to 0.2 m s−1.
| Symbols | Values | Description |
|---|---|---|
| (cp)abs | 386 [J kg−1 K−1] | Specific heat at constant pressure for absorber (copper) |
| ρ abs | 8900 [kg m−3] | Density of copper |
| (κt)abs | 398 [W m−1 K−1] | Thermal conductivity of copper |
| ρ sili | 2330 [kg m−3] | Density of silicon |
| (cp)sili | 716 [J kg−1 K−1] | Heat capacity of silicon |
| (κt)sili | 157 [W m−1 K−1] | Thermal conductivity of silicon |
| β | 0.003 [1/K] | Temperature coefficient |
| E | 0.9 | Emissivity |
| η ref | 0.2 | Reference efficiency of cell |
| A c | L cell H silicon | Area of one cell |
To reduce the temperature of the PV/T system, we will conduct experiments within the flow channel using a coolant, such as nanofluids. This numerical modeling study aims to analyze the behavior of the flow channel under forced convection, employing a hybrid mixture composed of titanium oxide (TiO2) and silver (Ag) with water as the base fluid. To implement the model of this hybrid mixture through the governing partial differential equations, we require the thermophysical properties of the materials, as summarized in Table 3. It's noteworthy that the thermal conductivity of silver exceeds that of titanium oxide. Therefore, we will use a titanium oxide volume fraction that is twice as large as that of silver. The numerical analysis will involve varying the silver volume fraction within the range of 0.01 to 0.2 to examine its effects. After establishing five values for each of the Reynolds number, volume fraction, and the cylinder's speed, we will develop 125 different models and simulations for the current study.
2.1. Constitutive partial differential equations
We will implement a finite element procedure using the commercial software COMSOL 6.0. Since our investigation involves three different domains, with pure conduction occurring in the top two layers of the channel, handled by energy equations in two dimensions. The temperature distribution in these top two layers is a result of solar radiation. Three distinct heat flux conditions will be applied to the top two layers of the silicon cell, as illustrated in Fig. 1. In the two-dimensional flow channel, we will analyze a combined convection and conduction problem using the heat equation and the incompressible Navier–Stokes equations. Let “V” represent the velocity field in two dimensions, with “Vx” and “Vy” as its components along the x and y-axes, respectively. The governing partial differential equations for the incompressible Navier–Stokes and energy equations can be written as follows: | (1) |
 | (2) |
 | (3) |
 | (4) |
2.2. Further calculation formulas
After getting the numerical results, the mean temperature of the domain will be computed as eqn (7), the heat transfer coefficient will be computed by (6) and the average Nusselt number will be computed by (5). Eqn (9) demonstrates the efficiency of the cell in terms of percentage, with respect to the reference efficiency measured at the reference temperature Tref. Eqn (14) is presenting the total heat flux appeared for the cell. Where Qsur-to-amb is presenting the radiation from surface to surroundings of the medium. In Sindh, Pakistan region the ambient temperature is mostly 45 °C in month of June–July, therefore, we are examining the efficiency of this PV/T according to Sindh, Pakistan region.Average Nusselt number:
 | (5) |
Heat transfer coefficient:
 | (6) |
Bulk temperature:
 | (7) |
Prandtl number:
 | (8) |
Percentage change in the cell efficiency:
 | (9) |
| ηcell = ηref[1 − β(Tcell − Tref)] | (10) |
Nusselt number by Kimura et al.:40
 | (11) |
Nusselt Number by Gryta et al.:41
| NuG = 0.298Re0.646Pr0.316 | (12) |
Nusselt number by Pak and Cho42
| NuP&C = 0.021Re0.8Pr0.5 | (13) |
| Qabs = Qcell − (Qsur-to-rad + Qcon) | (14) |
The heat source in the domain:
| Qcell = Qsun(1 − η) | (15) |
Heat reflected surrounding:
| Qrad = εσ(Tcell4 − Tamb4) | (16) |
Heat transferred to the PV-panel by surroundings:
| Qconv = h(Tamb4 − T4) | (17) |
COMSOL working procedure
COSMOL Multiphysics software provides a general Java-based code to solve the governing equations for relevant phenomena, yielding numerical solutions. Additionally, it offers robust graphics for post-processing. The software comprises the following general steps applicable to various problem types. While it is user-friendly, it does require a thorough study to identify the appropriate interfaces and boundary conditions for the specific problem.| Step 1: Begin by configuring the parameters necessary for constructing the channel's geometry and defining the material properties required for the domain of the channel. Additionally, when incorporating the flow of nanomaterials, establish the parameters essential for implementing the nanofluids model |
| Step 2: Configure the model's geometry using the parameters provided in step 1 |
| Step 3: Identify the materials within the designated domain. Utilize the specified material properties as exemplified here; at the top of PV/T, polycrystalline silicon is affixed. In this domain, apply the material properties of silicon by selecting the material button accessible in the model builder window |
| Step 4: Identify and apply the boundary conditions along each domain. In this context, we are conducting parallel computations for both the Navier–Stokes equation and the energy equation. Both equations will be solved concurrently, and it is essential to impose the appropriate conditions for fluid flow and heat transfer |
| Step 5: Determine the optimal number of elements required to achieve precise results with minimal error. It is advisable to conduct a comparative analysis of the numerical results against existing literature to validate the accuracy of your simulations |
| Step 6: Execute the program by selecting specific parameters to assess the influence of the variables of interest |
| Step 7: Perform post-processing on the obtained numerical simulation results |
3. Validation and accuracy with meshing process
Fig. 2 illustrates that the current geometry under observation is meshed with irregular triangular elements to obtain a numerical solution. Achieving a high degree of numerical accuracy is a crucial aspect of the numerical procedure. To address this, a mesh independence study is conducted, involving the use of different numbers of elements for meshing the geometry to obtain numerical results for specific variables of interest. COMSOL 6.0 automatically assesses the geometry's complexity and generates a dense mesh in regions where obtaining a solution is typical. In our geometry, a high-density mesh is particularly needed around the cylinder and in the multiple domains. We conducted experiments using various element counts, ranging from 1000 to 100![[thin space (1/6-em)]](https://www.rsc.org/images/entities/char_2009.gif) 000. Subsequently, we calculated average values for velocity magnitude, temperature, and pressure at the outlet of the channel (refer to Fig. 3). The improvement in the average velocity field is evident in Fig. 3(a) when the number of elements is increased. We found that achieving mesh independence requires having more than 20
000. Subsequently, we calculated average values for velocity magnitude, temperature, and pressure at the outlet of the channel (refer to Fig. 3). The improvement in the average velocity field is evident in Fig. 3(a) when the number of elements is increased. We found that achieving mesh independence requires having more than 20![[thin space (1/6-em)]](https://www.rsc.org/images/entities/char_2009.gif) 000 elements. In Fig. 3(b) and (c), we observe that achieving mesh independence for temperature and pressure requires using a number of elements exceeding 15
000 elements. In Fig. 3(b) and (c), we observe that achieving mesh independence for temperature and pressure requires using a number of elements exceeding 15![[thin space (1/6-em)]](https://www.rsc.org/images/entities/char_2009.gif) 000. However, to ensure higher accuracy, we conducted 125 simulations employing approximately 61
000. However, to ensure higher accuracy, we conducted 125 simulations employing approximately 61![[thin space (1/6-em)]](https://www.rsc.org/images/entities/char_2009.gif) 450 elements and achieved a residual of 10−6.
450 elements and achieved a residual of 10−6.
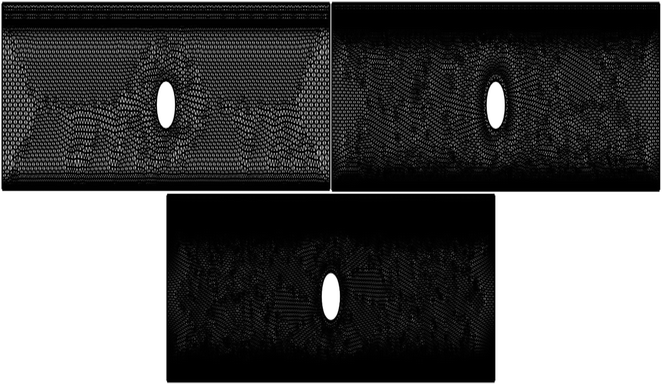 | ||
| Fig. 2 Three step meshing procedure of photovoltaic thermal system from fine mesh to finest mesh with irregular triangular elements. | ||
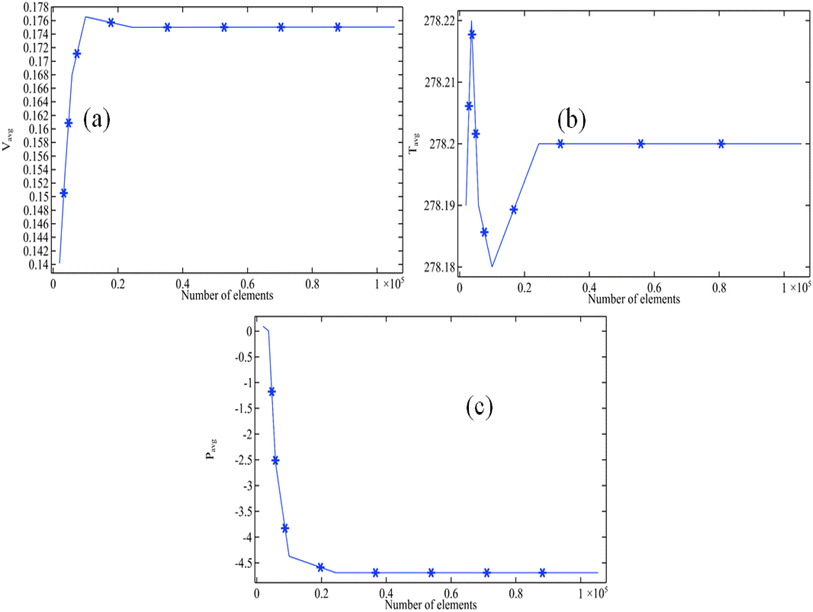 | ||
| Fig. 3 Mesh independent outcomes when Re = 1000, w = 0.2 and phi2 = 0.2 (a) velocity magnitude at the outlet (b) average temperature at the outlet (c) average pressure at the outlet. | ||
We are now presenting Table 4, which offers a comprehensive comparison of the average Nusselt number throughout the flow channel. The average Nusselt number at the channel outlet is determined in this study by applying eqn (5)–(7) and utilizing experimentally validated correlations (11)–(13) from the existing literature. Based on the data presented in Table 4, it is clear that the findings of this study align well with the existing correlations.
| Re | ϕ 2 | ω | NuK | NuG | Nup | Nupresent |
|---|---|---|---|---|---|---|
| 100 | 0.01 | 0.01 | 6.2224 | 6.903 | 2.1076 | 5.0777 |
| 100 | 0.05 | 0.01 | 6.2224 | 6.903 | 1.8009 | 4.9754 |
| 100 | 0.09 | 0.01 | 6.2224 | 6.903 | 1.6082 | 4.9112 |
| 100 | 0.1 | 0.01 | 6.2224 | 6.903 | 1.5726 | 4.8993 |
| 100 | 0.2 | 0.01 | 6.2224 | 6.903 | 1.4126 | 4.846 |
| 300 | 0.01 | 0.01 | 8.9742 | 14.036 | 5.0755 | 9.3621 |
| 300 | 0.05 | 0.01 | 8.9742 | 14.036 | 4.337 | 9.1159 |
| 300 | 0.09 | 0.01 | 8.9742 | 14.036 | 3.8729 | 8.9612 |
| 300 | 0.1 | 0.01 | 8.9742 | 14.036 | 3.7871 | 8.9326 |
| 300 | 0.2 | 0.01 | 8.9742 | 14.036 | 3.402 | 8.8042 |
| 500 | 0.01 | 0.01 | 10.64 | 19.524 | 7.6376 | 12.601 |
| 500 | 0.05 | 0.01 | 10.64 | 19.524 | 6.5263 | 12.23 |
| 500 | 0.09 | 0.01 | 10.64 | 19.524 | 5.8279 | 11.997 |
| 500 | 0.1 | 0.01 | 10.64 | 19.524 | 5.6988 | 11.954 |
| 500 | 0.2 | 0.01 | 10.64 | 19.524 | 5.1193 | 11.761 |
| 800 | 0.01 | 0.01 | 12.445 | 26.451 | 11.124 | 16.673 |
| 800 | 0.05 | 0.01 | 12.445 | 26.451 | 9.5053 | 16.134 |
| 800 | 0.09 | 0.01 | 12.445 | 26.451 | 8.4881 | 15.794 |
| 800 | 0.1 | 0.01 | 12.445 | 26.451 | 8.3 | 15.732 |
| 800 | 0.2 | 0.01 | 12.445 | 26.451 | 7.456 | 15.45 |
| 1000 | 0.01 | 0.01 | 13.406 | 30.552 | 13.298 | 19.085 |
| 1000 | 0.05 | 0.01 | 13.406 | 30.552 | 11.363 | 18.44 |
| 1000 | 0.09 | 0.01 | 13.406 | 30.552 | 10.147 | 18.035 |
| 1000 | 0.1 | 0.01 | 13.406 | 30.552 | 9.9222 | 17.96 |
| 1000 | 0.2 | 0.01 | 13.406 | 30.552 | 8.9132 | 17.624 |
3.1. Error analysis
Finally, an error analysis is done for the continuity equation attached in the Fig. 4. It can be noticed that increasing the length of the channel the error in computing the continuity equation is increased. This is because at the middle of the channel below which the error is calculated due increasing in the turbulence reason the error is slightly occur. However, observed for all other values of x away from the cylinder we can see that no turbulence in the region a best result to compute the continuity equation is given by the algorithm. Therefore, we recommend to create a dense mesh near the wake of the cylinder.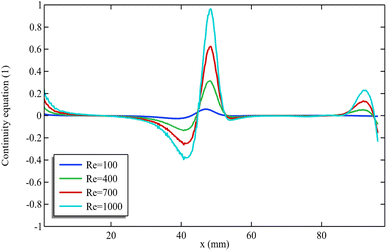 | ||
| Fig. 4 Error analysis for the continuity equation near the base of the rectangular channel when ϕ1 = ϕ2 = 0.001 and ω = 0.01. | ||
4. Results and discussion
This article presents a numerical study of a photovoltaic thermal system that incorporates the transport of hybrid nanofluids. These nanofluids consist of titanium oxide and silver nanoparticles, with water as the base fluid. The PV/T system has a simple construction, comprising only a polycrystalline silicon layer on top, copper as an absorber below the silicon layer, and a flow channel that includes a moving cylinder with a speed denoted as ω. Our primary objective in this study is to reduce the cell temperature to enhance its electrical efficiency. Therefore, we are conducting a parametric study involving Reynolds number, the volume fraction of silver (half of titanium oxide), and the speed of the rotating cylinder. In the results discussion, we present numerical results for velocity patterns, pressure, temperature, and electrical efficiency percentage, calculated using formula (9).4.1. Velocity field and pressure distribution in the flow channel
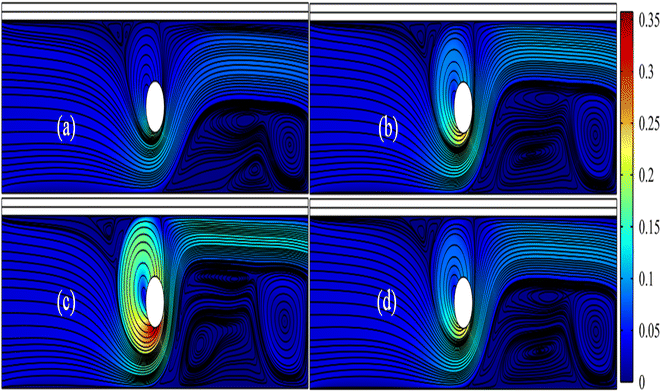
The streamline pattern of the velocity field is depicted in Fig. 5. It is evident that the rotation of the cylinder has a notable impact on the flow pattern of the material. Fig. 5 is generated by fixing Re = 1000 and ω = 0.01. In Fig. 5(a), with a significance level of 0.05, the presence of a vortex along the circular cylinder is apparent, indicating fluid recirculation. Additionally, three more vortices are observed at the lower corner of the channel's end. Fig. 5 illustrates that the maximum velocity of the hybrid nanofluids, due to rotation, appears below the cylinder. Notably, as the velocity of the cylinder increases from 0.05 to 0.1 (see Fig. 5(a–c)), the size of the vortex along the cylinder and other vortices also increases. However, when ω = 0.2 is observed (see Fig. 5(d)), the vortex along the cylinder and other vortices at the corner's end appear smaller. This is because the fluid is compressed due to the additional rotational power applied to the cylinder.Due to the rotation of the cylinder, angular momentum is generated in the surrounding area, resulting in the production of primary and secondary vortexes. Primarily, when the fluid interacts with the boundary, vortex formation occurs. This is because the cylinder is continuously rotating, so when the fluid collides with it from below, the fluid accelerates, leading to a higher observed cylinder speed in the downward direction. It has also been observed that when the cylinder's speed is 0.2 m s−1, the vortexes begin to decrease in size. This effect may be attributed to the fact that as the rotational speed increases significantly, the fluid becomes compressed, potentially causing a reduction in the size of the vortex.
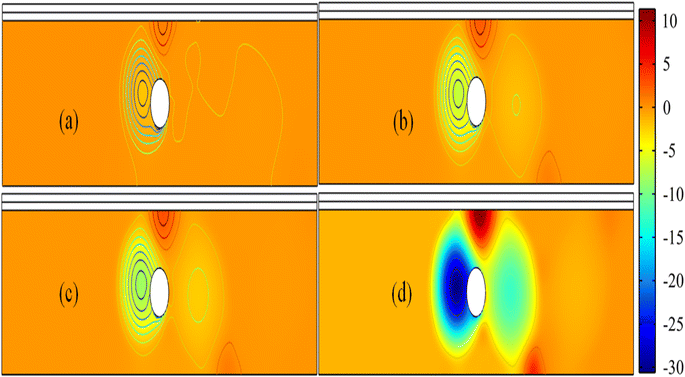
Surface plots and contour presentation of pressure is described though Fig. 6 for Re = 100 and ϕ2 = 0.01 and by altering the ω = 0.05–0.2. In this presentation for each case, we can see that the minimum pressure is existed along the recirculating cylinder and pressure isobars are clearly showing or indicating the recirculation of cylinder. For pressure, we can see that when ω = 0.05 only two vortices are created one is along the cylinder and other is above the cylinder. However, for the other cases, pressure is created three vortices of pressure contours. It can be seen that increasing the rotation of cylinder is creating a negative pressure inside the cylinder which is indicating most of the fluid is attracting by that region.
The appearance of vortices in response to pressure is a result of the interaction between the cylinder's surface and the fluid. Additionally, in Fig. 6(d), a negative pressure is observed, indicating that the fluid moving forward will be drawn toward this region.
4.2. Temperature against the chosen parameters
In Fig. 7(a), the maximum temperature is measured along the cell against the increasing Reynolds number (100–1000) for all volume fraction (0.01–0.2) of the silver and discussed only two cases of speed of rotation of cylinder (0.01 and 0.2). When the volume fraction of silver remains constant and the cylinder rotation speed increases, it is observed that the maximum temperature decreases with an increase in the Reynolds number range of 100–1000. In Fig. 7(b), when the rotation of cylinder is fixed at ω = 0.01, the highest temperature of the cell is moderately reducing with increasing the Re. However, when the rotation of cylinder is fixed at ω = 0.2, then temperature of cell is decreasing quickly for moderate Reynolds number from (100–300). In this case, we found that the maximum temperature is decreasing from 298 K to 279.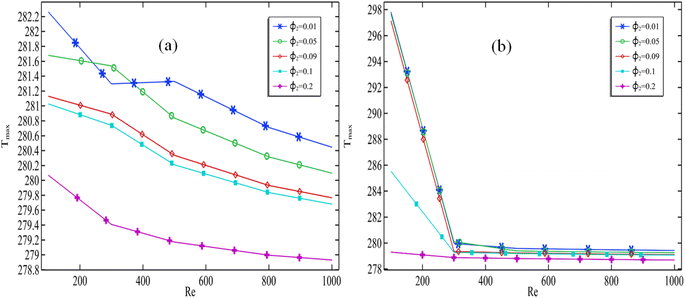 | ||
| Fig. 7 Maximum cell temperature against Re with altering the volume fraction of silver when (a) ω = 0.01 and (b) ω = 0.2. | ||
An increase in the Reynolds number results in an increased flow rate in the channel, indicating that more nanofluids enter the channel per unit of time. This increase in flow rate subsequently leads to a decrease in the maximum temperature. It can be anticipated that increasing the cylinder's rotation speed will further enhance the flow rate in the channel, consequently causing a more pronounced reduction in temperature.
In Fig. 8, the graph illustrates the relationship between the maximum temperature of a cell and two variables: the volume fraction of silver and the rotational speed of the cylinder. The data shown is for two Reynolds numbers, Re = 100 and Re = 1000. The results indicate that when Re = 100, increasing the volume fraction of silver leads to a decrease in the maximum cell temperature, while keeping the rotation rate constant. The maximum cell temperature can be achieved minimum with raising the silver when Re = 100 and the cylinder rotation must be kept at ω = 0.05 see Fig. 8(a). In Fig. 8(b), it can be understood that the maximum temperature against the volume fraction of the silver fraction is decreasing for each fixed rotation when Re = 1000. At this graph, we ca. understand when the Re = 1000, the maximum cell temperature can be maintained minimum when ω = 0.2. From this discussion, it can be concluded that to reduce the temperature of the cell high Reynolds number must be played with high speed of the cylinder. Based on the analysis of specific cases, it can be inferred that as the volume fraction of cell increases, there is a consistent decrease in the maximum temperature reached by the cell.
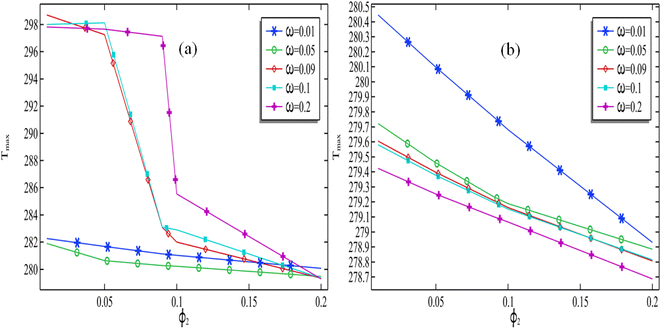 | ||
| Fig. 8 Maximum cell temperature against volume fraction of silver with altering the cylinder rotation when (a) Re = 100 and (b) Re = 1000. | ||
As mentioned earlier, it is expected that nanofluids will act as coolants. Therefore, it can be observed that increasing the concentration of nanomaterials enhances the thermal conductivity of the resulting fluid, contributing to a decrease in temperature. Additionally, it has already been explained that an increase in the Reynolds number supports an increase in the flow rate, which in turn leads to a more significant temperature reduction, as illustrated in Fig. 8(b).
A graphical representation, in Fig. 9, has been generated to evaluate the highest recorded temperature within the cell. This measurement is obtained by varying the rotational speed of the cylinder while keeping the silver volume constant and increasing the Re. It is evident that as the number of rotations of the cylinder increases while keeping the Reynolds number and volume fraction of the cylinder constant, there is a decrease in the maximum temperature of the cell. However, there is one exception observed in Fig. 9(a) where the Reynolds number is 100 and the volume fraction is 0.01. It can be seen that increasing the Reynolds number when rotation of cylinder is varied, put a negative impact in maximum temperature of the cell. In Fig. 9(b), the silver content remains constant at a volume fraction of ϕ2 = 0.2, it is obvious that with taking enhancement to the speed of the cylinder as well as the Reynolds number, the optimized cell temperature can be declined sufficiently.
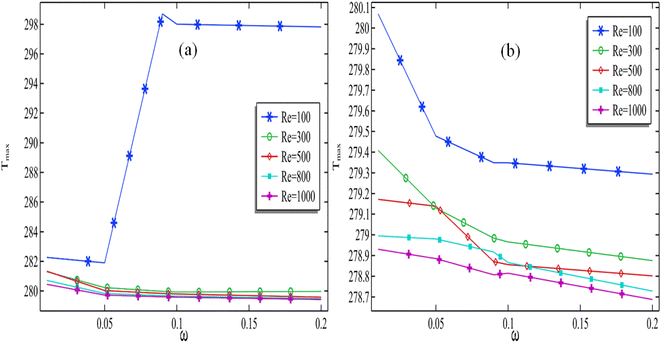 | ||
| Fig. 9 Maximum cell temperature against rotation of cylinder with altering Reynolds number when (a) ϕ2 = 0.01 and (b) ϕ2 = 0.2. | ||
This demonstrates that when the incoming fluid's speed is significantly lower than the rotation of the cylinder, it effectively circulates the fluid around the cylinder without expelling it from the channel. Consequently, for moderate Reynolds numbers, such as Re = 1000, the maximum temperature is found to increase. However, for all other cases, the maximum temperature decreases with an increase in the rotation of the cylinder. Increasing the cylinder's rotation consistently contributes to temperature reduction, particularly for higher Reynolds numbers.
4.3. The percentage of cell efficiency via the reference efficiency
In this section, our focus is on determining the percentage of cell efficiency in relation to the reference efficiency, which is mathematically defined in eqn (9). In the previous section we have measured the temperature (max) along the cell by altering the selected parameters Re, ϕ2 and ω.In Fig. 10(a), The efficiency of the cell, decreases as we move along the channel from the inlet to the outlet. This decline in efficiency can be attributed to the reference efficiency. The graphs presented in this study were generated using a fixed silver volume fraction of 0.2, with ω = 0.2. We observe initially, the cell efficiency is declined from starting of the length to the end of the length. As, we set the rotating cylinder at the middle of the channel, when hybrid fluid passed through the position the cell efficiency is further improved. It is very clear from Fig. 10(a), improving the Reynolds number the cell efficiency is improved further. It can be seen that by applying the present model of photovoltaic cell with the transport of hybrid nanofluids, the maximum cell efficiency due to the reference efficiency can be achieved up to 5.93. Moreover, fixing the cylinder at the middle of the flow channel produced the contraction region for the material at the middle of the channel which is the reason of improvement of the cell efficiency.
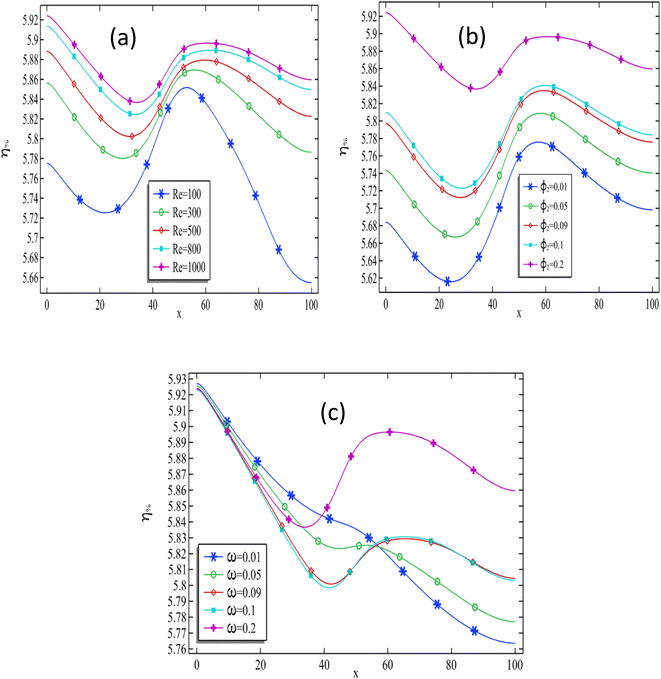 | ||
| Fig. 10 The cell efficiency% against the length of the cell for (a) all particulars Reynolds numbers (b) all particulars volume fraction of silver (c) all particulars rotation of the cylinder. | ||
Fig. 10(b) presents a graph illustrating the relationship between cell efficiency (expressed as a percentage) and cell length, while increasing the volume fraction of silver, at a Reynolds number of 1000 and with a constant value of ω = 0.2. The cell efficiency% is declined first from the initial length of the channel but due to the presence of the cylinder at the middle the cell efficiency is further improving along the length of the channel for each case of fixed volume fraction of the silver. The enhancement of cell efficiency in terms of cell length is observed when increasing the concentration of silver nanoparticles in the base fluid. The maximum cell efficiency is observed at the end of the cell for a moderate volume fraction of silver. However, for a higher volume fraction, the maximum efficiency percentage due to reference efficiency is found at the channel. By progressively increasing the volume fraction within the range of 0.01–0.2, the efficiency of the cell, expressed as a percentage, is observed to improve from 5.68% to 5.93% at the channel. It is evident, based on Fig. 10(b), that positioning the cylinder at the center of the channel consistently enhances the overall efficiency of the cell.
In Fig. 10(c), the graphic representation illustrates a noticeable decrease in cell efficiency percentage as we move along the length of the channel, regardless of the cylinder's rotation speed. Although, a clear pattern of for the cell efficiency cannot be deducted from here against the rotational speed of the cylinder because when the rotational speed ω = 0.01, the cell efficiency% is moderate as we compared the greater values of rotational speed of cylinder at the middle of the flow channel. When we set the rotational speed of the cylinder to ω = 0.2, it becomes evident that the cell efficiency at the middle of the channel improves. Moreover, it is observed that when ω = 0.01, the cell efficiency reaches its maximum at the channel's inlet and decreases towards the outlet. Conversely, when ω = 0.2, this pattern is reversed. Hence, based on these findings, it can be concluded that increasing the rotational speed of the cylinder consistently leads to a higher cell efficiency for the cylinder.
Impacts of Reynolds number, volume fraction and cylinder's rotation is almost clear on the temperature. In return we also know that decreasing in the cell temperature implies increase in the cell efficiency. Therefore the results above can be expected according to impact.
5. Conclusions
In this current numerical study, we conducted an examination of a two-dimensional photovoltaic thermal system that incorporates three distinct domains, each featuring a rotating cylinder positioned at the center of the channel. While various configurations of PV/T systems are available for numerical investigation, our simulation focuses on a 2D PV/T system consisting of polycrystalline silicon, copper, and a flow channel. These thermal systems are designed to generate electricity through solar radiation, but their efficiency decreases as the solar cell temperature rises. To control the temperature, a coolant such as nanofluids is circulated through the flow channel of this system to maintain the cell's temperature. Therefore, we are investigating the PV/T cell by using a hybrid mixture of TiO2 and silver, with water as the base, while maintaining the volume fraction of TiO2 twice that of silver. The parametric study involves varying the Reynolds number from 100 to 1000, adjusting the volume fraction of silver from 0.01 to 0.2, and changing the rotational speed of the cylinder from 0.01 to 0.2 m s−1. We have successfully resolved the problem at hand using Python coding within the COMSOL 6.0 software platform, considering the governing Navier equations and the energy equation. The following concluding points are provided below:• Due to rotation of the circular cylinder, a vortex along the cylinder and three other vortices are appeared at the corner of the exit which is down in the channel. The size of these four vortices is increased from 0.01–0.1 m s−1 of speed of cylinder and then reduced.
• It was found that due to recirculation of the cylinder the maximum speed of the mixture and the minimum pressure can only be deducted along the cylinder.
• The temperature of the cell decreases with increasing Reynolds number and volume fraction of silver. It was noticed that the maximum temperature of the cell is decreased along the rotation of the cylinder when the range of the Reynolds number is keeping higher.
• When Reynolds number is kept constant at Re = 100, it was observed that the minimum value of the maximum cell temperature occurs when the value of omega is 0.05. The same case exists for Re = 1000 when omega = 0.2.
• The cell efficiency% due to reference efficiency is declined along the length of the channel but attaching a rotating cylinder at the middle of the channel is improving further as it was shown though graphs.
• The cell efficiency along the length of the channel is always improved by increasing the Reynolds number from 100 to 1000. The maximum cell efficiency was found when Re = 1000, phi2 = 0.2 and omega = 0.2 m s−1 and it was found 5.93% cell efficiency was achieved due to reference efficiency.
• Increasing the volume fraction of silver always enhances cell efficiency. This improvement can only be achieved through cylinder rotation when Reynolds numbers are maintained at high levels or by keeping the inlet velocity high.
6. Future recommendations
In this current article, we have developed a formulation to investigate and enhance the performance of a photovoltaic thermal system with the simplest construction. We recommend that the problem can be extended further by considering different configurations, such as using a glazing pipe and glass cover. Initially, a single rotated cylinder was placed in the middle of the channel; however, the problem could be further extended by introducing two circles in the middle of the channel. These circles could be attached at 25% and 75% of the channel's length. The investigation of enhancing the performance of the PV/T system was conducted using laminar flow and the passage of nanoparticles. To expand upon this work, the extension of turbulence flow and the application of the ternary nanofluid model could be considered.Conflicts of interest
There are no conflicts to declare.Acknowledgements
The authors wish to extend their sincere gratitude to the Deanship of Scientific Research at the Islamic University of Madinah for the support provided to the Post-Publishing Program 2.References
- P. L. Joskow, 2014, Incentive Regulation in Theory and Practice: Electricity Distribution and Transmission Networks. Economic Regulation and its Reform: what Have We Learned?, pp. 291–344 Search PubMed.
- Y. F. Zhang, D. Parker and C. Kirkpatrick, Electricity sector reform in developing countries: an econometric assessment of the effects of privatization, competition and regulation, J. Regul. Econ., 2008, 33(2), 159–178 CrossRef CAS.
- R. W. Bacon and J. Besant-Jones, Global electric power reform, privatization, and liberalization of the electric power industry in developing countries, Annu. Rev. Energy, 2001, 26(1), 331–359 CrossRef.
- N. Armaroli and V. Balzani, The future of energy supply: challenges and opportunities, Angew. Chem., Int. Ed., 2007, 46(1–2), 52–66 CAS.
- N. Armaroli and V. Balzani, The future of energy supply: challenges and opportunities, Angew. Chem., Int. Ed., 2007, 46(1–2), 52–66 CAS.
- A. Kalair, N. Abas, M. S. Saleem, A. R. Kalair and N. Khan, Role of energy storage systems in energy transition from fossil fuels to renewables, Energy Storage, 2021, 3(1), e135 CrossRef.
- F. A. Farret and M. G. Simões, Integration of alternative sources of energy, IEEE Press, Piscataway, NJ, USA, 2006, vol. 504 Search PubMed.
- K. A. Moharram, M. S. Abd-Elhady, H. A. Kandil and H. El-Sherif, Enhancing the performance of photovoltaic panels by water cooling, Ain Shams Eng. J., 2013, 4(4), 869–877 CrossRef.
- K. A. Moharram, M. S. Abd-Elhady, H. A. Kandil and H. El-Sherif, Enhancing the performance of photovoltaic panels by water cooling, Ain Shams Eng. J., 2013, 4(4), 869–877 CrossRef.
- E. Radziemska, Thermal performance of Si and GaAs based solar cells and modules: a review, Prog. Energy Combust. Sci., 2003, 29(5), 407–424 CrossRef CAS.
- C. Feng, H. Zheng, R. Wang, X. Yu and Y. Su, A novel solar multifunctional PV/T/D system for green building roofs, Energy Convers. Manage., 2015, 93, 63–71 CrossRef.
- S. Singh, S. Agrawal and D. V. Avasthi, Design, modeling and performance analysis of dual channel semitransparent photovoltaic thermal hybrid module in the cold environment, Energy Convers. Manage., 2016, 114, 241–250 CrossRef.
- F. Shan, F. Tang, L. Cao and G. Fang, Comparative simulation analyses on dynamic performances of photovoltaic–thermal solar collectors with different configurations, Energy Convers. Manage., 2014, 87, 778–786 CrossRef.
- Y. Y. Wu, S. Y. Wu and L. Xiao, Performance analysis of photovoltaic– thermoelectric hybrid system with and without glass cover, Energy Convers. Manage., 2015, 93, 151–159 CrossRef.
- K. Moradi, M. A. Ebadian and C. X. Lin, A review of PV/T technologies: Effects of control parameters, Int. J. Heat Mass Transfer, 2013, 64, 483–500 CrossRef.
- H. A. Zondag, D. W. De Vries, W. G. J. Van Helden, R. J. C. Van Zolingen and A. A. Van Steenhoven, The yield of different combined PV-thermal collector designs, Sol. Energy, 2003, 74(3), 253–269 CrossRef.
- M. Selmi, M. J. Al-Khawaja and A. Marafia, Validation of CFD simulation for flat plate solar energy collector, Renewable Energy, 2008, 33(3), 383–387 CrossRef CAS.
- M. U. Siddiqui, A. F. Arif, L. Kelley and S. Dubowsky, Three-dimensional thermal modeling of a photovoltaic module under varying conditions, Sol. Energy, 2012, 86(9), 2620–2631 CrossRef.
- C. D. Corbin and Z. J. Zhai, Experimental and numerical investigation on thermal and electrical performance of a building integrated photovoltaic–thermal collector system, Energy Build., 2010, 42(1), 76–82 CrossRef.
- S. Bhattarai, J. H. Oh, S. H. Euh, G. K. Kafle and D. H. Kim, Simulation and model validation of sheet and tube type photovoltaic thermal solar system and conventional solar collecting system in transient states, Sol. Energy Mater. Sol. Cells, 2012, 103, 184–193 CrossRef CAS.
- M. Mourshed, S. Kumar Ghosh, T. Islam and N. Nath Mustafi, Experimental investigation and CFD analysis of a solar hybrid PV/T system for the sustainable development of the rural northern part of Bangladesh, Int. J. Sustainable Energy, 2019, 38(6), 583–602 CrossRef.
- S. Soltani, A. Kasaeian, H. Sarrafha and D. Wen, An experimental investigation of a hybrid photovoltaic/thermoelectric system with nanofluid application, Sol. Energy, 2017, 155, 1033–1043 CrossRef CAS.
- O. Rejeb, M. Sardarabadi, C. Ménézo, M. Passandideh-Fard, M. H. Dhaou and A. Jemni, Numerical and model validation of uncovered nanofluid sheet and tube type photovoltaic thermal solar system, Energy Convers. Manage., 2016, 110, 367–377 CrossRef CAS.
- Y. Khanjari, F. Pourfayaz and A. B. Kasaeian, Numerical investigation on using of nanofluid in a water-cooled photovoltaic thermal system, Energy Convers. Manage., 2016, 122, 263–278 CrossRef CAS.
- Z. Xu and C. Kleinstreuer, Computational analysis of nanofluid cooling of high concentration photovoltaic cells, Journal of Thermal Science and Engineering Applications, 2014, 6(3), 031009 CrossRef.
- M. Elmir, R. Mehdaoui and A. Mojtabi, Numerical simulation of cooling a solar cell by forced convection in the presence of a nanofluid, Energy Procedia, 2012, 18, 594–603 CrossRef CAS.
- V. K. Naidu, P. G. Siddheshwar and K. V. Nagaraja, Finite element solution of Darcy–Brinkman equation for irregular cross-section flow channel using curved triangular elements, Procedia Eng., 2015, 127, 301–308 CrossRef.
- S. Devi and K. V. Nagaraja, Enhanced Aerodynamic Performance of Wind Turbine Blades by Finite Element Meshing in Energy Applications. In, 2021 Emerging Trends in Industry 4.0 (ETI 4.0), IEEE, 2021, pp. 1–5 Search PubMed.
- A. Abdulrahman, F. Gamaoun, R. V. Kumar, U. Khan, H. S. Gill, K. V. Nagaraja, S. M. Eldin and A. M. Galal, Study of thermal variation in a longitudinal exponential porous fin wetted with TiO2–SiO2/hexanol hybrid nanofluid using hybrid residual power series method, Case Stud. Therm. Eng., 2023, 43, 102777 CrossRef.
- K. V. Nagaraja, M. JK, U. Khan, J. Singh Chohan, E. S. M. Sherif, I. Sarris, A. M. Hassan and B. Shanker, Thermal conductivity performance in sodium alginate-based Casson nanofluid flow by a curved Riga surface, Front. Mater., 2023, 10, 1253090 CrossRef.
- F. Ali, Z. Ahmad, M. Arif, I. Khan and K. S. Nisar, A time fractional model of generalized Couette flow of couple stress nanofluid with heat and mass transfer: Applications in engine oil, IEEE Access, 2020, 8, 146944–146966 Search PubMed.
- F. Hasin, Z. Ahmad, F. Ali, N. Khan and I. Khan, A time fractional model of Brinkman-type nanofluid with ramped wall temperature and concentration, Adv. Mech. Eng., 2022, 14(5), 16878132221096012 Search PubMed.
- S. Murtaza, P. Kumam, A. Kaewkhao, N. Khan and Z. Ahmad, Fractal fractional analysis of non-linear electro osmotic flow with cadmium telluride nanoparticles, Sci. Rep., 2022, 12(1), 20226 CrossRef CAS PubMed.
- S. Murtaza, P. Kumam, M. Bilal, T. Sutthibutpong, N. Rujisamphan and Z. Ahmad, Parametric simulation of hybrid nanofluid flow consisting of cobalt ferrite nanoparticles with second-order slip and variable viscosity over an extending surface, Nanotechnol. Rev., 2023, 12(1), 20220533 CrossRef CAS.
- S. Murtaza, P. Kumam, A. Kaewkhao, N. Khan and Z. Ahmad, Fractal fractional analysis of non linear electro osmotic flow with cadmium telluride nanoparticles, Sci. Rep., 2022, 12(1), 20226 CrossRef CAS PubMed.
- N. Khan, F. Ali, Z. Ahmad, S. Murtaza, A. H. Ganie, I. Khan and S. M. Eldin, A time fractional model of a Maxwell nanofluid through a channel flow with applications in grease, Sci. Rep., 2023, 13(1), 4428 CrossRef CAS PubMed.
- F. Hasin, Z. Ahmad, F. Ali, N. Khan, I. Khan and S. M. Eldin, Impact of nanoparticles on vegetable oil as a cutting fluid with fractional ramped analysis, Sci. Rep., 2023, 13(1), 7140 CrossRef CAS PubMed.
- I. Karaaslan and T. Menlik, Numerical study of a photovoltaic thermal (PV/T) system using mono and hybrid nanofluid, Sol. Energy, 2021, 224, 1260–1270 CrossRef CAS.
- S. H. Elhag, A. A. Memon, M. A. Memon, K. Bhatti, K. Jacob, S. Alzahrani and J. Seidu, Analysis of Forced Convection with Hybrid Cu–Al2O3 Nanofluids Injected in a Three-Dimensional Rectangular Channel Containing Three Perpendicular Rotating Blocks with Turbulent Modeling, J. Nanomater., 2022, 27 Search PubMed.
- S. Kimura, S. I. Nakao and S. I. Shimatani, Transport phenomena in membrane distillation, J. Membr. Sci., 1987, 33(3), 285–298 CrossRef CAS.
- M. Gryta, M. Tomaszewska and A. W. Morawski, Membrane distillation with laminar flow, Sep. Purif. Technol., 1997, 11(2), 93–101 CrossRef CAS.
- B. C. Pak and Y. I. Cho, Hydrodynamic and heat transfer study of dispersed fluids with submicron metallic oxide particles, Exp. Heat Transf. Int. J., 1998, 11(2), 151–170 CrossRef CAS.
| This journal is © The Royal Society of Chemistry 2023 |


