 Open Access Article
Thermal analysis of micropolar hybrid nanofluid inspired by 3D stretchable surface in porous media
Aisha M.
Alqahtani
a,
Basharat
Ullah
b,
Bilal
Ahmad
c,
Umar
Khan
 *c,
Hafiz Abdul
Wahab
c and
Roobaea
Alroobaea
 d
d
aDepartment of Mathematical Sciences, College of Science, Princess Nourah Bint Abdulrahman University, P.O. Box 84428, Riyadh 11671, Saudi Arabia
bDepartment of Mathematics, Mohi-ud-Din Islamic University, Nerian Sharif, AJ&K, Pakistan
cDepartment of Mathematics and Statistics, Hazara University, Mansehra, Pakistan. E-mail: umar_jadoon4@yahoo.com
dDepartment of Computer Science, College of Computers and Information Technology, Taif University, P.O. Box 11099, Taif 21944, Saudi Arabia
First published on 5th October 2023
Abstract
Applications: the study of highly advanced hybrid nanofluids has aroused the interest of academics and engineers, particularly those working in the fields of chemical and applied thermal engineering. The improved properties of hybrid nanoliquids are superior to those of earlier classes of nanofluids (which are simply referred to as nanofluids). Therefore, it is essential to report on the process of analyzing nanofluids by passing them through elastic surfaces, as this is a typical practice in engineering and industrial applications. Purpose and methodology: the investigation of hybrid nanoliquids was the sole focus of this research, which was conducted using a stretched sheet. Using supporting correlations, an estimate was made of the improved thermal conductivity, density, heat capacitance, and viscosity. In addition, the distinctiveness of the model was increased by the incorporation of a variety of distinct physical limitations, such as thermal slip, radiation, micropolarity, uniform surface convection, and stretching effects. After that, a numerical analysis of the model was performed, and the physical results are presented. Core findings: the results of the model showed that it is possible to attain the desired momentum of hybrid nanofluids by keeping the fluidic system at a uniform suction, and that this momentum may be enhanced by increasing the force of the injecting fluid via a stretched sheet. Surface convection, thermal radiation, and high dissipative energy are all great physical instruments that can be used to acquire heat in hybrid nanofluids. This heat acquisition is significant from both an applied thermal engineering perspective and a chemical engineering perspective. The features of simple nano and common hybrid nanoliquids have been compared and the results indicate that hybrid nanofluids exhibit dominant behavior when measured against the percentage concentration of nanoparticles, which enables them to be used in large-scale practical applications.
Introduction
Heat-converted fluids in mixtures such as ethylene glycol, water and oil with low thermal conductivity are essential materials in the development of a thermal scheme. To further increase their properties, plentiful research has been carried out into the thermal conveyance features of these fluids. Latiff et al.1 studied a nanometer solid component in a liquid, which remained a state-of-the-art result, but the unsuitable liquid used meant a breakthrough in technological development and industrial scale was not achieved. The nanoparticle increase the thermal conductivity as good heat transfer fluids, inside or outside the boundaries.Because of the high thermal conductivity of better nanofluids, many physicists and researchers are engaged in studying emerging thermal arrangements and processes, which are useful for industrial processes which use nanofluids. By adding Al2O3, SiO3 and TiO2, Khan et al.2 investigated how the thermal conductivity changes in water. Amirsom et al.3 studied heat flow in previous nanofluids made from linearly extended plates. The heat generation process and fascinating properties of nanofluids, which are exponentially strained in one direction, was first studied by Adnan et al.4 who analyzed the unsteady flow of MHD which is a dusty nanofluid, which was first examined by Ullah et al.5 who analyzed the effect of a biochemical reaction on the MHD stream of a nanofluid, which was discovered by Murtaza et al.6 to be an exponentially expanded surface.
Because of its importance to numerous fields of study, the flow field and heat transfer properties within a porous medium have received extensive attention from academics. In fluid mechanics, the behavior of a fluid as it streams past a porous medium is described by the term “fluid flow past a porous medium.” While some of the fluid moves through the medium, a greater concentration of the fluid fills the pores of the porous medium; for instance, flow through a sponge or wood, or percolation of water through sand or another porous medium. Flows of oil, gas, and water inside oil reservoirs, insulation engineering, geo-mechanisms (such as geothermal reservoirs), and increased oil recovery are all examples of issues related to porous media. In addition to their obvious usefulness in preventing the detrimental effects of free natural convection on a stretched surface, porous media are also crucial in a number of other ways. Raptis7 investigated the flow of micropolar fluids in porous media under the assumption of a boundary layer. The authors Ferdows et al.8 investigated the effect of an exponentially stretched sheet on the flow of a mixed convective magneto hydrodynamic nanofluid across a porous medium. To better understand how a micropolar fluid reacts when a sheet is stretched across a porous medium, Ullah et al.9 recently conducted research in this area. Adnan10 studied all the types of nanofluids, which is very useful. Tuz et al.11 carried out a detailed study of nanofluids. As nanoparticles have very small size, optimal effectiveness and permanency in technical and different biomedical ground have not been yet cleared.
The plethora of applications of rotating flows in geological physics and engineering, such as the movement of magma within the earth's mantle, the extension of tectonic plates beneath a rotating ocean, anticyclonic flow revolutions, the centrifugal percolation process, the processing of chemicals and foods, rotating machinery, and the dynamics of tornadoes and hurricanes, are the driving force behind the study of such flows. The concept of flow near a stretched sheet immersed in a rotating fluid was first proposed by Rehman.12 This article defines a parameter which represents the ratio between the rotational velocity and the stretching velocity of the sheet. The effects of rotation across an exponentially stretched region on the behavior of a nanofluid were quantitatively investigated by Mishra et al.13 Khan et al.14 performed a comparative study on the impact of rotation on a nanofluid due to a convectively heated plate but which was also stretched exponentially.
Uddin et al.15 studied how to improve the biochemical automatic (CMP) for which they established the CMP of silver (Ag) which helps in making high-presentation strategies of graphene and microelectronics. Zhang et al.16 showed that in titanium alloys the nanoparticles play a significant role for the action of CMP for a process in which the nanospheres are heated. Nanofluids have attrached significant attention in heat transport bids because of their practical importance, that can be changed with the type of nanoparticle used in base fluid.
To improve the properties of nanofluids, which is concerning heat transfer experts, a new type of fluid has been developed, which is known as a hybrid nanofluid. Mixed nanofluids are made of two or more different nanoparticles using this method. The main purpose of hybrid nanofluid synthetization is to enhance nanofluid properties. Suresh et al.17 undertook a comprehensive investigation into the synthesis of nanoparticle composites of copper and aluminum oxide. The hybrid nanofluid (Ag-Fe2O3) water procides with effective heat tranfer capacity as compared to the Fe2O3 water nanofluid. A comparison of the effects in previous work shows a good relationship. The effects show reductions in the velocity distribution with an increase in attractive parameters, whereas the distributions of temperature and application increase. Recently, many researchers18,19 have reviewed the flow theory of micropolar fluids.
After reviewing the state of the art in the field of micropolar nanofluids, we came to the conclusion that the behavior of the flow of the three-dimensional boundary layer of a micropolar hybrid nanofluid in the presence of an exponentially stretched surface had not yet been investigated. The effects on the flow of porous media and rotation have been analyzed in detail. In this study, a micropolar hybrid nanofluid is compared to a simple micropolar nanofluid. Dimensionless velocities, microrotation, and temperature profiles are shown as functions of these and other physical parameters in Tables 1–3.
| Thermo-physical properties | ρ (kg m−3) | C p (J kg−1) K | k (kW mK−1) |
|---|---|---|---|
| Ethylene glycol–water | 997.1 | 4179 | 0.613 |
| Ag | 8933 | 385 | 400 |
| Fe3O4 | 4250 | 686.2 | 8.9538 |
| R 1 | ε | λ | k p | ϕ | ||||
|---|---|---|---|---|---|---|---|---|
| 0.1 | 0.3 | 0.2 | 05 | 0.05 | 0.14788 | 0.56723 | 0.04579 | 0.34756 |
| 0.2 | 0.23876 | 0.72348 | 0.19837 | 0.37921 | ||||
| 0.3 | 0.28743 | 1.73927 | 0.23764 | 0.67391 | ||||
| 0.1 | 0.3 | 0.2 | 0.5 | 0.05 | 1.01257 | 1.03458 | 0.98357 | 0.83579 |
| 0.5 | 1.12987 | 1.78934 | 0.48201 | 0.73946 | ||||
| 0.7 | 1.93476 | 1.87943 | 0.38197 | 0.39273 | ||||
| 0.1 | 0.5 | 0.5 | 0.5 | 0.05 | 2.12874 | 2.78365 | 1.84646 | 1.89364 |
| 1.0 | 2.48298 | 2.19748 | 1.78326 | 1.67420 | ||||
| 1.5 | 2.83933 | 2.47291 | 1.83467 | 1.73829 | ||||
| 0.1 | 0.5 | 0.5 | 0.5 | 0.05 | 2.34560 | 2.48297 | 1.48349 | 1.48457 |
| 1.0 | 2.75839 | 2.46389 | 1.56392 | 1.47344 | ||||
| 1.5 | 2.57389 | 2.67392 | 1.12489 | 1.23458 | ||||
| 0.1 | 0.5 | 0.5 | 0.5 | 0.01 | 1.43492 | 1.56329 | 0.62784 | 0.47239 |
| 0.05 | 1.63783 | 1.72934 | 0.57382 | 0.67238 | ||||
| 0.09 | 1.74937 | 1.47928 | 0.47398 | 0.46228 |
| R 1 | ε | λ | k p | ϕ | ||
|---|---|---|---|---|---|---|
| 0.1 | 0.3 | 0.2 | 05 | 0.05 | 1.34668 | 2.98566 |
| 0.2 | 1.46654 | 2.45383 | ||||
| 0.3 | 1.45579 | 2.45682 | ||||
| 0.1 | 0.3 | 0.2 | 0.5 | 0.05 | 2.79344 | 1.85680 |
| 0.5 | 2.45696 | 1.23569 | ||||
| 0.7 | 2.45987 | 1.43529 | ||||
| 0.1 | 0.5 | 0.5 | 0.5 | 0.05 | 2.47498 | 1.75843 |
| 1.0 | 2.76849 | 1.25478 | ||||
| 1.5 | 2.75647 | 1.74824 | ||||
| 0.1 | 0.5 | 0.5 | 0.5 | 0.05 | 2.75839 | 1.73877 |
| 1.0 | 2.48298 | 1.48290 | ||||
| 1.5 | 2.27484 | 1.72840 | ||||
| 0.1 | 0.5 | 0.5 | 0.5 | 0.01 | 2.74833 | 1.36489 |
| 0.05 | 2.34789 | 1.65748 | ||||
| 0.09 | 2.84947 | 1.73837 |
Description of the problem
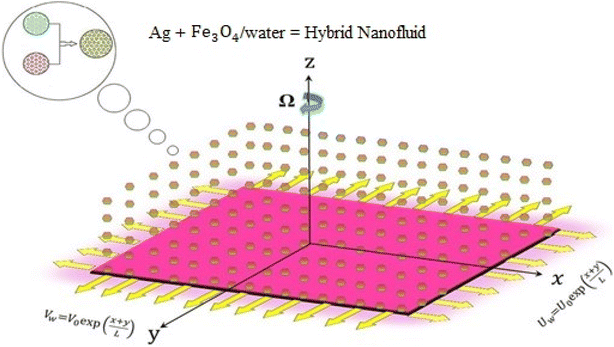
An exponentially stretched surface embedded in a porous medium initiates the incompressible, rotary flow of a hybrid nanofluid in terms of micropolar theory. The influence of thermal radiation on channel flow is also considered. Each tube wall has different characteristics. The bottom wall of the channel has coordinates along the objective lens x, and the velocity is in a stretched state. The wall velocity equation along the target direction y is equal to
  It is assumed that the height of the channel can be changed by moving the upper wall and closing the lower wall. The flow is limited to the zone z > 0, and the stretched surface lies in the plane z = 0. The nanofluid rotates around the vertical objective lens z at a constant angular velocity Ω. Fig. 1 clearly illustrates the expressions given above.
Based on the following assumptions, the fluid is considered to be a mixture of three components.
(1) The fluid is not compressible.
(2) The reaction is non-chemical.
(3) Viscosity dissipation is negligible.
(4) The particles are in thermal equilibrium.
Governing equations
In the previous hypothesis, the basic equations of continuity, moment, micropolarity, and energy can be written in dimensional form see ref. 20. | (1) |
 | (2) |
 | (3) |
 | (4) |
 | (5) |
 | (6) |
The boundary conditions of the problem are now discussed. Here the components are u and v of the velocity along the x and y directions, respectively. Furthermore, μhnf represents the effective dynamic viscosity of a hybrid nanofluid; the effective density of a hybrid nanofluid is represented by ρhnf; (ρcp)nf is heat capacity; khnf represents the thermal conductivity of the hybrid nanofluid ; σhnf is the electrical conductivity; B is the imposed magnetic field for the fluid and k is the mean absorption coefficient. The boundary conditions in the considered problem are:
 | (7) |
 | (8) |
The similarity transformations are listed below:
 | (9) |
Using eqn (9) in eqn (1)–(6), the continuity equation can be satisfied, and the momentum, microrotation, and energy equations can be simplified to the following forms:
 | (10) |
 | (11) |
 | (12) |
 | (13) |
 | (14) |
In the same way, similarity transformation (9) can be used to reduce the boundary condition to:
| f(0) = 0, f′(0) = 1, g(0) = 0, g′(0) = λ, θ(0) = 1, h1(0) = ng′′(0), h2(0) = −ng′′(0), as η → 0, f′ → 0, g′ → 0, θ → 0, h1 → 0, h2 → 0 as η → ∞. | (15) |
 | (16) |
Moreover, μhnf, ρhnf, (ρcp)hnf, khnf, χhnf and αhnf can be expressed mathematically as:
| ρhnf = {(1 − ϕ1)[(1 − ϕ2)ρf + ϕ1ρs1]} + ϕ2ρs2, | (17) |
 | (18) |
| (ρCp)hnf = [(1 − ϕ2)[(1 − ϕ1)(ρCp)f + ϕ1(ρCp)s1]] + ϕ2(ρCp)s2, | (19) |
 | (20) |
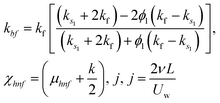 | (21) |
 | (22) |
The equations are reduced from higher order to first order by the shooting method and then the problem is solved by using the R–K-4 method (coupled with the shooting technique).
Procedure for solution
Solve the nonlinear ordinary differential equations on the right. Under conditions (10)–(14) and limits (15), this can be solved mathematically. To apply the photographic method, the Runge–Kutta method is used to convert the high-order ODE to the first-order ODE to obtain the exact solution of the equation. For graphical analysis, we use mathematical software called Mathematica. In this conversion, we can write:| x1 = f(η), x2 = f′(η), x3 = f′′(η), x4 = f′′′(η), |
| x5 = g(η), x6 = g′(η), x7 = g′′(η), x8 = g′′′(η), |
| x5 = θ(η), x16 = θ′(η), x17 = θ′′(η), |
 | (23) |
 | (24) |
 | (25) |
 | (26) |
 | (27) |
Similarly, the boundary conditions are:
| x1(0) = 0, x2(0) = 1, x5(0) = 0, x6(0) = λ, x15(0) = 1, |
| x9(0) = nx7(0), x12(0) = −nx7(0), as η → 0, |
| x2 → 0, x6 → 0, x15 → 0, x9 → 0, x12 → 0 as η → ∞. | (28) |
Interpretation of the results
In this section, our focus is on the analysis of fluid velocity and temperature under the impact of various parameters. Table 1 gives the thermo-physical properties of nanofluids. Several figures show the effect of the volume parameters in light of “volume” parameters that we will define. The mixed nanoparticles the volume proportion of “nanoparticles” of ferric oxide Fe3O4 changes.Stretched sheet velocity profiles
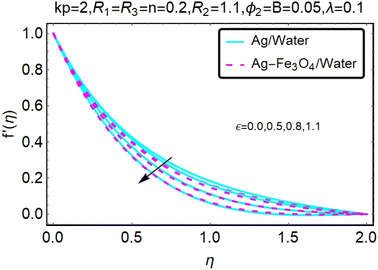
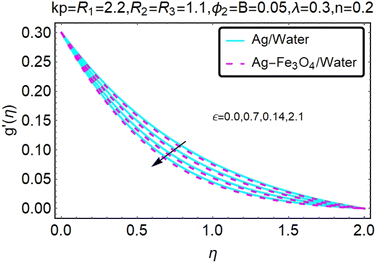
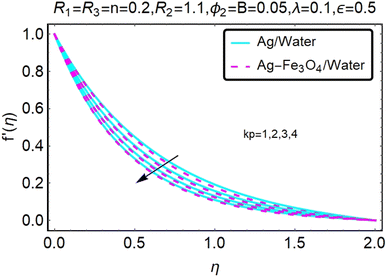
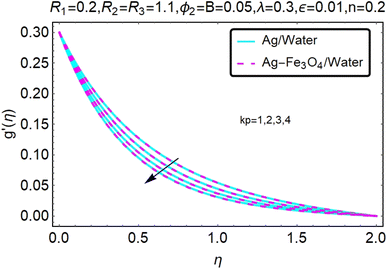
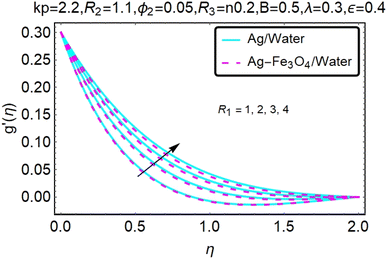
Fig. 2 and 3 show a study of the velocity distributions f′(η) and g′(η) in the x and y directions, showing simple water-based fluids, nanofluids (Ag/water) and mixed nanofluids Ag-Fe3O4/water. Fig. 2 and 3 graphically show changes in heat transfer and flow behavior affected by several new parameters. Fig. 2 and 3 explain the speed difference, where the value of the reduction of the change in the variable ε reflects a monotonous change. The only variation that can be observed is that the velocity of the hybrid nanofluid is slower than that of the pure nanofluid. This is mainly due to the high-density value of nanofluids which cannot be obtained. Fig. 3 defines the e of ε on velocity circulation. The change in speed is also irrelevant. For mixed nanofluids, the low-speed principle is determined similarly.Fig. 4 and 5 show the behavior of the velocity distribution f′(η) and g′(η) in the x and y directions, showing simple water-based fluids, nanofluids (Ag/water) and mixed nanofluids Ag-Fe3O4/water. Fig. 4 and 5 show the relationship between the conductivity of the velocity distribution and the porosity parameter kp, and the comparison between nanofluid (Ag/water) and mixed nanofluid Ag-Fe3O4/water. The increase in the porosity parameter kp causes the speed to decrease, due to the fact that the increase in porosity is inversely proportional to the permeability, so that the permeability decreases, which makes fluid flow more difficult and therefore both the speeds become slower.
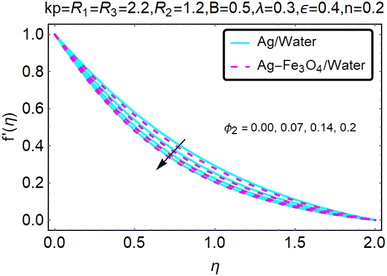
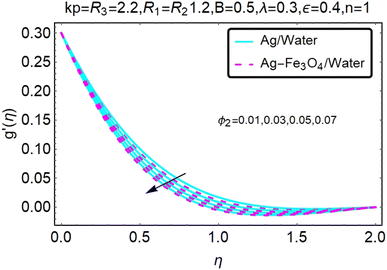
Fig. 6 and 7 show a study of the velocity distribution f′(η) and g′(η) in the x and y directions, showing simple water-based fluids, nanofluids (Ag/water) and mixed nanofluids Ag-Fe3O4/water. In this section, the velocity distribution coefficient is shown when a turn occurs. These graphs are designed to calculate flow performance based on parameters. Therefore, Fig. 6 and 7 show that reducing the value of ϕ2 will also reduce the velocity distribution.
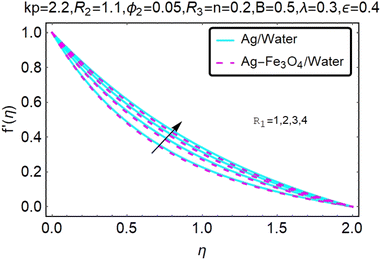
Fig. 8 and 9 show a study of the velocity distribution f′(η) and g′(η) in the x and y directions, showing simple water-based fluids, nanofluids (Ag/water) and mixed nanofluids Ag-Fe3O4/water. The related speed of nanofluids is slower than that of water and copper nanofluids. In this section, we discuss the velocity distribution coefficient when a turn occurs. These graphs are designed to calculate flow performance based on parameters. The boundary layer thickness decreases with increasing velocity. Fig. 8 and 9 show that as velocity increases, circulation also reduces. Then we checked the performance of the velocity shape and the normal variations of the parameters involved. Changing R1 will increase the temperature of the fluid, as shown in Fig. 8.
Stretched sheet microrotation profiles
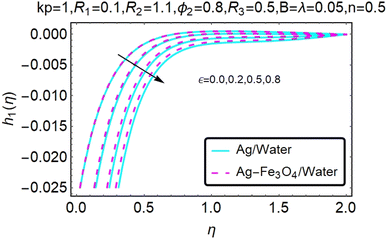
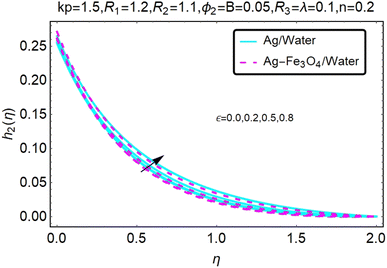
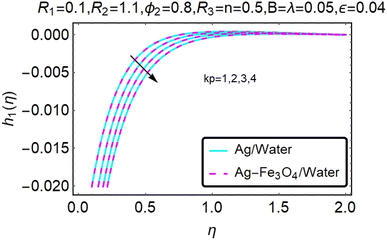
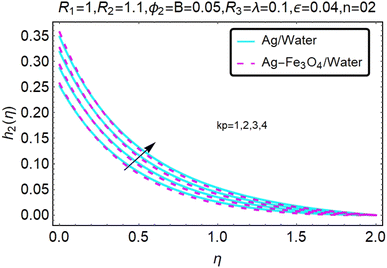
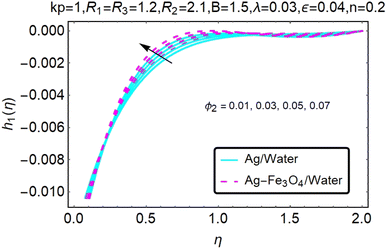
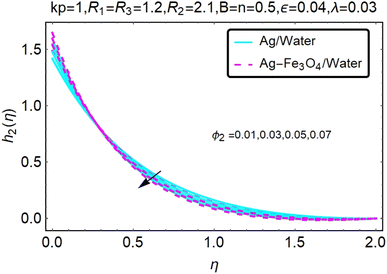
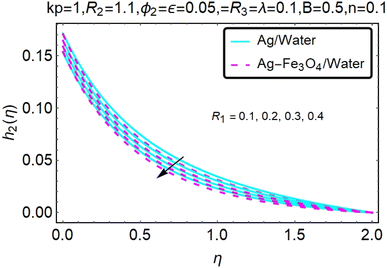
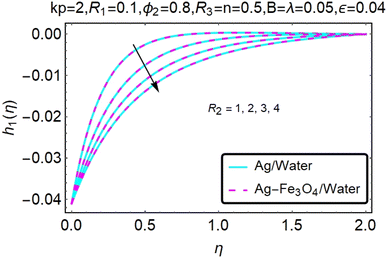
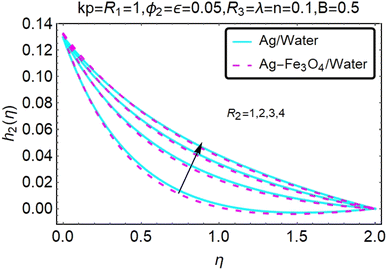
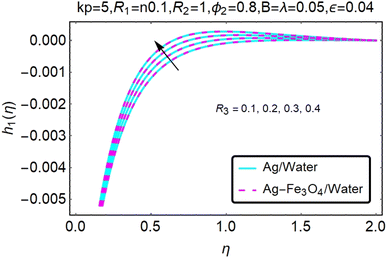
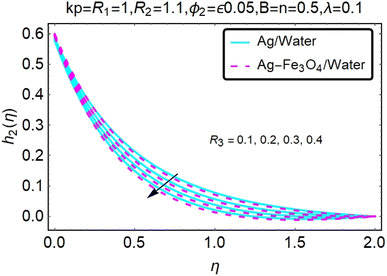
Fig. 10–13 graphically show changes in heat transfer and flow behavior affected by several new parameters. Fig. 10–13 show the behavior of ε and kp in the microrotation curves h1(η) and h2(η) of nanofluids (Ag/water) and mixed nanofluids (Ag-Fe3O4/water). Four different changes in micropolarity parameters were evaluated and the behavior of the curve in both directions was improved. At the same time, it was observed that in the case of the mixed nanofluids (Ag-Fe3O4/water), microrotation is very fast. Compared to simple nanofluids (Ag/water), the resistance is higher. With an increase in micropolarity parameter, except in the area near the exterior where the kinematic thickness controls the movement, rotation of the micropolar component in the boundary layer is stimulated. Fig. 10–13 show that when ε and kp increase, the microrotation curve h1(η) decreases, while h2(η) increases.Fig. 14 and 15 graphically show changes in heat transfer and flow behavior affected by several new parameters. Fig. 14 and 15 describe the behavior of ϕ2 in the microrotation profiles h1(η) and h2(η) of nanofluids (Ag/water) and mixed nanofluids (Ag-Fe3O4/water). Four different changes in the micropolarity parameters were evaluated and an improvement in the profile behavior in two directions was recorded. At the same time, it was observed that in the case of mixed nanofluids (Ag-Fe3O4/water), the microrotation is very strong compared with that of simple nanofluids (Ag/water). With an increasing micropolarity parameter, except in the area near the exterior where the kinematic thickness controls the movement, rotation of the micropolar component in the boundary layer is stimulated. Fig. 14 and 15 show that when ϕ2 increases, the microrotation profile h1(η) increases, while h2(η) decreases.
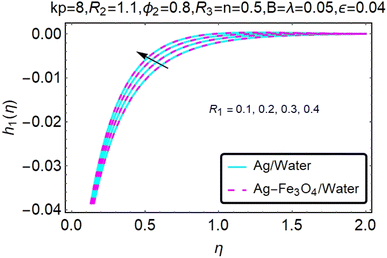
Fig. 16–21 graphically show changes in heat transfer and flow behavior affected by several new parameters. Graphs 16–21 describe the behavior of nanofluids (Ag/water) and mixed nanofluids (Ag-Fe3O4/water) in terms of the microrotation profiles h1(η) and h2(η) by changing R1, R2 and R3. Four different changes in the micropolarity parameters were evaluated and the improvement in the profile behavior in two directions was recorded. At the same time, it was observed that in the case of mixed nanofluids (Ag-Fe3O4/water), the microrotation is very strong compared with that of simple nanofluids (Ag/water). With an increase in the micropolarity parameter, except in the area near the exterior where the kinematic thickness controls the movement, rotation of the micropolar component in the boundary layer is stimulated. Fig. 16–21 show that when R1, R2 and R3 increase, the microrotation profile h1(η) increases, while h2(η) decreases.
Stretched sheet temperature profiles
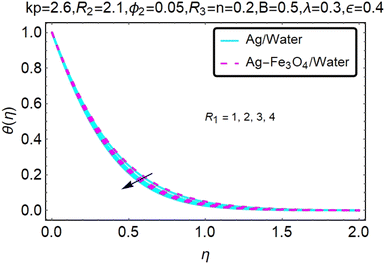
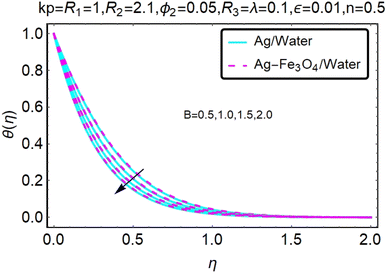
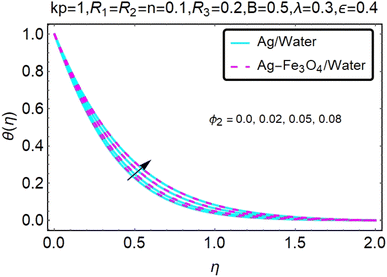
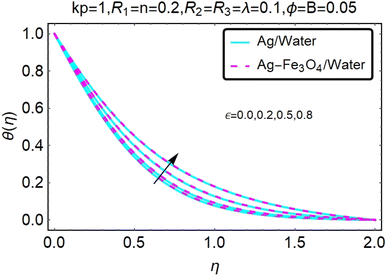
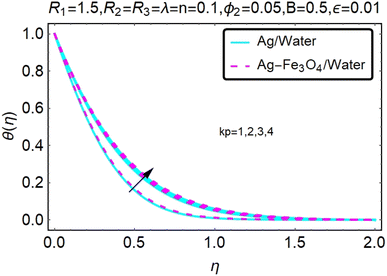
Fig. 22–26 show the results of an analysis of the temperature distribution θ(η) in the x and y directions, showing simple water-based fluids, nanofluids (Ag/water) and mixed nanofluids Ag-Fe3O4/water. The difference in heat transfer and flow behavior depends on various evolution parameters, which are graphically represented in Fig. 22–26. Fig. 22–26 provide a clear description of the temperature changes when the parameters of the temperature relationships of R1, B, ϕ2, ε and kp are different. The temperature increases, the relational parameters R1, B, ϕ2, ε and kp. The effect of temperature is clearly visible. The heat rate of a mixed nanofluid is higher than that of a pure nanofluid. When the parameters of the heat relationship between R1, B, ϕ2, ε and kp change, the temperature increases.Physical quantities
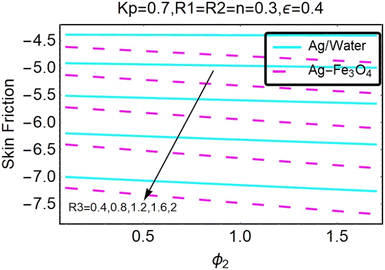
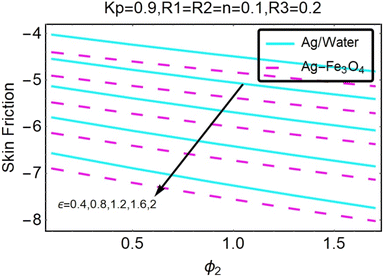
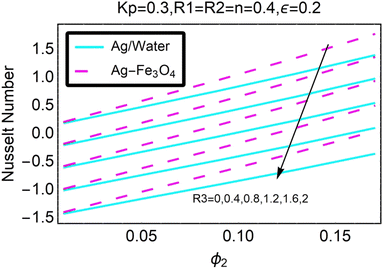
Fig. 27–30 are utilized in order to investigate the impact that varying values of form factors have on the local Nusselt number and surface friction, with each figure representing variation in a different embedded parameter. The horizontal axes are furnished with numerous values of the variable ϕ2. According to Fig. 27, in the scenario in which the injection is coupled with a contraction, the value of the parameter R3 raises the level of skin friction, whilst the value of the parameter ϕ2 demonstrates the opposite behavior.In addition to this, the nanostructures that are produced by the hybrid show excellent conductivity of heat. Plots are shown in Fig. 28 for the various values, each of which corresponds to an analysis shown in Fig. 27. Once more, research has shown that hybrid nanocomposites are superior to nanoparticles when it comes to their capacity to transport heat.
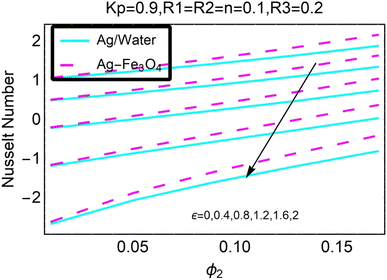
Both Fig. 29 and 30 illustrate how ϕ2, R3, and ε influence the pace at which heat is transferred locally. Increasing the value of ϕ2 results in a decrease in the local heat transfer rates, as shown in Fig. 29. The rates for hybrid nanoparticles are significantly greater, and they are indicated against R3 as well.
Fig. 30 illustrates the shifts that take place in the local Nusselt number as a result of an increase in its value. It has been discovered that the decreases in the local heat transfer rate caused by hybrid nanoparticles are lower than those caused by simple nanoparticles.
Table 4 presents a comparison of the outcomes of the R–K-4 approach with those of the R–K-4 method. The shooting method is also taken into consideration in this table. These two solutions appear to be totally congruent with one another. For the purposes of these calculations, the Prandtl number is assumed to be 6.2, with values of λ = 0.1, kp = 0.3, and ϕ = 0.02.
| ε | R 3 | Ref. 21 | Current Result |
|---|---|---|---|
| 0.2 | 0.8 | 4.579 | 4.5790 |
| 0.4 | 2.869 | 2.8691 | |
| 0.6 | 2.321 | 2.3210 | |
| 0.8 | 0.0 | 1.739 | 1.7392 |
| 0.5 | 2.821 | 2.8211 | |
| 1.0 | 2.243 | 2.2430 |
Conclusions
A computational investigation of the continuous three-dimensional boundary layer flow of a micropolar hybrid nanofluid across an exponentially stretched surface has been carried out as a result of the presence of a rotating and porous medium. In the context of this study, we conducted a qualitative comparison of nanofluids made of silver and water, as well as hybrid nanofluids made of silver, iron oxide, and water. The following is an itemized list of the most important findings from the present investigation:• Mixed nanofluids exhibit substantially higher heat assignment rates than simple ones.
• The temperature of the micropolar hybrid nanofluid increased even with nanoparticles of the same volume.
• The velocity distribution decreases for both the combined fluid and the individual nanofluid due to variance.
• At n = 0, the microrotation profiles h1(η) and h2(η) have a parabolic distribution.
• The hybrid nanofluid has a stronger effect on temperature reduction than the nanofluid due to the lower thermal conductivity of the first nanoparticle.
• As the vortex viscosity parameter R1 increases, the velocity distributions of the mixed fluid and the nanofluid increase.
• As ϕ2 (volume fraction), ε (rotation) and kp (porosity parameter) increase, the speed distribution of hybrids and nanofluids is reduced.
• As the vortex viscosity parameter R1, the spin gradient parameter R2 and the volume fraction parameter ϕ2 increase, the microrotation curve h1(η) increases and h2(η) decreases.
• As the rotation parameter ε, the spin gradient parameter R2 and the porosity parameter kp increase, the microrotation profile h1(η) decreases and h2(η) increases.
Future work
In the future, we will endeavor to expand upon this problem by incorporating ternary hybrid nanofluids with the inclusion of MHD and radiative effects.Data availability
The datasets used and/or analyzed during the current study are available from the corresponding author on reasonable request.Conflicts of interest
The authors declare that there is no financial/competing interest regarding this work.Acknowledgements
Princess Nourah bint Abdulrahman University Researchers Supporting Project number (PNURSP2023R52), Princess Nourah bint Abdulrahman University, Riyadh, Saudi Arabia.References
- N. A. Latiff, M. J. Uddin and A. M. Ismail, Propuls. Power Res., 2016, 5, 267–278 CrossRef.
- U. Khan, Adnan, B. Ullah, H. A. Wahab, I. Ullah, M. A. Almuqrin and I. Khan, Waves Random Complex Media, 2022, pp. 1–16 Search PubMed.
- N. A. Amirsom, M. J. Uddin and A. I. Ismail, Alexandria Eng. J., 2016, 55, 1983–1993 CrossRef.
- Adnan and W. Ashraf, Waves Random Complex Media, 2023, pp. 1–18 Search PubMed.
- B. Ullah, B. M. Fadhl, B. M. Makhdoum, K. S. Nisar and U. Khan, Case Stud. Therm. Eng., 2022, 40, 102538 CrossRef.
- M. Murtaza, E. Tzirtzilakis and M. Ferdows, Int. J. Appl. Math. Comput. Sci., 2018, 12, 38–42 Search PubMed.
- A. Raptis, J. Porous Media, 2000, 3, 95–97 CrossRef.
- M. Ferdows, M. S. Khan, M. M. Alam and S. Sun, Math. Probl. Eng., 2012, 1–21 Search PubMed.
- B. Ullah, H. A. Wahab, U. Khan and S. Bhatti, Proc. Inst. Mech. Eng., Part E, 2023, 237(3), 753–761 CrossRef.
- Adnan, Waves Random Complex Media, 2022, pp. 1–15 Search PubMed.
- F. Tuz Zohra, M. J. Uddin, M. F. Basir and A. I. M. Ismail, Proc. – Inst. Mech. Eng., 2020, 234, 83–97 CrossRef.
- R. Rehman, U. Khan, H. A. Wahab and B. Ullah, Waves Random Complex Media, 2022, pp. 1–16 Search PubMed.
- N. K. Mishra, Adnan, G. Sarfraz, M. Z. Bani-Fwaz and S. M. Eldin, J. Therm. Anal. Calorim., 2023, 1–12 Search PubMed.
- W. Khan, U. Khan, B. Ullah, N. Ahmed, I. Khan, A. M. Alqahtani and M. Alam, Math. Probl. Eng., 2023, e202200435 Search PubMed.
- M. J. Uddin, N. A. Amirsom, O. A. Beg and A. I. Ismail, Waves Random Complex Media, 2022, 1–21 CAS.
- Z. Zhang, J. Cui, J. Zhang, D. Liu, Z. Yu and D. Guo, Appl. Surf. Sci., 2019, 467, 5–11 CrossRef.
- S. Suresh, K. P. Venkitaraj, M. S. Hameed and J. Sarangan, J. Nanosci. Nanotechnol., 2014, 14, 2563–2572 CrossRef CAS PubMed.
- M. J. Uddin, P. Rana, S. Gupta and M. N. Uddin, Iran. J. Sci. Technol., 2023, 1–15 Search PubMed.
- M. Turkyilmazoglu, Int. J. Non-Linear Mech., 2016, 83, 59–64 CrossRef.
- Adnan, Waves Random Complex Media, 2022, pp. 1–15 Search PubMed.
- M. Qadeer, M. A. Alyami, U. Khan, M. F. Yassen, S. E. Alhazmi and B. Ullah, Irreversibility analysis for flow of carbon nanotubes with varying length and radius: Applications in rocket engine, Int. J. Mod. Phys. B, 2023, 37, 2350180 CrossRef CAS.
| This journal is © The Royal Society of Chemistry 2023 |


