 Open Access Article
Creative Commons Attribution 3.0 Unported Licence
A TiO2 nanorod and perylene diimide based inorganic/organic nanoheterostructure photoanode for photoelectrochemical urea oxidation†
Jasmine
Bezboruah‡
,
Devendra
Mayurdhwaj Sanke‡
 ,
Ajay
Vinayakrao Munde
,
Palak
Trilochand Bhattad
,
Himadri
Shekhar Karmakar
and
Sanjio S.
Zade
,
Ajay
Vinayakrao Munde
,
Palak
Trilochand Bhattad
,
Himadri
Shekhar Karmakar
and
Sanjio S.
Zade
 *
*
Department of Chemical Sciences, Centre for Advanced Functional Materials, Indian Institute of Science Education and Research (IISER) Kolkata, Mohanpur, Nadia 741246, West Bengal, India. E-mail: sanjiozade@iiserkol.ac.in
First published on 9th November 2023
Abstract
Visible light-driven photoelectrochemical (PEC) urea oxidation using inorganic/organic nano-heterostructure (NH) photoanodes is an attractive method for hydrogen (H2) production. In this article, inorganic/organic NHs (TiO2/PDIEH) consisting of a N,N-bis(2-ethylhexyl)perylene-3,4,9,10-tetracarboxylic diimide (PDIEH) thin layer over TiO2 nanorods (NRs) were fabricated for the PEC urea oxidation reaction (UOR). In these NHs, a PDIEH layer was anchored on TiO2 NR arrays using the spin-coating technique, which is beneficial for the uniform deposition of PDIEH on TiO2 NRs. Uniform deposition facilitated adequate interface contact between PDIEH and TiO2 NRs. TiO2/PDIEH NHs achieved a high current density of 1.1 mA cm−2 at 1.96 VRHE compared to TiO2 NRs. TiO2/PDIEH offers long-term stability under light illumination with 90.21% faradaic efficiency. TiO2/PDIEH exhibits a solar-to-hydrogen efficiency of 0.52%. This outcome opens up new opportunities for inorganic/organic NHs for high-performance PEC urea oxidation.
1. Introduction
Human society mainly uses exhaustible energy sources, like natural gas, natural oil, and coal.1 The combustion of these fuels produces environmental pollutants as a by-product, thus creating an environmental threat. Significant research efforts are being devoted to the development of clean and renewable energy sources as a replacement for traditional energy sources. In addition, urea is widely used as a significant nitrogen source in industry and agriculture.2 Urea is produced in large quantities from bio-waste and is widely used in the chemical industry.3 Urea from agriculture, industries, and domestic waste enters fresh water and acts as a pollutant. Treating urea in wastewater is essential due to the rising water pollution caused by urea discharge.3,4 Urea-containing wastewater can produce green hydrogen energy and reduces environmental pollution through the urea oxidation process. The process of producing hydrogen gas from urea-containing wastewater is promising from the standpoint of sustainable energy. This H2 energy is considered a potential fuel with high efficiency and no emission of harmful chemicals.5,6 The photoelectrochemical (PEC) urea oxidation reaction (UOR) has been proven to be an effective approach for H2 generation with low overpotential and energy input.7,8 Theoretically, the urea electrolysis voltage is only 0.37 VRHE.9 This makes PEC urea oxidation a vital method for H2 generation. UOR not only generates H2 but also reduces environmental pollution.In 1972, the discovery of TiO2 electrodes as a photoelectrocatalyst by Fujishima and Honda opened the door for PEC studies.10 Later, extensive research on TiO2 in different forms, like TiO2 nanorods (NRs),11 nanotubes,12 and nanoparticles,13,14 as photocatalysts was carried out. Cho et al. reported branched TiO2 NRs for PEC H2 production.15 Niu et al. reported corrugated nanowire TiO2 as a versatile photoanode for PEC alcohol and water oxidation.16 Cho et al. reported codoping TiO2 nanowires with tungsten and carbon for enhanced PEC performance.17 Hwang et al. reported a TiO2/BiVO4/SnO2 triple-layer photoanode with enhanced PEC performance.18 Duan et al. reported a TiO2 nanowire/microflower photoanode modified with Au nanoparticles for efficient PEC water splitting.19 Park et al. reported photocatalytic UOR on TiO2 in water and urine.20 In addition to increasing the conductivity, TiO2 has been doped and blended with various metals21–23 and non-metals.24–26 To functionalize doped/undoped TiO2, various organic semiconductors have gradually emerged as beneficial candidates for designing TiO2 NH photoanodes.27–29
Perylene diimide (PDI) derivatives have received a lot of attention as organic semiconductors (OSCs)30,31 in the fields of fluorescent solar collectors,32 organic photovoltaics (OPVs),33 and organic field-effect transistors (OFETs).34 PDI derivatives possess excellent thermal and optical stability and good carrier transport properties.35,36 The relatively facile and reversible reduction process of PDI derivatives is important in many applications.37 The relatively simple and reversible reduction of PDIs is important in many of these applications. They are widely used in basic studies on photoinduced energy and electron-transfer processes because of their facile reductions, combined with their easily identifiable excited states, anions, and dianions via absorption spectra.30,31 Due to their fused-ring structures and strong intermolecular forces, they are poorly soluble in organic solvents. N-Alkyl substitution improves the solubility of PDIs in various organic solvents and enables the integration of PDI derivatives into NHs.30 To improve the photocatalytic activity of NHs, Zhang et al. reported NH composites of various PDI derivatives with TiO2.38 A TiO2 nanotube and a PDI were combined in an organic/inorganic heterojunction for PEC water splitting.39
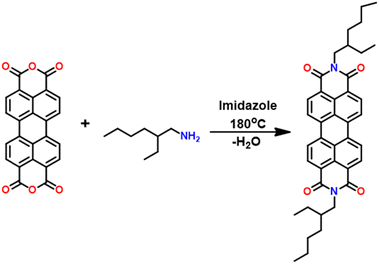
This paper focuses on the engineering of inorganic/organic NHs with N,N-bis(2-ethylhexyl)perylene-3,4,9,10-tetracarboxylic diimide (PDIEH) anchored on TiO2 NRs (represented as TiO2/PDIEH henceforth (Fig. S3†)). To synthesize PDIEH, commercially available PDA was used as the starting material and modified at an anhydride functional group with 2-ethylhexylamine (Scheme 1). The PEC properties of TiO2/PDIEH NHs towards PEC urea oxidation reaction (UOR) were investigated using various electrochemical measurements. A stability test was done by performing a chronoamperometry experiment. The morphological study was done by field emission scanning electron microscopy (FE-SEM).
2. Results and discussion
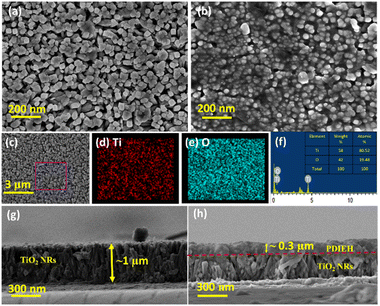
The FESEM images of the TiO2 NRs reveal uniformly distributed TiO2 NRs grown vertically on the FTO substrate with a rectangular surface (Fig. 1a). The thin coating of PDIEH over TiO2 NRs can be seen in the FESEM images of the TiO2/PDIEH NHs (Fig. 1b). Element mapping showed the even distribution of Ti and O elements in TiO2 NRs (Fig. 1c–e). Furthermore, the energy-dispersive X-ray (EDX) spectrum of TiO2 NRs (Fig. 1f) showed Ti and O elements, confirming the successful formation of TiO2 NRs. Fig. 1g shows the cross-sectional FESEM image of the TiO2 NRs, which reveals an average size of ∼1 μm. The thick coating of PDIEH of ∼0.3 μm on TiO2 NRs is seen in the cross-sectional image of TiO2/PDIEH NHs with a strong interface between TiO2 NRs and PDIEH (Fig. 1h). Fig. S4a and c† show the top-view and cross-sectional FESEM images of TiO2/PDIEH NHs with the ∼0.6 μm thick PDIEH layer and Fig. S4b and d† show the top-view and cross-sectional FESEM images of TiO2/PDIEH NHs with the ∼0.8 μm thick PDIEH layer. Fig. S5a† shows the PXRD pattern of powder PDIEH, revealing its crystalline nature. A comparison of the X-ray diffraction (XRD) patterns for both photoanodes (TiO2 NRs and TiO2/PDIEH NHs) indicates the formation of NHs (Fig. S5b†). The XRD pattern of TiO2/PDIEH NHs shows additional peaks around 10° (enclosed in a red rectangle) corresponding to PDIEH. The Raman spectrum of PDIEH showed multiple peaks located at 1084 cm−1 (C–H bending vibrations), 1301 cm−1 (ring stretching), 1380 cm−1 (ring stretching), 1454 cm−1 (ring stretching), 1570 cm−1 (C![[double bond, length as m-dash]](https://www.rsc.org/images/entities/char_e001.gif) C stretching), 1587 cm−1 (C
C stretching), 1587 cm−1 (C![[double bond, length as m-dash]](https://www.rsc.org/images/entities/char_e001.gif) C stretching), and 1612 cm−1 (C
C stretching), and 1612 cm−1 (C![[double bond, length as m-dash]](https://www.rsc.org/images/entities/char_e001.gif) C stretching), matching well with reported values (Fig. S4c†).40,41
C stretching), matching well with reported values (Fig. S4c†).40,41
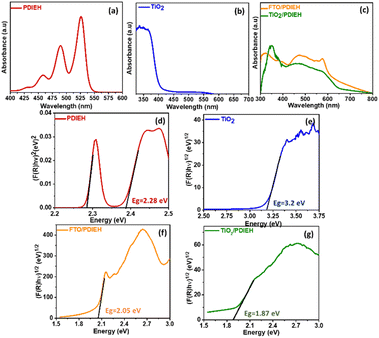
The absorption spectrum of PDIEH recorded in chloroform showed multiple peaks located at 429 nm, 457 nm, 489 nm, and 525 nm (Fig. 2a) which match the reported spectrum.42,43 The absorption bands at 457, 489, and 525 nm are attributed to the 0–0, 0–1, and 0–2 electronic transitions, respectively.42 The spectral intensity of the 0–0 transition is smaller than that of the 0–1 transition. This might be due to the existence of a face-to-face-stacked dimer of PDI in the solvent.42 PDIEH showed maximum absorbance at 525 nm, which corresponds to the vibronic progression of the first S0–S1 transition, making PDIEH a good candidate as an organic semiconductor to be blended with TiO2 for PEC application.44 TiO2 barely absorbs any light in the visible spectrum, as shown in Fig. 2b. Fig. 2c displays the absorption spectra of PDIEH thin films on FTO (FTO/PDIEH) and TiO2/PDIEH NHs. TiO2/PDIEH NHs exhibited absorption in wide visible regions corresponding to the absorbance of PDIEH. FTO/PDIEH shows higher absorption intensity compared to TiO2/PDIEH NHs because of the higher concentration of PDIEH in FTO/PDIEH than in TiO2/PDIEH NHs. The absorption spectra of TiO2/PDIEH NHs were also recorded when changing the thickness of PDIEH on TiO2 (Fig. S6†). On increasing the thickness of PDIEH, no absorption is observed because it blocks the incident beam of the UV-vis spectrophotometer and no absorption is observed by the detector. The photoluminescence (PL) spectrum of PDIEH in CHCl3 exhibited emission peaks at 609 nm and 635 nm (Fig. S7a†). The PL spectrum for TiO2 NRs (Fig. S7b†) shows an emission peak at 413 nm arising from the radiative recombination of self-trapped excitons localized within the octahedral TiO6 matrix and oxygen vacancies (VO).45 The peak at about 441 nm is due to VO with two trapped electrons, and the peaks at 469 nm and 483 nm are due to VO with a single trapped electron center.22,46 The peak at 527 nm is ascribed to oxygen vacancy-related trap states.22 The PL spectra of PDIEH thin film on FTO (FTO/PDIEH) and TiO2/PDIEH NHs are shown in Fig. S7c.† TiO2/PDIEH NHs exhibit emission around 645 nm corresponding to the PDIEH as revealed from the emission spectrum of FTO/PDIEH. The Kubelka–Munk plots of PDIEH (Fig. 2d), TiO2 NRs (Fig. 2e), FTO/PDIEH (Fig. 2f), and TiO2/PDIEH NHs (Fig. 2g) were used to calculate their respective optical band gaps (Eg). The Eg calculated for PDIEH, TiO2 NRs, FTO/PDIEH, and TiO2/PDIEH NHs were 2.28 eV, 3.2 eV, 2.05 eV, and 1.87 eV, respectively.
XPS was carried out to analyze the constituent elements of TiO2 (Fig. S8†) and TiO2/PDIEH NHs (Fig. 3). Fig. 3a shows that the XPS spectrum of C 1s for the NHs consists of three peaks at 283 eV, 284.9 eV, and 287.11 eV. The small peak at 283 eV is a signature of sp2 hybridized C![[double bond, length as m-dash]](https://www.rsc.org/images/entities/char_e001.gif) C carbon.47,48 The 284.9 eV peak corresponds to benzenic and adventitious carbon.47 The 288.8 eV peak corresponds to the carbon in the carbonyl group (C
C carbon.47,48 The 284.9 eV peak corresponds to benzenic and adventitious carbon.47 The 288.8 eV peak corresponds to the carbon in the carbonyl group (C![[double bond, length as m-dash]](https://www.rsc.org/images/entities/char_e001.gif) O).49 The high-resolution XPS spectrum of N 1s (Fig. 3b) consists of three peaks centered at 402.96 eV, 400.51 eV, and 397.53 eV. The high binding energy 402.96 eV peak is attributed to the X-ray oxidized charged nitrogen bipolarity.47 The 400.51 eV peak is assigned to the imide ((O
O).49 The high-resolution XPS spectrum of N 1s (Fig. 3b) consists of three peaks centered at 402.96 eV, 400.51 eV, and 397.53 eV. The high binding energy 402.96 eV peak is attributed to the X-ray oxidized charged nitrogen bipolarity.47 The 400.51 eV peak is assigned to the imide ((O![[double bond, length as m-dash]](https://www.rsc.org/images/entities/char_e001.gif) C)–N–(C
C)–N–(C![[double bond, length as m-dash]](https://www.rsc.org/images/entities/char_e001.gif) O)) functional group.50 The 397.93 eV binding energy peak is related to the nitrogen involved in Ti–N bonds.47 The Ti 2p XPS spectrum (Fig. 3c and S8a†) consists of two doublet peaks centered at 459 eV and 464.73 eV representing the Ti 2p1/2 and Ti 2p3/2 states of Ti4+.51 The XPS of Ti 2p for both TiO2 and TiO2/PDIEH reveals the same type of Ti cluster in both materials. The O 1s spectrum (Fig. S8b†) of TiO2 depicts a 530.11 eV peak, corresponding to lattice oxygen (OL) in the TiO2 matrix. The secondary peak centered at 532.21 eV corresponds to oxygen vacancies (VO).47,49 The XPS of O 1s from TiO2/PDIEH NHs (Fig. 3d) shows small shifts in the OL peak (530.91 eV) and VO peak (532.81 eV) which might be due to the interaction of PDIEH with TiO2, as the peak centered at 532.81 eV is attributed to the carbonyl (C
O)) functional group.50 The 397.93 eV binding energy peak is related to the nitrogen involved in Ti–N bonds.47 The Ti 2p XPS spectrum (Fig. 3c and S8a†) consists of two doublet peaks centered at 459 eV and 464.73 eV representing the Ti 2p1/2 and Ti 2p3/2 states of Ti4+.51 The XPS of Ti 2p for both TiO2 and TiO2/PDIEH reveals the same type of Ti cluster in both materials. The O 1s spectrum (Fig. S8b†) of TiO2 depicts a 530.11 eV peak, corresponding to lattice oxygen (OL) in the TiO2 matrix. The secondary peak centered at 532.21 eV corresponds to oxygen vacancies (VO).47,49 The XPS of O 1s from TiO2/PDIEH NHs (Fig. 3d) shows small shifts in the OL peak (530.91 eV) and VO peak (532.81 eV) which might be due to the interaction of PDIEH with TiO2, as the peak centered at 532.81 eV is attributed to the carbonyl (C![[double bond, length as m-dash]](https://www.rsc.org/images/entities/char_e001.gif) O) group present in the organic compound. Moreover, the small peak at 534.32 eV corresponds to the C–O group occurring in PDI due to the resonance phenomenon in the imide bond.49 The above discussion reveals that there is covalent interaction between TiO2 NRs and PDIEH.
O) group present in the organic compound. Moreover, the small peak at 534.32 eV corresponds to the C–O group occurring in PDI due to the resonance phenomenon in the imide bond.49 The above discussion reveals that there is covalent interaction between TiO2 NRs and PDIEH.
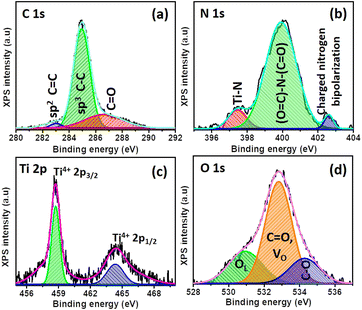 | ||
| Fig. 3 High-resolution peak-fitted XPS spectra of (a) C 1s, (b) N 1s, (c) Ti 2p, and (d) O 1s for TiO2/PDIEH NHs. | ||
3. Photoelectrochemical (PEC) studies
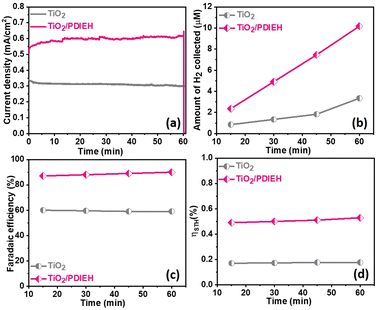
All PEC measurements of TiO2 NR and TiO2/PDIEH NH photoanodes were conducted in a three-electrode system on a CHI 660D electrochemical workstation (details are given in ESI†). Note that to convert the potential value (VAg/AgCl) measured against the Ag/AgCl reference electrode into the reversible hydrogen electrode (RHE), eqn (S1)† was employed. Fig. 4a shows the linear sweep voltammetry (LSV) graphs in aq. 0.5 M KOH solution. The TiO2 NRs and TiO2/PDIEH NHs exhibit photocurrent densities (Jph) of 0.29 mA cm−2 and 0.48 mA cm−2 at 1.965 VRHE. This increment in Jph after the formation of NHs is due to fast charge transmission at the electrode/electrolyte surface.49 A thin layer of PDIEH facilitates the absorbance of the photon within a wide-range of visible light that results in better charge separation. The PEC water oxidation onset potential is the potential in the LSV plot recorded in KOH solution at which the slope of Jph meets the dark current.51 The water oxidation onset potentials shown by the TiO2 NR and TiO2/PDIEH NH photoanodes are 0.20 VRHE and 0.30 VRHE, respectively (Fig. 4a) and exhibit anodic shifts of 0.1 V in the onset potential of the TiO2/PDIEH NH photoanode compared to the TiO2 NRs. It is worth mentioning here that, despite having an anodically shifted onset value compared to the TiO2 NR photoanode, the TiO2/PDIEH NH photoanode has a significantly higher Jph than the TiO2 NR photoanode. The anodically shifted onset value for the TiO2/PDIEH NH photoanode suggests sluggish oxidation kinetics at a lower potential, which is probably attributable to the unfavorable surface properties toward PEC water oxidation arising from surface charge recombination at lower potential.52Fig. 4c shows the LSV graphs in KOH solution with urea. The TiO2 NRs and TiO2/PDIEH NHs exhibit Jph of 0.42 mA cm−2 and 1.1 mA cm−2 at 1.965 VRHE. This increment in Jph of both photoanodes in the presence of urea is due to UOR over the photoanodes.53 The fast-chopped light illumination LSV curve was recorded in KOH solution without (Fig. 4b) and with urea (Fig. 4d), confirming the fast and reproducible light sensitivity of the photoanodes. The PEC urea oxidation onset potential (Vop) is the potential in the LSV plot at which the slope of Jph meets the dark current.54 A PEC system with high Jph and low Vop exhibits higher efficiency toward UOR.55 From the LSV graph of TiO2 NRs and TiO2/PDIEH in KOH solution with urea, the Vop for TiO2 NRs is found to be 0.40 VRHE, which is higher than the standard PEC urea oxidation Vop (0.37 VRHE).56 This higher Vop of TiO2 NRs towards PEC UOR reveals its lover activity towards PEC UOR. The Vop for TiO2/PDIEH NHs was found to be 0.24 VRHE, which is lower than the standard PEC urea oxidation Vop (0.37 VRHE).56 TiO2/PDIEH NHs exhibit a cathodic shift of 0.2 V compared to TiO2 NRs, indicating improved photocatalytic activity towards UOR after forming NHs. The improvement in the performance after forming NHs is due to the active surface, which allows fast charge transmission at the electrode/electrolyte surface.49 From the results, it can be estimated that TiO2/PDIEH NHs is not an appropriate catalyst for the water oxidation reaction, while TiO2 NRs is not an appropriate catalyst for UOR.57 The thickness of the semiconductor layer in type II NHs is of great importance to understanding the electron transfer, which is important for optimizing the efficiency of the PEC system. The effect of changes in coating thickness on the PEC response of NHs was studied. Fig. S9a† shows the LSV plots of TiO2/PDIEH NHs with variable thicknesses of the PDIEH layer which reveal that with increasing PDIEH thickness, the Jph decrease. This decrease in Jph is observed because with the increasing thickness, the exposure of the TiO2 to light decreases and thus the photogeneration of electron–hole pairs decreases. Additionally, this thick layer lacks the proper inter-junction contact between semiconductors which decreases the better charge transfer between NH layers.58The chronoamperometry (i–t) experiments of TiO2 NRs and TiO2/PDIEH NHs reveal that both photoanodes have good photostability (Fig. S9b†). In the i–t experiments of TiO2/PDIEH NHs, a gradual increase in the photocurrent density at the initial stage is observed which may be related to some surface phenomenon like rapid charge transfer at the electrode/electrolyte interface in the initial stages. FT-IR spectra of TiO2/PDIEH NHs (Fig. S10†) before usage and after 10 hours of the PEC stability test also confirm the stability of TiO2/PDIEH NHs. After the stability test, FT-IR spectra reveal that the structure of PDIEH has not changed. In PEC water oxidation, O2 gas is generated over the anode. This experiment was performed in 0.5 M KOH solution. Fig. S12a† shows the quantities of O2 collected using the TiO2 NR and TiO2/PDIEH NH photoelectrodes. The amounts of oxygen gas collected for the TiO2 NR and TiO2/PDIEH NH electrodes are 1.9 μmol cm−2 and 4.55 μmol cm−2, respectively. Both photoanodes exhibited a stable O2 generation ability. The faradaic efficiencies (FE) (details are given in ESI†) calculated for each photoelectrochemical OER are 55% and 81.3% for the TiO2 NR and TiO2/PDIEH NH electrodes, respectively (Fig. S12b†). The increment in the oxygen production in TiO2/PDIEH NH electrodes could be attributed to the nanoheterostructure formation. The H2 production capabilities of the photoanodes were tested by running an i–t experiment under constant light irradiation for 60 min (Fig. 5a). In PEC UOR, H2 was generated at the cathode. The amount of H2 generated was measured using an inverted-burette technique (Fig. S6a†). Fig. 5b shows the quantity of H2 collected after each 15 min at 0.96 VRHE. The quantities of H2 collected after 60 min for the TiO2 NR and TiO2/PDIEH NH electrodes are 3.32 μmol cm−2 and 10.2 μmol cm−2, respectively. The generation of H2 over the Pt wire electrode with the TiO2/PDIEH photoanode can be seen in Video S1.† The calculated FE for the TiO2 NR and TiO2/PDIEH NH electrodes are 58.85% and 90.21%, respectively (Fig. 5c). The FE of TiO2 is almost half that of TiO2/PDIEH NHs because the recombination rate of the photogenerated electrons and holes is high over TiO2,25,59,60 which reduces the urea oxidation tendency of bare TiO2 (LSV and i–t stability studies), resulting in a decrease in H2 production on the cathode. This results in a lowering of the faradaic efficiency in the case of bare TiO2. Hence, blending the semiconductor with TiO2 is required to suppress the charge recombination rate. TiO2/PDIEH NHs cannot acquire 100% FE because, during PEC UOR, N2 and CO2 are produced as a product of UOR and, at the same time, O2 generated from urea assists in water oxidation in urea solution.61 The urea assists water oxidation and consumes some fraction of the photogenerated holes to generate O2; this generated O2 reacts again with generated H+ to form water.62 This inhibits the FE from reaching 100%. The PEC catalytic activity of the TiO2 NR and TiO2/PDIEH NH electrodes towards PEC UOR was also computed from their solar-to-hydrogen (STH) conversion efficiencies (ηSTH). The ηSTH is the chemical (H2) energy generated against the incident light, calculated using eqn (S2).†63 The ηSTH calculated for the TiO2 NR and TiO2/PDIEH NH electrodes are found to be 0.17% and 0.52%, respectively (Fig. 5d). All the above results explain that TiO2/PDIEH NHs have better PEC catalytic activity toward UOR compared to TiO2 NRs.
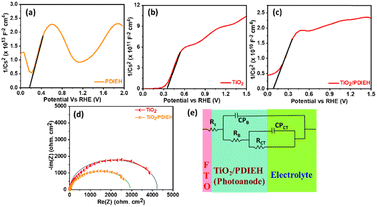
Mott–Schottky (M–S) plots for the PDIEH exhibit both negative and positive slopes versus the applied potential, revealing the simultaneous n-type and p-type nature of PDIEH (Fig. 6a).64 Considering the initial positive slope at a lower potential, n-type PDIEH shows a flat band potential (Vfb) of 0.16 VRHE. The M–S plots of TiO2 NRs (Fig. 6b) and TiO2/PDIEH NHs (Fig. 6c) exhibit positive slopes, expressing their n-type nature.49 The decrease in the slope of TiO2/PDIEH compared to that of TiO2 is due to a significant increase in charge carrier density after forming NHs. The decrease in the M–S slope increases its charge donor density, resulting in enhancement of the electron charge concentration in the conduction band (CB).47 This enhancement of electrons in the CB moves the Fermi level towards the CB edge.65 Here, the Vfb for the TiO2 and TiO2/PDIEH electrodes are 0.35 VRHE and 0.07 VRHE, respectively. The Vfb of an n-type semiconductor corresponds to the CB edge.66 The Nyquist plots of the photoanodes provide information about their charge transfer resistance (RCT) (Fig. 6d). RCT is used to study the kinetics enhancement and separation efficiency of charge carriers of the electrodes.53 The equivalent circuit is used to explain the Nyquist plots (Fig. 6e). Since the charges generated in the photoanode undergo bulk recombination and surface recombination, an equivalent circuit with several resistors was used to distinguish them. Rs is the series resistance at the interface between FTO and the photoanodes, RB is the bulk resistance in photoanodes, and CPB is their capacity. Also, Rct is the charge-transfer resistance at the interface between the photoanodes and electrolytes, and CPct is the constant phase element that represents the dielectrics of the electrical double layer at the electrode/electrolyte interfaces.67 The detailed values of resistance obtained from the fitted data of the equivalent circuit are given in Table S1.† The obtained resistance values reveal that, after the formation of the NHs, there is a decrease in the equivalent series resistance (RS), bulk resistance (RB), and RCT values. The drop in RB indicates a rise in the ion-conducting channels. The fall in RCT indicates the fast and better charge transfer at an electrode–electrolyte interface in NHs.68
For a quantitative analysis of the PEC UOR, the applied bias photon-to-current efficiency (ABPE) was calculated using eqn (S3).†69Fig. 7a exhibits the maximum ABPE (%) values of both photoanodes at different VRHE. TiO2 NRs exhibit 0.11% ABPE at 0.72 VRHE, while TiO2/PDIEH NHs show 0.25% ABPE at 0.63 VRHE. Compared to TiO2 NRs, the TiO2/PDIEH NHs exhibit higher ABPE due to the TiO2 NR being decorated with a visible-light active organic semiconductor which greatly improves the photoresponse under visible light. The ideal regenerative cell efficiency (ηIRC) is calculated from the LSV plots in Fig. 7b (replotted from LSV plots in Fig. 3c) using eqn (S4).† The maximum power densities (Pmax) for TiO2 NRs and TiO2/PDIEH are indicated by the green and pink shaded areas, respectively. The ηIRC% values calculated for TiO2 and TiO2/PDIEH are 0.16% and 0.25%, respectively. Interestingly, the obtained ηIRC% and η% values of each photoanode are quite comparable. Table S2† compares the TiO2/PDIEH NHs' UOR performance to a few recently published UOR results. This comparison shows that TiO2/PDIEH NHs is a better photocatalyst than those reported in the past. LSV measurements for the photoelectrodes were also carried out in 0.5 M aq. Na2SO3 to understand the enhanced surface charge transfer efficiency (ηCT). Na2SO3 acts as a hole scavenger and helps to investigate the ηCT. Owing to the low activation energy and fast kinetics for the oxidation of SO32− species, the ηCT for SO32− oxidation can be presumed to be 100%.70,71ηtrans is calculated using eqn (1),71 where  and
and  are the photocurrent densities obtained in 0.5 M aq. KOH and 0.5 M aq. Na2SO3, respectively.
 | (1) |
 | ||
| Fig. 7 (a) The η% plots, (b) LSV vs. RHE plots, and (c) surface charge transfer efficiencies of TiO2 NRs and TiO2/PDIEH NHs. | ||
Fig. 7c displays that the TiO2 NR photoanode shows a maximum ηCT value of ∼51%, whereas the TiO2/PDIEH NH photoanode exhibits a higher maximum ηCT value of ∼96.99%.
Fig. 8a shows the PEC cell diagram with expected charge flow in the TiO2/PDIEH NH photoanode for solar-driven UOR and H2 generation. The following equations describe the chemical reactions at the electrodes.72,73
| Anode: CO(NH2)2 + H2O → 6H+ + CO2 + N2, E0 = 0.37 VRHE |
| Cathode: 6H+ + 6e− → 3H2, E0 = 0 VRHE |
| Total: CO(NH2)2 + H2O → CO2 + N2 + 3H2, E0 = 0.37 VRHE |
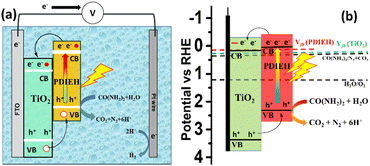 | ||
| Fig. 8 (a) PEC cell diagram with expected charge flow in the TiO2/PDIEH NH photoanode for UOR. (b) The energy diagram based on the Vfb. | ||
In this PEC cell, TiO2/PDIEH forms a type-II heterojunction with a staggered gap. Upon light irradiation, TiO2/PDIEH is excited by gaining photons, resulting in the photogeneration of electron (e−) hole (h+) pairs in the CB and valence band (VB) of PDIEH, respectively. As the CB of PDIEH is located at a higher energy level than that of TiO2, the photogenerated e− in the CB of PDIEH transfers to the CB of TiO2. At the same time, the h+ travels in the reverse direction, i.e., from the VB of TiO2 to the VB of PDIEH. The photogenerated h+ in the VB of PDIEH is positive enough to carry out UOR to produce CO2, N2, and H+.74,75 The e− in the CB of TiO2 moves rapidly at the Pt electrode and reduces H+ to produce H2. The working principle of the TiO2/PDIEH NHs is illustrated by the energy diagram (Fig. 8b) showing the e− transfer from the CB of PDIEH to the CB of TiO2. The band diagram is constructed from the obtained Vfb and Eg values of PDIEH and TiO2. The conduction band potential (VCB) of TiO2 was measured as 0.25 VRHE (assuming 0.1 negatives of its Vfb (0.35 VRHE))76 and the valence band potential (VVB) of TiO2 was obtained as 3.45 VRHE from the Eg value (3.2 eV). Similarly, the VCB of PDIEH is considered to be 0.06 VRHE (assuming 0.1 negatives of its Vfb (0.16))76 and the VVB of PDIEH was obtained as 2.34 VRHE, considering the Eg value (2.28 eV).
4. Conclusions
In summary, an inorganic/organic nano-heterostructure was designed and synthesized by coating the surface of TiO2 nanorods with a thin layer of PDIEH via the spin-coating technique. The spin-coating method established a PDIEH coating of uniform thickness. The resultant TiO2/PDIEH NHs as photoanodes were responsive to visible-light illumination and demonstrated an ultrahigh Jph of 1.1 mA cm−2 at 1.96 VRHE compared to that of TiO2 NRs derived from PEC urea oxidation. TiO2/PDIEH NHs exhibit a PEC urea oxidation onset potential of 0.24 VRHE, which is very low compared to that of the standard PEC Vop (0.37 VRHE). The combination of PDIEH and TiO2 NRs dramatically improved the PEC performance by enhancing light absorbance. The TiO2/PDIEH NHs also have high PEC stability under continuous light irradiation. Engineering these inorganic/organic NHs by taking advantage of the high electrical conductivity of the TiO2 NRs and the structural flexibility of the PDIEH gives rise to increased activities and is a promising strategy for the systematic design of the next generation of UOR photoelectrocatalysts.Author contributions
J. B. – conducted all experiments and writing, D. M. S. – data analysis, reviewed, and editing. A. V. M.-reviewed and edited, P. T. B. – contributed to some of the data analysis, H. S. K. – data analysis and editing, and SSZ – proposed and supervised the whole project, funding acquisition, and data analysis.Conflicts of interest
There are no conflicts to declare.Acknowledgements
This work has been financially supported by SERB, India vide CRG/2018/002784. J. Bezboruah Acknowledges the CSIR, India for the Junior Research Fellowship (09/0921(12025)/2021-EMR-I). D. M. Sanke acknowledges the UGC, India for the Senior Research Fellowship (16-6(DEC.2018)/2019(NET/CSIR)). H. S. Karmakar is thankful to DST-INSPIRE (IF 150259) for his fellowship. A. V. Munde is thankful to IISER-Kolkata (PDFDCS2021035) for the postdoctoral fellowship. P. T. Bhattad acknowledges IISER-Kolkata for fellowship.Notes and references
- D. M. Sanke, A. V. Munde, J. Bezboruah, P. T. Bhattad, B. R. Sathe and S. S. Zade, Energy Fuels, 2023, 37(6), 4616–4623 CrossRef CAS
.
- Z. Cao, H. Mao, X. Guo, D. Sun, Z. Sun, B. Wang, Y. Zhang and X.-M. Song, ACS Sustain. Chem. Eng., 2018, 6, 15570–15581 CrossRef CAS
.
- S. Chakrabarty, I. Offen-Polak, T. Y. Burshtein, E. M. Farber, L. Kornblum and D. Eisenberg, J. Solid State Electrochem., 2021, 25, 159–171 CrossRef CAS
.
- M. Han and G. Yan, Chem. Pap., 2020, 74, 4473–4480 CrossRef CAS
.
-
R. van de Krol and M. Grätzel, Photoelectrochemical Hydrogen Production, Springer US, 2011 Search PubMed
.
- R. Solmaz and H. Yüksel, Int. J. Hydrogen Energy, 2019, 44, 14108–14116 CrossRef CAS
.
- L. Wang, Y. Zhu, Y. Wen, S. Li, C. Cui, F. Ni, Y. Liu, H. Lin, Y. Li, H. Peng and B. Zhang, Angew. Chem., 2021, 133, 10671–10676 CrossRef
.
- J. Dabboussi, R. Abdallah, L. Santinacci, S. Zanna, A. Vacher, V. Dorcet, S. Fryars, D. Floner and G. Loget, J. Mater. Chem. A, 2022, 10, 19769–19776 RSC
.
- B. Zhu, Z. Liang and R. Zou, Small, 2020, 16, 1906133 CrossRef CAS PubMed
.
- A. Fujishima and K. Honda, Nature, 1972, 238, 37–38 CrossRef CAS PubMed
.
- J. Bian, C. Huang, L. Wang, T. Hung, W. A. Daoud and R. Zhang, ACS Appl. Mater. Interfaces, 2014, 6, 4883–4890 CrossRef CAS PubMed
.
- K. Lee, R. Kirchgeorg and P. Schmuki, J. Phys. Chem. C, 2014, 118, 16562–16566 CrossRef CAS
.
- Y. Kitamura, N. Okinaka, T. Shibayama, O. O. P. Mahaney, D. Kusano, B. Ohtani and T. Akiyama, Powder Technol., 2007, 176, 93–98 CrossRef CAS
.
- Y. A. Nasrallaa, N. M. Yeganehb, S. Piticharoenphuna, N. Shahtahmasebi, B. G. M. Kompany, M. Karimipour, N. R. J. Poolton and L. Siller, Sci. Iran., Trans. F, 2013, 20, 1018–1022 Search PubMed
.
- I. S. Cho, Z. Chen, A. J. Forman, D. R. Kim, P. M. Rao, T. F. Jaramillo and X. Zheng, Nano Lett., 2011, 11, 4978–4984 CrossRef CAS PubMed
.
- F. Niu, P. Zhang, Z. Zhang, Q. Zhou, P. Li, R. Liu, W. Li and K. Hu, J. Mater. Chem. A, 2023, 11, 4170–4182 RSC
.
- I. S. Cho, C. H. Lee, Y. Feng, M. Logar, P. M. Rao, L. Cai, D. R. Kim, R. Sinclair and X. Zheng, Nat. Commun., 2013, 4, 1723 CrossRef PubMed
.
- S. W. Hwang, J. U. Kim, J. H. Baek, S. S. Kalanur, H. S. Jung, H. Seo and I. S. Cho, J. Alloys Compd., 2019, 785, 1245–1252 CrossRef CAS
.
- Y. Duan, S. Zhou, Z. Chen, J. Luo, M. Zhang, F. Wang, T. Xu and C. Wang, Catal. Sci. Technol., 2018, 8, 1395–1403 RSC
.
- S. Park, J. T. Lee and J. Kim, Environ. Sci. Pollut. Res., 2019, 26, 1044–1053 CrossRef CAS PubMed
.
- C. Wang, Z. Chen, H. Jin, C. Cao, J. Li and Z. Mi, J. Mater. Chem. A, 2014, 2, 17820–17827 RSC
.
- B. Santara, P. K. Giri, S. Dhara, K. Imakita and M. Fujii, J. Phys. D Appl. Phys., 2014, 47, 235304 CrossRef
.
- D. Pal, A. Sarkar, N. Gopal Ghosh, D. Mayurdhwaj Sanke, D. Maity, K. Karmakar, D. Sarkar, S. S. Zade and G. Gopal Khan, ACS Appl. Nano Mater., 2021, 4, 6111–6123 CrossRef CAS
.
- P. S. Basavarajappa, S. B. Patil, N. Ganganagappa, K. R. Reddy, A. V. Raghu and C. V. Reddy, Int. J. Hydrogen Energy, 2020, 45, 7764–7778 CrossRef CAS
.
- M. V. Dozzi and E. Selli, J. Photochem. Photobiol., C, 2013, 14, 13–28 CrossRef CAS
.
- N. G. Ghosh, A. Sarkar, C. Kumar, H. S. Karmakar, D. M. Sanke and S. S. Zade, Sustainable Energy Fuels, 2022, 6, 2343–2357 RSC
.
- W. Cui, H. Bai, J. Shang, F. Wang, D. Xu, J. Ding, W. Fan and W. Shi, Electrochim. Acta, 2020, 349, 136383 CrossRef CAS
.
- J. Bouclé, S. Chyla, M. S. P. Shaffer, J. R. Durrant, D. D. C. Bradley and J. Nelson, C. R. Phys., 2008, 9, 110–118 CrossRef
.
- H. S. Karmakar, A. Sarkar, N. G. Ghosh, D. M. Sanke, C. Kumar, S. Das and S. S. Zade, Chemosphere, 2022, 301, 134696 CrossRef CAS PubMed
.
- F. Würthner, Chem. Commun., 2004, 1564–1579 RSC
.
- J. M. Serin, D. W. Brousmiche and J. M. J. Fréchet, Chem. Commun., 2002, 2605–2607 RSC
.
- R. Gvishi, R. Reisfeld and Z. Burshtein, Chem. Phys. Lett., 1993, 213, 338–344 CrossRef CAS
.
- X. Zhan, Z. Tan, B. Domercq, Z. An, X. Zhang, S. Barlow, Y. Li, D. Zhu, B. Kippelen and S. R. Marder, J. Am. Chem. Soc., 2007, 129, 7246–7247 CrossRef CAS PubMed
.
- M. J. Ahrens, M. J. Fuller and M. R. Wasielewski, Chem. Mater., 2003, 15, 2684–2686 CrossRef CAS
.
- R. K. Gupta and A. A. Sudhakar, Langmuir, 2019, 35, 2455–2479 CrossRef CAS PubMed
.
- J. D. Schultz, A. F. Coleman, A. Mandal, J. Y. Shin, M. A. Ratner, R. M. Young and M. R. Wasielewski, J. Phys. Chem. Lett., 2019, 10, 7498–7504 CrossRef CAS PubMed
.
- C. Huang, S. Barlow and S. R. Marder, J. Org. Chem., 2011, 76, 2386–2407 CrossRef CAS PubMed
.
- F. Zhang, W. Li, T. Jiang, X. Li, Y. Shao, Y. Ma and J. Wu, RSC Adv., 2020, 10, 23024–23037 RSC
.
- A. A. V. Yingzhi Chen, A. Li, X. Yue, Lu-N. Wang, Z.-H. Huang and F. Kangb, Nanoscale, 2016, 8, 13083–13524 RSC
.
- K. Akers, R. Aroca, A. M. Hort and R. O. Loutfy, Spectrochim. Acta, Part A, 1988, 44, 1129–1135 CrossRef
.
- M. Angelella, C. Wang and M. J. Tauber, J. Phys. Chem. A, 2013, 117, 9196–9204 CrossRef CAS PubMed
.
- J. Pitchaimani, A. Kundu, S. P. Anthony, D. Moon and V. Madhu, ChemistrySelect, 2020, 5, 2070–2074 CrossRef CAS
.
- J. Y. Kim, I. J. Chung, Y. C. Kim and J.-W. Yu, Chem. Phys. Lett., 2004, 398, 367–371 CrossRef CAS
.
- M. Oltean, A. Calborean, G. Mile, M. Vidrighin, M. Iosin, L. Leopold, D. Maniu, N. Leopold and V. Chiş, Spectrochim. Acta, Part A, 2012, 97, 703–710 CrossRef CAS PubMed
.
- Y. Lei, L. D. Zhang, G. W. Meng, G. H. Li, X. Y. Zhang, C. H. Liang, W. Chen and S. X. Wang, Appl. Phys. Lett., 2001, 78, 1125–1127 CrossRef CAS
.
- N. Serpone, D. Lawless and R. Khairutdinov, J. Phys. Chem., 1995, 99, 16646–16654 CrossRef CAS
.
- N. G. Ghosh, A. Sarkar and S. S. Zade, Chem. Eng. J., 2021, 407, 127227 CrossRef CAS
.
- D. M. Sanke, A. Sarkar, S. Das, N. G. Ghosh, H. S. Karmakar and S. S. Zade, Mater. Today Chem., 2023, 33, 101699 CrossRef CAS
.
- D. M. Sanke, N. G. Ghosh, S. Das, H. S. Karmakar, A. Sarkar and S. S. Zade, J. Colloid Interface Sci., 2021, 601, 803–815 CrossRef CAS PubMed
.
- Z. Qin, J. Zhang, H. Zhou, Y. Song and T. He, Nucl. Instrum. Methods Phys. Res., Sect. B, 2000, 170, 406–412 CrossRef CAS
.
- D. M. Sanke, J. Bezboruah, A. V. Munde, S. Roy and S. S. Zade, Energy Fuels, 2023, 37(13), 9538–9547 CrossRef CAS
.
- P. S. Shinde, S. H. Choi, Y. Kim, J. Ryu and J. S. Jang, Phys. Chem. Chem. Phys., 2016, 18, 2495–2509 RSC
.
- S. Wang, P. Xu, J. Tian, Z. Liu and L. Feng, Electrochim. Acta, 2021, 370, 137755 CrossRef CAS
.
- J. Bezboruah, D. M. Sanke, A. V. Munde, S. Das, H. S. Karmakar and S. S. Zade, Int. J. Hydrogen Energy, 2023, 48, 7361–7373 CrossRef CAS
.
- G. Wang, Y. Ling, X. Lu, H. Wang, F. Qian, Y. Tong and Y. Li, Energy Environ. Sci., 2012, 5, 8215 RSC
.
- D. Zhu, C. Guo, J. Liu, L. Wang, Y. Du and S.-Z. Qiao, Chem. Commun., 2017, 53, 10906–10909 RSC
.
- S. A. Lee, J. W. Yang, T. H. Lee, I. J. Park, C. Kim, S. H. Hong, H. Lee, S. Choi, J. Moon, S. Y. Kim, J. Y. Kim and H. W. Jang, Appl. Catal., B, 2022, 317, 121765 CrossRef CAS
.
- S. Han, Y.-C. Pu, L. Zheng, J. Z. Zhang and X. Fang, J. Mater. Chem. A, 2015, 3, 22627–22635 RSC
.
- C. Chen, W. Ma and J. Zhao, Chem. Soc. Rev., 2010, 39, 4206 RSC
.
- X. Chen, S. Shen, L. Guo and S. S. Mao, Chem. Rev., 2010, 110, 6503–6570 CrossRef CAS PubMed
.
- J. Li, S. Wang, J. Chang and L. Feng, Adv. Powder Mater., 2022, 1, 100030 CrossRef
.
- J. Liu, J. Li, M. Shao and M. Wei, J. Mater. Chem. A, 2019, 7, 6327–6336 RSC
.
- J. S. L. Jin Hyun Kim, D. Hansora, P. Sharma and J.-W. Jang, Chem. Soc. Rev., 2019, 48, 1908–1971 RSC
.
- L. Chen, Y. Léger, G. Loget, M. Piriyev, I. Jadli, S. Tricot, T. Rohel, R. Bernard, A. Beck, J. Le Pouliquen, P. Turban, P. Schieffer, C. Levallois, B. Fabre, L. Pedesseau, J. Even, N. Bertru and C. Cornet, Adv. Sci., 2022, 9, 2101661 CrossRef CAS PubMed
.
- R. C. F. Gongming Wang, H. Wang, Y. Ling, Y. Tang, X. Yang, Y. L. Changchun Wang and J. Z. Zhang, Nano Lett., 2011, 11, 3026–3033 CrossRef PubMed
.
- K. Karmakar, A. Sarkar, K. Mandal and G. G. Khan, ACS Sustain. Chem. Eng., 2016, 4, 5693–5702 CrossRef CAS
.
- M. G. Lee, J. W. Yang, I. J. Park, T. H. Lee, H. Park, W. S. Cheon, S. A. Lee, H. Lee, S. G. Ji, J. M. Suh, J. Moon, J. Y. Kim and H. W. Jang, Carbon Energy, 2023, 5(6), 1–15 CrossRef
.
- S. Wang, T. He, J. Yun, Y. Hu, M. Xiao, A. Du and L. Wang, Adv. Funct. Mater., 2018, 28, 1802685 CrossRef
.
- A. Karrab, L. Lecarme, J. C. Lepretre, A. Nourdine, J. Deseure and S. Ammar, Appl. Phys. A, 2022, 128, 474 CrossRef CAS
.
- F. Li, J. Li, L. Gao, Y. Hu, X. Long, S. Wei, C. Wang, J. Jin and J. Ma, J. Mater. Chem. A, 2018, 6, 23478–23485 RSC
.
- L. W. Songcan Wang, T. He, J.-H. Yun, Y. Hu, M. Xiao and A. Du, Adv. Funct. Mater., 2018, 28, 1802685 CrossRef
.
- L. Bian, Q. Du, M. Luo, L. Qu and M. Li, Int. J. Hydrogen Energy, 2017, 42, 25244–25250 CrossRef CAS
.
- R. M. Abdel Hameed and S. S. Medany, Int. J. Hydrogen Energy, 2017, 42, 24117–24130 CrossRef CAS
.
- B. K. Boggs, R. L. King and G. G. Botte, Chem. Commun., 2009, 4859 RSC
.
- R. L. King and G. G. Botte, J. Power Sources, 2011, 196, 2773–2778 CrossRef CAS
.
- W. Fan, B. Zhang, X. Wang, W. Ma, D. Li, Z. Wang, M. Dupuis, J. Shi, S. Liao and C. Li, Energy Environ. Sci., 2020, 13, 238–245 RSC
.
Footnotes |
| † Electronic supplementary information (ESI) available: Synthesis of TiO2, synthesis of PDIEh, NMR. See DOI: https://doi.org/10.1039/d3na00294b |
| ‡ These authors contributed equally to this work. |
| This journal is © The Royal Society of Chemistry 2023 |

