DOI:
10.1039/D3NA00280B
(Paper)
Nanoscale Adv., 2023,
5, 4703-4717
Surface functionalization of extracellular vesicle nanoparticles with antibodies: a first study on the protein corona “variable”†
Received
28th April 2023
, Accepted 19th July 2023
First published on 19th July 2023
Abstract
To be profitably exploited in medicine, nanosized systems must be endowed with biocompatibility, targeting capability, the ability to evade the immune system, and resistance to clearance. Currently, biogenic nanoparticles, such as extracellular vesicles (EVs), are intensively investigated as the platform that naturally recapitulates these highly needed characteristics. EV native targeting properties and pharmacokinetics can be further augmented by decorating the EV surface with specific target ligands as antibodies. However, to date, studies dealing with the functionalization of the EV surface with proteins have never considered the protein corona “variable”, namely the fact that extrinsic proteins may spontaneously adsorb on the EV surface, contributing to determine the surface, and in turn the biological identity of the EV. In this work, we explore and compare the two edge cases of EVs modified with the antibody Cetuximab (CTX) by chemisorption of CTX (through covalent binding via biorthogonal click-chemistry) and by formation of a physisorbed CTX corona. The results indicate that (i) no differences exist between the two formulations in terms of binding affinity imparted by molecular recognition of CTX versus its natural binding partner (epidermal growth factor receptor, EGFR), but (ii) significant differences emerge at the cellular level, where CTX-EVs prepared by click chemistry display superior binding and uptake toward target cells, very likely due to the higher robustness of the CTX anchorage.
Introduction
Extracellular nanoparticles (ENPs) are nanoparticles originating from cells and biological systems, including extracellular vesicles (EVs), lipoproteins, and protein nanoaggregates. They constitute the nanostructured secretome and differ from each other in biological roles and biophysical properties.1 Due to their biological origin, ENPs present lower cytotoxicity and higher colloidal stability in biological fluids than their synthetic counterparts (e.g., liposomes, and synthetic nanoparticles – SNPs).2–4 For these reasons, ENPs are emerging in different medical fields as promising therapeutics and imaging agents.5–10 Among the ENPs, EVs have gained much interest during the last decade mainly due to their outstanding therapeutic performances in cancer therapy11 and regenerative medicine.6,12 EVs are composed of a phospholipid bilayer membrane enriched with lipids, proteins, and carbohydrates enclosing an aqueous core containing soluble proteins, nucleic acids, and metabolites.1,13 The complexity of the EV structure allows their application as up-and-coming biological delivery systems. However, despite promising preclinical data, EV-based therapeutic approaches have been hampered by different issues, including EV-based therapeutic stability, scalability, safety,14 and accumulation in specific organs (e.g., liver and spleen).15 A promising approach to tackle EV-based therapeutic pharmacokinetics16 and tropism limits9,17,18 is represented by the functionalization of the EV surface that can be achieved by endogenous or exogenous strategies. Endogenous EV surface functionalization exploits cellular machinery and involves genetic modification of EV-secreting cells. This challenging approach could lead to unintended cell changes and may not be suitable for introducing unnatural or short-term stable molecules. In contrast, exogenous EV surface functionalization can be achieved by manipulating the EVs after their isolation,16 thus overcoming some of the limitations mentioned above related to the endogenous strategy. Indeed, exogenous modification of EVs is not affected by cellular activity and exploits the richness of chemistry conferred to the biological surface by the presence of tunable molecules such as proteins and carbohydrates.18 Finally, it can be applied to introduce both natural and artificial moieties. One of the most investigated exogenous surface functionalization methods is based on covalently binding target ligands to suitable moieties of membrane proteins or phospholipids19–21 present on EV membranes.18–20 While small molecules such as fluorophores or drugs can be added with a one-step reaction to EV surface components, larger moieties such as antibodies require the preliminary introduction of spacers and clickable groups onto the EV surface, followed by a reaction with suitable units on antibodies or proteins to achieve EV functionalization. During this procedure, EVs are generally reacted with a target protein-enriched solution to achieve a satisfactory increase in the kinetics of the reaction and the conjugation yield.16–19 It has been widely acknowledged that synthetic nanoparticles, when immersed in biofluids, are almost immediately covered by multiple layers of macromolecules (i.e., biomolecular corona – BC).3,4 The BC is a dynamic entity made by some tightly adsorbed macromolecules (the so-called hard corona) and surrounded by weakly adsorbed layer(s) of macromolecules (soft corona). The overall composition is in equilibrium with the medium with which it constantly exchanges macromolecules.22,23 The BC plays a pivotal role in defining the biological properties of the SNPs (e.g., nanoparticle uptake, biodistribution, and toxicity).2,24,25 The most common type of BC is the protein corona (PC), where proteins are the most abundant macromolecules adsorbed on the SNP surface. Very recent studies have demonstrated that the PC also forms around the EV surface during in vivo circulation26–30 (and since then, exponentially increasing efforts have been launched to tackle the understanding of its role in EV colloidal, biophysical, and biological properties). Therefore, it is reasonable to hypothesize that a PC can also form in vitro during the incubation of EVs with macromolecule-enriched fluids, i.e., during the exogenous surface functionalization of EVs. In this work, we explore this aspect for the first time, using EVs derived from red blood cells (REVs) functionalized with an anti-epidermal growth factor receptor (EGFR) monoclonal antibody (Cetuximab, CTX). Functionalized and pristine EVs were compared in terms of morphology, functionalization efficiency, binding activity, and in vitro uptake.
Experimental section
Reagents
Solvents were purchased from Merck and Carlo Erba and used as received without further purification. PBS, DMEM, FBS, and penicillin/streptomycin were purchased from Corning (Mediatech Inc., Manassas, VA, USA). NaN3 was purchased from Sigma Aldrich (St. Louis, MO, USA). Sulfo-Cyanine 7.5 NHS ester was purchased from Lumiprobe GmbH (Germany). DBCO-STP ester, Azido-PEG4-NHS ester, and Cy3 azide were purchased from ClickChemistryTools, (Scottsdale, Az, US). MemGlow™ 488 was purchased from Cytoskeleton, Inc. (Denver, USA). Calcium ionophore (A23187) was purchased from Sigma Aldrich (St. Louis, USA).
Instrumentation
Centrifugation was performed with a 5804R Eppendorf Centrifuge equipped with an A-4-44 rotor, using 15 mL tubes. Ultracentrifugation for large volumes (up to 50 mL) was performed with an Optima XPN-100 equipped with a TY45 Ti rotor (Beckman Coulter, USA) while for small volumes (up to 1.5 mL) we used an Optima MAX-XP using a TLA-55 and a MLS-50 rotor (Beckman Coulter, USA). Images from western blot and gel fluorescence were acquired with a Syngene G![[thin space (1/6-em)]](https://www.rsc.org/images/entities/char_2009.gif) :BOX Chemi XX9 (SYNGENE, UK) and were analyzed and quantified with the software Genesys and GeneTools (SYNGENE, UK). NanoDrop™ OneC (ThermoFisher, Rockford, USA) was used to characterize mCTX. A Zeiss LSM510 with a Plan-Apochromat 63×/1.4 Oil DIC objective (Germany) was used to perform fluorescence confocal microscopy. All the VivaSpin columns used in this work were purchased from Sartorius Stedim Lab Lid (Sperry Way, Stonehouse, UK). A NanoSight NS300 system was used to determine the size distribution and the particle concentration of REV samples (Malvern Technologies, Malvern, UK). A BIAcore X-100 instrument was used for SPR (Cytiva Life Science, Marlborough, MA, USA).
:BOX Chemi XX9 (SYNGENE, UK) and were analyzed and quantified with the software Genesys and GeneTools (SYNGENE, UK). NanoDrop™ OneC (ThermoFisher, Rockford, USA) was used to characterize mCTX. A Zeiss LSM510 with a Plan-Apochromat 63×/1.4 Oil DIC objective (Germany) was used to perform fluorescence confocal microscopy. All the VivaSpin columns used in this work were purchased from Sartorius Stedim Lab Lid (Sperry Way, Stonehouse, UK). A NanoSight NS300 system was used to determine the size distribution and the particle concentration of REV samples (Malvern Technologies, Malvern, UK). A BIAcore X-100 instrument was used for SPR (Cytiva Life Science, Marlborough, MA, USA).
Red blood cell EV (REV) separation
We have submitted all relevant data from our experiments to the EV-TRACK knowledge base (EV-TRACK ID: EV230439).31 REVs were isolated following the guidelines from Usman et al.5 Briefly, after blood collection (100 mL), RBCs were pelleted by centrifugation at 1000×g for 8 minutes at 4 °C and washed three times in PBS without calcium and magnesium. RBCs were further washed two times with CPBS (PBS + 0.1 g L−1 calcium chloride) and transferred into a 75 mm2 tissue culture flask. Calcium ionophore was added to the flask (final concentration 10 mM) and incubated overnight at 37 °C. RBCs (75 mL) were gently collected from the flask, and cellular debris was removed by differential centrifugation (600×g for 20 min, 1600×g for 15 min, 3260×g for 15 min, and 10000×g for 30 min at 4 °C). The pellet was discarded at every step, transferring the supernatant into a fresh tube. The supernatants were filtered through 0.45 μm nylon syringe filters. EVs were collected by ultracentrifugation at 100000×g for 70 min at 4 °C. EV pellets were then resuspended in cold PBS, layered above a 2 mL frozen 60% sucrose cushion, and centrifuged at 100000×g for 16 h at 4 °C, with the deceleration speed set to 0. The red layer of EVs was collected and washed twice with cold PBS and spun at 100000×g for 70 min at 4 °C. Finally, EVs were resuspended in 1 mL of cold PBS.
Cell culture
Two cell lines were used: the epithelial breast cancer cells MDA-MB-231 (ATCC #HTB-26) and the kidney embryo cells HEK293 (ATCC #CRL-1573). Both cell lines were purchased from the American Type Culture Collection (ATCC), Manassas, VA, USA. Cells were cultured in DMEM supplemented with 10% fetal bovine serum (FBS) and 1% penicillin/streptomycin and maintained at 37 °C under 5% CO2. Cells were routinely tested for mycoplasma.
Cetuximab functionalization
Cetuximab (CTX) was kindly provided by Prof. Fabio Corsi (University of Milan) in storage buffer (sterile PBS + 0.1 mM NaN3). The storage buffer was replaced with 0.1 mM NaHCO3, pH 8.4 using a VivaSpin 2000 column with a 50 kDa cut-off. CTX solutions were centrifuged at 2000×g for 15 minutes. The buffer exchange step was carried out thrice by adding 2 mL of NaHCO3 0.1 mM, pH 8.4 at each step. CTX concentration after the buffer exchange process was quantified by using a NanoDrop™ OneC. For antibody functionalization, 200 μL of CTX 0.016 mM was incubated overnight with continuous mixing at 4 °C with 12 equivalents of Sulfo Cyanine 7.5 NHS ester (0.2 mM in DMSO) and 6 equivalents of DBCO STF ester (0.1 mM in DMSO), thus obtaining modified CTX (mCTX). For deactivation, mCTX was incubated overnight at 4 °C with 1 μM of NaN3 in PBS pH 7.4. The DBCO conjugation yield was estimated by incubating a small aliquot of functionalized mCTX with azido-Sulfo Cyanine 3 overnight with continuous mixing at 4 °C. Excess of reagents (Sulfo Cyanine 7.5 NHS ester, DBCO STF ester, azido-Sulfo Cyanine 3 or NaN3) was removed after every step with a Vivaspin 500 column with a 30 kDa cut off by centrifuging the mCTX solution at 12000×g for 15 min and washing it with 500 μL of PBS until no significant signal from the free fluorescent dyes could be detected by UV-vis spectroscopy. mCTX characterization is reported in the ESI.†
Bicinchoninic acid (BCA) assay
Protein concentrations of REVs and RBC homogenate samples were determined with a Pierce™ BCA Protein Assay Kit (ThermoFisher, Rockford, USA), following the manufacturer's instructions.
SDS-page and western blotting
The samples were boiled in reducing SDS sample buffer (80 mM Tris, pH 6.8, 2% SDS, 7.5% glycerol, and 0.01% bromophenol blue) supplemented with 2% 2-mercaptoethanol for 5 min at 95 °C and separated by SDS-PAGE on acrylamide/bisacrylamide 10% gel.32 For densitometric analysis, we used the Image Lab software (Biorad, Hercules, CA, US). For CTX quantification, a calibration curve based on total lane fluorescence intensity was obtained by loading different amounts of mCTX (0.02–2 μg range) on an SDS-PAGE gel (Fig. S3D†). After the electrophoresis run, the gel was imaged by using a Syngene G:BOX Chemi XX9 with an acquisition time of 2 min and 800 nm wavelength. For the WB analysis, the samples were transferred onto a PVDF membrane and blocked overnight with 5% fat-free milk in PBS-0.05% Tween-20 (PBST).32 The PVDF membranes were incubated with the following antibodies (at dilution 1:1000) for 90 min in PBST + fat-free milk 1%: mouse anti-GM130 (610823, clone 35/GM130, BD Biosciences, Germany), mouse anti-Alix (sc-53539, 2H12, Santa Cruz Biotechnology, USA), rabbit ant-Annexin XI (GTX33010, polyclonal, GeneTex, USA), mouse anti-CD47 (sc-59079, BRIC 126, Santa Cruz Biotechnology, USA), mouse anti-CD45 (sc-1178, 35-Z6, Santa Cruz Biotechnology, USA), rabbit anti-EGFR (4406, clone 15F8, Cell Signalling Technology Inc.), mouse anti-HBA1 (H00003039-M02, clone 4F9, Abnova, Jhouzih St., Taipei, Taiwan), and mouse anti-HBB (2H3Abnova, Jhouzih St., Taipei, Taiwan). The membranes were washed thrice for 10 min with PBST and incubated for 1 h with the following secondary antibodies (at dilution 1:3000): rabbit anti-mouse and goat anti-rabbit (Zymed). The blots were detected using a Luminata Classic HRP western substrate (Millipore). The images were acquired using a G:Box Chemi XT Imaging system, as described in Alvisi et al.33
Colorimetric nanoplasmonic (CONAN) assay
The purity of REV preparations from soluble contaminants was tested with the CONAN assay. The assay is a colorimetric test that exploits the aggregation of citrate-capped gold nanoparticles (AuNPs) onto the EV membrane and the formation of the protein corona on the AuNP surface to detect soluble proteins in EV preparations. CONAN assay was performed according to Zendrini et al.34
Atomic force microscopy (AFM) imaging
Atomic force microscopy (AFM) imaging was performed on a Nanosurf NaioAFM equipped with a Multi75-AI-G tip (Budget Sensors). For sample preparation, EVs were resuspended in 100 μL sterile H2O (Milli-Q, Merck Millipore) and diluted 1:10 in H2O. 5 μL of the sample were then spotted onto freshly cleaved mica sheets (Grade V-1, thickness 0.15 mm, size 15 × 15 mm2) and dried at 37 °C for 10 minutes. Images were acquired in tapping mode, with a scan size ranging from 1.5 to 25 μm and a scan speed of 1 s per scanning line. Image processing was performed on Gwyddion ver. 2.61.
Nanoparticle tracking analysis (NTA)
Nanoparticle tracking analysis (NTA) was performed according to the manufacturer's instructions using a NanoSight NS300 system configured with a 532 nm laser. The samples were diluted 1:1000 in filtered PBS (0.22 μm) to a final volume of 1 mL to obtain the optimal particle per frame value (20–100 particles/frame). A syringe pump with constant flow injection was used (20 μL min−1), and the temperature was set constant at 25 °C. Particles were detected at a camera level of 10 and three videos of 60 s were captured and analyzed with NTA software version 3.2. The mean, mode, and median EV sizes from each video were used to calculate the sample concentration, expressed in particles per mL.35
REV functionalization and labeling
REVs were functionalized following a two-step labeling strategy. 200 μL of 8 × 10¹¹ EV per mL REV solution was reacted with 200, 500, or 1000 equivalents of PEG4-NHS-ester (diluted in PBS) overnight with continuous mixing at 4 °C. PEG excess was removed using a Vivaspin 500 column with a 10 kDa cut-off, washing the samples five times with 500 μL of PBS. Pegylated REVs were recovered from the column with 200 μL of PBS. 200 μL of pegylated REVs (8 × 10¹¹ particles per mL) were then reacted overnight with continuous mixing at 4 °C with 200, 500, or 1000 equivalents of mCTX (in PBS, pH 7.4). The unreacted antibody was removed by ultracentrifugation (100000×g, 2 h), and the pellet was resuspended in 100 μL of PBS and stored at 4 °C until use. REV labeling with MemGlow™ 488 was performed following standard customer protocols. REVs were incubated with MemGlow™ 488 100 nM for 15 min, and then excess MemGlow™ 488 was removed by ultracentrifugation (100000×g, 2 h).
Surface plasmon resonance (SPR)
A BIAcore X-100 instrument was used. Human EGFR was immobilized by standard amine-coupling chemistry on a research grade CM5 sensor chip, whose surface consists of a carboxymethylated dextran matrix. In detail, EGFR was resuspended at 15 μg mL−1 in 10 mM sodium acetate pH 4.8 and injected for 180 s at a flow rate of 10 mL min−1 on one cell of the sensor chip previously activated with a mixture of 1-ethyl-3-(3-dimethylaminopropyl)carbodiimide hydrochloride (0.2 M) and N-hydroxy-succinimide (0.5 M). Following EGFR binding the surface was deactivated with ethanolamine. With this procedure, three different biosensors have been generated and used for the analysis presented in the work with the amount of immobilized EGFR receptor varying between 1400 and 2500 resonance units (RU) (equal to 8–13 fmol mm−2). On the second cell used as a negative control for blank subtraction, a blank immobilization was performed. For binding analysis, increasing concentrations of the various proteins and EVs were resuspended in 0.01 M HEPES pH 7.4, 0.15 M NaCl, 3.0 mM EDTA, 0.005% v/v surfactant P20 (HBS), injected over the sensor chips for 180 s at a flow rate of 30 μL min−1 to allow their association with the immobilized EGFR and then washed until dissociation. To preserve the immobilized receptor, the multi-step kinetics (MKS) model was adopted,36 where the compounds are injected at increasing concentrations within a single scan without regeneration of the surface after each injection.
In vitro uptake assay
MDA-MB-231 cells were seeded on 12 mm-sized coverslips, precoated with 50 μg mL−1 type I bovine collagen (TB03, Alphabioregen) as 200000 cells per mL in 150 μL of complete media. After 24 h, cells were treated for 4 h and 24 h with MemGlow™ 488 labeled REVs, REVs-physi-mCTX, REVs-click-mCTX, and mCTX in media with or without FBS. Each treatment was carried out using comparable amounts of REVs (1010 EVs per mL) and CTX (1.61 × 10⁻¹ nM). The cells were washed once with PBS 1X without CaCl2 and MgCl2 (21-040-CV, Corning) and then fixed with 3% paraformaldehyde (PFA) solution for 15 minutes at room temperature (RT). PFA was quenched with 50 mM NH4Cl for 10 minutes at RT. The cells were washed twice with PBS 1× and permeabilized with 0.3% saponin in PBS 1× for 10 minutes at RT. Cellular nuclei were stained with DAPI (Invitrogen, 1:600). Cells were washed twice with PBS 1× and once with bidistilled H2O, and coverslips were mounted using ProLong™ Gold Antifade Mountant (P36934, Invitrogen). For EV uptake analysis, 1024 × 1024 pixel images were acquired with a Zeiss LSM510 with a Plan-Apochromat 63×/1.4 Oil DIC objective, with a 0.2% 405 nm laser for DAPI and 0.2% 488 nm laser for MemGlow™ 488. Images were quantified with the software ZEN 3.6. For mCTX uptake analysis, coverslips were also acquired with Syngene G:BOX Chemi XX9 following standard protocols present in the software for detecting Cy7.5 and DAPI. For each treatment, MemGlow™ 488 and CTX fluorescence signals were normalized to DAPI fluorescence.
Results and discussion
CTX modification and characterization
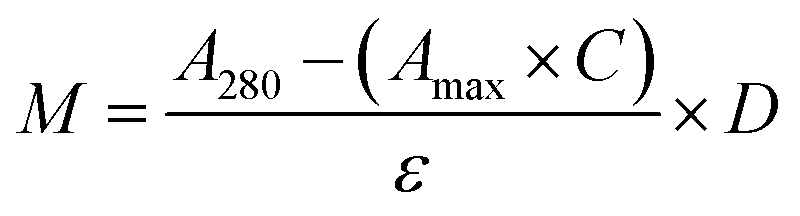
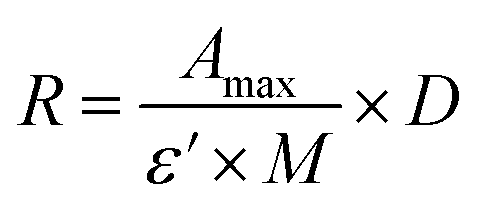
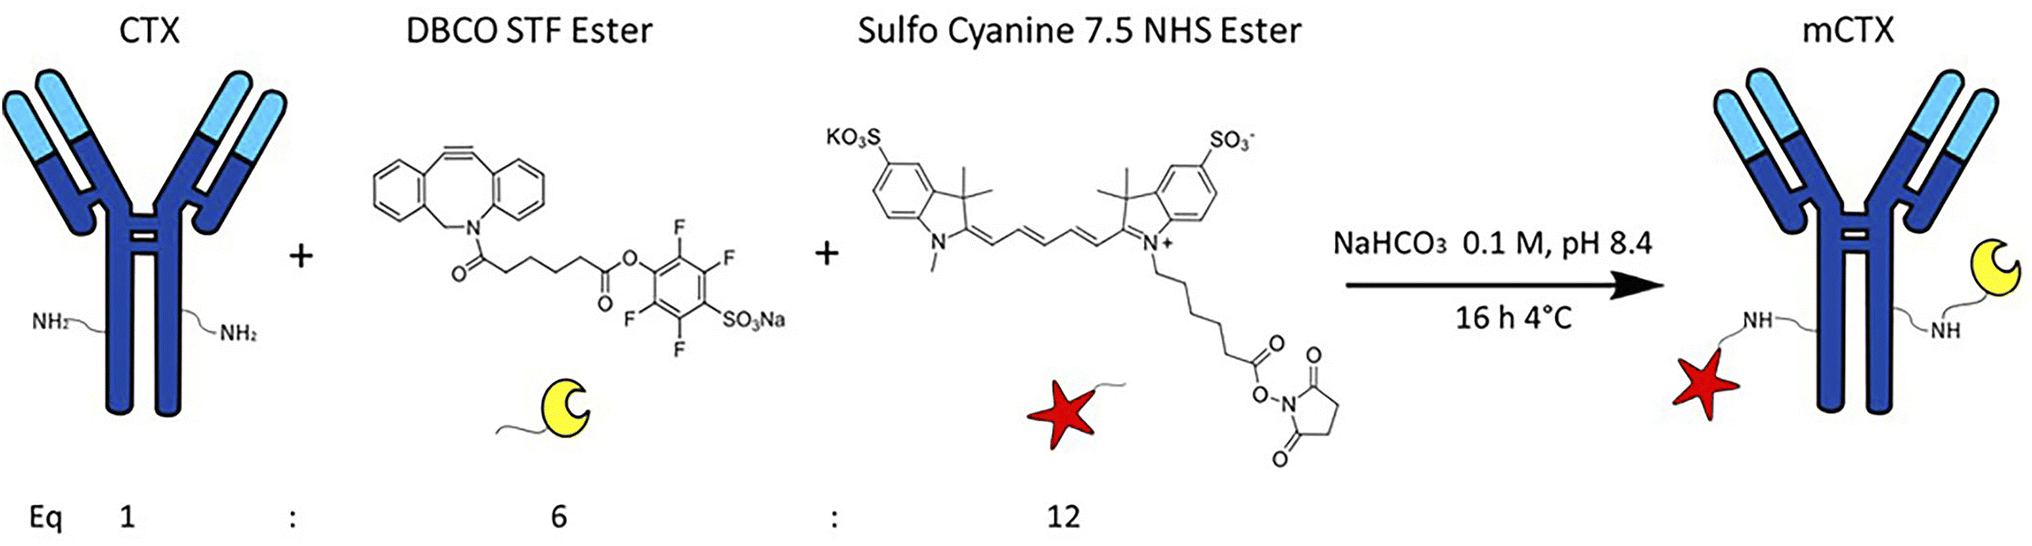
CTX chemical modification was optimized for REV surface functionalization. We exploited the coupling between primary amines (mainly the amino group on the side chain of lysines of the antibody) and activated esters (see the Experimental section). We adopted this strategy to covalently bind the fluorophore (Sulfo Cyanine 7.5, Cy7.5) and the alkyne unit (dibenzocyclooctyne, DBCO) in order to permit tracking of CTX and coupling with the azido groups added on the REV surface (see the REV surface functionalization section), respectively (see Fig. 1). The complete procedure used to functionalize and characterize CTX is given in Fig. S1A.† CTX modification was optimized to introduce functional units while keeping antibody binding ability. Two reaction ratios were tested to find the better condition to bind approximately 1 DBCO and 2 Cy7.5 to the CTX (see Table S1† for the detailed summary of CTX modification). In the optimized protocol, CTX was reacted with 12 equivalents of Cy7.5 and 6 equivalents of DBCO. After purification, modified CTX (mCTX), was characterized by UV-vis spectroscopy (Fig. S1B†) to determine the number of dyes attached to the antibody by using the following equations:| |  | (1) |
| |  | (2) |
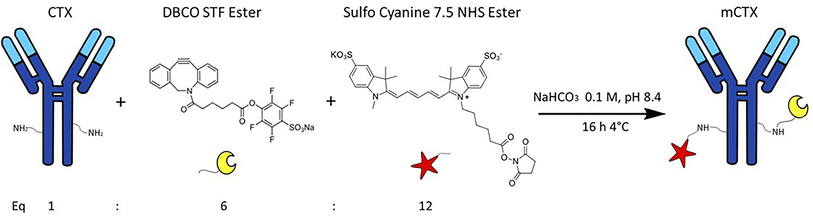 |
| | Fig. 1 Strategy for Cetuximab (CTX) modification (mCTX). CTX was reacted with 12 equivalents of Cy7.5-NHS-ester and 6 equivalents of DBCO-STF-ester in buffer NaHCO3 at pH 8.4, for 16 hours at 4 °C. The isolated reaction product is named mCTX. | |
Eqn (1) was used to estimate the CTX molar concentration (M), while eqn (2) was used to calculate the antibody/dye ratio. In the equations, D is the dilution factor, A280 is the absorbance at 280 nm, Amax is the absorbance of the peak of the fluorophore, C is the correction factor, while ε and ε′ are the molar extinction coefficients of the antibody (210000 M−1 cm−1) and the dye (Cy7.5: 220000 M−1 cm−1, Cy3: 150000 M−1 cm−1) respectively. DBCO quantification was performed by reacting an aliquot of mCTX with 6 equivalents of azido-Sulfo Cyanine 3 (Cy3). This step is required due to the low molar extinction coefficient of DBCO and the proximity of its peak with a more intense protein signal at 280 nm, which hampers direct DBCO quantification by UV-vis spectroscopy. UV-vis spectra of mCTX-Cy3 (Fig. S1C†) were used to calculate the degree of CTX labeling by Cy3 using eqn (1) and (2), assuming that DBCO is completely consumed to bind Cy3, due to the high kinetics and excess used for the reaction. Our calculations showed that each CTX binds on average 1.3 molecules of DBCO and 2 molecules of Cy7.5. The approximately 1:1 ratio between CTX and DBCO is pivotal to avoid CTX with multiple DBCO units binding to different REVs at the same time. To create a control sample unable to bind azido groups (de-activated modified CTX, DmCTX), an aliquot of mCTX was reacted with NaN3 to consume any DBCO (see the Experimental section). DmCTX showed not to undergo Cy3 ligation, indicating the successful deactivation of DBCO (Fig. S1D†).
Biophysical and biochemical characterization of red blood cell-EVs
REVs were obtained following the protocol described by Usman et al.5 and characterized according to the most updated guidelines for EV characterization.37 Specifically, nanoparticle tracking analysis (NTA), BCA, atomic force microscopy (AFM), western blot, and CONAN assay34 were used to determine the EV particle number and size distribution, protein concentration, morphology, protein markers, and the presence of soluble protein contaminants, respectively (Fig. S2†). All these data highlighted that REV preparations were suitable for functionalization purposes: indeed, the monomodal size distribution and the negligible amount of soluble proteins38,39 prevent possible interference during functionalization processes. Furthermore, western blot analyses confirmed the absence of EGFR on REVs, avoiding unspecific, undesired immunological binding of mCTX during functionalization processes (Fig. S2C†).
REV surface functionalization
For REV surface functionalization, we followed the experimental workflow depicted in Fig. 2A. We adopted a two-step chemical labeling strategy16 (see the Experimental section), exploiting the strain-promoted alkyne–azide cycloaddition (SPAAC) reaction between an azido group and an alkyne to covalently bind mCTX to the EV surface. REVs were first reacted with an N3-(PEG)4-NHS ester (reaction ratio 1:200 REVs:N3-(PEG)4-NHS ester) to introduce a clickable group onto the REV surface. A non-clickable (without azido-PEG) control sample was prepared to explore the eventual physisorption of mCTX onto the EV surface (REVs underwent the same workup procedure as pegylated REVs). Clickable and non-clickable samples were reacted with mCTX (reaction ratio 1:200 REVs:mCTX) and washed by dilution with PBS followed by ultracentrifugation to remove unreacted antibodies, obtaining REVs-click-mCTX and REVs-physi-mCTX, respectively. As shown in Fig. 2B, the size distribution of REVs was not affected by the functionalization process, indicating no significant morphological changes due to surface functionalization. The CONAN assay was performed to verify the presence of non-EV-associated antibodies.34 The samples tested showed the same AuNP aggregation properties of native EVs, thus indicating that the eventual amount of free antibody present in the solution is negligible (see Fig. 2C). CTX binding on REV was evaluated by SDS-PAGE followed by fluorescence imaging exploiting the fluorescent dye (Cy7.5) linked to mCTX. The densitometric fluorescence profile was acquired from the gel image, and differences between REVs-click-mCTX, REVs-physi-mCTX, and mCTX were observed (Fig. 2D), strongly suggesting the successful covalent ligation of mCTX to EV proteins by the click-chemistry reaction. Indeed, lane 1 of SDS-PAGE displays the electrophoretic profile of REVs-click-mCTX as composed of higher molecular weight bands with respect to free mCTX (lane 3). This profile is likely ascribable to an increase in mCTX heavy and light chain molecular weight due to the covalent bonding with EV membrane proteins. Interestingly, the intensity of light chain and heavy chain band signals was lower in REVs-click-mCTX than in mCTX, further confirming the covalent bonding. REVs-physi-mCTX (lane 2) showed the presence of an mCTX heavy chain and light chain with a densitometric profile similar to that of mCTX (lane 3), suggesting that mCTX might be physisorbed on the EV surface without the azido-PEG unit. In order to quantify CTX on functionalized REVs, a calibration curve based on total lane fluorescence intensity was obtained by loading different amounts of mCTX (0.02–2 μg range) in an SDS-PAGE gel (Fig. S3D†). Quantification of CTX molar concentration, normalized for REV molar concentration, is shown in Fig. 2E. Data indicated that a similar number of antibodies was present on REVs-click-mCTX and REVs-physi-mCTX (approximately 90 molecules of mCTX per EV), despite the differences in the densitometric profile described above. Furthermore, we performed a control reaction of the functionalization process using DmCTX, and the reaction yield was quantified as above. As shown in Fig. S3C,† about 90 DmCTX molecules per EV were co-isolated with REVs-physi-DmCTX, while REVs-click-DmCTX showed a negligible co-isolation yield, suggesting that active DBCO is required to react with the azido group on pegylated REVs. This result fosters the hypothesis of the anti-fouling properties exerted by PEG on the REV surface. The PEG anti-fouling effect has already been largely explored and exploited for synthetic NPs,40,41 and our data highlight the role of pegylation in inhibiting the physisorption of DmCTX. All these pieces of experimental evidence strongly indicate that our strategies led to REV surface functionalization through the two different mechanisms we aimed at: the first mechanism featuring chemisorption, through the formation of a covalent bond by the click-chemistry reaction, and the second featuring the formation of a physisorbed PC.
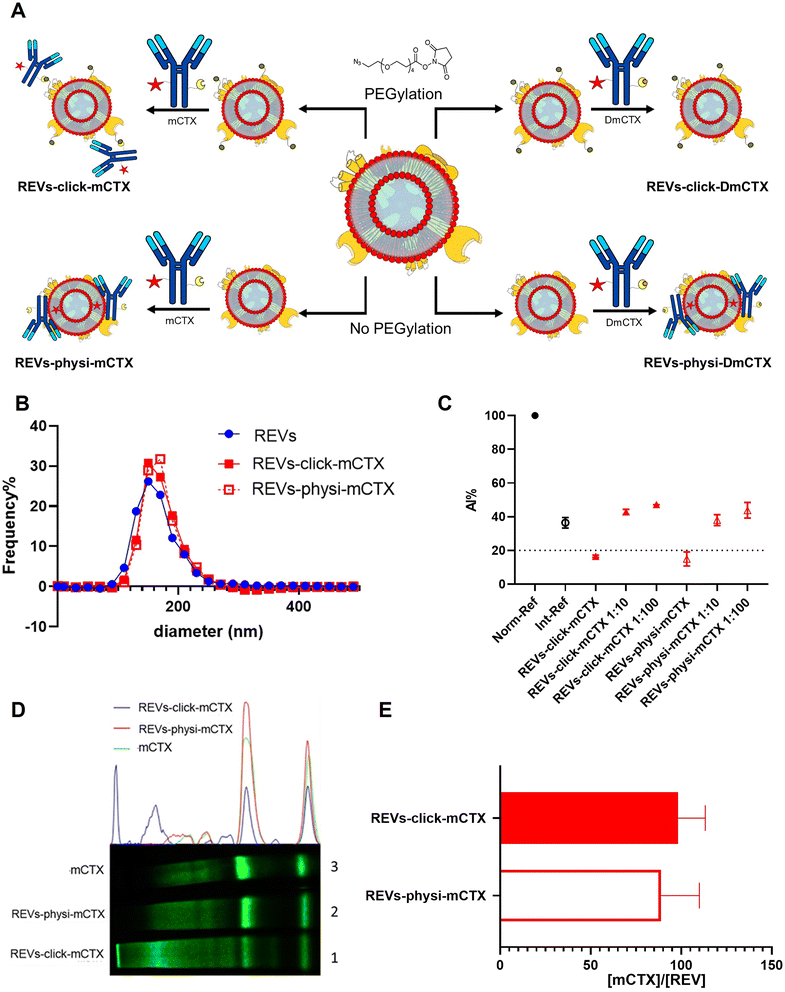 |
| | Fig. 2 REV surface functionalization by the chemical or physical strategy. (A) Schematic representation of the functionalization processes followed. (B) Size distribution of functionalized samples determined by NTA shows no significant differences compared to that of the native REVs. Data are expressed in frequency %. The diameter bin width has been set to 20 nm. N = 3. (C) In the CONAN assay,34 the Int-REF AI ratio defines the threshold below which the spectral redshift is only due to the interaction between the AuNPs and the EVs. Functionalized REVs were tested undiluted and after 10 and 100-fold dilutions. The dotted line represents the CONAN assay threshold for soluble protein detection (<20% AI ratio means that the soluble protein content is ≤0.05 μg μL−1) (D). SDS-PAGE and relative fluorescence densitometric profiles of REVs-click-mCTX (lane 1, 20 μL), REVs-physi-mCTX (lane 2, 20 μL) and mCTX (lane 3, 1 μg). (E) mCTX per REV yields of functionalized samples. Data are elaborated as the molar concentration of mCTX (see Fig. S3D†) normalized by the molar concentration of REVs of the sample. N = 5. | |
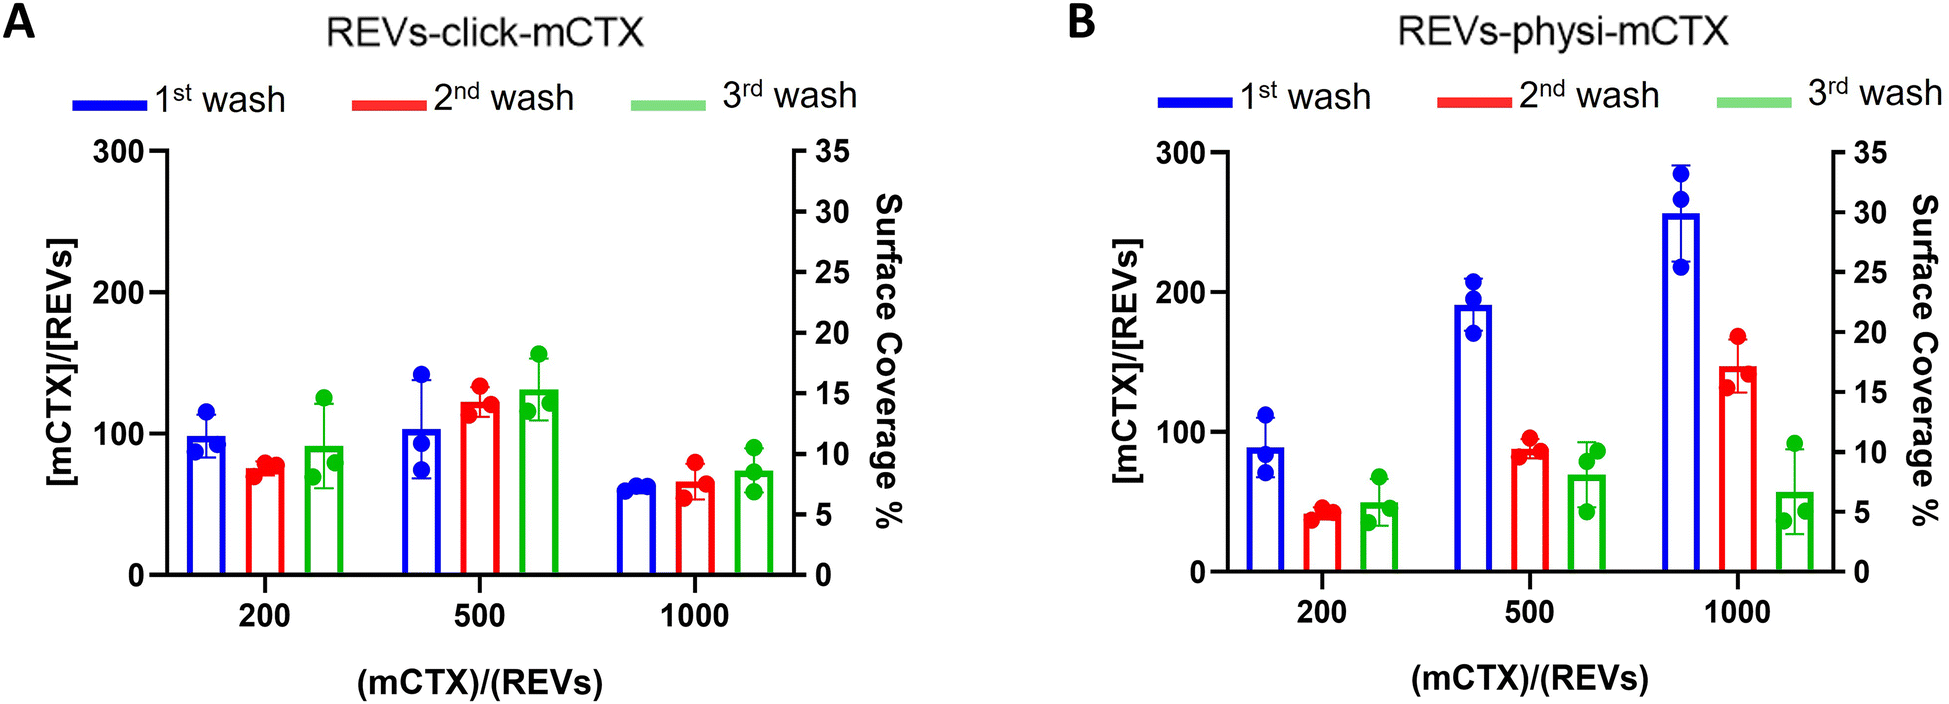
Next, we performed a dose-dependent functionalization assay to optimize the functionalization process by modifying REVs by CTX chemisorption or physisorption as described above, with different mCTX-to-REV ratios. The mCTX/REV amount relative to samples produced with three different REV:mCTX reaction ratios of 1:200, 1:500, and 1:1000 (these are the same reaction ratios previously used to introduce PEG on EV surface) was quantified immediately after the first wash following functionalization (Fig. 3A and B, blue bar). Moreover, to evaluate the stability of the binding, a second and third wash was performed (red and green bars, respectively, Fig. 3A and B), as described in the Experimental section. Concerning REVs-click-mCTX, the results indicated that 200 equivalents of antibodies per REVs allowed the saturation of the binding sites present on the REV surface, and theoretical calculations (normalizing the total area generated by the antibodies for the surface of the REVs and approximating mCTX to a sphere with a radius of 5.5 nm) indicated that under these conditions mCTX covered approximately 10–15% of the REV surface. In addition, REVs-click-mCTX showed a constant mCTX amount per REV for all the reaction ratios after every washing step (see Fig. 3A), again supporting that mCTX was covalently bound to the REV surface. Considering that 23% of the REV surface is occupied by membrane proteins,42 such a result about surface coverage is probably due to a combination of the saturation of the binding sites on the REV surface, the antifouling properties of PEG chains, and the steric hindrance generated by mCTX attached to the REV surface. On the other hand, the REVs-physi-mCTX samples showed a proportional increase in the co-isolation of mCTX per EV with increasing reaction ratios after the first wash (see Fig. 3B, blue bars). In the higher reaction ratio (1:1000, blue bar), mCTX covers up to 30% of the total REV surface, but after further washes, the mCTX amount per REV dramatically decreases, indicating that antibodies are likely to be physisorbed on the REV surface rather than being stably bound. For 1:200 and 1:500 ratios, after the second wash, the amount of mCTX per REV reached a stable value of ∼50 mCTX per REV, representing 5% of the surface coverage. This data could indicate the formation of a first layer of mCTX more strongly physisorbed onto the REV surface than the others. These considerations are in accordance with the general description of the PC as a multilayered entity with the stability of the protein layers decreasing with the distance from the EV surface:43,44 the more stable layer constitutes the so-called hard PC, while the soft PC is made of the more loosely attached layers.24
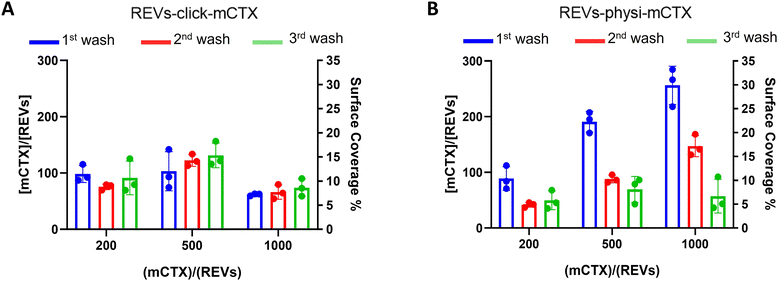 |
| | Fig. 3 mCTX dose-dependent functionalization assay and mCTX stability assay on REVs. (A) mCTX per REV ratio and % of REV surface coverage by CTX of REVs-click-mCTX, obtained by using different REV/mCTX reaction ratios (1:200, 1:500, and 1:1000) were determined after one (blue bar), two (red bar) and three (green bar) washes following the chemical functionalization strategy. n = 3. (B) mCTX per REV ratio and % of REV surface coverage by CTX of REVs-physi-mCTX, obtained by using different REV/mCTX reaction ratios (1:200, 1:500, and 1:1000) were determined after one (blue bar), two (red bar) and three (green bar) washes following the chemical functionalization strategy. n = 3. | |
Evaluation of the binding capacity of REVs-click-mCTX and REVs-physi-mCTX to the EGFR
We next evaluated the binding of REVs-click-mCTX and REVs-physi-mCTX towards the EGFR by surface plasmon resonance (SPR) technology, already exploited by our group for binding studies of growth factors and EVs.45,46 To this aim, the EGFR was immobilized onto an SPR sensor chip by an amine-coupling procedure (see the Experimental section). First, the functionality of the EGFR-containing biosensor was validated using the epidermal growth factor (EGF), the natural ligand of the EGFR. Saturation curves plotted with the binding values at equilibrium (Fig. 4) were obtained which allowed the calculation of the dissociation constant (Kd) value, which is inversely proportional to the binding affinity. As shown in Fig. 4A, the EGF bonded to the EGFR in a dose-dependent and saturable way with a Kd equal to 67.3 nM (ESI Table S2†), in line with the values already reported in the literature.47 The EGFR-containing biosensor was then used to evaluate the binding of CTX before or after its chemical modification. As shown in Fig. 4B, CTX bonded to the EGFR in a saturable and dose-dependent way with a Kd equal to 1.8 nM (ESI Table S2†), as already reported in the literature.48 The chemical modification introduced in mCTX leads to an apparent, limited decrease in affinity (Kd equal to 3.6 nM, ESI Table S2†). On the basis of the positive results obtained with control proteins, the EGFR-containing biosensor was then used to evaluate the EGFR-binding affinity of the differently functionalized REVs (Fig. 2A). As shown in Fig. S4,† injection of increasing concentrations of REVs-click-mCTX onto the EGFR-containing biosensor provided saturable and dose-dependent sensor grams. The binding of the vesicles to the EGFR is very stable, as indicated by their slow detachment from the surface after the end of the injection phase. Also, the binding is CTX-dependent, as demonstrated by the lack of binding of native REVs, devoid of surface-associated antibodies (Fig. S4†). The Kd for the REVs-click-mCTX/EGFR interaction is equal to 0.17 nM (Table S2†). Also, REVs-physi-mCTX binds to the EGFR in a specific, stable, dose-dependent, and saturable way (Fig. 4C and S4†), with an affinity that is similar to that of REVs-click-mCTX (Table S2†). This result suggests that the association between mCTX and REVs is quantitatively similar despite the different functionalization strategies. It is also worth mentioning the high affinity of the EGFR/REVs-click-mCTX interaction, which is 10 times higher than that of free mCTX (ESI Table S2†). It is tentative to hypothesize that a cooperative interaction process49,50 occurred at the interface between the sensor chip surface and the vesicle that generates a very high affinity binding. Interestingly, a high affinity cooperative binding has been already demonstrated for the interaction of immunoliposomes carrying an anti-ephrin A2 single chain fragment with ephrin A2.51 The saturation response (Rmax) is known to be dependent on the amount of the surface-immobilized ligand available for the binding. REVs-physi-mCTX showed an Rmax value that is four times lower than that of REVs-click-mCTX (33 ± 2.5 and 150.0 ± 35.5, respectively, Fig. 4C). It is tentative to hypothesize that when weakly adsorbed on REVs-physi-mCTX, the antibody “moves” from the vesicle to the EGFR-coated surface, where it remains firmly bound, decreasing the amount of EGFR available to interact with other REVs. Conversely, this does not occur in REVs-click-mCTX, where mCTX is covalently anchored to the REV surface. The stability of the association of CTX to REVs obtained by physisorption or by chemisorption may have important implications on the vesicle uptake in vitro (see below) and their practical therapeutic use.52 In this work, DmCTX has been generated to demonstrate the essential role of DBCO in mCTX association with REVs and the anti-fouling properties of pegylation (see above). As expected, based on the similar amount of antibody associated (Fig. S3D†), REVs-physi-DmCTX retains an EGFR-binding affinity very close to that of REVs-physi-mCTX, confirming that DmCTX behaves as mCTX in interacting with the EGFR and that it can be absorbed on the REV surface as mCTX. Although endowed with a negligible amount of associated antibody REVs-click-DmCTX binds to the EGFR with high capacity (measured as maximal RU bound), which occurs in a non-saturable manner (Fig. 4C) and with a very low affinity (Kd > 33 μM, ESI Table S2†), indicating a non-specific interaction.53 This anomalous behavior is likely due to the presence on REVs of unreacted azido-PEG that, as already reported,45,46 could interact in a non-specific way with biosensor surfaces. Whatever the cause of this non-specific binding, these results confirm that the interaction of CTX with the azido-pegylated EV surface occurs only when it possesses a reactive DBCO group. To summarize, SPR experiments confirmed that REVs can be functionalized with mCTX following biorthogonal and physisorption strategies, where both methods produce samples with a similar affinity for the EGFR but with different stabilities of antibody association. Furthermore, SPR analysis of pegylated and unpegylated REVs functionalized with DmCTX confirmed the co-isolation reported above (Fig. S3D†).
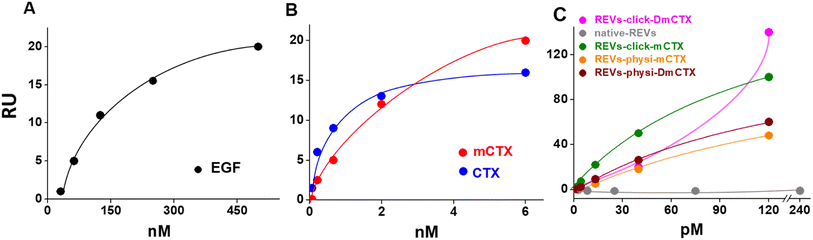 |
| | Fig. 4 SPR binding analysis on the EGFR-functionalized biosensor. Significative binding isotherms obtained by fitting the amount of the formed complex at equilibrium (in resonance units, RU, obtained from single cycle analysis) versus concentrations in a solution of EGF (A), CTX and mCTX (B), and REVs (C). In the binding isotherms of the REVs (C), the x-axis represents concentration of native or functionalized REVs (pM). | |
In vitro cell uptake of REVs-click-mCTX and REVs-physi-mCTX
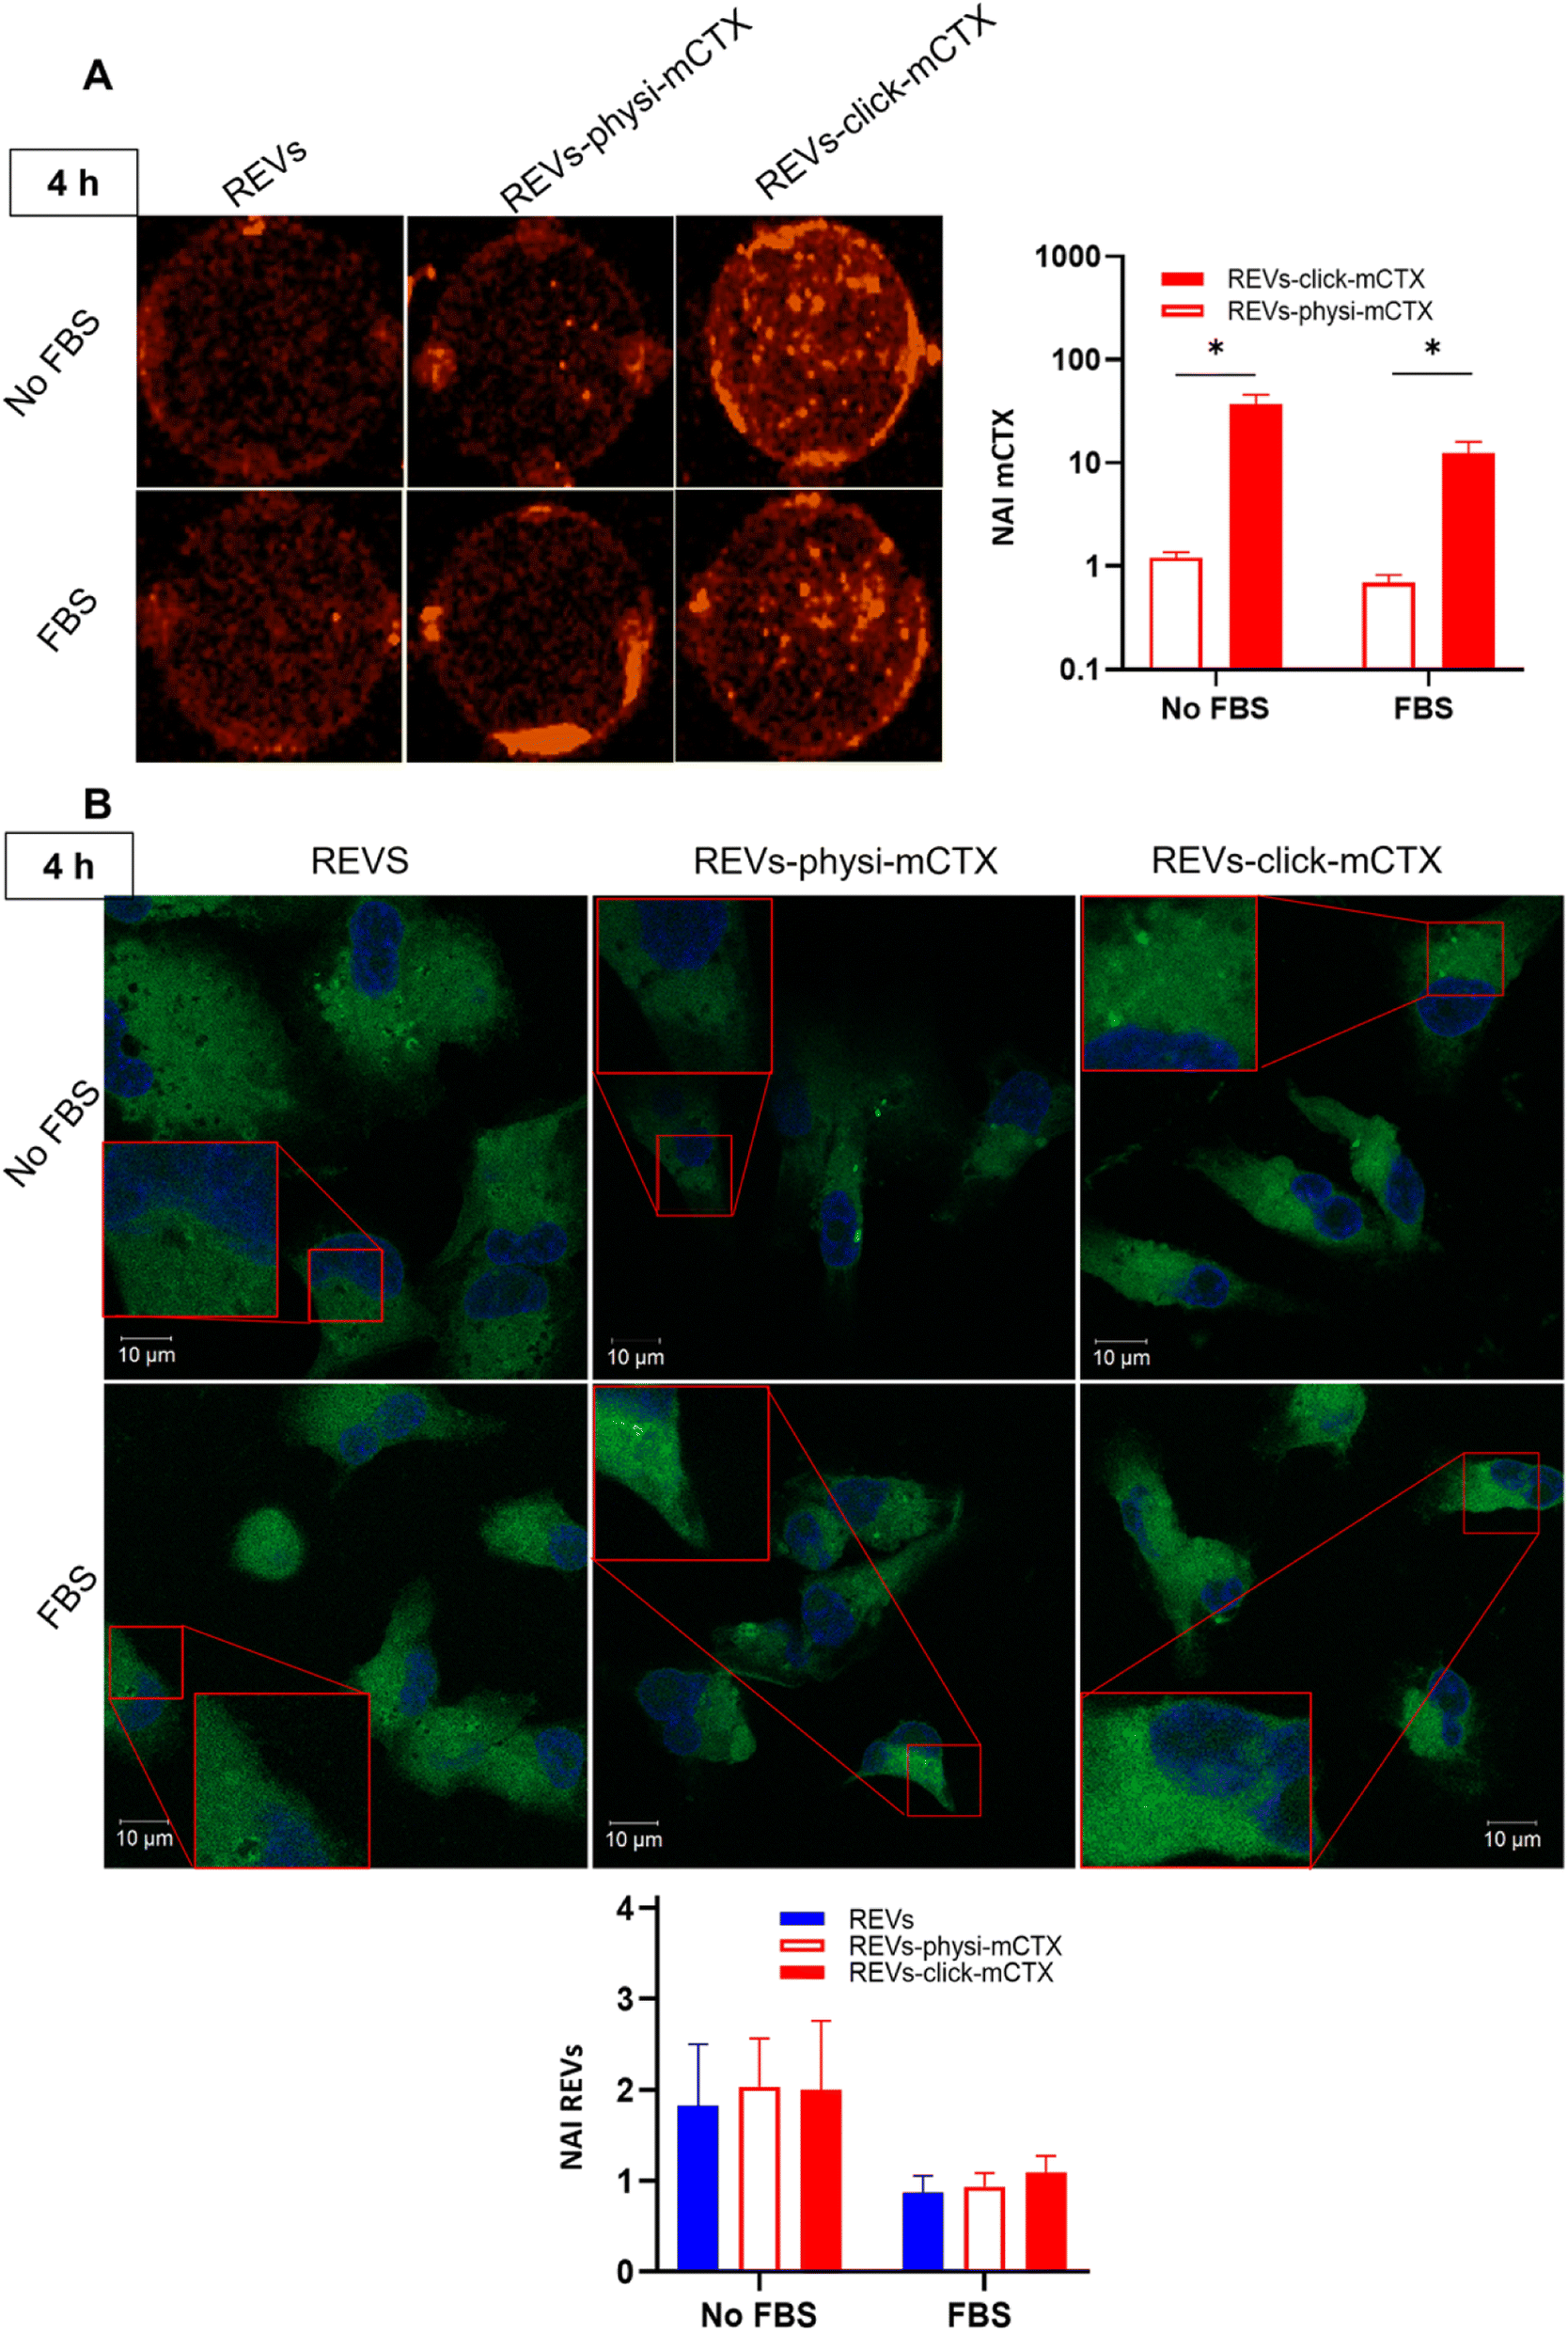
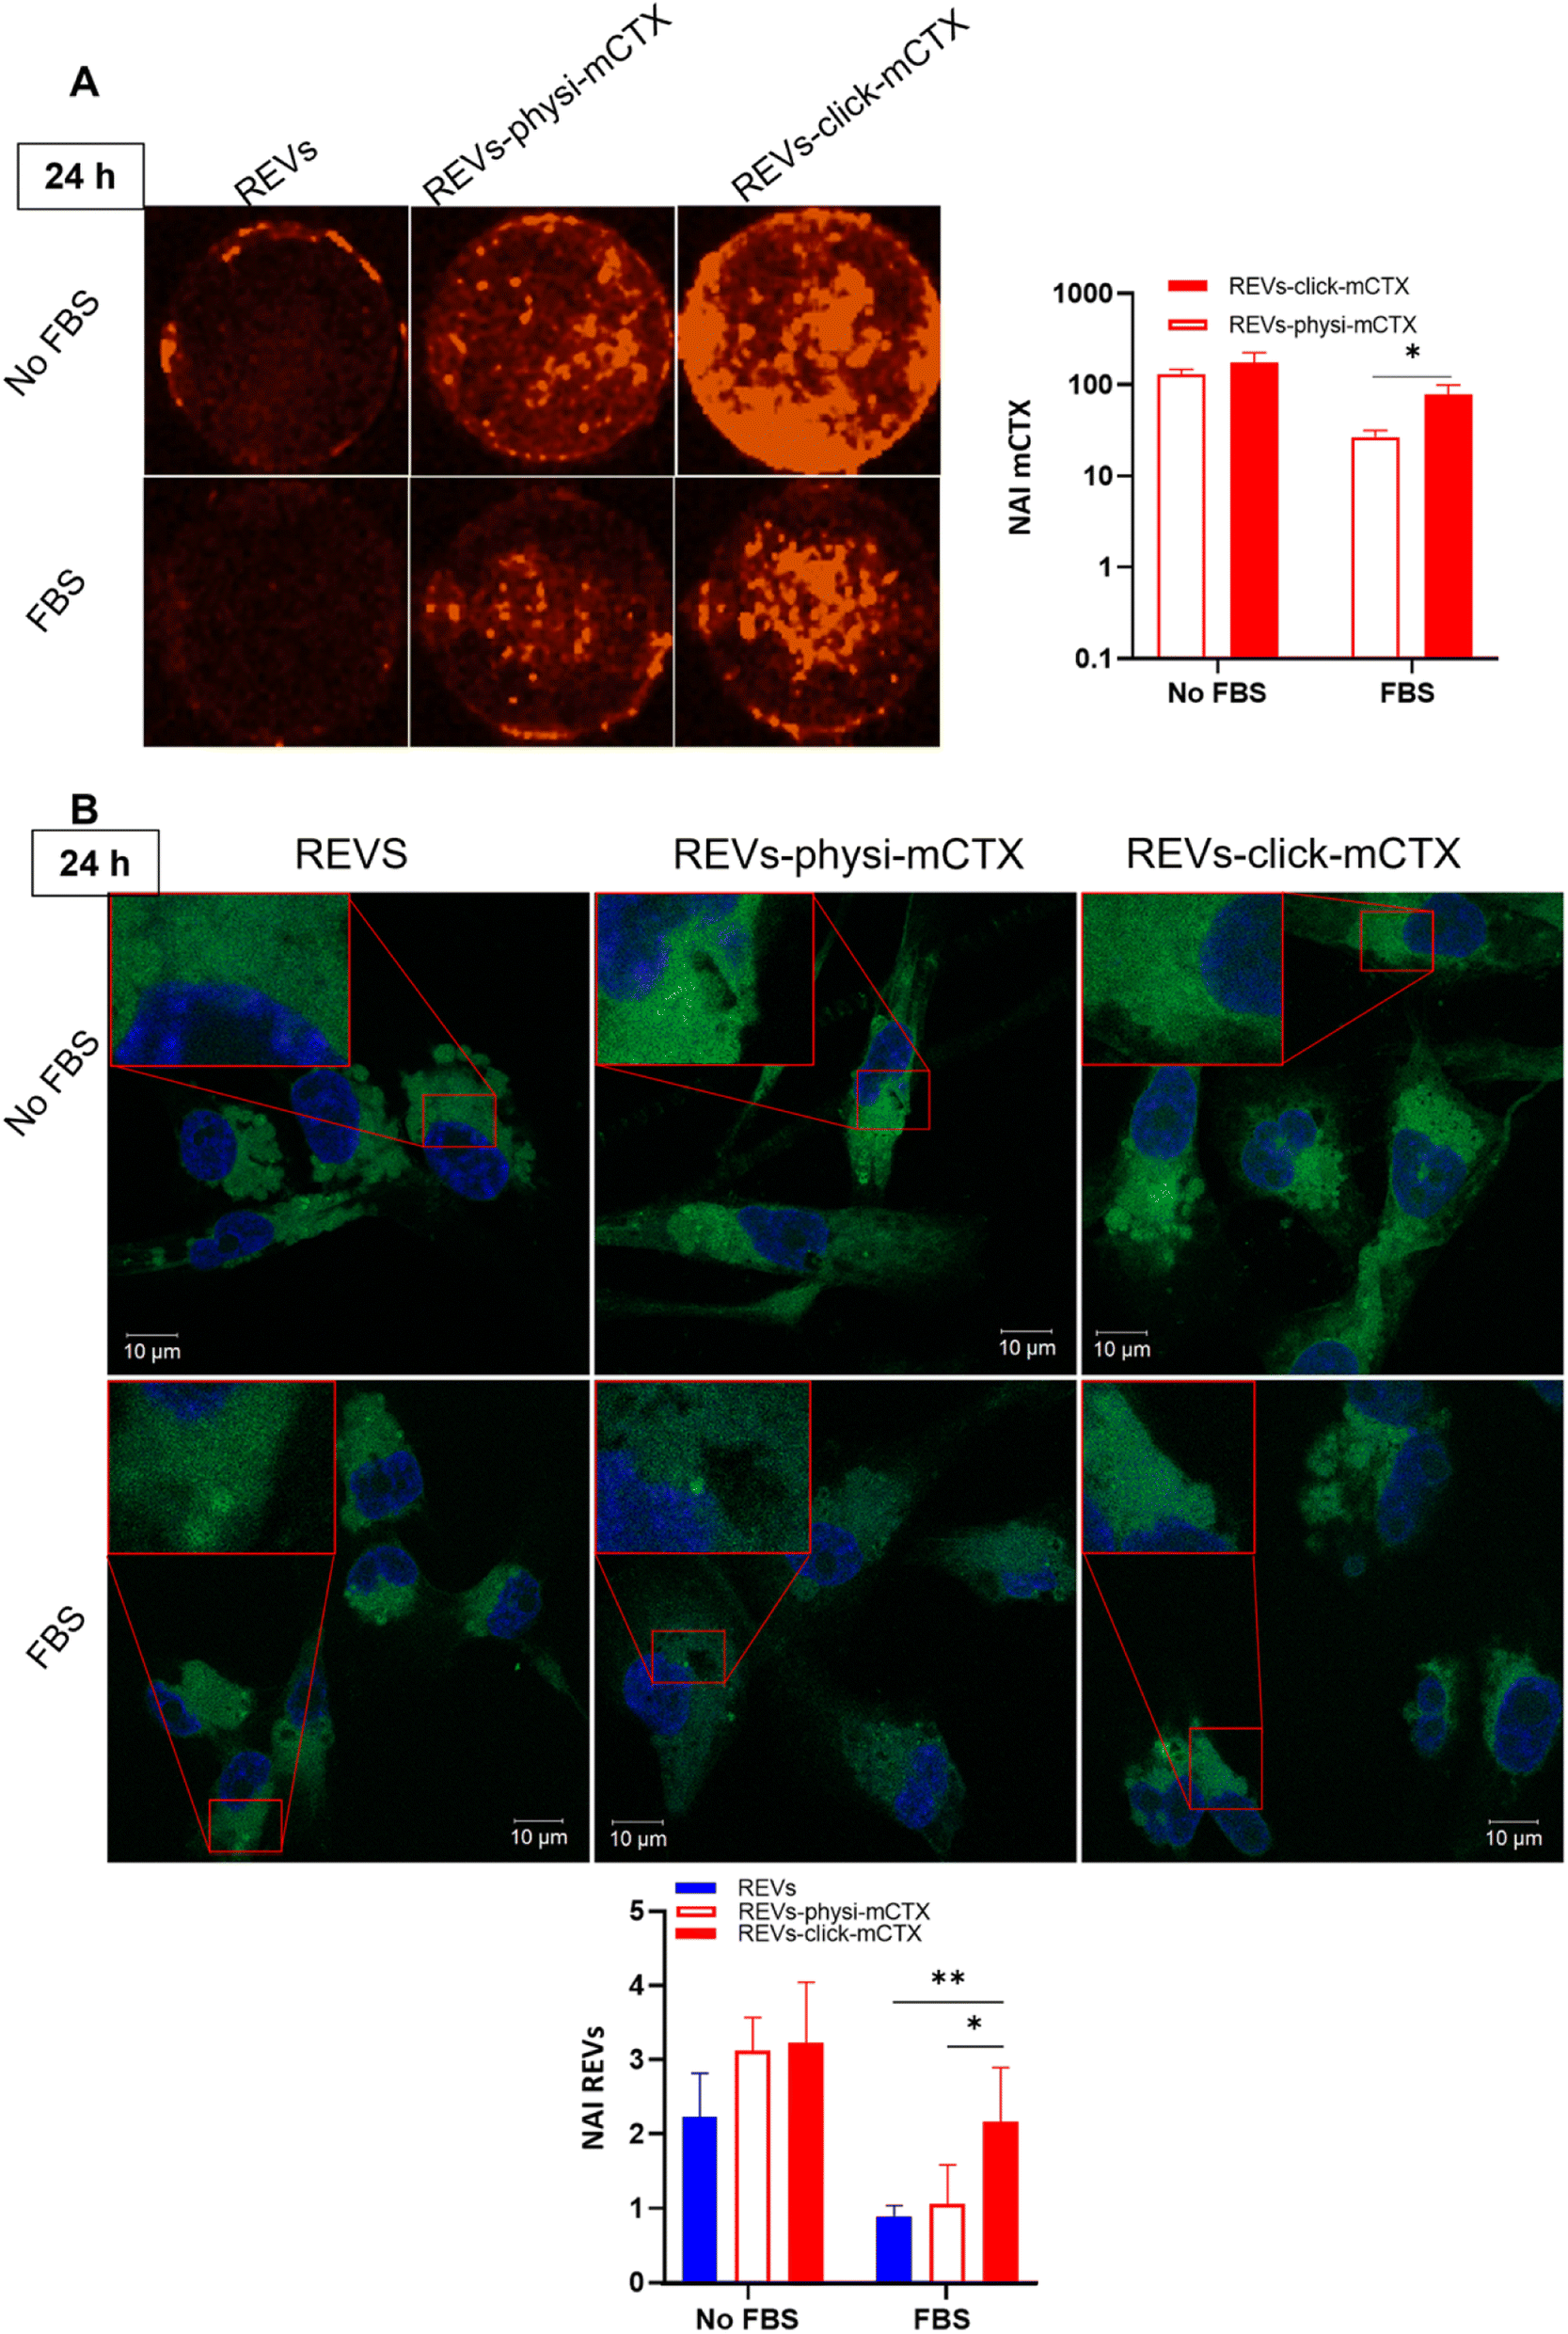
Modifying the EV surface by introducing suitable molecules for targeted drug delivery increases the chances for EVs to be taken up by cells via specific receptor-mediated endocytosis.43,44 SPR data showed that REVs-click-mCTX and REVs-physi-mCTX have the same affinity towards the EGFR. Therefore, in principle, at the cellular level, both functionalized EVs are in a position to trigger the same uptake pathway by activating EGFR-mediated endocytosis. We assessed the targeting and uptake of the modified REV samples in vitro using MDA-MB-231 triple-negative breast cancer cells expressing high levels of EGFR.54,55 EGFR expression in MDA-MB-231 cells was confirmed by western blot analysis, showing a 1.55-fold expression level when compared with control cells, namely HEK293T epithelial-like immortalized kidney cells53 known to express basal levels of EGFR (Fig. S5†).56 Cells were treated with equal particle numbers of REVs-click-mCTX and REVs-physi-mCTX for 4 and 24 h in the presence or absence of fetal bovine serum (FBS), used here to best mimic the physiological environment. The cellular internalization of the REVs was evaluated by following both mCTX and REV uptake quantifying the fluorescence of Sulfo Cyanine 7.5 (mCTX, red) and the Fluorogenic Membrane Probe MemGlow™ 48857 (REVs, green), respectively (see Fig. S6† for characterization). At first glance, it was evident that the addition of FBS decreases the overall uptake of both mCTX and REVs at 4 and 24 h (Fig. 5 and 6), thus suggesting a competition mechanism between the heterogeneous FBS components with REVs, as observed by Salvati et al. for transferrin-functionalized NPs.58 After 4 h treatments, REVs-click-mCTX showed a significantly higher mCTX uptake than REVs-physi-mCTX whether the treatments were carried out with or without FBS (Fig. 5A). However, we did not observe relevant differences in REV uptake between functionalized samples and the control pristine REVs, suggesting that other interactions, independent of mCTX-EGFR recognition, can still happen at early time points59 (Fig. 5B). After 24 h, REV-click-mCTX showed significantly higher mCTX uptake compared to REV-physi-mCTX only in the presence of FBS (Fig. 6A). This difference is also reflected in REV uptake related to REV-click-mCTX, which is significantly higher than that of pristine REVs and REV-physi-mCTX (Fig. 6B). Interestingly, REVs and REVs-physi-mCTX uptake was experimentally equal at each time point under FBS-containing conditions. These data can be, at first instance, explained by the fact that REV-physi-mCTX should be more sensitive to protein exchange when immersed in biological media, leading to decreased EGFR-mediated cellular uptake. As mentioned earlier, pristine NPs and EVs are immediately coated by a BC once immersed in a biofluid, which (re)sets their targeting, uptake, and biodistribution profiles.22,29 Mostly due to its dynamic properties60,61 in biofluids, BC features and morphology evolve due to the continuous adsorption/desorption of loosely bound proteins primarily enriched in the soft corona.24,62 Altogether, these results suggested that in a biological fluid containing a physiological concentration of proteins, such as the one containing FBS, REVs-click-mCTX, and REVs-physi-mCTX did not maintain the same EGFR-targeting ability and that mCTX functionalization by physisorption did not improve EV targeting ability with respect to that of pristine REVs (Fig. 6B).
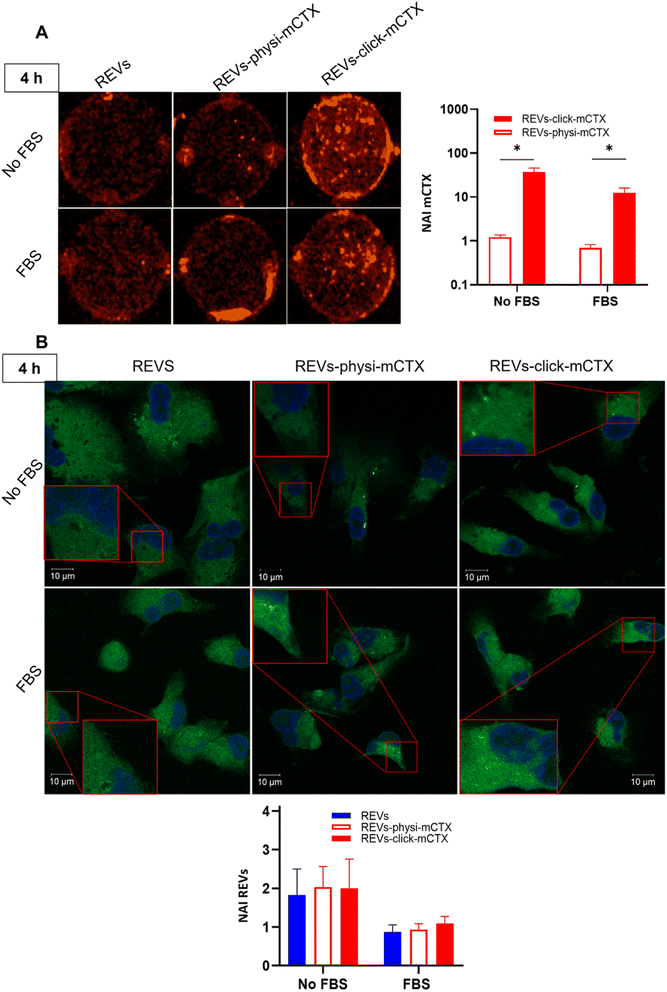 |
| | Fig. 5 (A) In vitro mCTX uptake assay. Fluorescence image and quantification of MDA-MB-231 cells after the treatment with REVs-click-mCTX and REVs-physi-mCTX at 4 h in the absence (no FBS) and in the presence of FBS. The red fluorescence is related to mCTX. *p value < 0.05. (B). In vitro REV uptake assay. Confocal microscopy image and quantification of MDA-MB-231 cells after the treatment with REVs-click-mCTX and REVs-physi-mCTX at 4 h in the absence (no FBS) and in the presence of FBS. The green fluorescence is related to MemGlow™ 488, while the blue is related to DAPI. *p value < 0.05. NAI = normalized adjusted intensity. The y axis is reported as a logarithmic scale for graphs in (A) and linear scale for (B). | |
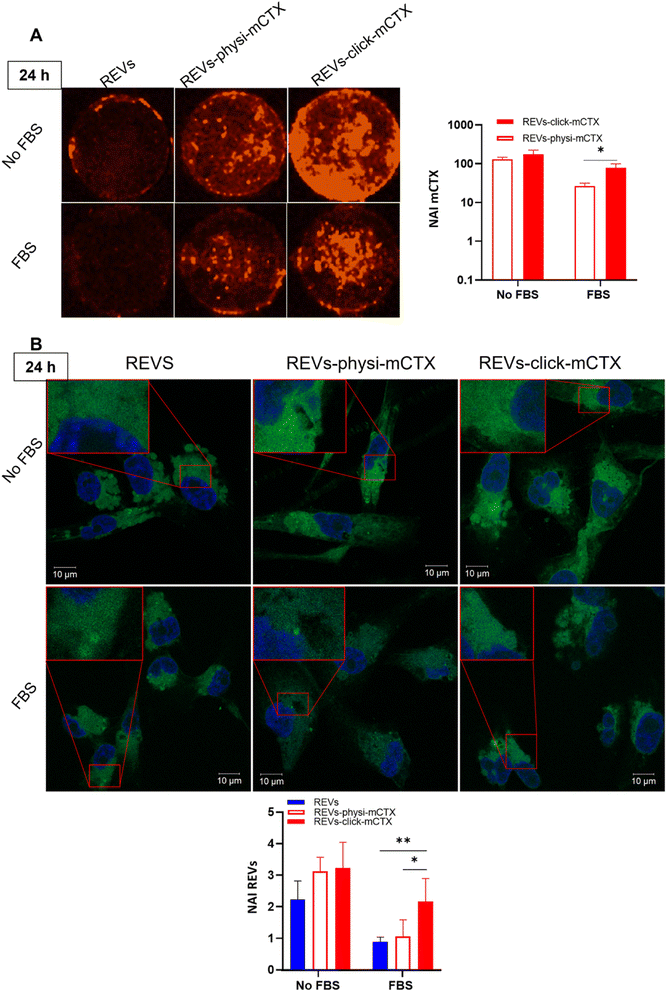 |
| | Fig. 6 (A) In vitro mCTX uptake assay. Fluorescence image and quantification of MDA-MB-231 cells after the treatment with REVs-click-mCTX and REVs-physi-mCTX at 24 h in the absence and in the presence of FBS. The red fluorescence is related to mCTX. *p value < 0.05. (B) In vitro REV uptake assay. Confocal microscopy image and quantification of MDA-MB-231 cells after the treatment with REVs-click-mCTX and REVs-physi-mCTX at 24 h in the absence (No FBS) and in the presence of FBS. The green fluorescence is related to MemGlow™ 488, while the blue is to DAPI. *p value < 0.05; **p value < 0.01. NAI = normalized adjusted intensity. The y axis is reported as a logarithmic scale for graphs in (A) and linear scale for (B). | |
Conclusions
The present work focuses on the exploration of the influence and role BC has in the exogenous surface functionalization of EVs with targeting antibodies. In parallel, it evidences the key importance of the rigorous understanding and control of all the functionalization processes, from the choice and preparation of antibodies to the final in vitro functional evaluation, a characteristic too often underrated in the literature. We developed and optimized the modified CTX by introducing a red-emitting fluorophore (Cy7.5) and clickable unit (DBCO). mCTX was then used to functionalize REV surfaces by chemisorption (covalent binding of mCTX via biorthogonal click-chemistry) and physisorption (formation of a CTX corona). Both approaches did not affect REV morphology. The covalent bonds established between REV surface proteins and mCTX by click-chemistry allowed the functionalization of the REV surface, resulting in changes in the mCTX electrophoretic profile. Besides, mCTX physisorbed on the REV surface was dynamic and in equilibrium with the media. mCTX-EGFR molecular recognition was carefully verified by comparing mCTX and CTX's binding curves on an EGFR-functionalized biosensor, demonstrating that the modification of the antibody did not affect its binding. The same biosensor was then used to study the binding of functionalized REVs. SPR functional assay demonstrated that both REVs functionalized by chemisorbed and physisorbed mCTX bind EGFR with fairly consistent affinity. In vitro tests showed that in the presence of FBS, a condition closer to the physiological milieu, only the covalent anchorage of mCTX led to increased uptake of the REVs correlated with the increased uptake of mCTX. On the other hand, the presence of FBS-related proteins forces an exchange of biomolecules between the PC made by mCTX on the REV surface and the medium, leading to a loss of functionality. Although EV-BC derived from biofluids has been shown to bestow functional features to EVs,63 the PC derived from EV surface functionalization by physisorption seems to not be functional for drug delivery applications. Future studies on the kinetics of release and on the residual number of CTX molecules still adsorbed on EVs after incubation in an FBS complex medium could help to explain the different functionalities between chemi- and physisorbed EVs. Thus, the covalent anchorage of antibodies onto the EV surface is required to improve specific EV recognition by the cells and guarantee the delivery of therapeutic cargo. These findings give a first evaluation of the effect of the spontaneous biomolecule physisorption during EV surface functionalization (namely BC formation), and this should be carefully considered (and further elaborated) when designing and preparing surface-functionalized EVs. Further work is needed to characterize the role of BC in the formulation of surface-functionalized EVs with other molecules, such as proteins and peptides, to support the exploitation of different functionalization strategies for developing delivery vehicles, imaging agents, or bio nano-therapeutics.
Author contributions
Conceptualization: A. R., G. P., and P. B.; data curation: A. M., R. Z., M. R., C. U., and A. Z.; funding acquisition: A. R. and P. B.; investigation: A. M., R. Z., Mi. R., L. P., A. Z., S. A., S. T., and C. U.; methodology: A. M., R. Z., Mi. R., G. P., and A. R.; project administration: G. P., A. R., and P. B.; resources: G. P., A. R, P. B., and M. R.; supervision: G. P., A. R., and P. B.; visualization: A. M.; writing – original draft: A. M., G. P., and A. R.; writing – review & editing: all authors.
Conflicts of interest
There are no conflicts to declare.
Acknowledgements
This work was supported by MIUR through the PRIN 2017E3A2NR_004 project for A. R. and P. B. and Center for Colloid and Surface Science (CSGI) through the BOW project, Horizon 2020 – Future and emerging technologies (H2020 – FETOPEN), ID: No. 952183 for P. B. and L. P. The authors would like to thank Dr Marina Cretich (SCITEC-CNR, Milan, Italy) for NTA measurements and Prof. Fabio Corsi (University of Milan, Italy) for providing the Cetuximab antibody.
References
- S. Busatto, A. Zendrini, A. Radeghieri, L. Paolini, M. Romano, M. Presta and P. Bergese, The nanostructured secretome, Biomater. Sci., 2020, 8, 39–63, 10.1039/c9bm01007f.
- C. Corbo, R. Molinaro, M. Tabatabaei, O. C. Farokhzad and M. Mahmoudi, Personalized Protein Corona on Nanoparticles and Its Clinical Implications, Biomater. Sci., 2017, 5, 378–387, 10.1039/c6bm00921b.
- Z. Ji, X. Jin, S. George, T. Xia, H. Meng, X. Wang, E. Suarez, H. Zhang, E. M. V. Hoek, H. Godwin, A. E. Nel and J. I. Zink, Dispersion and Stability Optimization of TiO2 Nanoparticles in Cell Culture Media, Environ. Sci. Technol., 2010, 44, 7309–7314, DOI:10.1021/es100417s.
- E. Casals, T. Pfaller, A. Duschl, G. J. Oostingh and V. F. Puntes, Hardening of the Nanoparticle-Protein Corona in Metal (Au, Ag) and Oxide (Fe3O4, CoO, and CeO2) Nanoparticles, Small, 2011, 7, 3479–3486, DOI:10.1002/smll.201101511.
- W. M. Usman, T. C. Pham, Y. Y. Kwok, L. T. Vu, V. Ma, B. Peng, Y. S. Chan, L. Wei, S. M. Chin, A. Azad, A. B. L. He, A. Y. H. Leung, M. Yang, N. Shyh-Chang, W. C. Cho, J. Shi and M. T. N. Le, Efficient RNA Drug Delivery Using Red Blood Cell Extracellular Vesicles, Nat. Commun., 2018, 9, 2359, DOI:10.1038/s41467-018-04791-8.
- D. Tsiapalis and L. O'Driscoll, Mesenchymal Stem Cell Derived Extracellular Vesicles for Tissue Engineering and D. Tsiapalis and L. O'Driscoll, Mesenchymal Stem Cell Derived Extracellular Vesicles for Tissue Engineering and Regenerative Medicine Applications, Cells, 2020, 9, 991, DOI:10.3390/cells9040991.
- G. Go, H. J. Park, J. H. Lee, C. W. Yun and S. H. Lee, Inhibitory Effect of Oxaliplatin-Loaded Engineered Milk Extracellular Vesicles on Tumor Progression, Anticancer Res., 2022, 42, 857–866, DOI:10.21873/anticanres.15543.
- A. A. Khan, F. Man, F. N. Faruqu, J. Kim, F. Al-Salemee, A. Carrascal-Miniño, A. Volpe, R. Liam-Or, P. Simpson, G. O. Fruhwirth, K. T. Al-Jamal and R. T. M. de Rosales, PET Imaging of Small Extracellular Vesicles via [89Zr]Zr(Oxinate)4 Direct Radiolabeling, Bioconjugate Chem., 2022, 33, 473–485, DOI:10.1021/acs.bioconjchem.1c00597.
- I. K. Herrmann, M. J. A. Wood and G. Fuhrmann, Extracellular Vesicles as a Next-Generation Drug Delivery Platform, Nat. Nanotechnol., 2021, 16, 748–759, DOI:10.1038/s41565-021-00931-2.
- T. Tian, H. X. Zhang, C. P. He, S. Fan, Y. L. Zhu, C. Qi, N. P. Huang, Z. D. Xiao, Z. H. Lu, B. A. Tannous and J. Gao, Surface Functionalized Exosomes as Targeted Drug Delivery Vehicles for Cerebral Ischemia Therapy, Biomaterials, 2018, 150, 137–149, DOI:10.1016/j.biomaterials.2017.10.012.
- T. Lener, M. Gimona, L. Aigner, V. Börger, E. Buzas, G. Camussi, N. Chaput, D. Chatterjee, F. A. Court, H. A. del Portillo, L. O'Driscoll, S. Fais, J. M. Falcon-Perez, U. Felderhoff-Mueser, L. Fraile, Y. S. Gho, A. Görgens, R. C. Gupta, A. Hendrix, D. M. Hermann, A. F. Hill, F. Hochberg, P. A. Horn, D. de Kleijn, L. Kordelas, B. W. Kramer, E. M. Krämer-Albers, S. Laner-Plamberger, S. Laitinen, T. Leonardi, M. J. Lorenowicz, S. K. Lim, J. Lötvall, C. A. Maguire, A. Marcilla, I. Nazarenko, T. Ochiya, T. Patel, S. Pedersen, G. Pocsfalvi, S. Pluchino, P. Quesenberry, I. G. Reischl, F. J. Rivera, R. Sanzenbacher, K. Schallmoser, I. Slaper-Cortenbach, D. Strunk, T. Tonn, P. Vader, B. W. M. van Balkom, M. H. M. Wauben, S. el Andaloussi, C. Théry, E. Rohde and B. Giebel, Applying Extracellular Vesicles Based Therapeutics in Clinical Trials – An ISEV Position Paper, J. Extracell. Vesicles, 2015, 4, 30087, DOI:10.3402/jev.v4.30087.
- D. Todorova, S. Simoncini, R. Lacroix, F. Sabatier and F. Dignat-George, Extracellular Vesicles in Angiogenesis, Circ. Res., 2017, 120, 1658–1673, DOI:10.1161/CIRCRESAHA.117.309681.
- J. M. Pitt, G. Kroemer and L. Zitvogel, Extracellular Vesicles: Masters of Intercellular Communication and Potential Clinical Interventions, J. Clin. Invest., 2016, 126, 1139–1143, DOI:10.1172/JCI87316.
- L. Paolini, M. Monguió-Tortajada, M. Costa, F. Antenucci, M. Barilani, M. Clos-Sansalvador, A. Cronemberger Andrade, T. A. P. Driedonks, S. Giancaterino, S. M. Kronstadt, R. R. Mizenko, M. Nawaz, X. Osteikoetxea, C. Pereira, S. Shrivastava, A. Toftegaard Boysen, S. I. van de Wakker, M. J. C. van Herwijnen, X. Wang, D. C. Watson, M. Gimona, M. Kaparakis-Liaskos, K. Konstantinov, S. K. Lim, N. Meisner-Kober, M. Stork, P. Nejsum, A. Radeghieri, E. Rohde, N. Touzet, M. H. M. Wauben, K. W. Witwer, A. Bongiovanni and P. Bergese, Large-scale production of extracellular vesicles: Report on the “massivEVs” ISEV workshop, J. Extracell. Biol., 2022, 1, e63, DOI:10.1002/jex2.63.
- O. P. B. Wiklander, J. Z. Nordin, A. O'Loughlin, Y. Gustafsson, G. Corso, I. Mäger, P. Vader, Y. Lee, H. Sork, Y. Seow, N. Heldring, L. Alvarez-Erviti, C. I. Edvard Smith, K. le Blanc, P. Macchiarini, P. Jungebluth, M. J. A. Wood and S. el Andaloussi, Extracellular Vesicle in Vivo Biodistribution Is Determined by Cell Source, Route of Administration and Targeting, J. Extracell. Vesicles, 2015, 4, 1–13, DOI:10.3402/jev.v4.26316.
- M. Richter, P. Vader and G. Fuhrmann, Approaches to Surface Engineering of Extracellular Vesicles, Adv. Drug Delivery Rev., 2021, 173, 416–426, DOI:10.1016/j.addr.2021.03.020.
- M. Gai, J. Simon, I. Lieberwirth, V. Mailänder, S. Morsbach and K. Landfester, A Bio-Orthogonal Functionalization Strategy for Site-Specific Coupling of Antibodies on Vesicle Surfaces after Self-Assembly, Polym. Chem., 2020, 11, 527–540, 10.1039/c9py01136f.
- T. Smyth, K. Petrova, N. M. Payton, I. Persaud, J. S. Redzic, M. W. Graner, P. Smith-Jones and T. J. Anchordoquy, Surface Functionalization of Exosomes Using Click Chemistry, Bioconjugate Chem., 2014, 25, 1777–1784, DOI:10.1021/bc500291r.
- M. Wang, S. Altinoglu, Y. S. Takeda and Q. Xu, Integrating Protein Engineering and Bioorthogonal Click Conjugation for Extracellular Vesicle Modulation and Intracellular Delivery, PLoS
One, 2015, 10, e0141860, DOI:10.1371/journal.pone.0141860.
- F. N. Faruqu, L. Xu and K. T. Al-Jamal, Preparation of Exosomes for SiRNA Delivery to Cancer Cells, J. Visualized Exp., 2018, 142, e58814, DOI:10.3791/58814.
- H. C. Huang, M. Pigula, Y. Fang and T. Hasan, Immobilization of Photo-Immunoconjugates on Nanoparticles Leads to Enhanced Light-Activated Biological Effects, Small, 2018, 14, 1800236, DOI:10.1002/smll.201800236.
- M. P. Monopoli, C. Åberg, A. Salvati and K. A. Dawson, Biomolecular Coronas Provide the Biological Identity of Nanosized Materials, Nat. Nanotechnol., 2012, 7, 779–786, DOI:10.1038/nnano.2012.207.
- M. Mahmoudi, I. Lynch, M. R. Ejtehadi, M. P. Monopoli, F. B. Bombelli and S. Laurent, Protein-Nanoparticle Interactions: Opportunities and Challenges, Chem. Rev., 2011, 111, 5610–5637, DOI:10.1021/cr100440g.
- K. Kristensen, T. B. Engel, A. Stensballe, J. B. Simonsen and T. L. Andresen, The hard protein corona of stealth liposomes is sparse, J. Controlled Release, 2019, 307, 1–15, DOI:10.1016/j.jconrel.2019.05.042.
- A. L. Capriotti, C. Cavaliere and S. Piovesana, Liposome protein corona characterization as a new approach in nanomedicine, Anal. Bioanal. Chem., 2019, 411, 4313–4326, DOI:10.1007/s00216-019-01656-x.
- E. I. Buzás, E. Tóth, B. W. Sódar and K. Szabó-Taylor, Molecular interactions at the surface of extracellular vesicles, Semin. Immunopathol., 2018, 40, 453–464, DOI:10.1007/s00281-018-0682-0.
- A. Radeghieri, S. Alacqua, A. Zendrini, V. Previcini, F. Todaro, G. Martini, D. Ricotta and P. Bergese, Antithrombin glycoforms are selectively physiosorbed on plasma extracellular vesicles, J. Extracell. Biol., 2022, 1, e57, DOI:10.1101/2021.07.16.452649.
- E. Tóth, L. Turiák, T. Visnovitz, C. Cserép, A. Mázló, B. W. Sódar, A. I. Försönits, G. Petővári, A. Sebestyén, Z. Komlósi, L. Drahos, Á. Kittel, G. Nagy, A. Bácsi, Á. Dénes, Y. S. Gho, K. Szabó-Taylor and E. I. Buzás, Formation of a protein corona on the surface of extracellular vesicles in blood plasma, J. Extracell. Vesicles, 2021, 10, e12140, DOI:10.1002/jev2.12140.
- S. S. Yerneni, T. Solomon, J. Smith and P. G. Campbell, Radioiodination of extravesicular surface constituents to study the biocorona, cell trafficking and storage stability of extracellular vesicles, Biochim. Biophys. Acta, 2022, 1866, 130069, DOI:10.1016/j.bbagen.2021.130069.
- A. Radeghieri and P. Bergese, The biomolecular corona of extracellular nanoparticles holds new promises for advancing clinical molecular diagnostics, Expert Rev. Mol. Diagn., 2023, 23, 471–474, DOI:10.1080/14737159.2023.2215927.
- EV-TRACK Consortium, J. Van Deun, P. Mestdagh, P. Agostinis, Ö. Akay, S. Anand, J. Anckaert, Z. A. Martinez, T. Baetens, E. Beghein, L. Bertier, G. Berx, J. Boere, S. Boukouris, M. Bremer, D. Buschmann, J. B Byrd, C. Casert, L. Cheng, A. Cmoch, D. Daveloose, E. De Smedt, S. Demirsoy, V. Depoorter, B. Dhondt, T. A. P. Driedonks, A. Dudek, A. Elsharawy, I. Floris, A. D. Foers, K. Gärtner, A. D. Garg, E. Geeurickx, J. Gettemans, F. Ghazavi, B. Giebel, T. Groot Kormelink, G. Hancock, H. Helsmoortel, A. F Hill, V. Hyenne, H. Kalra, D. Kim, J. Kowal, S. Kraemer, P. Leidinger, C. Leonelli, Y. Liang, L. Lippens, S. Liu, A. Lo Cicero, S. Martin, S. Mathivanan, P. Mathiyalagan, T. Matusek, G. Milani, M. Monguió-Tortajada, L. M. Mus, D. C. Muth, A. Németh, E. N. M. Nolte-'t Hoen, L. O'Driscoll, R. Palmulli, M. W. Pfaffl, B. Primdal-Bengtson, E. Romano, Q. Rousseau, S. Sahoo, N. Sampaio, M. Samuel, B. Scicluna, B. Soen, A. Steels, J. V. Swinnen, M. Takatalo, S. Thaminy, C. Théry, J. Tulkens, I. Van Audenhove, S. van der Grein, A. Van Goethem, M. J. van Herwijnen, G. Van Niel, N. Van Roy, A. R. Van Vliet, N. Vandamme, S. Vanhauwaert, G. Vergauwen, F. Verweij, A. Wallaert, M. Wauben, K. W. Witwer, M. I. Zonneveld, O. De Wever, J. Vandesompele and A. Hendrix, EV-TRACK: Transparent reporting and centralizing knowledge in extracellular vesicle research, Nat. Methods, 2017, 14, 228–232, DOI:10.1038/nmeth.4185.
- L. Paolini, A. Radeghieri, S. Civini, L. S. Caimi and D. Ricotta, The epsilon hinge-ear region regulates membrane localization of the AP-4 complex, Traffic, 2011, 12, 1604–1619, DOI:10.1111/j.1600-0854.2011.01262.x.
- G. Alvisi, L. Paolini, A. Contarini, C. Zambarda, V. Di Antonio, A. Colosini, N. Mercanelli, M. Timmoneri, G. Palù, L. Caimi, D. Ricotta and A. Radeghieri, Intersectin goes nuclear: secret life of an endocytic protein, Biochem. J., 2018, 475, 1455–1472, DOI:10.1042/BCJ20170897.
- A. Zendrini, L. Paolini, S. Busatto, A. Radeghieri, M. Romano, M. H. M. Wauben, M. J. C. van Herwijnen, P. Nejsum, A. Borup, A. Ridolfi, C. Montis and P. Bergese, Augmented COlorimetric NANoplasmonic (CONAN) Method for Grading Purity and Determine Concentration of EV Microliter Volume Solutions, Front. Bioeng. Biotechnol., 2020, 7, 452, DOI:10.3389/fbioe.2019.00452.
- A. Borup, A. T. Boysen, A. Ridolfi, M. Brucale, F. Valle, L. Paolini, P. Bergese and P. Nejsum, Comparison of separation methods for immunomodulatory extracellular vesicles from helminths, J. Extracell. Biol., 2022, 1, e41, DOI:10.1002/jex2.41.
- H. H. Trutnau, New multi-step kinetics using common affinity biosensors saves time and sample at full access to kinetics and concentration, J. Biotechnol., 2006, 124, 191–195, DOI:10.1016/j.jbiotec.2006.01.006.
- C. Théry,
et al., Minimal information for studies of extracellular vesicles 2018 (MISEV2018): a position statement of the International Society for Extracellular Vesicles and update of the MISEV2014 guidelines, J. Extracell. Vesicles, 2018, 7, 1535750, DOI:10.1080/20013078.2018.1535750.
- A. Zendrini, G. Guerra, K. Sagini, T. Vagner, D. Di Vizio and P. Bergese, On the surface-to-bulk partition of proteins in extracellular vesicles, Colloids Surf., B, 2022, 218, 112728, DOI:10.1016/j.colsurfb.2022.112728.
- E. D. Sverdlov, Amedeo Avogadro's cry: What is 1μg of exosomes?, BioEssays, 2012, 34, 873–875, DOI:10.1002/bies.201200045.
- D. Pozzi, V. Colapicchioni, G. Caracciolo, S. Piovesana, A. L. Capriotti, S. Palchetti, S. De Grossi, A. Riccioli, H. Amenitsch and A. Laganà, Effect of polyethyleneglycol (PEG) chain length on the bio-nano-interactions between PEGylated lipid nanoparticles and biological fluids: from nanostructure to uptake in cancer cells, Nanoscale, 2014, 6, 2782–2792, 10.1039/C3NR05559K.
- S. Palchetti, V. Colapicchioni, L. Digiacomo, G. Caracciolo, D. Pozzi, L. Capriotti, G. La Barbera and A. Laganà, The protein corona of circulating PEGylated liposomes, Biochim. Biophys. Acta, Biomembr., 2016, 1858, 189–196, DOI:10.1016/j.bbamem.2015.11.012.
- A. D. Dupuy and D. M. Engelman, Protein area occupancy at the center of the red blood cell membrane, Proc. Natl. Acad. Sci. U. S. A., 2008, 105, 2848–2852, DOI:10.1073/pnas.0712379105.
- C. J. Richards, M. Ahmadi, M. C. A. Stuart, B. J. Kooi, C. Åberg and W. H. Roos, The effect of biomolecular corona on adsorption onto and desorption from a model lipid membrane, Nanoscale, 2023, 15, 248–253, 10.1039/D2NR05296B.
- P. L. Latreille, M. Le Goas, S. Salimi, J. Robert, G. De Crescenzo, D. C. Boffito, V. A. Martinez, P. Hildgen and X. Banquy, Scratching the Surface of the Protein Corona: Challenging Measurements and Controversies, ACS Nano, 2022, 16, 1689–1707, DOI:10.1021/acsnano.1c05901.
- G. Di Noto, A. Bugatti, A. Zendrini, E. L. Mazzoldi, A. Montanelli, L. Caimi, M. Rusnati, D. Ricotta and P. Bergese, Merging colloidal nanoplasmonics and surface plasmon resonance spectroscopy for enhanced profiling of multiple myeloma-derived exosomes, Biosens. Bioelectron., 2016, 77, 518–524, DOI:10.1016/j.bios.2015.09.061.
- P. Chiodelli, S. Rezzola, C. Urbinati, F. Federici Signori, E. Monti, R. Ronca, M. Presta and M. Rusnati, Contribution of vascular endothelial growth factor receptor-2 sialylation to the process of angiogenesis, Oncogene, 2017, 36, 6531–6541, DOI:10.1038/onc.2017.243.
- A. E. G. Lenferink, E. J. J. Van Zoelen, M. J. H. Van Vugt, S. Grothe S, W. Van Rotterdam, M. L. M. Van De Poll and M. D. O'Connor-McCourt, Superagonistic activation of ErbB-1 by EGF-related growth factors with enhanced association and dissociation rate constants, J. Biol. Chem., 2000, 275, 26748–26753, DOI:10.1016/S0021-9258(19)61439-0.
- M. L. Alvarenga, J. Kikhney, J. Hannewald, A. U. Metzger, K. J. Steffens, J. Bomke, A. Krah and A. Wegener, In-depth biophysical analysis of interactions between therapeutic antibodies and the extracellular domain of the epidermal growth factor receptor, Anal. Biochem., 2012, 421, 138–151 CrossRef CAS PubMed.
- F. Fagagna, M. Giacca and M. Presta, Multiple Interactions of HIV-I Tat Protein with Size-defined Heparin Oligosaccharides, J. Biol. Chem., 1999, 274, 28198–28295, DOI:10.1074/jbc.274.40.28198.
- T. Sugiyama, T. Asai, Y. M. Nedachi, Y. Katanasaka, K. Shimizu, N. Maeda and N. Oku, Enhanced Active Targeting via Cooperative Binding of Ligands on Liposomes to Target Receptors, PLoS One, 2013, 8, e67550, DOI:10.1371/journal.pone.0067550.
- Z. R. Huang, S. K. Tipparaju, D. B. Kirpotin, C. Pien, T. Kornaga, C. O. Noble, A. Koshkaryev, J. Tran, W. S. Kamoun and D. C. Drummond, Formulation optimization of an ephrin A2 targeted immunoliposome encapsulating reversibly modified taxane prodrugs, J. Controlled Release, 2019, 310, 47–57, DOI:10.1016/j.jconrel.2019.08.006.
- L. Paolini, A. Zendrini, G. Di Noto, S. Busatto, E. Lottini, A. Radeghieri, A. Dossi, A. Caneschi, D. Ricotta and P. Bergese, Residual matrix from different separation techniques impacts exosome biological activity, Sci. Rep., 2016, 6, 23550, DOI:10.1038/srep23550.
- P. D'Ursi, M. Uggeri, C. Urbinati, E. Millo, G. Paiardi, L. Milanesi, R. C. Ford, J. Clews, X. Meng, P. Bergese, A. Ridolfi, N. Pedemonte, P. Fossa, A. Orro and M. Rusnati, Exploitation of a novel biosensor based on the full-length human F508del-CFTR with computational studies, biochemical and biological assays for the characterization of a new Lumacaftor/Tezacaftor analogue, Sens. Actuators, B, 2019, 301, 127131, DOI:10.1016/j.snb.2019.127131.
- K. Manupati, N. R. Dhoke, T. Debnath, R. Yeeravalli, K. Guguloth, S. Saeidpour, U. C. De, S. Debnath and A. Das, Inhibiting epidermal growth factor receptor signalling potentiates mesenchymal–epithelial transition of breast cancer stem cells and their responsiveness to anticancer drugs, FEBS J., 2017, 284, 1830–1854, DOI:10.1111/febs.14084.
- C. Garbar, C. e Mascaux, J. Giustiniani, Y. Merrouche and A. Bensussan, Chemotherapy treatment induces an increase of autophagy in the luminal breast cancer cell MCF7, but not in the triple-negative MDA-MB231, Sci. Rep., 2017, 7, 7201, DOI:10.1038/s41598-017-07489-x.
- M. H. Schmidt, F. B. Furnari, W. H. Cavenee and O. Bögler, Epidermal growth factor receptor signaling intensity determines intracellular protein interactions, ubiquitination, and internalization, Proc. Natl. Acad. Sci. U. S. A., 2003, 100, 6505–6510, DOI:10.1073/pnas.10317901.
- M. Collot, P. Ashokkumar, H. Anton, E. Boutant, O. Faklaris, T. Galli, Y. Mély, L. Danglot and A. S. Klymchenko, MemBright: A Family of Fluorescent Membrane Probes for Advanced Cellular Imaging and Neuroscience, Cell Chem. Biol., 2019, 26, 600–614, DOI:10.1016/j.chembiol.2019.01.009.
- A. Salvati, A. S. Pitek, M. P. Monopoli, K. Prapainop, F. Baldelli Bombelli, D. H. Hristov, P. M. Kelly, C. Åberg, E. Mahon and K. A. Dawson, Transferrin-functionalized nanoparticles lose their targeting capabilities when a biomolecule corona adsorbs on the surface, Nat. Nanotechnol., 2013, 8, 137–143, DOI:10.1038/nnano.2012.237.
- S. Avvakumova, L. Pandolfi, E. Soprano, L. Moretto, M. Bellini, E. Galbiati, M. A. Rizzuto, M. Colombo, R. Allevi, F. Corsi, A. Sánchez Iglesiasf and D. Prosperi, Does conjugation strategy matter? Cetuximab-conjugated gold nanocages for targeting triple-negative breast cancer cells, Nanoscale, 2019, 1, 3626–3638, 10.1039/C9NA00241C.
- H. Mohammad-Beigi, Y. Hayashi, C. Moeslund Zeuthen, H. Eskandari, C. Scavenius, K. Juul-Madsen, T. Vorup-Jensen, J. J. Enghild and D. S. Sutherland, Mapping and identification of soft corona proteins at nanoparticles and their impact on cellular association, Nat. Commun., 2020, 11, 4535, DOI:10.1038/s41467-020-18237-7.
- A. Nandakumar, W. Wei, G. Siddiqui, H. Tang, Y. Li, A. Kakinen, X. Wan, K. Koppel, S. Lin, T. P. Davis, D. T. Leong, D. J. Creek, F. Ding, Y. Song and P. C. Ke, Dynamic Protein Corona of Gold Nanoparticles with an Evolving Morphology, ACS Appl. Mater. Interfaces, 2021, 13, 58238–58251, DOI:10.1021/acsami.1c19824.
- D. Di Silvio, A. Silvestri, L. Lay, L. Polito and S. E. Moya, Impact of ConcanavalinA affinity in the intracellular fate of Protein Corona on Glucosamine Au nanoparticles, Sci. Rep., 2018, 8, 9046, DOI:10.1038/s41598-018-27418-w.
- M. Wolf, R. W. Poupardin, P. Ebner-Peking, A. Cronemberger Andrade, C. Blöchl, A. Obermayer, F. G. Gomes, B. Vari, N. e Maeding, E. Eminger, H.-M. Binder, A. M. Raninger, S. Hochmann, G. Brachtl, A. Spittler, T. Heuser, R. Ofir, C. G. Huber, Z. Aberman, K. Schallmoser, H.-D. Volk and D. Strunk, A functional corona around extracellular vesicles enhances angiogenesis, skin regeneration and immunomodulation, J. Extracell. Vesicles, 2022, 11, e12207, DOI:10.1002/jev2.12207.
|
| This journal is © The Royal Society of Chemistry 2023 |
Click here to see how this site uses Cookies. View our privacy policy here. 
 Open Access Article
 This Open Access Article is licensed under a Creative Commons Attribution-Non Commercial 3.0 Unported Licence
 ab,
Miriam
Romano
ab,
Andrea
Zendrini
ab,
Silvia
Alacqua
ab,
Selene
Tassoni
a,
Lucia
Paolini
bc,
Chiara
Urbinati
a,
Marco
Rusnati
a,
Paolo
Bergese
ab,
Miriam
Romano
ab,
Andrea
Zendrini
ab,
Silvia
Alacqua
ab,
Selene
Tassoni
a,
Lucia
Paolini
bc,
Chiara
Urbinati
a,
Marco
Rusnati
a,
Paolo
Bergese