
 Open Access Article
 This Open Access Article is licensed under a Creative Commons Attribution-Non Commercial 3.0 Unported Licence
Exosomes trapping, manipulation and size-based separation using opto-thermo-electrohydrodynamic tweezers†
Chuchuan
Hong
 ab,
Sen
Yang
ab and
Justus C.
Ndukaife
*abc
ab,
Sen
Yang
ab and
Justus C.
Ndukaife
*abc
aElectrical and Computer Engineering Department, Vanderbilt University, Nashville, TN 37212, USA. E-mail: justus.ndukaife@vanderbilt.edu
bVanderbilt Institute of Nanoscale Science and Engineering, Vanderbilt University, Nashville, TN 37212, USA
cInterdisciplinary Material Science, Vanderbilt University, Nashville, TN 37212, USA
First published on 4th May 2023
Abstract
Owing to the heterogeneity of exosomes in size and biomolecular composition, there is a need for new approaches for trapping, manipulating, and sorting of single exosomes in solution. Due to their small size ranging from 30 nm to 150 nm and their relatively low refractive index, their stable trapping using optical tweezers has been met with challenges. Trapping exosomes in an optical trap requires nearly 100 mW of input power, which predisposes them to photo-induced damage and membrane rupture at the laser focus. Here, we report a high stability opto-thermo-electrohydrodynamic tweezer for the stable stand-off trapping of single exosomes based on a concentric nanohole array (CNA) using laser illumination and an a.c. field. The CNA system generates two regions of electrohydrodynamic potentials several microns away from the laser focus where single exosomes are trapped. We demonstrate the rapid trapping within seconds, and selective dynamic manipulation of exosomes based on size using only 4.2 mW of input laser power. The proposed platform opens up a promising approach for stabilizing single exosomes in solution and controlling their distribution based on size without the risk of photo-induced damage.
Introduction
The stable trapping of single biological particles against Brownian motion within an observation volume is crucial to understand their biophysical and biochemical properties on an individual particle level.1–7 Exosomes are membrane-delimited nanoscale extracellular vesicles (EVs) secreted by cells that contain important biological information molecules including proteins, lipids and nucleic acids, and thus serve as potential biomarkers for noninvasive cancer detection.8–10 They are released when multivesicular body fuses with the cell plasma membrane.11,12 The ability to analyse exosomes in low concentration media using small sample volumes is important for early-stage disease detection and prognosis.13–15 Also, due to the heterogeneity of exosomes both in size and biomolecular compositions,16–18 the ability to achieve single exosome trapping and analysis is crucial to understanding their properties on an individual particle level. However, exosomes are very small biological particles measuring only 30 nm to 150 nm in diameter,10 which results in strong Brownian motion that makes their stable trapping in solution challenging. While conventional optical tweezers can trap and manipulate single bio-particle of micron-size, such as bacteria or cells,19,20 they are unable to address nanoscale biological particles like exosomes with low optical powers due to the diffraction limit. Studies have shown that to trap single nanosized exosomes in solution with optical tweezers requires nearly 100 mW of incident power,21–24 which poses the risk of irreversible photothermal damage, such as membrane rupture, photo-toxicity or thermal stress,25,26 to delicate bio-particles. Plasmonic nano-tweezers, alternatively, are invented to handle nanometric particles27–31 due to the tighter light confinement resulting from plasmonic resonance. One vital issue with conventional plasmonic nano-tweezers is that plasmonic resonators are always fabricated on a substrate, which prohibits dynamic manipulation of particles with the same flexibility as optical tweezers. Active colloidal tweezers have been proposed to solve this problem based on a ‘tweezer in a tweezer’ configuration.32,33 However, they require complicated fabrication techniques and do not offer the same level of flexibility in the design of the plasmonic elements in comparison with lithographic fabrication. Moreover, in plasmonic nano-tweezers, the transport of particles towards the electromagnetic hotspot relies on slow and nondeterministic diffusion, making the conventional plasmonic nano-tweezers unsuitable to a low particle concentration environment. To overcome the time-consuming particle-loading challenge, electrothermoplasmonic tweezers have been demonstrated to achieve fast particle transport by taking advantage of photo-induced heating.26,34,35 However, the temperature rise at the trapping site must be managed.In an earlier work, we established a safe and rapid platform for trapping single nanoscale objects in low-concentration media called opto-thermo-electrohydrodynamics-tweezer (OTET).26 In the OTET platform, a nanoparticle is trapped outside a square nanohole array and is dynamically manipulated by moving laser spot on the nanohole array. In this work, we have advanced the OTET platform by tailoring the topology of nanohole array into a concentric nanohole array (CNA) pattern to create two trapping sites, namely site I and site II as shown in Fig. 1(a). In this way, we increase the trapping stability in site II, while keeping the properties of stand-off trapping, fast particle transport, and dynamic manipulation. Interestingly, we experimentally demonstrate the trapping of exosomes at different locations based on their sizes. Therefore, our new platform provides the opportunity for spatially-resolved single-exosome trapping and on-chip analysis at low-concentration levels in real time.
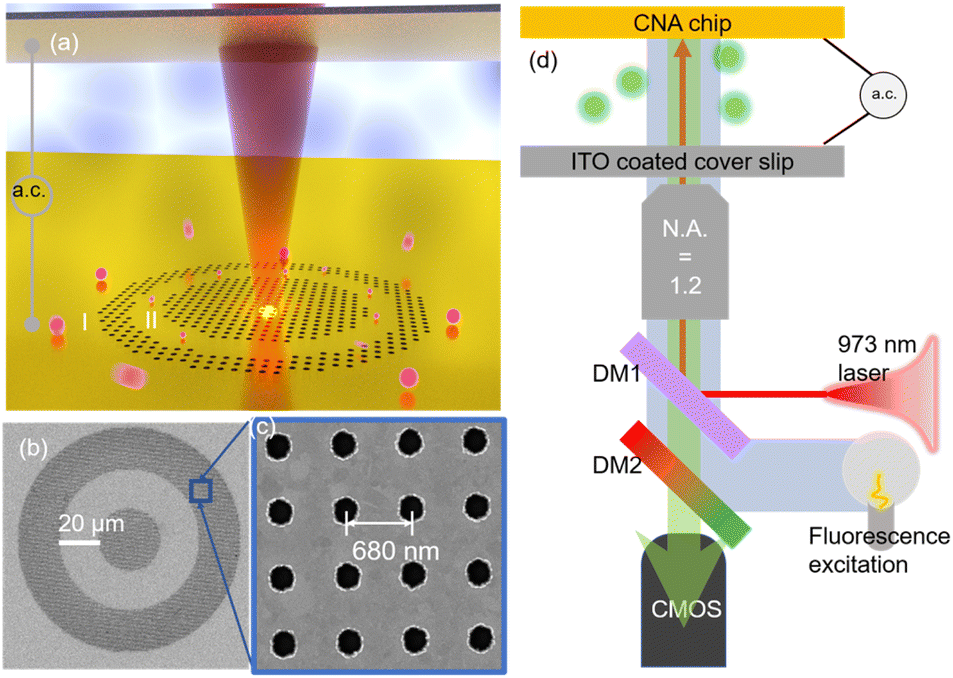 | ||
| Fig. 1 (a) Schematic illustration of concentric nanohole array (CAN) system. Laser is illuminated at the center of the CNA. a.c electric field is applied perpendicular to the gold film. Exosomes (shown in purple) are rapidly transported and trapped. Letters I and II indicate two sites available for trapping. (b) Scanning electron microscopy (SEM) image of template-stripped patterned gold film. (c) The zoomed-in image of part of the template-stripped nanohole array. (d) The experimental light path for trapping and imaging the fluorescently labeled exosomes. DM1 and DM2 are dichroic mirrors. DM1 reflects the 973 nm trapping laser towards the sample but blocks it from entering the camera. DM2 reflects the excitation of fluorescence towards the sample but only allows the emitted light to pass through and be collected by the CMOS camera. | ||
Experimental
The CNA platform is composed of a 120 nm gold film on a float-glass substrate, where the gold film is patterned with a concentric nanohole array (CNA), as shown in Fig. 1(a) and (b). The inner circle has a diameter of 30 μm, the gap size is 20 μm, and the ring width is set to 20 μm. The nanohole array is optimized to have a 680 nm lattice constant and 130 nm in nanohole radius, as depicted in Fig. 1(c). Large or small-size exosomes can be trapped in site I together, while small-size exosomes can be transferred into site II under certain a.c. frequencies. As depicted in Fig. 1(d), both 973 nm laser and a.c. electric field need to be switched on so that we are able to observe the trapping of fluorescently labeled exosomes. We attribute this trapping to the balance between two opposing microfluidic flows, i.e. a.c. electro-osmotic (ACEO) flow and electrothermoplasmonic (ETP) flow.26 As shown in Fig. 1(d), an a.c. electric field is applied perpendicular to the gold film using the patterned film as one of the electrodes. The nanohole pattern distorts the applied a.c. electric field, creating tangential components near the surface of the gold film. The tangential components of electric field then exert coulombic forces on the ions and charges in the electric double layer near the gold film. The moving ions and charges form a directional fluidic motion near the surface, which is called a.c. electro-osmotic flow. This osmotic flow is moving in a direction away from the nanohole array and repels particles out of the nanohole array region.Furthermore, an ETP flow is generated by the laser-induced heating of the nanohole array and the applied a.c. electric field. Laser illumination efficiently produces local temperature rise due to the plasmonic resonance of the nanohole array.36Fig. 2(a) shows the electric field profile at the top surface of one unit-cell of the nanohole array. It clearly shows the light field is concentrated near the fringe region of the nanohole, as well as the region in-between the nanoholes due to electromagnetic coupling. This in turn improves the photothermal conversion efficiency of the nanohole array under the 973 nm laser illumination. We also plot the simulated reflection and absorption spectrum in Fig. 2(b) to show an enhanced absorption at 973 nm. The simulated temperature profile on top of the gold film is provided in Fig. 2(c). It shows a peak local temperature rise of 24 K under a laser illumination intensity of 3 × 10⁹ W m−2. We note that the temperature rises at the trapping sites I and II is negligible. Due to this thermal gradient, a body force is generated in the fluid element under the application of an a.c. electric field.37 This body force drives a vortex-like fluidic motion called electrothermoplasmonic flow inside the microfluidic channel.34,38 Near the gold film, the ETP flow moves towards the hot region, where the laser is illuminated. The two opposing flows, namely ETP and ACEO flows establish the stagnation zones where the in-plane velocity goes to zero, defining where the exosomes are trapped.
 | ||
| Fig. 2 (a) Simulated electric field profile on top of one unit-cell of the nanohole array using Finite-Difference Time-Domain (FDTD) method. (b) The simulated transmission, reflection and absorption spectrum of the optimized nanohole array. (c) The simulated temperature rises when illuminating a 973 nm laser at the center of CNA. Laser spot is 1.33 μm. (d) The total in-plane velocity map of CNA system. It clearly shows two possible trapping sites where the in-plane velocity arrows are pointing oppositely, labeled as I and II. The orange arrow and red arrow indicate the trajectory where we plot out the in-plane velocity as shown in (e) and (f). (e) and (f) Simulated in-plane velocity in trapping site II and trapping site I, corresponding to the orange and red arrows in (d), respectively. Positive velocity is defined as velocity direction pointing away from the center. Inset in (f) plots a zoomed-in version of the blue box, to show the position of the stagnation zone. | ||
Fig. 2(d)–(f) illustrates the simulated in-plane microfluidic flow field distribution near the gold film surface. In Fig. 2(d), the arrows represent the total local in-plane flow (ACEO + ETP) direction. The details of the governing equations for the numerical simulations can be found in our previously published article.26 As highlighted in the red box (labeled site I), the opposing inward ETP and outward ACEO flows meet and create the stagnation zone outside the CNA pattern. The highlighted yellow box (labeled site II) indicates the existence of another available trapping position besides site I. Since site II is sandwiched by two nanohole arrays, particles at site II experience the ACEO flows coming from both the inner and outer nanohole array as well as the inward ETP flow. Fig. 2(e) and (f) show the 2D simulated in-plane total flow velocities versus radial distance for both trapping sites II and I, respectively, with the radially outward direction defined as positive. The radial positions where the velocities go to zero in Fig. 2(e) and (f) depict the stagnation zones, which correspond to the trapping positions. The confinement along the out-of-plane direction is because of the particle–surface interaction, which describes the attractive force between the surface charge on a particle close to the surface and its image charge inside the conducting film.39
For the experimental demonstrations, we adapted a combination of electron beam lithography and the template stripping method40,41 to fabricate the patterned gold film. The detailed fabrication process is provided in the ESI† section. The fabricated gold film was then covered by an Indium–Tin–Oxide (ITO) coated glass cover slip but separated by a dielectric spacer (120 μm) to create a microfluidic channel. Subsequently, diluted exosome solution was injected into the microfluidic channel using a syringe. A 973 nm wavelength laser is focused onto the center of the CNA using a water-immersion objective lens (60×) with a numerical aperture of 1.2. Alternating current (a.c.) electric voltage is applied across the microfluidic channel to give a field strength of 83![[thin space (1/6-em)]](https://www.rsc.org/images/entities/char_2009.gif) 333 V m−1.
333 V m−1.
The experimental demonstration of trapping single exosomes is conducted using diluted commercial FITC-conjugated exosomes solution (Creative Diagnostics). The final concentration of exosomes is diluted to 1.8 × 10⁵ particles per mL. Fig. 3(a) shows a frame-by-frame sequence of the rapid transport, trapping, sorting and spatially-resolved size-based separation of exosomes. Starting from a vacant system with a laser spot focused at the center and the a.c. electric field being off, no exosome is observed to be trapped. Immediately after the a.c. field is turned on at a frequency of 1.5 kHz, exosomes are rapidly transported by ETP flow to site I and trapped within 2 seconds. Due to the low a.c. frequency field of 1.5 kHz, the radially outward ACEO flow in the CNA is strong enough to preclude exosomes from entering site II. Thus, at this frequency, all the exosomes are trapped at the external periphery of the CNA system (namely site I). Subsequently, the a.c. frequency is tuned up to 3.5 kHz and the smaller exosomes (circled in blue) are observed to hop into the gap, i.e. site II. The a.c. frequency is kept at 3.5 kHz for 3 seconds to ensure all the small exosomes transit the barrier, hopping from site I to site II. By so doing, the CNA system enables the spatially-resolved sorting of bioparticles, ensuring that smaller and larger exosomes are separated and trapped at different locations. We also note that in general the trapping stability of site II is higher than in site I as depicted in Fig. 3(e). Finally, the a.c. frequency is reduced to 2 kHz and the particles remain trapped at the respective positions. The release of the trapped exosomes can be achieved by increasing the frequency to 10 kHz or more.26 To confirm the size of the trapped exosomes, we applied a low frequency a.c. field of 10 Hz a.c to immobilize all trapped exosomes onto the substrate.34 Subsequently, the sample is imaged under a scanning electron microscopy (SEM) system. The SEM image is provided in Fig. 3(b) and (c). We thus verified that the exosome in site II has a diameter of around 60 nm, while a larger exosome with a diameter of about 120 nm was trapped in site I.
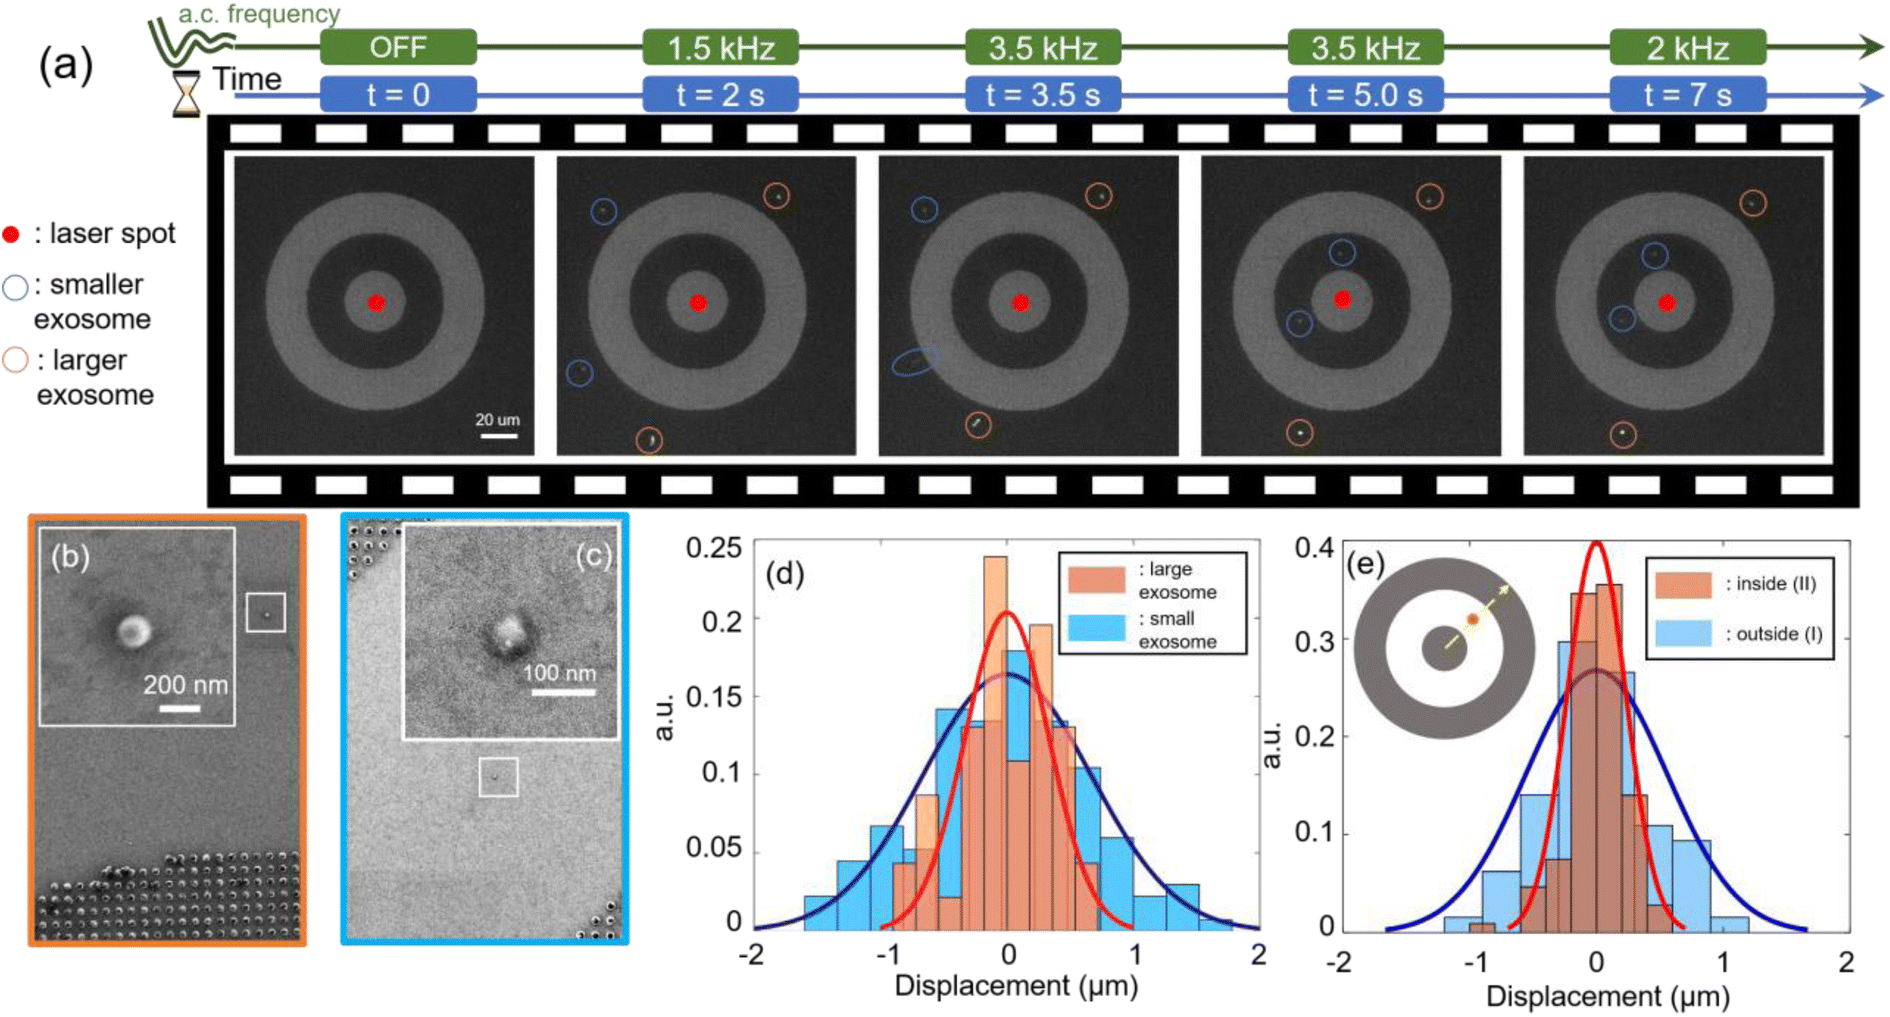 | ||
| Fig. 3 (a) The frame-by-frame illustration of rapidly transporting and trapping individual exosomes. Then by tuning a.c. frequency, we achieved size-based exosomes sorting and trapping at different locations. (b) and (c) are the SEM images of exosomes trapped in site II and I, respectively, after we pattern the exosomes onto gold film using ultra-low frequency a.c. field. SEM images confirm the size-based separately trapping. (d) Histograms of radial position displacement of trapped small-size and larger-size exosomes under 3 kHz a.c. frequency. (e) Histograms of radial position displacement when the same small-size exosome is trapped outside the CNA or inside the gap, under the same 2 kHz a.c. frequency. The stability is enhanced at site II. The inset indicates the definition of radial direction in the analysis of (d) and (e), (yellow arrow). | ||
Methods
Sample preparation
After the CNA chip was fabricated, we sandwiched the gold film by covering it with an ITO-coated glass cover-slip, spaced by a 120 μm-thick dielectric spacer to create a microfluidic channel. Two copper wires are connected to the ITO side on the cover-slip and the gold film, respectively, to apply the a.c. electric field.The FITC-conjugated fluorescently-labeled exosomes were purchased from Creative Diagnostics as lyophilized particles. 100 μl DI water was added to 100 μg of solid and mixed well to obtain a concentration of 1 mg per mL exosome solution. The concentration is ∼1010 exosomes per mL as suggested by the instruction. The acquired exosome solution was then diluted to 1.8 × 10⁵ exosomes per mL by adding more DI water.
Fluorescence imaging
The trapping experiment and fluorescence imaging were conducted on Nikon Ti2-E inverted microscopic system. The detailed light path is presented in Fig. 1(d) in the main text. A high quantum efficiency sCMOS camera (Photometrics PRIME 95B) was used to acquire images at 5 frames per second. The labeled exosomes were excited under blue light filtered out from a broadband fluorescent illumination lamp (Nikon INTENSILIGHT C-HGFI). The emitted light was collected through the same objective lens and imaged on the camera. The nanohole array was illuminated with a 973 nm semiconductor diode laser (Thorlabs CLD1015). The laser beam was focused with a Nikon ×60 water-immersion objective lens (NA, 1.2). The a.c. electric field was supplied by a dual-channel function generator (BK Precision 4047B).Results and discussion
To interpret the mechanism of this size-based sorting, as well as emphasize the high trapping stability in site II, we consider the relationship between trapping stability with respect to the applied a.c. frequency. For a low a.c. frequency of 1.5 kHz, the ACEO is strong enough to balance the ETP flow outside the nanohole array. Furthermore, the particle–surface interaction force (Fz) is stronger at lower a.c. frequencies, and as a result, both large and small exosomes are transported by the ETP flow and trapped at site I. As the a.c. frequency is increased to 3.5 kHz, both the ACEO flow strength and particle–surface interaction force is reduced, while the ETP flow strength is relatively unchanged. This lowers the trapping stability in site I. As evident in Fig. 3(d), it is shown that the smaller exosomes experience a lower trapping stability than the larger exosomes under a 3 kHz frequency since they experience a larger Brownian motion. As the a.c. frequency increases to 3.5 kHz, the trapping stability is sufficiently reduced such that the smaller exosomes at site I are released and transported inward to site II where they become trapped. The smaller exosomes are stably trapped at site II because site II has a larger trapping potential well depth than site I. The experimental data shown in Fig. 3(e) depicts tighter trapping stability for the same exosome trapped in site II versus when the exosome was trapped in site I. We also note that the enhanced trapping stability in site II can be tuned by controlling the width of the gap region defined by site II. We have varied the width of the gap region of site II using widths of (6, 10 and 20 μm) and show a narrower gap width provides stronger trapping stability on the trapped exosomes as detailed in Fig. S4 of the ESI section.†After the single small exosome is loaded into site II, we demonstrate dynamic manipulation by moving the laser spot. As shown in Fig. 4, we begin with the laser spot close to the center of CNA and the exosome is in the northeast of the gap. Then, the laser spot moves a round trip across the inner circular pattern along ‘center → south → northwest → northeast → southeast’ direction. The white dashed curve depicts the trajectory of the laser motion. The corresponding video is provided in ESI video 3.† In the video, it took about 70 seconds to finish the whole manipulation process and the small exosome faithfully followed the motion of laser to complete the round trip, while the large exosome stayed to the northeast (circled in orange) of the CNA during the whole process. The dynamic manipulation is primarily enabled by the ETP flow. In site II, the distance to laser spot is shorter and the local ETP velocity will be higher. This ensures that the trapped exosomes in site II is within the radius of influence of the ETP flow to be dynamically manipulated by the ETP flow. Hence, the CNA system provides the means to achieve the selective manipulation of single exosomes.
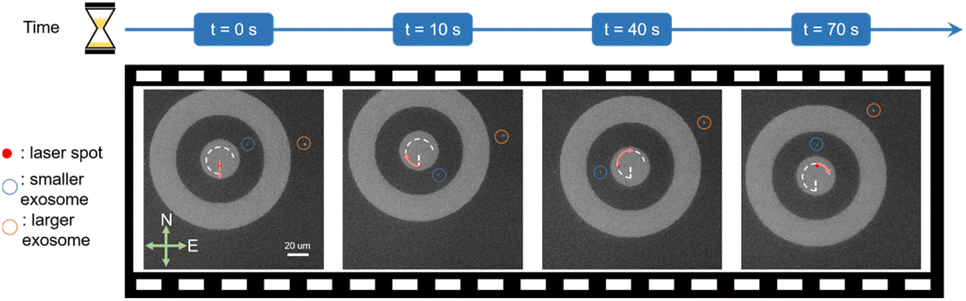 | ||
| Fig. 4 The frame-by-frame sequence of selective dynamic manipulation on the trapped small size exosome in site II using the move of laser, while the large exosome trapped outside the CNA to the northeast direction of CNA. The whole process of finishing a round trip took 70 seconds. White dash line indicates the full itinerary of laser movement and red arrow shows the laser moving direction during the corresponding frame. | ||
Conclusion
We have demonstrated a concentric nanohole array system for opto-thermo-electrohydrodynamic trapping, dynamic manipulation, and sorting of single nanoscale exosomes with high stability within seconds using low particle concentrations. The CNA system features selective trapping and selective dynamic manipulation of single exosomes based on size. Our proposed platform may be combined with other single molecule analysis techniques such as Forester Resonance Energy Transfer (FRET) by enabling to stabilize single exosomes in solution within a microscope observation volume without tethering to surfaces. Other analysis methods, such as surface enhanced Raman spectroscopy (SERS), may also be supported with the CNA platform. By integrating plasmonic cavities at the electrohydrodynamic trapping positions,7 CNA offers the opportunity for studying the chemical composition of nanoparticles, and sorting particles with desired composition for further analysis. The ability to trap and manipulate individual bioparticles selectively opens the door to single vesicle analysis to understand the heterogeneity of extracellular vesicles on the single-particle level.Author contributions
C. H. performed the fabrication and conducted the experiments. S. Y. and C. H. performed the numerical simulations. J. C. N. and C. H. discussed on the results and prepared the manuscript. J. C. N. conceived and supervised this project.Conflicts of interest
There are no conflicts to declare.Acknowledgements
The authors acknowledge support from NSF CAREER Award (NSF ECCS 2143836).Notes and references
- Y. Li, X. Liu and B. Li, Light Sci. Appl., 2019, 8, 61 CrossRef PubMed.
- J.-A. Huang, M. Z. Mousavi, Y. Zhao, A. Hubarevich, F. Omeis, G. Giovannini, M. Schütte, D. Garoli and F. De Angelis, Nat. Commun., 2019, 10, 5321 CrossRef PubMed.
- M. Kumemura, D. Collard, C. Yamahata, N. Sakaki, G. Hashiguchi and H. Fujita, ChemPhysChem, 2007, 8, 1875–1880 CrossRef CAS PubMed.
- A. Ndao, L. Hsu, W. Cai, J. Ha, J. Park, R. Contractor, Y. Lo and B. Kanté, Nanophotonics, 2020, 9, 1081–1086 CrossRef CAS.
- B. Lin, Y. Lei, J. Wang, L. Zhu, Y. Wu, H. Zhang, L. Wu, P. Zhang and C. Yang, Small Methods, 2021, 5, 2001131 CrossRef CAS PubMed.
- M. Tayebi, Y. Zhou, P. Tripathi, R. Chandramohanadas and Y. Ai, Anal. Chem., 2020, 92, 10733–10742 CrossRef CAS PubMed.
- C. Hong and J. C. Ndukaife, ArXiv, 2023, DOI:10.48550/arXiv.2302.07370, Preprint.
- G. Raposo and W. Stoorvogel, J. Cell Biol., 2013, 200, 373–383 CrossRef CAS PubMed.
- J. De Toro, L. Herschlik, C. Waldner and C. Mongini, Front. Immunol., 2015, 6, 203 Search PubMed.
- A. Zijlstra and D. di Vizio, Nat. Cell Biol., 2018, 20, 228–230 CrossRef CAS PubMed.
- H. Peinado, M. Alečković, S. Lavotshkin, I. Matei, B. Costa-Silva, G. Moreno-Bueno, M. Hergueta-Redondo, C. Williams, G. García-Santos, C. M. Ghajar, A. Nitadori-Hoshino, C. Hoffman, K. Badal, B. A. Garcia, M. K. Callahan, J. Yuan, V. R. Martins, J. Skog, R. N. Kaplan, M. S. Brady, J. D. Wolchok, P. B. Chapman, Y. Kang, J. Bromberg and D. Lyden, Nat. Med., 2012, 18, 883–891 CrossRef CAS PubMed.
- J. Lötvall, A. F. Hill, F. Hochberg, E. I. Buzás, D. di Vizio, C. Gardiner, Y. S. Gho, I. v. Kurochkin, S. Mathivanan, P. Quesenberry, S. Sahoo, H. Tahara, M. H. Wauben, K. W. Witwer and C. Théry, J. Extracell. Vesicles, 2014, 3, 26913 CrossRef PubMed.
- C. Liu, X. Xu, B. Li, B. Situ, W. Pan, Y. Hu, T. An, S. Yao and L. Zheng, Nano Lett., 2018, 18, 4226–4232 CrossRef CAS PubMed.
- H. Li, T. Huang, L. Lu, H. Yuan, L. Zhang, H. Wang and B. Yu, ACS Sens., 2022, 7, 1926–1935 CrossRef CAS PubMed.
- N. Ullah Khan, Z. Muhammad, X. Liu, J. Lin, Q. Zheng, H. Zhang, S. Malik, H. He and L. Shen, Nano Lett., 2021, 21, 5532–5539 CrossRef CAS PubMed.
- C. Y. Chiang and C. Chen, J. Biomed. Sci., 2019, 26, 1–10 CrossRef PubMed.
- S. H. Hilton and I. M. White, Sensor. Actuator. Rep., 2021, 3, 100052 CrossRef PubMed.
- E. Willms, C. Cabañas, I. Mäger, M. J. A. Wood and P. Vader, Front. Immunol., 2018, 9, 1 CrossRef PubMed.
- A. Ashkin, J. M. Dziedzic, J. E. Bjorkholm and S. Chu, Opt. Lett., 1986, 11(5), 288–290 CrossRef CAS PubMed.
- A. Ashkin and J. M. Dziedzic, Science, 1987, 235, 1517–1520 CrossRef CAS PubMed.
- Z. J. Smith, C. Lee, T. Rojalin, R. P. Carney, S. Hazari, A. Knudson, K. Lam, H. Saari, E. Lazaro Ibañ ez, T. Viitala, T. Laaksonen, M. Yliperttula and S. Wachsmann-Hogiu, Citation, 2015, 4, 28533 Search PubMed.
- W. Lee, A. Nanou, L. Rikkert, F. A. W. Coumans, C. Otto, L. W. M. M. Terstappen and H. L. Offerhaus, Anal. Chem., 2018, 90, 48 Search PubMed.
- S. G. Kruglik, F. Royo, J.-M. Guigner, L. Palomo, O. Seksek, P.-Y. Turpin, I. Tatischeff and J. M. Falcón-Pérez, Nanoscale, 2019, 11, 1661–1679 RSC.
- J. Penders, A. Nagelkerke, E. M. Cunnane, S. V. Pedersen, I. J. Pence, R. C. Coombes and M. M. Stevens, ACS Nano, 2021, 15, 18192–18205 CrossRef CAS PubMed.
- A. Blázquez-Castro, Micromachines, 2019, 10(8), 507 CrossRef PubMed.
- C. Hong, S. Yang and J. C. Ndukaife, Nat. Nanotechnol., 2020, 15, 908–913 CrossRef CAS PubMed.
- K. B. Crozier, Light Sci. Appl., 2019, 8, 35 CrossRef PubMed.
- C. Bustamante, L. Alexander, K. Maciuba and C. M. Kaiser, Annu. Rev. Biochem., 2020, 89, 443–470 CrossRef CAS PubMed.
- Y. Zhang, C. Min, X. Dou, X. Wang, H. P. Urbach, M. G. Somekh and X. Yuan, Light Sci. Appl., 2021, 10, 59 CrossRef CAS PubMed.
- C. J. Bustamante, Y. R. Chemla, S. Liu and M. D. Wang, Nat. Rev. Dis. Primers, 2021, 1, 1–29 CrossRef.
- D. G. Kotsifaki, V. G. Truong and S. Nic Chormaic, Appl. Phys. Lett., 2021, 118(2) DOI:10.1063/5.0032846.
- S. Ghosh and A. Ghosh, Sci. Robot., 2018, 3, eaaq0076 CrossRef PubMed.
- S. Ghosh and A. Ghosh, Nat. Commun., 2019, 10, 4191 CrossRef PubMed.
- J. C. Ndukaife, A. V. Kildishev, A. G. A. Nnanna, V. M. Shalaev, S. T. Wereley and A. Boltasseva, Nat. Nanotechnol., 2016, 11, 53–59 CrossRef CAS PubMed.
- J. S. Donner, G. Baffou, D. McCloskey and R. Quidant, ACS Nano, 2011, 5, 5457–5462 CrossRef CAS PubMed.
- T. W. Ebbesen, H. J. Lezec, H. F. Ghaemi, T. Thio and P. A. Wolff, Nature, 1998, 391, 667–669 CrossRef CAS.
- A. Ramos, H. Morgan, N. G. Green and A. Castellanos, J. Phys. D Appl. Phys., 1998, 31, 2338–2353 CrossRef CAS.
- C. Hong, S. Yang, I. I. Kravchenko and J. C. Ndukaife, Nano Lett., 2021, 21, 4921–4927 CrossRef CAS PubMed.
- M. M. Hatlo and L. Lue, Soft Matter, 2008, 4, 1582 RSC.
- D. Yoo, T. W. Johnson, S. Cherukulappurath, D. J. Norris and S. H. Oh, ACS Nano, 2015, 9, 10647–10654 CrossRef CAS PubMed.
- H. Im, S. H. Lee, N. J. Wittenberg, T. W. Johnson, N. C. Lindquist, P. Nagpal, D. J. Norris and S.-H. Oh, ACS Nano, 2011, 5, 6244–6253 CrossRef CAS PubMed.
Footnote |
| † Electronic supplementary information (ESI) available. See DOI: https://doi.org/10.1039/d3na00101f |
| This journal is © The Royal Society of Chemistry 2023 |