
 Open Access Article
 This Open Access Article is licensed under a Creative Commons Attribution-Non Commercial 3.0 Unported Licence
Phototransformations of TiO2/Ag2O composites and their influence on photocatalytic water splitting accompanied by methanol photoreforming†
Anna
Jakimińska
 ,
Kaja
Spilarewicz
and
Wojciech
Macyk
*
,
Kaja
Spilarewicz
and
Wojciech
Macyk
*
Faculty of Chemistry, Jagiellonian University, ul. Gronostajowa 2, Kraków, 30-387, Poland. E-mail: macyk@chemia.uj.edu.pl
First published on 20th January 2023
Abstract
This work aimed to revise the mechanism of photocatalytic activity of the TiO2/Ag2O system in photocatalytic water splitting accompanied by methanol photoreforming. The transformation of Ag2O into silver nanoparticles (AgNPs) during photocatalytic water splitting/methanol photoreforming was monitored using XRD, XPS, SEM, UV-vis, and DRS techniques. The impact of AgNPs, grown on TiO2, on its optoelectronic properties was analysed through inter alia spectroelectrochemical measurements. The photoreduced material exhibited a significantly shifted position of the TiO2 conduction band edge. Surface photovoltage measurements revealed the lack of photoinduced exchange of electrons between TiO2 and Ag2O, indicating the absence of an efficient p–n junction. Furthermore, the impact of chemical and structural changes in the photocatalytic system on the production of CO and CO2 from methanol photoreforming was analysed. It was found that fully formed AgNPs exhibit improved efficiency in the production of H2, whereas the Ag2O phototransformation, resulting in the growth of AgNPs, promotes simultaneously ongoing photoreforming of methanol.
Introduction
Nowadays, commercial hydrogen production is mostly limited to steam methane reforming of natural gas and electrolysis of water by well-established technologies, i.e., alkaline, polymer electrolyte membrane, and solid oxide technologies.1 Novel perspectives for industrial hydrogen production are focused on three main technologies: electrochemical water splitting, biological processes using biomass and processing of fossil resources.2 Global trends toward sustainability set the direction to use renewable energy sources. In this case, photocatalytic water splitting and photoreforming of organics (e.g., polyols and sugars) appear as especially valuable pathways due to the possibility of solar energy utilization. These processes are based on the abilities of semiconductors to convert quantum solar energy conversion and involve redox reactions utilizing separated charges.The water splitting process produces H2 and O2 using highly energetic electrons (conduction band) and holes (valence band) originating from photoexcited semiconductors. Design of a photocatalytic system that is able to effectively perform this process is challenging due to the necessities of (i) achieving adequate energy of the semiconductors' band edges, (ii) inhibiting the e−/h+ pair recombination, and (iii) hindering back-reactions.3 A commonly selected strategy to overcome the last two problems is the addition of easily oxidizable sacrificial agents, which replace the water molecules in reaction with photogenerated holes. Methanol exhibits the highest propensity among other additives to donate electrons to scavenge the holes and prevents photo-generated charge recombination.4 The efficiency of H2 evolution exhibits a logarithmic growth with the increase in the amount of used alcohol.5 For processes where the amount of alcohol is significant, and the process is performed in anaerobic conditions, the term ‘photoreforming’ is advised.6,7 This is the consequence of the fact that H2 in these processes can also originate from the transformation of alcohol molecules during photocatalysis.8
Titanium dioxide is considered a potentially universal material that photocatalyzes a wide range of processes, including H2 production.9 However, this material is not free of limitations.10 For example, the energy required to excite this semiconductor is confined to UV light. Moreover, it is known that fast e−/h+ recombination is one of the main issues causing limited TiO2 activity inter alia towards H2 production in photocatalytic water splitting and photoreforming of organics.11,12 Therefore, a strong effort is being made to find effective strategies to overcome these problems. Meanwhile, Ag2O is considered a potential p-type semiconductor in a p–n heterojunction with TiO2 for harvesting solar light.13–18 It is believed that Ag2O can sensitize titania due to its narrow band gap of 1.1–1.3 eV, which determines visible light absorption.19 However, it is known that Ag2O suffers from low stability – it is photosensitive and prone to degradation.20 For example, corrosion of Ag2O particles during photocatalytic degradation of methyl orange was observed by Chen et al.21 Therefore, the efforts are directed towards the protection of Ag2O by inhibition of Ag+ reduction. Some authors claim that the presence of Ag clusters and nanoparticles prevents Ag2O from further photodecomposition since the metallic structures act as the electron sinks and collect the electrons that could otherwise reduce more Ag2O.20,22 Another suggested approach to increase Ag2O stability is the application of organic compounds for scavenging photogenerated holes more rapidly than lattice oxygen. At the same time, the photogenerated electrons should be transferred to other compounds (especially O2) via initially formed Ag clusters preventing further reduction of Ag+.23
It is also well known that the decoration of the photocatalyst's surface with noble metal nanoparticles enhances its activity. These nanoparticles show the ability to behave as electron traps, promote interfacial charge transfer and limit e−/h+ recombination. They are also applied to inhibit the back-reaction of hydrogen and oxygen formed in water splitting, which is usually the main reason for the low efficiency of this process.24,25 The probability of back-reactions at the catalyst's surface is enhanced, when both hydrogen and oxygen are produced at the active sites lying nearby. However, the use of noble metal nanoparticles as co-catalysts changes the adsorption properties and transfers the hydrogen evolution reaction from the semiconductor's surface to the surface of the nanoparticles.26 In this way, the production of H2 and O2 is spatially separated. These aspects lead to the application of noble metal nanoparticles as an eagerly selected approach for increasing the efficiency of H2 production, which is explored up-to-date. For example, Strapasson et al. demonstrated the significant enhancement of hydrogen evolution from photoreforming of methanol (from 1 μmol g−1 h−1 for bare TiO2 up to 7 μmol g−1 h−1) with the increase of silver nanoparticle loading (1–5%).27 Temerov et al. showed that TiO2 in an inverse opal structure exhibits no activity in H2 evolution in gas-phase water-splitting under visible light irradiation, but after modification with silver nanoparticles, it exhibits H2 production up to 0.86 ppm min−1.28 Moreover, Gogoi et al. reported outstanding results in H2 production from water splitting, achieving a rate of 23.5 μmol g−1 h−1 (with an apparent quantum yield of 19%), using TiO2 decorated with silver nanoparticles with 1.5% nominal concentration.29 Since the presence of metal nanoparticles reveals such a boost of activity and there is a possibility of Ag2O phototransformation into silver nanoparticles (AgNPs), it should be examined which of these components is responsible for the enhanced photocatalytic performance of the TiO2/Ag2O system.
A few studies discuss the phototransformation of Ag2O into AgNPs during photocatalytic processes. For example, Mandari et al. studied systems of TiO2/Ag2O in photocatalytic water-splitting/photoreforming (using glycerol in water) under simulated solar light irradiation, where Ag2O was synthesized in situ on TiO2 particles in different amounts.30 They proved the formation of AgNPs in the samples during photocatalytic tests and proposed multiple-step mechanisms of photocatalytic reactions. The initially fabricated p–n junction changes into a three-component system, where silver nanoparticles act as a bridge in the photoexcited electron transfer from Ag2O to TiO2 by forming a Schottky barrier between Ag and TiO2. A similar role of AgNPs in such systems was also reported by Liu et al.31 On the contrary, Xue et al. proposed a different mechanism for a similar system studied in toluene oxidation.14 First, photoexcited electrons are transferred from TiO2 to Ag2O creating silver nanoparticles on its surface, and then AgNPs serve as the sinks for photoexcited electrons from both Ag2O and TiO2, and reduction sites. Analysis of these studies shows that the mechanism of photocatalytic performance of TiO2/Ag2O remains unclear.
In the present work, TiO2 was combined with Ag2O to reveal the mechanism of photocatalytic water splitting accompanied by methanol photoreforming, taking place at TiO2/Ag2O under simulated solar light and visible light irradiation. The role of silver oxide phototransformations and the growth of silver nanoparticles in both processes was established. This paper revises the mechanism of TiO2/Ag2O photocatalytic activity.
Experimental
Reagents
AgNO3 (Merck, 99.8%), methanol (Sigma-Aldrich, for HPLC, >99.9%), anhydrous LiClO4 (Sigma-Aldrich), acetonitrile ACN (Avantor, HPLC/MS grade), tetrabutylammonium perchlorate (TBAP) (Sigma-Aldrich), NaOH (Chempur, pure for analysis, 99.8%) and titanium(IV) dioxide P25 Aeroxide (P-25) (ACROS Organics, ≥99.5%) were used without further purification. Water was deionized using a Hydrolab deionizer HLP 10UV (0.05 μS, t = 20 °C).Synthesis of Ag2O and TiO2/Ag2O
In a typical synthesis of the Ag2O material, 1 M solutions of AgNO3 and NaOH were mixed in equal volumes in a beaker under vigorous stirring. The solution was stirred for 3 hours and then the brown precipitate was collected by centrifugation and washed with DI water several times. The obtained material was left for drying at 60 °C overnight to remove any residual silver hydroxide. To obtain TiO2/Ag2O, the Ag2O material was mixed gently with P-25 in the w/w ratio of 1![[thin space (1/6-em)]](https://www.rsc.org/images/entities/char_2009.gif) :9.
:9.
Characterization
X-ray diffractograms (XRD) were recorded using a Rigaku MiniFlex 600 diffractometer equipped with a Cu lamp (Kα radiation wavelength – 1.5406 Å) with a Ni Kβ filter. The scan step was 2° (2θ), and the scan speed was 10° min−1.SEM analysis was performed at 30 kV using a Tescan Vega 3 microscope with a LaB6 gun equipped with SE and BSE detectors. The size of particles visible in SEM images was determined by measuring the maximum Feret diameter (linear dimension) of each particle in the images. The particle size distribution histogram was obtained from the measurements of 100 objects.
Diffuse reflectance spectra were collected using a Shimadzu UV-3600 UV-vis-NIR spectrophotometer equipped with a 15 cm diameter integrating sphere. BaSO4 was used as a reference and samples were ground with BaSO4 at a 1:10 w/w ratio. Obtained spectra were subsequently transformed using the Kubelka–Munk function and Tauc function to estimate absorption edges and band gap energies of examined materials.
UV-vis measurements were conducted using an HP8453 diode array spectrophotometer.
Surface photovoltage (SPV) measurements were performed on an Instytut Fotonowy environmental Kelvin probe equipped with a Xe lamp (Instytut Fotonowy, 150 W) and a monochromator. The contact potential difference (CPD in mV) was measured in the cycle: 50 times in the dark and the next 50 times under irradiation with a particular wavelength. The irradiation was established in the range of 500 to 240 nm with a 20 nm interval.
Spectroelectrochemical measurements (SE-DRS) were performed on a Shimadzu UV-3600 UV-vis-NIR DRS spectrophotometer equipped with a 15 cm integrating sphere. The electrochemical setup consisted of a three-electrode system. A Ag/Ag+ electrode (filled with 0.01 mol per dm3 AgNO3 and 0.1 mol per dm3 tetrabutylammonium perchlorate in acetonitrile) was used as the reference electrode, a Pt wire as the counter electrode and Pt foil covered with a layer of the examined material as the working electrode. Tests were performed in 0.1 mol per dm3 LiClO4 in acetonitrile as the electrolyte with argon purged through it during the measurements to remove the oxygen. The range of applied potential was from OCP to −2.7 V versus the reference electrode with a step of 0.05 V. The potential was applied using a BioLogic SP-150 potentiostat. For observation of changes in the spectrum of the material during reduction, the DRS spectrum of the working electrode covered with the material was taken after each potential was applied. The spectrum of the electrode before the potential application was used as the reference. Reflectance spectra obtained during measurements were transformed using the Kubelka–Munk function, and the difference in the value of this function for two subsequent potentials was used to estimate the density of electronic states in the material at the given wavelength. In this case, 780 nm was chosen due to the occurrence of maximum absorption of conduction band electrons in titania in this range. The photostability of the materials during the SE-DRS measurements was confirmed and has been described in the ESI (Fig. S1†).
Photocatalytic setup and TiO2/Ag2Ohν preparation
To perform photocatalytic tests, the tested materials were dispersed in 10 ml of water (obtaining 1 mg ml−1) with the addition of 100 μl of methanol. The suspension was then deoxygenated by purging Ar for 20 min. The used light source was a Xe lamp (Instytut Fotonowy, 150 W) with an air mass filter (AM 1.5G) or a cut-off filter of 420 nm. During the irradiation, the reaction mixture was continuously stirred using a magnetic stirrer. The amounts of hydrogen, carbon monoxide and carbon dioxide, which have been evolving to the gaseous phase, were measured by gas chromatography (GC) (Thermo Scientific, Trace 1300). To prepare TiO2/Ag2Ohν, the mixture was irradiated for 30 s or 2 h with the air mass filter (AM 1.5G) and then separated and washed several times with water for further use. If not denoted otherwise TiO2/Ag2Ohν means the composite after 2 h of irradiation.Results and discussion
Silver oxide was selected as the precursor for modification of the TiO2 (P25) surface with silver nanoparticles due to its simple chemical composition and low solubility in water (0.0225 g ml−1 at 25 °C).32 It may act as a silver source under photoreduction conditions. The simple precipitation method in the absence of organic compounds was applied to obtain bare Ag2O. Subsequently, it was mixed with TiO2 and studied in water-splitting/photoreforming.XRD
The precipitation method leads to Ag2O in the form of a dark-brown powder. The crystal structure of as-prepared Ag2O was confirmed using the XRD method (Fig. 1). The XRD pattern of Ag2O exhibits peaks characteristic of the cubic phase at 26.9°, 32.9°, 38.2°, 55.2°, 65.7°, and 69.2°, corresponding to (100), (111), (200), (220), (311), (222) crystal planes, respectively (JCPDS #41-1104). In addition, Fig. 1 and 2 show XRD patterns of P25, Ag2O and their mixture before and after irradiation. In the XRD pattern of TiO2/Ag2O before irradiation, only two characteristic peaks of Ag2O are present at 32.9° and 65.7° corresponding to the (111) and (311) planes, respectively. The other peaks of Ag2O are covered with TiO2 peaks.33,34 These two peaks vanish after 30 s irradiation of the H2O/MeOH suspension with simulated solar light. However, after 2 h of irradiation two new peaks emerge at 44.2° ad 64.4° which are attributed to the (200) and (220) planes of the Ag0 cubic phase, respectively (JCPDS #04-0783). Similar results were observed by Wang et al.23 During irradiation with visible light, they observed an increase in the intensity of the XRD peak around 44°, which was attributed to the (200) plane of metallic Ag. Moreover, analysis of the spectrum area between 37° and 39° provides additional information confirming the presence of metallic silver in the system after prolonged irradiation. In the as-prepared mixture of P25 with Ag2O, the peaks at 37.8° and 38.2° (Fig. 2) originating from the (004) plane of the anatase phase34 and the (200) plane of Ag2O,35 respectively, overlap. After 30 s of irradiation, the peak of Ag2O disappears, while after prolonged irradiation (2 h) near the peak of the anatase (37.8°) a new one at 38.1° appears, indicating the formation of metallic silver (plane (111)).36 | ||
| Fig. 1 X-ray diffractograms of the TiO2/Ag2O composite: as-prepared and modified under irradiation. Raw components (P25 and as-synthesized Ag2O) are shown for reference. | ||
 | ||
| Fig. 2 Selected areas of X-ray diffractograms exposing changes induced by irradiation (XBO lamp, AM 1.5G filter). | ||
XPS
The XPS measurements were used to further confirm the Ag oxidation states in the studied materials. Fig. 3 presents XPS deconvoluted spectra of the Ag 3d line (3d5/2 and 3d3/2 doublet) for TiO2/Ag2O, TiO2/Ag2Ohν30s and TiO2/Ag2Ohν2h, revealing the diminution in the AgI contribution with the irradiation prolongation. The binding energy of Ag 3d5/2 shifted from 368.6 to 368.3 eV; these energies can be assigned to AgI and Ag0, respectively.37 Therefore, it is clear that Ag2O turns to metallic silver, which is the evidence of its phototransformation. After 2 h of irradiation, the signal from AgI is negligible, as its intensity does not exceed the noise level. This also supports the fact that the secondary oxidation of Ag nanoparticles is inhibited due to the highly reductive reaction environment (H2 release in an inert atmosphere). | ||
| Fig. 3 XPS spectra (Ag 3d line) of TiO2/Ag2O, TiO2/Ag2Ohν30s and TiO2/Ag2Ohν2h composites. | ||
SEM
SEM analysis using SE imaging reveals changes in the morphology of the photocatalyst induced by irradiation. Bare Ag2O, presented in Fig. 4a, exhibits rounded particles (approximately 200–500 nm in size) gathered in large aggregates exceeding 1 μm in size. Fig. 4b shows Ag2O mixed with P25 and reveals two distinct phases. The agglomerates of P25 with an average size of 25 nm are noticeably separated from Ag2O aggregates. After 30 s of irradiation, only the characteristic structure of P25 is visible, whereas aggregates of Ag2O disappear (Fig. 4c). It corroborates with XRD analysis pointing at Ag2O transformation into metallic silver, which forms clusters observed as brighter spots. Therefore, silver clusters and methanol are found not to prevent Ag2O photoreduction. After prolonged irradiation, the structure of the photocatalyst became uniform (Fig. 4d). To prove the photocatalytic transformation of Ag2O into metallic silver, BSE imaging was applied. Fig. 5 presents the same area imaged using SE and BSE detectors. The emerging white objects in the image area are quasi-spherical nanoparticles in the size range of 20–200 nm and the average nanoparticle size is 30 ± 11 nm. As observed, silver nanoparticles are uniformly distributed in the whole volume of the photocatalyst.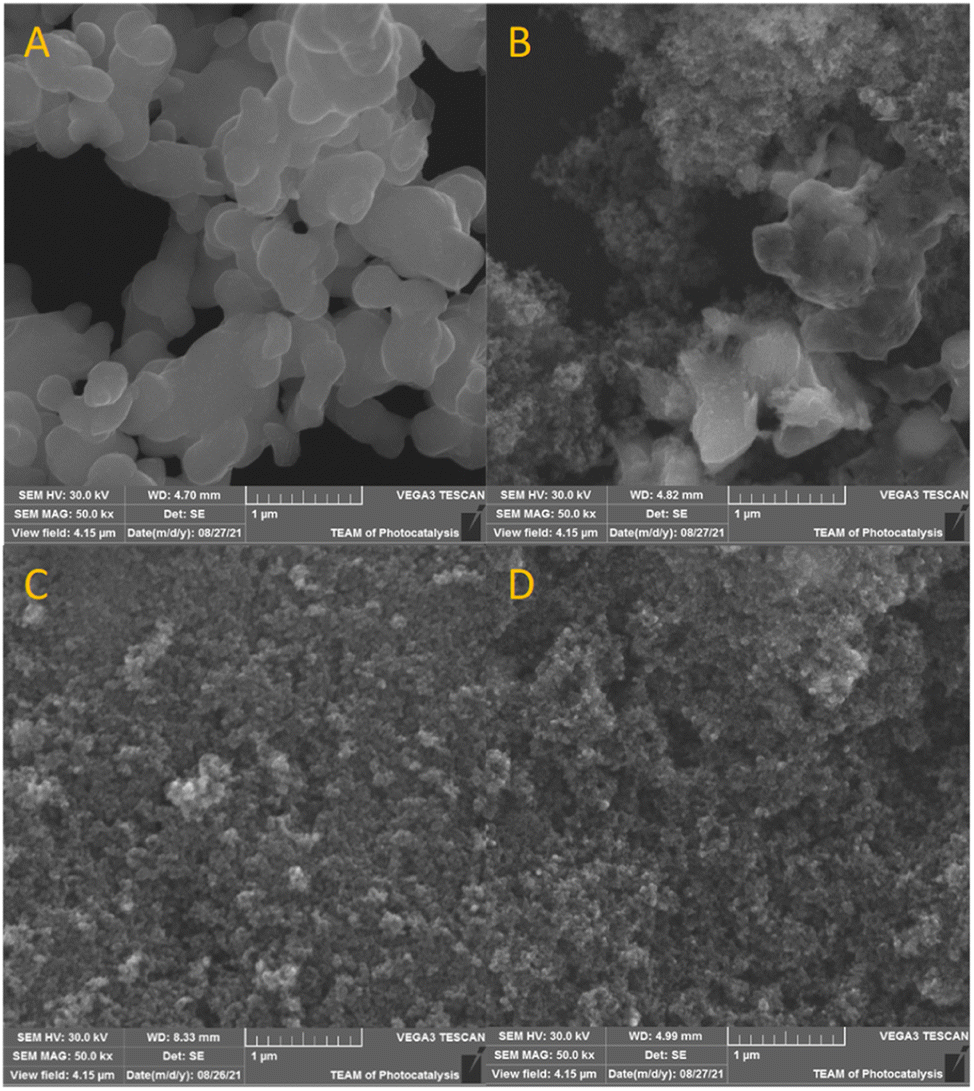 | ||
| Fig. 4 SEM images of bare Ag2O (a), TiO2/Ag2O (b), TiO2/Ag2Ohν30s (c), and TiO2/Ag2Ohν2h (d). | ||
 | ||
| Fig. 5 SEM image of the selected area of the TiO2/Ag2Ohν2h composite recorded with SE (left) and BSE (middle) detectors along with the particle size distribution (right). | ||
DRS UV-vis
The DRS UV-vis spectrum of non-irradiated TiO2/Ag2O exhibits features characteristic of bare P25 and Ag2O (Fig. 6). The absorption edge after materials mixing follows the edge of bare P25. However, the absorption in the whole range of visible light increases which is consistent with the absorption of bare, brown Ag2O.38 After irradiation for 30 s (TiO2/Ag2Ohν30s), a significant hypsochromic shift in the absorption edge can be observed and the material turns dark violet, indicating the nucleation of metallic silver and growth of metallic clusters.39,40 This is an intermediate step in the growth of silver nanostructures. Prolonged irradiation (TiO2/Ag2Ohν2h) leads to a change in the material colour to red ochre and the formation of the absorption band with a maximum of ca. 430 nm on the DRS spectrum, whereas the absorption edge remains the same as for the material irradiated for 30 s. These results further confirm the growth of metallic clusters during irradiation and the formation of silver nanoparticles.35,41 The band between 350 and 550 nm can be attributed to the surface plasmon resonance (SPR) of these nanoparticles.31,35 | ||
| Fig. 6 DRS spectra of examined materials: Kubelka–Munk function (upper picture) and Tauc transformation (lower picture). The inset shows the magnification in the range of the SPR band of silver nanoparticles. | ||
UV-vis
UV-vis absorption spectra of the aqueous suspension of Ag2O before and after irradiation were collected to complete the spectral analysis of this material (Fig. 7). Similar to DRS measurements, the absorption in the whole range of visible light is noticeable. Moreover, two peaks at 210 and 225 nm are present. After irradiation of bare Ag2O, the broad peak with a maximum of around 430 nm appears, confirming the formation of Ag nanoparticles. This process can be facilitated by P25. To reveal the progress of Ag nanoparticle growth in TiO2/Ag2O, UV-vis spectra were recorded before and after selected irradiation times (Fig. 8). As depicted in Fig. 8, the absorption edge of as-prepared TiO2/Ag2O is the same as for P25. This observation is consistent with DRS measurements. Moreover, the peaks at 210 and 225 nm characteristic of bare Ag2O are also present. During irradiation, these peaks disappear already after 30 s, and the SPR peak around 420 nm arises (after 5 min). Then it shifts bathochromically and separates from TiO2 absorption after 2 h, indicating a continuous growth of silver nanoparticles which is completed after 2 h (Fig. 8 and S2†). | ||
| Fig. 7 UV-vis absorption spectra of bare Ag2O before and after irradiation (2 h). | ||
 | ||
| Fig. 8 UV-vis spectra of the TiO2/Ag2O composite and its components (upper picture); UV-vis spectra recorded at decisive time intervals of TiO2/Ag2O irradiation (lower picture). | ||
SE-DRS
Spectroelectrochemical measurements (SE-DRS) indicate that the conduction band edge of the bare P25 material lies around −0.8 V vs. Ag/Ag+ electrode which equals −0.5 V vs. SHE (Fig. 9). It is consistent with the data presented in the literature.42,43 In comparison, for the TiO2/Ag2O material, increased density of states around the conduction band edge of P25 can be observed. As this range corresponds to the surface states of titania, this result reveals that in the as-prepared TiO2/Ag2O material (i.e., directly after mixing P25 with Ag2O), the new states are created. However, after material phototransformation, a significant shift in the state distribution towards lower potentials (higher energy) can be observed. It points to the possible enhanced reducing ability of the material after the phototransformation. Furthermore, no significant amount of additional isolated states within the bandgap, originating from the silver nanoparticles present in the TiO2/Ag2Ohν2h material, is created. On this basis, it can be concluded that states near the conduction band edge, often attributed to the surface states and defects, are consumed during nanoparticle growth. This observation reveals the role of these states as nucleation centres for AgNPs. Therefore, upon phototransformation of TiO2/Ag2O, the material gains better performance in reduction processes. | ||
| Fig. 9 SE-DRS results revealing conduction band edge positions of examined materials. | ||
SPV
Surface photovoltage measurements (SPV) were performed to elucidate the fate of charges photogenerated within the material. The studies were conducted using tablets made of bare and layered materials to reveal the direction of the charge transfer. The photoresponse of examined materials results in a change of the CPD during irradiation. Fig. 10 shows normalized SPV measurements for pristine TiO2, Ag2O and layered materials – Ag2O on the top of TiO2 and TiO2 on the top of Ag2O (Scheme 1). Ag2O exhibits features of a p-type semiconductor (ΔCPD < 0), whereas TiO2 is an n-type semiconductor (ΔCPD > 0). The range of photoactivity of both materials differs significantly. TiO2 shows photoresponse in the range of 400 to 280 nm, while the photoresponse of Ag2O is pronounced in the whole range of incident light (500–280 nm), and |ΔCPD| decreases with the increase of the photon energy. This indicates that charges are photogenerated in Ag2O upon irradiation with both UV and visible light. These observations are consistent with the spectral features of the materials. In comparison to TiO2, |ΔCPD| for Ag2O is in general higher, which points to a better separation of the photogenerated charges in this material. However, after the deposition of both materials, the impact of TiO2 prevails over Ag2O. For TiO2 covering Ag2O, the sign of ΔCPD changes when the irradiation wavelength crosses 400 nm, which is specific to the TiO2 absorption edge. In comparison, when Ag2O is applied on top of TiO2, the effect is similar but more discrete. In this case, the switch appears at 340 nm. These observations show that effective ΔCPD results from the features of both components, however, the features of the top material prevail, as it is better exposed to light. The top material acts at the same time as an optical filter governing the light absorption by the bottom layer. An effective junction, which would enhance charge separation, could be identified by the |ΔCPD| increase. Our results do not confirm the formation of any junction facilitating a charge transfer between both components. To verify the effect of created AgNPs on charge transfer, SPV measurements were conducted for layered materials: Ag2O on the top of TiO2 with the surface decorated with AgNPs and Ag2Ohν on top of TiO2 (Fig. S3†). These systems reveal the same trends as Ag2O on top of TiO2, proving that AgNPs do not act as charge transfer mediators between TiO2 and Ag2O. | ||
| Fig. 10 SPV for TiO2, Ag2O and layered systems: TiO2 on top of Ag2O and vice versa. | ||
 | ||
| Scheme 1 Visualization of photogenerated charge transfer in SPV measurements for TiO2 (a), Ag2O (b), Ag2O on the top of TiO2 (c) and TiO2 on the top of Ag2O (d). | ||
The photoresponse of the TiO2/Ag2O system changes dramatically after phototransformation. Fig. 11 depicts SPV measurements of TiO2/Ag2Ohν30s and TiO2/Ag2Ohν2h compared with those of bare TiO2. Both materials consisting of Ag clusters exhibit photoinduced charge separation under irradiation in the range of ca. 380–280 nm.44 Compared to bare TiO2, modification with small Ag clusters (TiO2/Ag2Ohν30s) results in a decrease in ΔCPD under irradiation with wavelengths longer than 340 nm. For TiO2/Ag2Ohν2h a similar effect is observed, but this material exhibits a better charge separation in the range of 340–300 nm compared to bare TiO2. The photoresponse of bare TiO2 in the range of ca. 440–380 nm can be attributed to the excitation involving surface states and defects (within the Urbach tail), whereas for modified materials, in which these states serve as the nucleation centres, the excitation in this range does not occur. Nevertheless, irradiation within the SPR band of Ag (600–400 nm), does not lead to charge separation. The ΔCPD signal is enhanced for the TiO2/Ag2Ohν2h sample, indicating that larger Ag nanoparticles act effectively as electron sinks for eCB− from TiO2. Therefore, decoration with nanoparticles enhances photoresponse in the UV range and leads to better charge separation in the 340–300 nm range. This effect is not valid for visible light irradiation.
 | ||
| Fig. 11 SPV measurements for TiO2 (black line), TiO2/Ag2Ohν30s (violet line) and TiO2/Ag2Ohν2h (orange line). | ||
Photoactivity
The photocatalytic activity has been tested in hydrogen production during water-splitting accompanied by methanol photoreforming. Two aspects were taken into account: (i) the progress of Ag2O transformation and (ii) the amount of released H2, CO, and CO2, of which the last two originate from the oxidation of methanol. Therefore, TiO2, Ag2O, TiO2/Ag2O and TiO2/Ag2Ohν2h (with complete transformation to silver nanoparticles) were selected to establish the factors determining the enhancement of the photoactivity under simulated solar (AM 1.5G) and visible (λ > 420 nm) light irradiation. Fig. 12 presents the photocatalytic performance of the studied materials. It was found that under simulated solar irradiation bare Ag2O is almost inactive (Fig. S4†). Instead, other samples exhibit H2, CO and CO2 release, which confirms the progress of water splitting and photoreforming of methanol. The activity of TiO2 (anatase/rutile mixed phases) in H2 production is well known, therefore, P25 was selected as a reference for establishing the impact of the surface modifications.45 Silver oxide enhances the activity of titanium dioxide after phototransformation due to the formation of silver nanoparticles. It can be seen that TiO2/Ag2Ohν exhibits the highest H2 evolution rate. It can be attributed to the conduction band edge shift (as confirmed by SE-DRS measurements), which is the result of a completed process of Ag nanoparticle growth. As confirmed by SPV measurements, silver nanoparticles acting as electron sinks introduce active sites for hydrogen evolution. The amounts of released CO and CO2 are lower for the TiO2/Ag2Ohν composite compared to those of bare TiO2, which indicates the enhancement of water-splitting performance compared to the photoreforming of methanol. It is worth mentioning that H2 can be a product of water-splitting as well as photoreforming processes, but CO and CO2 can only originate from methanol oxidation. | ||
| Fig. 12 Evolution of products of water splitting and methanol photoreforming under simulated solar light irradiation (AM 1.5G). | ||
Photogenerated electrons can be used not only for hydrogen generation but also for Ag+ reduction. TiO2/Ag2O exhibits slightly lower activity in H2 evolution than TiO2/Ag2Ohν, which is the effect of competition between the mentioned reduction reactions. This difference in the photoactivity of decorated materials originates also from the worse charge separation for TiO2/Ag2O, as confirmed by SPV measurements. The growth of silver nanoparticles can also be enhanced by the consumption of a part of produced H2 in the chemical reduction of Ag2O. Schimo et al. performed thorough studies on the effects of the exposure of variously shaped and sized Ag2O particles to gaseous H2. It turned out that such exposure led to the reshaping and shrinkage of the particles due to their reduction and formation of metallic silver.46 However, TiO2/Ag2O is still more active than bare TiO2, since growing silver nanoparticles act as electron sinks. The reducing ability of this material evolves in time. It is worth noting that for TiO2/Ag2O the highest amounts of released CO and CO2 were observed. Interestingly, their evolution rates decrease over time, simultaneously with AgNP formation. Since the H2 production in the presence of TiO2/Ag2O is more efficient than that at bare TiO2, we postulate that oxygen originating from Ag2O decomposition is not transformed into O2 (its reduction would compete with hydrogen evolution47), but may participate in methanol oxidation.
The activity of Ag2O, TiO2, TiO2/Ag2O and TiO2/Ag2Ohν was also verified under visible light irradiation (λ > 420 nm). It was found that after 6 h of irradiation the amounts of products were very low, therefore prolonged irradiation (20 and 24 h) was applied. The as-prepared TiO2/Ag2O material shows slight evolution of H2 (480 and 870 ppm, respectively). It is worth noting that bare component materials and TiO2/Ag2Ohν remained inactive under the same conditions. Varapragasam et al. also reported the lack of activity of the TiO2 photocatalyst decorated with Ag nanoparticles under visible light irradiation despite the SPR band.48 Moreover, despite the strong photoresponse of Ag2O under visible light confirmed by SPV measurements, this material is not photocatalytically active in hydrogen evolution. Thus, the activity of TiO2/Ag2O originates neither from Ag2O nor AgNP excitation. However, SPV measurements reveal weak photoresponse in the range of 420–460 nm for bare P25. SE-DRS data indicate that in the case of TiO2/Ag2O there is a higher density of electronic states close to the conduction band edge. These states, populated upon material excitation with visible light, can be responsible for silver reduction reactions. In the case of TiO2/Ag2Ohν, where AgNPs have already grown, a lack of activity under visible light irradiation is observed due to the altered position of the CB edge (Fig. 8). These results indicate that visible light plays only a marginal role in photocatalytic processes and is limited only to TiO2/Ag2O. Therefore, under solar light irradiation, UV light is responsible for hydrogen evolution.
In our studies, the UV-vis measurements (Fig. 6 and 7) prove the formation of AgNPs both on bare Ag2O and TiO2/Ag2O under solar light irradiation. Inefficient Ag2O excitation (mainly by visible light) is possible and can lead to Ag+ reduction accompanied by Ag2O decomposition (Scheme 2). It seems that both semiconductors operate separately under simulated solar light irradiation because there is no evidence for the transfer of photogenerated charge between them, as confirmed by SPV measurements. TiO2 is excited by the UV component of the solar spectrum – photogenerated electrons from the CB participate in the reduction of H+ and Ag+, while photogenerated holes take part in the oxidation of water, methanol and intermediates. The formation of AgNPs enhances Ag2O dissolution, observed as a rapid disappearance of Ag2O particles (compare Fig. 3). Therefore, the photocatalytic performance of Ag2O is observed only at the beginning of irradiation, as TiO2/Ag2O rapidly changes into TiO2 decorated with AgNPs. Noteworthily, the photogenerated charges are not transferred between Ag2O and TiO2, even when AgNPs are formed. Nanoparticles can boost photoactivity only by acting as electron sinks for electrons photogenerated within TiO2. The mechanism of photocatalytic activity of the TiO2/Ag2O system is summarized in Scheme 2.
 | ||
| Scheme 2 Proposed mechanism of photocatalytic activity of the TiO2/Ag2O system in water-splitting/methanol photoreforming under solar light irradiation. | ||
Conclusions
The TiO2/Ag2O system was examined in water splitting/methanol photoreforming processes to establish the mechanism of its photocatalytic activity. It turned out that the p–n junction is not created, as confirmed by the surface photovoltage measurements. Moreover, it was found that upon irradiation with simulated solar light, Ag2O in such systems turns into metallic silver in the form of plasmonic nanostructures as confirmed by UV-vis and UV-vis-DRS spectroscopy, X-ray diffractometry, and scanning electron microscopy. The obtained results indicate that the growth of silver clusters does not increase the stability of Ag2O in the presence of TiO2. The presence of the formed plasmonic metallic nanostructures is also not responsible for the enhanced composite activity upon visible light irradiation. This is partially due to the significant change in the state distribution and conduction band shift caused by the growth of nanostructures, which was measured using the spectroelectrochemical method. Moreover, the lack of photoresponse of the material decorated with nanostructures in the range of the Ag SPR band is observed in the SPV measurements and is pronounced also in the lack of material activity in this range. Nevertheless, it is confirmed that under solar light irradiation, the nanostructures act as electron sinks which is beneficial for photocatalytic activity. The phototransformation of Ag2O in the presence of TiO2 accompanies the H2 evolution, increasing the activity in comparison to that of bare TiO2. After the complete formation of AgNPs, due to the CB edge shift towards lower potentials, the reduction processes (inter alia reduction of water) are more plausible. Therefore, it can be stated that during phototransformation, TiO2/Ag2O gains better photocatalytic activity in reduction processes which is correlated with its new intrinsic properties, but not with the formation of the junction or enhancement of activity by the SPR effect. These findings are in contrast to the previous reports.13–18,30The application of Ag2O can rather be considered a beneficial precursor for in situ AgNP growth. This approach enables AgNP formation without contamination of the environment with organic or inorganic residues. When this process is performed in the presence of methanol, photocatalytic water splitting/methanol photoreforming occur simultaneously. Therefore, this method can also be perceived as process optimization, which enables the modification of TiO2 and H2 production in a one-pot procedure at the same time. This approach eliminates the one time-consuming preparation step, and thus it can be useful in the design of a novel technology.
Author contributions
Conceptualization: A. J. and K. S.; data curation: A. J. and K. S.; formal analysis: A. J., K. S., and W. M.; funding acquisition: W. M.; investigation: A. J. and K. S.; methodology: K. S.; supervision: W. M.; validation: A. J.; visualization: A. J. and K. S.; writing – original draft: A. J. and K. S.; writing – review & editing: A. J., K. S., and W. M.Conflicts of interest
There are no conflicts to declare.Acknowledgements
Funding to support this work was provided by the National Science Centre projects: SHENG 1 (2018/30/Q/ST5/00776) and Solar-Driven Chemistry (2019/01/Y/ST5/00027). The authors would like to acknowledge Marek Drozdek and Kamil Urbanek for their contribution to XPS measurements.References
- M. Tao, J. A. Azzolini, E. B. Stechel, K. E. Ayers and T. I. Valdez, J. Electrochem. Soc., 2022, 169, 054503, DOI:10.1149/1945-7111/ac6983.
- S. G. Nnabuife, J. Ugbeh-Johnson, N. E. Okeke and C. Ogbonnaya, Carbon Capture Sci. Technol., 2022, 3, 100042, DOI:10.1016/j.ccst.2022.100042.
- H. Eidsvåg, S. Bentouba, P. Vajeeston, S. Yohi and D. Velauthapillai, Molecules, 2021, 26, 1687, DOI:10.3390/molecules26061687.
- T. Puangpetch, T. Sreethawong, S. Yoshikawa and S. Chavadej, J. Mol. Catal. A: Chem., 2009, 312, 97–106, DOI:10.1016/j.molcata.2009.07.012.
- G. Wu, T. Chen, W. Su, G. Zhou, X. Zong, Z. Lei and C. Li, Int. J. Hydrogen Energy, 2008, 33, 1243–1251, DOI:10.1016/j.ijhydene.2007.12.020.
- V. Polliotto, S. Livraghi, A. Krukowska, M. V. Dozzi, A. Zaleska-Medynska, E. Selli and E. Giamello, ACS Appl. Mater. Interfaces, 2018, 10(33), 27745–27756, DOI:10.1021/acsami.8b05528.
- S. Kampouri and K. C. Stylianou, ACS Catal., 2019, 9(5), 4247–4270, DOI:10.1021/acscatal.9b00332.
- C. A. Walenta, M. Tschurl and U. Heiz, J. Phys.: Condens. Matter, 2019, 31, 473002, DOI:10.1088/1361-648X/ab351a.
- A. L. Linsebigler, G. Lu and J. T. Yates Jr, Chem. Rev., 1995, 95(3), 735–758, DOI:10.1021/cr00035a013.
- M. A. Henderson, Surf. Sci. Rep., 2011, 66, 185–297, DOI:10.1016/j.surfrep.2011.01.001.
- N. A. M. Barakat, N. A. Erfan, A. A. Mohemmed and S. E. I. Mohamed, Colloids Surf., A, 2020, 604, 125307, DOI:10.1016/j.colsurfa.2020.125307.
- Z. S. Ghamsari and H. Bashiri, Surf. Interfaces, 2020, 21, 100709, DOI:10.1016/j.surfin.2020.100709.
- M. Endo-Kimura, M. Janczarek, Z. Bielan, D. Zhang, K. Wang, A. Markowska-Szczupak and E. Kowalska, ChemEngineering, 2019, 3(1), 3, DOI:10.3390/chemengineering3010003.
- X. Xue, X. Gong, X. Chen and B.-Y. Chen, J. Phys. Chem. Solids, 2021, 150, 109799, DOI:10.1016/j.jpcs.2020.109799.
- M. Sboui, H. Lachheb, S. Bouattour, M. Gruttadauria, V. La Parola, L. F. Liotta and S. Boufi, Environ. Res., 2021, 198, 111257, DOI:10.1016/j.envres.2021.111257.
- E. Albiter, M. A. Valenzuela, S. Alfaro, G. Valverde-Aguilar and F. M. Martínez-Pallares, J. Saudi Chem. Soc., 2015, 19, 563–573, DOI:10.1016/j.jscs.2015.05.009.
- S. Zamani, M. R. Rahimi and M. Ghaedi, J. Environ. Manage., 2022, 303, 114216, DOI:10.1016/j.jenvman.2021.114216.
- H. Wang, T. Sun, N. Xu, Q. Zhou and L. Chang, Ceram. Int., 2021, 47, 4905–4913, DOI:10.1016/j.ceramint.2020.10.063.
- J. P. Allen, D. O. Scanlon and G. W. Watson, Phys. Rev. B: Condens. Matter Mater. Phys., 2011, 84, 115141, DOI:10.1103/PhysRevB.84.115141.
- H. Xu, J. Xie, W. Jia, G. Wu and Y. Cao, J. Colloid Interface Sci., 2018, 516, 511–521, DOI:10.1016/j.jcis.2018.01.071.
- Y.-J. Chen, Y.-W. Chiang and M. H. Huang, ACS Appl. Mater. Interfaces, 2016, 8(30), 19672–19679, DOI:10.1021/acsami.6b04686.
- L. Zhou, G. Zou and H. Deng, Catalysts, 2018, 8(7), 272, DOI:10.3390/catal8070272.
- X. Wang, S. Li, H. Yu, J. Yu and S. Liu, Chem.–Eur. J., 2011, 17, 7777–7780, DOI:10.1002/chem.201101032.
- F. Dionigi, P. C. K. Vesborg, T. Pedersen, O. Hansen, S. Dahl, A. Xiong, K. Maeda, K. Domen and I. Chorkendorff, J. Catal., 2012, 292, 26–31, DOI:10.1016/j.jcat.2012.03.021.
- B. Ipek and D. Uner, in Water Chemistry, IntechOpen, 2019, DOI:10.5772/intechopen.89235.
- H. Nasrallah, F. Douma, H. I. Hamoud and M. El-Roz, in Nanostructured Photocatalysts, Elsevier, 2021, pp. 119–143, DOI:10.1016/B978-0-12-823007-7.00019-5.
- G. B. Strapasson, M. Assis, C. W. Backes, S. A. Corrêa, E. Longo and D. E. Weibel, Int. J. Hydrogen Energy, 2021, 46, 34264–34275, DOI:10.1016/j.ijhydene.2021.07.237.
- F. Temerov, K. Pham, P. Juuti, J. M. Mäkelä, E. V. Grachova, S. Kumar, S. Eslava and J. J. Saarinen, ACS Appl. Mater. Interfaces, 2020, 12(37), 41200–41210, DOI:10.1021/acsami.0c08624.
- D. Gogoi, A. Namdeo, A. K. Golder and N. R. Peela, Int. J. Hydrogen Energy, 2020, 45, 2729–2744, DOI:10.1016/j.ijhydene.2019.11.127.
- K. K. Mandari, B. S. Kwak, A. K. R. Police and M. Kang, Mater. Res. Bull., 2017, 95, 515–524, DOI:10.1016/j.materresbull.2017.08.028.
- C. Liu, C. Cao, X. Luo and S. Luo, J. Hazard. Mater., 2015, 285, 319–324, DOI:10.1016/j.jhazmat.2014.12.020.
- H. L. Johnston, F. Cuta and A. B. Garrett, J. Am. Chem. Soc., 1933, 55(6), 2311–2325, DOI:10.1021/ja01333a016.
- G. Sadanandam, D. K. Valluri and M. S. Scurrel, Int. J. Hydrogen Energy, 2017, 42, 807–820, DOI:10.1016/j.ijhydene.2016.10.131.
- H. T. Ren, S.-Y. Jia, J.-J. Zou, S.-H. Wu and X. Han, Appl. Catal., B, 2015, 176–177, 53–61, DOI:10.1016/j.apcatb.2015.03.038.
- E. Bu, Y. Chen, C. Wang, Z. Cheng, X. Luo, R. Shu, J. Zhang, M. Liao, Z. Jiang and Q. Song, Chem. Eng. J., 2019, 370, 646–657, DOI:10.1016/j.cej.2019.03.259.
- A. Ziashahabi, M. Prato, Z. Dang, R. Poursalehi and N. Naseri, Sci. Rep., 2019, 9, 11839, DOI:10.1038/s41598-019-48075-7.
- A. M. Ferraria, A. P. Carapeto and A. M. Botelho do Rogo, Vacuum, 2012, 86, 1988–1991, DOI:10.1016/j.vacuum.2012.05.031.
- H. Guo, C.-G. Niu, D.-W. Huang, N. Tang, C. Liang, L. Zhang, X.-J. Wen, Y. Yang, W.-J. Wang and G.-M. Zeng, Chem. Eng. J., 2019, 360, 349–363, DOI:10.1016/j.cej.2018.11.229.
- E. Grabowska, A. Zaleska, S. Sorgues, M. Kunst, A. Etcheberry, C. Colbeau-Justin and H. Remita, J. Phys. Chem. C, 2013, 117, 1955–1962, DOI:10.1021/jp3112183.
- I. Diez, M. Pusa, S. Kulmala, H. Jiang, A. Walther, A. S. Goldmann, A. H. E. Müller, O. Ikkala and R. H. A. Ras, Angew. Chem., Int. Ed., 2009, 48, 2122–2125, DOI:10.1002/anie.200806210.
- R. T. Yunarti, I. D. Isa, L. C. C. Dimonti, A. A. Dwiatmoko, M. Ridwan and J.-M. Ha, Nano-Struct. Nano-Objects, 2021, 26, 100719, DOI:10.1016/j.nanoso.2021.100719.
- S. Xie, Q. Zhang, G. Liu and Y. Wang, Chem. Commun., 2016, 52, 35–59, 10.1039/C5CC07613G.
- M. Bledowski, L. Wang, A. Ramakrishnan, O. V. Khavryuchenko, V. D. Khavryuchenko, P. C. Ricci, J. Strunk, T. Cremer, C. Kolbeck and R. Beranek, Phys. Chem. Chem. Phys., 2011, 13, 21511–21519, 10.1039/C1CP22861G.
- T. Cai, Y. Liu, L. Wang, S. Zhang, J. Ma, W. Dong, Y. Zeng, J. Yuan, C. Liu and S. Luo, ACS Appl. Mater. Interfaces, 2018, 10(30), 25350–25359, DOI:10.1021/acsami.8b06076.
- Y. K. Kho, A. Iwase, W. Y. Teoh, L. Mädler, A. Kudo and R. Amal, J. Phys. Chem. C, 2010, 114(6), 2821–2829, DOI:10.1021/jp910810r.
- G. Schimo, A. M. Kreuzer and A. W. Hassel, Phys. Status Solidi A, 2015, 212(6), 1202–1209, DOI:10.1002/pssa.201431669.
- C. Y. Toe, C. Tsounis, J. Zhang, H. Masood, D. Gunawan, J. Scott and R. Amal, Energy Environ. Sci., 2021, 14, 1140–1175, 10.1039/D0EE03116J.
- S. J. P. Varapragasam, S. Mia, C. Wieting, C. Balasanthiran, M. Y. Hossan, A. Baride, R. M. Rioux and J. D. Hoefelmeyer, ACS Appl. Energy Mater., 2019, 2(11), 8274–8282, DOI:10.1021/acsaem.9b01730.
Footnote |
| † Electronic supplementary information (ESI) available. See DOI: https://doi.org/10.1039/d2na00910b |
| This journal is © The Royal Society of Chemistry 2023 |