
 Open Access Article
 This Open Access Article is licensed under a Creative Commons Attribution-Non Commercial 3.0 Unported Licence
A novel method for the synthesis of core–shell nanoparticles for functional applications based on long-term confinement in a radio frequency plasma†
Oguz Han
Asnaz‡
 a,
Jonas
Drewes‡
b,
Marie
Elis
c,
Thomas
Strunskus
bd,
Franko
Greiner
ad,
Oleksandr
Polonskyi§
b,
Franz
Faupel
bd,
Lorenz
Kienle
cd,
Alexander
Vahl
*bd and
Jan
Benedikt
*ad
a,
Jonas
Drewes‡
b,
Marie
Elis
c,
Thomas
Strunskus
bd,
Franko
Greiner
ad,
Oleksandr
Polonskyi§
b,
Franz
Faupel
bd,
Lorenz
Kienle
cd,
Alexander
Vahl
*bd and
Jan
Benedikt
*ad
aInstitute of Experimental and Applied Physics, Kiel University, Leibnizstr. 19, D-24098 Kiel, Germany. E-mail: benedikt@physik.uni-kiel.de
bChair for Multicomponent Materials, Institute of Materials Science, Kiel University, Kaiserstr. 2, D-24143 Kiel, Germany. E-mail: alva@tf.uni-kiel.de
cChair for Synthesis and Real Structure, Institute of Materials Science, Kiel University, Kaiserstr. 2, D-24143 Kiel, Germany
dKiel Nano, Surface and Interface Science KiNSIS, Kiel University, Christian-Albrechts-Platz 4, D-24118 Kiel, Germany
First published on 10th January 2023
Abstract
A novel combined setup of a Haberland type gas aggregation source and a secondary radio frequency discharge is used to generate, confine, and coat nanoparticles over much longer time scales than traditional in-flight treatment. The process is precisely monitored using localized surface plasmon resonance and Fourier-transform infrared spectroscopy as in situ diagnostics. They indicate that both untreated and treated particles can be confined for extended time periods (at least one hour) with minimal losses. During the entire confinement time, the particle sizes do not show considerable alterations, enabling multiple well-defined modifications of the seed nanoparticles in this synthesis approach. The approach is demonstrated by generating Ag@SiO2 nanoparticles with a well-defined surface coating. The in situ diagnostics provide insights into the growth kinetics of the applied coating and are linked to the coating properties by using ex situ transmission electron microscopy and energy dispersive X-ray spectroscopy. Surface coating is shown to occur in two phases: first, singular seeds appear on the particle surface which then grow to cover the entire particle surface over 3 to 5 minutes. Afterwards, deposition occurs via surface growth which coincides with lower deposition rates. Our setup offers full control for various treatment options, which is demonstrated by coating the nanoparticles with a SiO2 layer followed by the etching of the part of the applied coating using hydrogen. Thus, complex multi-step nanofabrication, e.g., using different monomers, as well as very large coating thicknesses is possible.
1 Introduction
Over the last few decades, noble metal nanoparticles (NPs) attracted the attention of many researchers because of their unique properties in comparison to their bulk counterparts. These properties gave rise to various fields of applications such as photocatalysis,1–5 optics,6 resistive switching,7–13 and sensors.14–18 The optical properties originating from the presence of localized surface plasmons19 open up applications in the fields of, e.g., surface-enhanced Raman spectroscopy,20 solar cells,21 and absorber layers for solar thermal collectors.22 Furthermore, noble metal NPs and especially Ag NPs show antibacterial properties because their high surface-to-volume ratio enables fast ion release.23 Fine control over the ion release rate of Ag NPs is of high importance for applications like antibacterial coatings in medicine, construction industry, clothing, or food packaging. This can be achieved via the incorporation of Ag NPs into a polymer matrix, e.g., PTFE, PMMA, or PA6 as the ion release rate depends on the matrix material as well as on its thickness.24–26 The optical properties of Ag NPs are also tunable by changing the surrounding dielectric medium, because the localized surface plasmon resonance depends on the dielectric constant of the surrounding medium.27 Therefore, a precise control over the matrix properties and its thickness is critical to tune the ion release, antimicrobial, and optical properties.The inter-particle distance is an additional important parameter to tune the optical properties of absorber layers,28 which is usually difficult to tune when the NPs and the matrix are synthesized at the same time or after each other on a substrate. In such cases, core–shell NPs are interesting building blocks, as a precise control of their coating thickness comes with control over the inter-core distance once the particles are closely packed. Ag@SiO2 NPs (Ag core and SiO2 shell) exhibit interesting optical29 and antibacterial properties.30 Ag@SiO2 core–shell NPs can be synthesized by different methods. For the core, Ag NPs can be synthesized by chemical, physical, or biological methods.31 A chemical way is, e.g., the reduction of silver nitrate with hydrazine. In order to form Ag@SiO2 core–shell NPs, the Stöber method32 can be applied to coat the Ag NPs.30 Such methods have the drawback that the produced particles are in solution and it can be difficult to remove all chemicals from the NPs to obtain high purity.
One particularly versatile approach to fabricate highly pure noble metal nanoparticles without the need for any surfactant is a magnetron-based, Haberland-type gas aggregation source (GAS).33 A Haberland type GAS consists of a vacuum chamber equipped with a magnetron. The chamber is connected to a deposition chamber via a small orifice with a diameter in the range of millimeters. Due to the orifice the pressure in the GAS is in the order of tens to hundreds of pascals, which is high in comparison to conventional sputtering devices for the formation of thin films. The sputtered atoms can form NPs in the gas phase due to the high pressure and are then transported to the deposition chamber by the drag force of the sputtering gas.
GASs have also been successfully used to create core–shell NPs. Huttel et al.34 use multiple magnetrons in the gas aggregation volume and tailor the distance between each magnetron and the exit orifice to create binary or ternary core–shell NPs. This approach however is limited by the time of flight of the particles and the length of the aggregation zone and is mostly used for metal@metal nanoparticles. In a second approach by Ahadi et al.35 and Kylián et al.,36 the Haberland type GAS is combined with a secondary direct current (DC) magnetron discharge to synthesize pure NPs in the GAS and then coat them prior to deposition in the second discharge with a shell material. The achievable coating thickness is limited by the maximum power, which can be applied to the target and the residence times defined by the strength of the gas flow. Investigations by Solař et al.37 on the exit velocity of NPs have shown that for typical operating conditions even mean velocities of up to 93 m s−1 are possible. Therefore, special experimental measures have to be taken in order to increase the residence time of the particles in the secondary coating region, e.g., by injecting additional argon gas. Moreover, the fabrication of complex core–shell particles involving several layers is not possible.
In this paper, we will present a combination of a Haberland type GAS together with a secondary radio frequency (RF) plasma discharge, in which Ag NPs are trapped for a secondary coating process with SiO2. This setup circumvents the limitations of in-flight coating, as the trapped particles can be treated over much longer time scales and even over multiple processing steps independent of their synthesis parameters. On these time scales, in situ diagnostics become powerful tools for very fine control of the particle properties. Using both localized surface plasmon resonance (LSPR) and Fourier-transform infrared spectroscopy (FTIR) allows for creating core–shell particles with a defined composition and thickness specifically designed for their application. We will compare the two diagnostic methods focusing on the insight into particle properties they offer. To provide a ground truth for the in situ diagnostics, we are extracting particles and using transmission electron microscopy (TEM) and energy dispersive X-ray spectroscopy (EDX) as an ex situ measurement.
2 Experimental setup and diagnostics
2.1 Experimental setup
The experimental setup shown in Fig. 1 is a modular vacuum deposition setup consisting of two fundamental components: a gas aggregation source (GAS) that generates metal NPs and an RF plasma trapping setup, which holds them for further treatment. The GAS is a custom-build Haberland type gas aggregation source connected to the treatment plasma setup via a differential pumping stage. The source was equipped with a 2-inch height-adjustable and water-cooled DC magnetron (IX2U-9A327-02; Thin Films Consulting). The height-adjustable magnetron enables the tuning of the aggregation length, i.e., the distance between the magnetron and the orifice of the GAS. This distance was kept constant for all experiments. The deposition was performed with a flow of 160 sccm Ar, which corresponds to a pressure of about 170 Pa in the GAS. An MDX 500 from Advanced Energy was used as a power supply and was operated in the power regulation mode with a power of 100 W. An MKS flow controller (GE50 A) with a 500 sccm range was used for the gas flow regulation. To keep the operating pressure of the GAS and treatment plasma independent of each other, a differential pumping stage is used to remove a large portion of the buffer gas. By pumping symmetrically from top and bottom, the resulting deflection of the particle stream is minimized. Additionally, the particles are guided with a feed pipe up to a distance of 10 mm in front of the aperture, keeping the particle stream focused and maximizing transfer into the next stage. At this point, a shutter allows for interrupting the particle stream and sealing the treatment plasma from the rest of the setup, if necessary. Finally, using a second feed pipe, the particles are injected directly into the plasma volume where charging effects and the resulting electric field forces ensure confinement of the particles.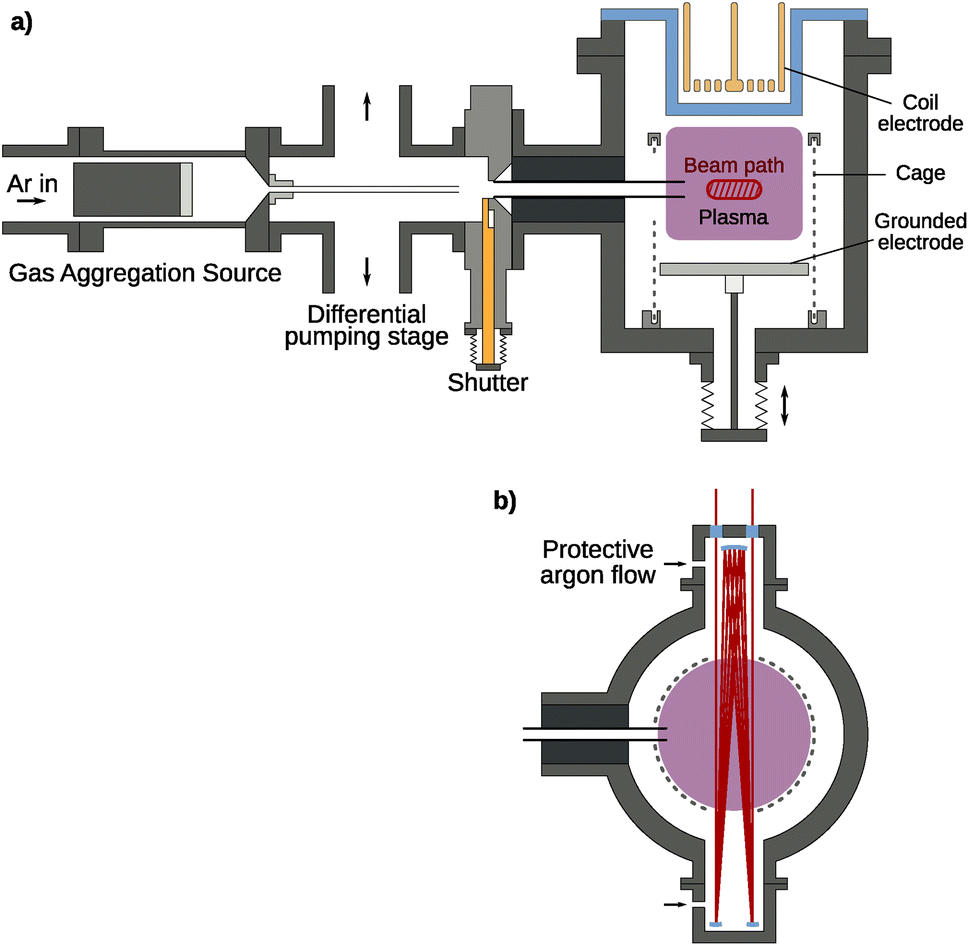 | ||
| Fig. 1 (a) Side view of the experimental setup combining a gas aggregation source (GAS) with a secondary treatment plasma setup for long-term confinement. Particles are generated at the GAS at a higher pressure, creating a flow directed through the feed pipe to the differential pumping stage. Here, the buffer gas is pumped away symmetrically to minimize the loss of particles. The particles then flow through a second feed pipe through a shutter system directly into the treatment plasma volume, where charging effects ensure their confinement. While a coil electrode is used for the option of an inductively coupled plasma, in this work it is only used in a capacitively coupled mode. The plasma volume is surrounded by a grounded cage for better confinement through higher electric fields. The hatched area in red represents the IR/UV-vis beam area oriented perpendicular to the sketch plane. (b) Top view of the treatment plasma chamber. The IR/UV-vis beam path is shown in red. Argon is let in through the marked nozzles to create a protective gas flow for the white cell mirrors. | ||
The treatment plasma consists of a grounded bottom electrode on a linear movement stage with a 142 mm diameter. The upper electrode is a copper coil with 2 × 3 windings driven with a Dressler Cesar 133 RF generator providing a power of up to 150 W at 13.56 MHz at its middle contact behind a borosilicate glass cylinder, enabling both inductively coupled (ICP) and capacitively coupled plasma (CCP) operation. For this experiment, the CCP mode was used exclusively as the higher energy density of the ICP mode disintegrates the silver particles very quickly, seen as emission lines in the optical emission spectrum. Around the plasma volume, a grounded wire mesh with a 1 mm wire diameter and 3 mm spacing is used to improve particle confinement using high electric fields in the resulting plasma sheath. In the mesh, openings are cut for the feed pipe, for a multi-pass IR/UV-vis beam path, and for particle extraction. Additionally, a gas inlet for different reactive gases is present at the treatment plasma chamber. Different MKS flow controllers (GE50 A) are connected to control the precursor flow. The flow controller for the SiH4/Ar mixture with 0.01% SiH4 has a range of 200 sccm. Additionally, flow controllers with a range of 10 sccm are present for H2 and O2.
FTIR and UV-vis spectra are always recorded in situ in the treatment plasma chamber (see Fig. 1) using a multi-pass beam setup consisting of a white cell (neoplas control GmbH) for up to 20 passes, increasing the optical path through the plasma volume to zIR = 20 × 142 mm = 2.8 m for the IR beam and zUV-vis = 4 × 142 mm = 0.6 m for the UV-vis setup. The beam path crosses a region of about 10 mm height and 40 mm width. To prevent deposition on the multi-pass cell and the windows, Ar gas was injected at both sides of the multi-pass cell. The Ar flow was controlled with an MKS flow controller (GE50 A) with a range of 50 sccm and was set to 30 sccm. The Ar gas flow is shared by both gas inlets at both sides of the multi-pass cell. For IR-spectrometric monitoring, a commercial FTIR spectrometer (Bruker VERTEX 80v) is used with a liquid-nitrogen-cooled DLaTGS detector. This setup has been previously used for monitoring the growth and treatment of hydrogenated amorphous carbon (a-C:H) NPs generated from C2H2 precursors.38 UV-vis spectrometry is performed using a deuterium-halogen light source (Ocean Optics DH-2000-BAL) and a spectrometer (Ocean Optics USB4000).
Particle extraction is realized with a load-lock setup bringing in a 10 mm × 10 mm silicon wafer piece clamped underneath a stainless steel metal plate with a circular cutout. By applying a short 200 ms pulse of 170 V to the metal plate using a Keithley SourceMeter 2400, particles are accelerated towards the sample holder and stick to the silicon wafer for further ex situ analysis. With the chamber being operated only in the high vacuum range and residual air coming in through the load-lock, there is enough residual oxygen in the system when using a gas mixture of 0.01% SiH4 in Ar for SiO2 coating without active addition of oxygen.
For transmission electron microscopy (TEM) analysis, the nanoparticles were scratched off the silicon substrate with a scalpel and transferred onto a copper grid with a carbon lacey coating (Plano GmbH). Bright field imaging as well as selected area electron diffraction (SAED) were performed with a FEI Tecnai F30 STwin G2 with 300 kV acceleration voltage. For energy dispersive X-ray (EDX) spectroscopy, the microscope is equipped with a Si/Li detector (EDAX System). The EDX spectroscopy data were processed with ES Vision (version 4.0.173).
2.2 Experimental procedure
In this chapter, the general experimental procedure will be described in detail:1. The system is pumped down with a turbo molecular pump down to a pressure of 10−5 Pa. Then the valve to the turbo pump is closed.
2. Rough pumps for the differential pumping stage and the rough pump of the treatment plasma chamber are started.
3. The Ar flow for the GAS (160 sccm) and the multi-pass cell (30 sccm) are activated and the valves of the rough pumps are opened. The pressure in the GAS, at the differential pumping stage, and in the treatment plasma chamber stabilizes at values of about 170 Pa, 16 Pa and 11 Pa respectively.
4. The CCP Plasma is switched on with an RF power of 188 W and a reflected power of 88 W.
5. The UV-vis or the FTIR spectrometer respectively starts recording along the line of sight through the treatment plasma chamber.
6. The power supply for the magnetron of the GAS is switched on with 100 W usually for 10 s which starts the synthesis and injection of Ag NPs into the treatment plasma. Only for the long-term confinement in Fig. 2 an on-time of 60 s is used.
 | ||
| Fig. 2 (a) In situ UV-vis transmission spectra for 7 different times during the NP injection. 0 s corresponds to the plasma ignition in the GAS. At 60 s the injection of Ag NPs is stopped. Plasma emission lines were removed from the spectra. (b) Long-term measurement of injected Ag NPs, which are trapped for 1 h in the CCP plasma. The peak position λpeak corresponds to the wavelength of the minimum in the transmission spectrum. | ||
7. The flow of the SiH4 mixture (0.01% in Ar) is set to 20 sccm and the Ar flow through the multi-pass cell is reduced to 10 sccm to keep the pressures constant. This flow creates precursor densities below the critical point for silicon NP formation from silane precursors, which was confirmed with prior FTIR measurements in the absence of silver NPs.
8. Once the desired coating times of 1, 3, 5 and 10 min are reached, the precursor flow is switched off by setting the flow controller to 0 sccm to stop the coating procedure.
9. In the case of extraction, after a short waiting time, the NPs are extracted by opening the load lock and moving the extraction unit close to the plasma. After the voltage pulse (170 V and 200 ms) is applied, the extraction unit is moved back into the load lock, which is then closed again.
10. Plasma and spectrometers are switched off.
3 Results
3.1 Long-term confinement of uncoated Ag NPs
Fig. 2a shows several UV-vis transmission spectra during the injection process. Here, plasma emission lines were excluded from the spectrum using a reference spectrum taken before the injection. The main peak ≈ 355 nm of the localized surface plasmon resonance (LSPR) of the Ag NPs can exhibit a red shift both for an increase in the NP size39–41 and for a surrounding dielectric with a dielectric constant greater than unity.27,42,43 In Fig. 2b, the position of the main peak only shows a small red shift of 9 nm over one hour of confinement. This is unlikely to come from a particle size increase due to agglomeration, as the particles are charged in the plasma environment and repulse each other. It is more likely that the presence of trace amounts of oxygen causes an oxidation of the particle surface, effectively changing the surface dielectric constant and thereby causing the slight red shift. Therefore, this measurement can be assumed as a reference measurement for an unperturbed system without the usage of any precursor gas. The shift in the LSPR is relatively small and still allows the detection of a shift of the LSPR related to an additional coating of the Ag NPs, which will be shown in the next section.Looking at the absorption strength of the LSPR, a strong increase can be seen during particle injection coming from the increase in NP density. This increase is followed by a slight decrease of about 5% in the first minutes of confinement after which it stays very constant for the remainder of the experiment, indicating that the NPs are well confined in the CCP plasma. The small decrease also points towards oxidation, as the oxide layer would effectively decrease the plasmonically active diameter of the NP. After the CCP plasma is switched off, the transmission over the entire spectral range goes back to its initial value, showing that no NPs are deposited on mirrors or windows in the optical path (see Fig. 1 in the ESI†).
Additionally, Fig. 2a shows a change in the peak shape. For longer injection times a shoulder appears at higher wavelengths, which also stays after the injection is stopped. This might stem from the coupling of LSPRs of multiple NPs. If plasmonic NPs approach each other to a close distance of around 30 nm or smaller, the LSPRs can couple which causes additional resonances at higher wavelengths.28 Assuming an average particle diameter of 20 nm and resulting LSPR cross section44 of σLSPR = 2 × 10³ nm2 at the peak, we can use the UV-vis spectrum to calculate a particle number density of n ≈ 1015 m−3. This is in the same order of magnitude as the electron density and therefore leads to a strong electron depletion.45,46 Particles are not being charged to their theoretical capacitive limit determined by orbital motion limited (OML) theory, but rather only carry very few elementary charges that fluctuate stochastically. While the average inter-particle spacing at this density is about 5 μm, this reduction of repulsive forces leads to a wide spacing distribution and particles regularly come close enough for plasmonic coupling or even agglomeration to occur. For the following investigations of coating of trapped NPs, the injection time was limited to 10 s to lower particle densities and thereby avoid plasmonic coupling phenomena.
3.2 In situ coating and in situ diagnostics of coating thickness
Ag NPs were injected into the CCP plasma for treatment. Different SiH4 exposure durations were applied to control the thickness of the dielectric shell around the Ag NPs. The recorded UV-vis spectra can be seen in Fig. 3a. Over time, the main absorption peak shifts towards higher wavelengths due to the LSPR from the Ag NPs together with a general increase in overall absorption, which is in line with the literature.27,42,43 Interestingly, a shoulder at higher wavelengths becomes stronger with increasing coating times similar to the results for high particle densities reported in the previous section. Therefore, it can be assumed that the LSPRs of different NPs are coupled to each other in the coated case. The addition of silane as an electronegative gas lowers the free electron density further,47 thereby lowering the average inter-particle spacing. The agglomeration of coated particles could also lead to the observed increased shoulder as even after agglomeration the plasmonically active cores are electrically separated by their shells. SEM pictures have shown that some agglomerates are present on the samples (see Fig. 2 in the ESI†), yet it is unclear if these agglomerates are formed in the CCP plasma or during the deposition. Another study has also shown that agglomerates can be formed already inside the GAS.48 Nevertheless, these agglomerates from the GAS would not affect the LSPR during the coating period, as the GAS is switched off prior to the coating step. Further investigations would be necessary to determine whether agglomeration occurs in the treatment plasma. | ||
| Fig. 3 (a) UV-vis absorption spectrum showing a LSPR peak shift. The starting time t = 0 s corresponds to the start of the coating treatment. Plasma emission lines were removed from the spectrum. (b) Time evolution of the LSPR peak position for four different treatment durations. (c) FTIR absorption spectrum with the inset showing a decomposition of the Si–O–Si asymmetric stretching absorption and the sum of fits. (d) Time evolution of the integrated absorbance and calculated Si–O–Si concentration in the plasma volume for four different treatment durations. | ||
Fig. 3b shows the time evolution of the main LSPR peak for four separate treatments, differing from each other only in the total coating time. Values smaller than 0 s correspond to the pure Ag NPs before the SiH4 was injected into the chamber. The reproducibility of the experiment is very good, with the only visible difference between the curves being the different points at which the SiH4 gas flow was turned off. In general, prior to the treatment no significant changes are visible, which is expected and was shown in the previous section. Once the treatment starts at 0 s, all curves show a strong redshift of the LSPR peak position. Nevertheless, the trend is not linear. The slope decreases until ≈ 150 s, after which the LSPR shift shows a linear dependency on the coating time until the SiH4 flow is switched off. The general redshift of the LSPR is explained by the coating of the NPs with a dielectric medium, whereas the change in the slope is more difficult to explain. It is known that for thin coatings, the LSPR shift shows a linear dependence on the layer thickness. For thicker coatings, the slope of the LSPR decreases at some point before an asymptotic limit is reached and the LSPR position does not change anymore with increasing thickness. This is explained by the limited distance to which the local electromagnetic field extends from the surface of the silver NP into the coating.27 In this study, the behavior is different indicating that most probably the coating thickness is not increasing linearly with time or that the coating of the NPs inside the CCP plasma is not homogeneous.
In situ FTIR experiments were additionally conducted to differentiate between these options. A quantitative analysis of the infrared absorption spectrum yields atomic Si densities for the absorbing Si–O–Si bonds. The Si–O–Si asymmetric stretching (νAS) vibration in the 1300–900 cm−1 range splits up into four separate lines. The first splitting occurs due to the AS motion of two adjacent oxygen atoms being possible either in-phase (νAS1) or shifted 180° (νAS2). Furthermore, the stretching motion is possible in longitudinal optical (LO) and transversal optical (TO) modes, which are coupled through long-range Coulomb interactions leading to a second splitting.49 The positions and full width half maxima (FWHM) of these lines are fitted following Fidalgo et al.50 and Kirk49 using bounds given in Table 1 (see also Fig. 3 in the ESI†). An example decomposition can be seen as an inset of Fig. 3c.
| Excitation mode |
![[small nu, Greek, macron]](https://www.rsc.org/images/entities/i_char_e0ce.gif) /cm−1 /cm−1 |
σ/cm−1 |
|---|---|---|
| ν AS1 LO | 1208 ± 13 | 40 |
| ν AS2 TO | 1129 ± 12 | 40 |
| ν AS2 LO | 1098 ± 11 | 15 |
| ν AS1 TO | 1025 ± 90 | 50 |
We obtain the absolute concentrations of Si in our observed volume, by further considering the absorption intensities of the Si–O–Si asymmetric stretching modes,51 see Fig. 3d. The reproducibility of the subsequent experiments is similarly good as in the previously described UV-Vis measurements with only one treatment (5 minutes, shown in yellow) showing a slightly delayed onset of the silicon layer growth. This indicates that as the chamber was cleaned using an O2 plasma before the five minute treatment (first treatment of the measurement series), the initial chamber conditions have an influence on the growth rate of the coating. A detailed look at the 10 minute treatment (see Fig. 4), which was done last in the series of experiments, shows that the first 150 seconds of treatment show a higher rate of growth of about 0.23 μmol L−1 s, whereas afterwards a rate of 0.17 μmol L−1 s−1 is measured.
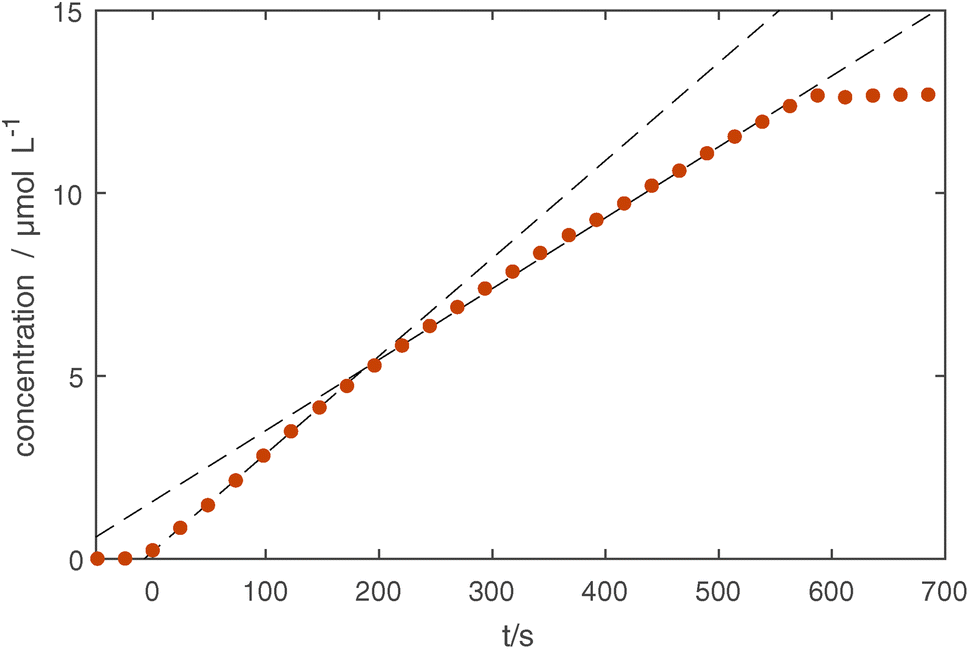 | ||
| Fig. 4 Total concentration of Si determined through fitting the four Si–O–Si stretching modes in the IR spectrum. The growth rate changes after about 150 seconds from 0.23 μmol L−1 s to 0.17 μmol L−1 s and is indicated with dashed lines. | ||
In Fig. 5, the long-term effects of confinement are shown for slightly coated particles, as uncoated Ag particles are not visible in the measured IR spectral range. The measurement shows that after 90 s of coating, some slight increase continues in the first 500 s likely due to residual precursors being used up and some slight effects of the plasma treatment. Afterwards, no further changes are seen. This and supplementary TEM measurements (see Fig. 4 in the ESI†) show that it is possible to confine the particles for tens of minutes without damaging the coating, opening up possibilities for various treatments.
 | ||
| Fig. 5 Prolonged argon plasma treatment of SiO2-coated Ag NPs. The particles have been generated in the GAS and coated using silane injection for 90 s (marked in grey) followed by an hour-long confinement. Gas pressure: 11 Pa, CCP power: 100 W, and argon flow: 30 sccm. | ||
3.3 In situ observation of coating and etching of the coating
Finally, coating and etching experiments have been conducted using both UV-vis and IR monitoring one after the other. In this last section, the reliability of the particle coating and confinement will be shown.Here, Ag NPs were injected into the treatment chamber, coated with SiO2 for 200 s and then etched using H2. Fig. 6 shows the FTIR and UV-vis results of the coating and etching experiments, measuring both the Si–O–Si concentration and LSPR peak position. Looking at the change in the LSPR peak position, a significant red shift is seen due to the coating process in the first 200 s as discussed in the previous section. Similarly, the IR absorption shows a linear increase of Si–O–Si bonds indicating linear growth of SiO2 on the surface. When the SiH4 flow was switched off at 200 s the IR absorption stops increasing except for slight continuing growth while the remaining precursors in the chamber are used up. In contrast, the LSPR shows a continuing red shift albeit at a slower rate than before the SiH4 flow was switched off. At 250 s, H2 gas was injected into the treatment plasma chamber with a flow of 1 sccm. Here, the LSPR peak shows an immediate blue shift due to the H2 etching, with a decreasing rate over time that is also seen in the IR absorption. This indicates that the etching reactions become slower over time, probably due to the decreasing surface area of the particles. When the H2 flow is switched off, the IR absorption stays constant at its new level, while the LSPR peak position shifts towards longer wavelengths.
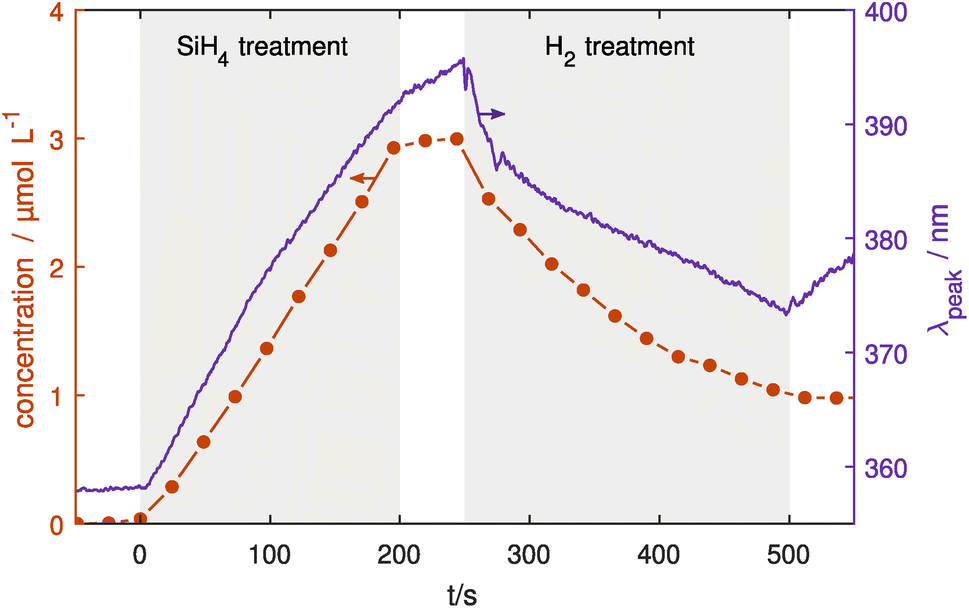 | ||
| Fig. 6 Deposition and etching experiment with SiO2 coated Ag NPs. Ag NPs were injected into the treatment chamber, coated using SiH4 and subsequently etched using H2 (both marked in grey). This procedure was done once with UV-vis measuring the LSPR peak position (right axis) and once with FTIR monitoring measuring the Si–O–Si concentration (left axis). The increase and decrease in coating can be clearly seen in both methods. | ||
While the IR absorption is mainly dependent on the Si–O–Si concentration in the NP shell, the LSPR is also influenced by other particle properties such as charge52 and temperature.53 Changing the gas composition especially with electronegative gasses like SiH4 and H2 can significantly affect the electron density and temperature in the plasma which determines particle charge. Furthermore, it also affects the processes leading to selective particle heating for example through recombination of ions or hydrogen atoms on the particle surface.54 Additional plasma diagnostics would be necessary to separate these effects from the influence of the coating thickness.
3.4 Ex situ TEM and EDX investigations
After the in situ UV-vis and FTIR results were presented, transmission electron microscopy (TEM) and energy-dispersive X-ray spectroscopy (EDX) investigations of the extracted NPs will be discussed to confirm the conclusions reached. Fig. 7a–d show TEM pictures for NPs with different coating times. For coating times up to 5 min the Ag NPs are not homogeneously coated, but SiO2 particles are segregating at the surface of the Ag NPs. For 1 min some NPs seem to be completely uncoated and other NPs are only partially coated. For coating times of 3 and 5 min some NPs seem to be completely coated and others appear to be only partially coated. On the other hand for 10 min coating time, the NPs are homogeneously coated with a coating thickness of around 6 nm. This growth behavior of the coating on the Ag NPs is schematically shown in Fig. 7e–h. | ||
| Fig. 7 TEM micrographs for different coating times. It is visible that the NPs are not homogeneously coated for 1 to 5 min. After 10 min the coating looks homogeneous (a–d). The growth of the coating on the Ag NPs is schematically shown (e–h). Additionally, an EDX map is shown for a sample with a coating time of 10 min, which shows that the particles have an Ag core and a SiOx shell (i–l). | ||
This observation supports our claims in the in situ UV-vis and FTIR measurements, where at around 150 s several changes of optical properties were observed, indicating the closure of a previously inhomogeneous coating. There are many possible explanations for this initial inhomogeneity, one of which are different reaction cross sections for the primary attachment of SiO2 on the Ag surface, the SiO2 growth along the interface between uncoated and coated Ag surfaces, and the surface growth on top of a Si layer. This could lead to different growth mechanisms becoming energetically favorable over time and cause an inhomogeneous initial growth (so-called island growth mechanism). With our novel setup capable of confining the NPs for hours, the longer treatment times necessary to reach a well-defined homogeneous coating are easily possible.
While the NPs are seen as agglomerates on the TEM images, the particles have been scratched off the Si substrates and were transferred onto TEM grids. This procedure is known to cause particle agglomerations. Yet, particle agglomerates were also seen on SEM images (see Fig. 2 in the ESI†), which makes it unclear whether this agglomeration already occurred during confinement in the plasma, as possibly indicated by the coupling of LSPRs seen in an absorption shoulder at higher wavelengths described in an earlier section.
To analyze the coating composition, EDX measurements were performed on the samples. A STEM high angle annular dark field micrograph and the corresponding elemental EDX maps can be seen in Fig. 7i–l. The Ag core and surrounding shell out of Si and O are very well visible. To give a statistically relevant impression of the Si concentration in the samples, multiple TEM EDX spectra were acquired from samples with coating times 1, 3, 5 and 10 min. The exact stoichiometry was not shown because SiOx was most probably further oxidized as the samples were in contact with air. Nevertheless, the atomic concentrations of Ag and Si were measured, and are shown in Fig. 8. The Si concentration increases steeper from 1 min to 3 min in comparison to the slope from 3 min to 10 min. This is in agreement with the in situ FTIR and UV-vis measurements, where different slopes were found from 0 s to 150 s in comparison to 150 s to 600 s.
 | ||
| Fig. 8 Atomic concentration of Si measured with EDX during TEM measurements for extracted Ag@SiO2 NPs with different coating times. Ten different areas of the TEM grid were used for statistical analysis. Only silver and silicon were taken into account to minimize the influence of oxidation after extraction and the background carbon support on the TEM grid. | ||
4 Conclusions
In this work, we have presented a setup capable of confining nanoparticles over very long time scales, which allows a high degree of freedom in the coating process with an additional high degree of process control through in situ diagnostics. This has been demonstrated by creating Ag@SiO2 core–shell NPs for functional applications. Using a Haberland-type GAS, Ag NPs with diameters between 5 and 60 nm have been prepared and subsequently confined in a secondary RF plasma for further plasma treatment. Both UV-vis and FTIR spectroscopy diagnostics have been shown to measure the growth of the SiO2 shell very sensitively, allowing for fine tuning of the particle properties towards a specific application. For UV-vis, a red shift of the LSPR peak as well as an increase of its absorption strength was observed increasing with the shell size. Similarly, in the FTIR spectrum, the addition of Si–O–Si on the NP surface is seen as an increase in vibrational absorption of lines in the region from 1300–950 cm−1. These findings have been confirmed using ex situ TEM and EDX analysis, showing a partial surface coverage for short coating times with a full shell forming after about 5 min. The homogeneity of the coating process could be improved by varying the parameters of the treatment plasma such as plasma power. Here, further particle number density measurements, e.g. by using extinction measurements, are necessary to differentiate between changes in the plasma environment and the coating process.As GASs are very versatile nanoparticle sources, different metal types, alloys, inorganic compounds, and even polymers can be used as a target to create NPs of various materials. It was shown that it is possible to coat NPs and confine them over an hour without any significant losses of NPs from the treatment plasma. The limits of the confining plasma are only reached when NPs grow to sizes on the micrometer scale, where the gravitational force becomes relevant as it scales with ∝ r3 and pushes particles into the lower sheath of the plasma. Our setup overcomes the limitations of in-flight coating and enables various forms of treatment even in multi-step processes demonstrated here through the controlled growth and subsequent etching of an applied coating. This opens up many possibilities for finely tuned particle preparation even of complex core–shell nanoparticles with multiple shells for future applications. One can even imagine creating NPs with a shell with a compositional gradient consisting of different materials, simply by adjusting the reactive gas injection accordingly.
Conflicts of interest
There are no conflicts to declare.Acknowledgements
The authors thank the German Research Foundation (DFG, project 411452476, and project KI 1263/21-1) for financial support. We also thank the German Academic Exchange Service (DAAD) for the support through the project 57449433.Notes and references
- M. Z. Ghori, J. Adam, O. C. Aktas, S. Veziroglu, B. B. Shurtleff, T. Strunskus, F. Faupel, O. Polonskyi and A. Hinz, ACS Appl. Nano Mater., 2018, 1, 3760–3764 CrossRef CAS.
- S. Veziroglu, M. Z. Ghori, A. L. Obermann, K. Röder, O. Polonskyi, T. Strunskus, F. Faupel and O. C. Aktas, Phys. Status Solidi A, 2019, 216, 1–6 Search PubMed.
- S. Veziroglu, M. Ullrich, M. Hussain, J. Drewes, J. Shondo, T. Strunskus, J. Adam, F. Faupel and O. Cenk, Surf. Coat. Technol., 2020, 389, 125613 CrossRef CAS.
- A. Vahl, S. Veziroglu, B. Henkel, T. Strunskus, O. Polonskyi, O. C. Aktas and F. Faupel, Materials (Basel)., 2019, 12, 2840 CrossRef CAS PubMed.
- H. Li, Z. Li, Y. Yu, Y. Ma, W. Yang, F. Wang, X. Yin and X. Wang, J. Phys. Chem. C, 2017, 121, 12071–12079 CrossRef CAS.
- C. Minnai, M. Di Vece and P. Milani, Nanotechnology, 2017, 28, 0–8 CrossRef CAS PubMed.
- C. Minnai, A. Bellacicca, S. A. Brown and P. Milani, Sci. Rep., 2017, 7, 1–8 CrossRef CAS PubMed.
- M. Mirigliano, D. Decastri, A. Pullia, D. Dellasega, A. Casu, A. Falqui and P. Milani, Nanotechnology, 2020, 31, 234001 CrossRef CAS PubMed.
- M. Mirigliano, F. Borghi, A. Podestà, A. Antidormi, L. Colombo and P. Milani, Nanoscale Adv., 2019, 1, 3119–3130 RSC.
- Z. Wang, S. Joshi, S. E. Savel’ev, H. Jiang, R. Midya, P. Lin, M. Hu, N. Ge, J. P. Strachan, Z. Li, Q. Wu, M. Barnell, G. L. Li, H. L. Xin, R. S. Williams, Q. Xia and J. J. Yang, Nat. Mater., 2017, 16, 101–108 CrossRef CAS PubMed.
- H. Jiang, D. Belkin, S. E. Savel’ev, S. Lin, Z. Wang, Y. Li, S. Joshi, R. Midya, C. Li, M. Rao, M. Barnell, Q. Wu, J. J. Yang and Q. Xia, Nat. Commun., 2017, 8, 882 CrossRef PubMed.
- X. B. Yan, J. H. Zhao, S. Liu, Z. Y. Zhou, Q. Liu, J. S. Chen and X. Y. Liu, Adv. Funct. Mater., 2018, 28, 1–9 Search PubMed.
- A. Vahl, N. Carstens, T. Strunskus, F. Faupel and A. Hassanien, Sci. Rep., 2019, 9(1), 17367 CrossRef PubMed.
- V. Postica, A. Vahl, D. Santos-Carballal, T. Dankwort, L. Kienle, M. Hoppe, A. Cadi-Essadek, N. H. De Leeuw, M. I. Terasa, R. Adelung, F. Faupel and O. Lupan, ACS Appl. Mater. Interfaces, 2019, 11, 31452–31466 CrossRef CAS PubMed.
- Y. Yong, C. Li, X. Li, T. Li, H. Cui and S. Lv, J. Phys. Chem. C, 2015, 119, 7534–7540 CrossRef CAS.
- S. W. Choi, A. Katoch, G. J. Sun and S. S. Kim, Sens. Actuators, B, 2013, 181, 446–453 CrossRef CAS.
- F. Fan, J. Zhang, J. Li, N. Zhang, R. R. Hong, X. Deng, P. Tang and D. Li, Sens. Actuators, B, 2017, 241, 895–903 CrossRef CAS.
- K. Hassan and G. S. Chung, Sens. Actuators, B, 2017, 239, 824–833 CrossRef CAS.
- S. Enoch, B. Nicolas, A. Adibi, T. W. Hänsch, F. Krausz, B. A. J. Monemar, H. Venghaus, H. Weber and H. Weinfurter, Plasmonics, Springer Berlin Heidelberg, Berlin, Heidelberg, 2012, vol. 167 Search PubMed.
- H. X. Xu, E. J. Bjerneld, M. Käll and L. Börjesson, Phys. Rev. Lett., 1999, 83, 4357–4360 CrossRef CAS.
- H. A. Atwater and A. Polman, Nat. Mater., 2010, 9, 865 CrossRef CAS.
- N. Perdana, J. Drewes, F. Pohl, A. Vahl, T. Strunskus, M. Elbahri, C. Rockstuhl and F. Faupel, Micro Nano Eng., 2022, 16, 100154 CrossRef CAS.
- V. Zaporojtchenko, R. Podschun, U. Schürmann, A. Kulkarni and F. Faupel, Nanotechnology, 2006, 17, 4904–4908 CrossRef CAS.
- N. Alissawi, V. Zaporojtchenko, T. Strunskus, T. Hrkac, I. Kocabas, B. Erkartal, V. S. K. Chakravadhanula, L. Kienle, G. Grundmeier, D. Garbe-Schönberg and F. Faupel, J. Nanopart. Res., 2012, 14, 928 CrossRef.
- C. Damm and H. Münstedt, Appl. Phys. A: Mater. Sci. Process., 2008, 91, 479–486 CrossRef CAS.
- C. Damm, H. Münstedt and A. Rösch, J. Mater. Sci., 2007, 42, 6067–6073 CrossRef CAS.
- D. D. Evanoff, R. L. White and G. Chumanov, J. Phys. Chem. B, 2004, 108, 1522–1524 CrossRef CAS.
- P. K. Jain and M. A. El-Sayed, Chem. Phys. Lett., 2010, 487, 153–164 CrossRef CAS.
- M. Lismont, C. A. Páez and L. Dreesen, J. Colloid Interface Sci., 2015, 447, 40–49 CrossRef CAS PubMed.
- J. Alimunnisa, K. Ravichandran and K. S. Meena, J. Mol. Liq., 2017, 231, 281–287 CrossRef CAS.
- X.-F. Zhang, Z.-G. Liu, W. Shen and S. Gurunathan, Int. J. Mol. Sci., 2016, 17, 1534 CrossRef PubMed.
- W. Stöber, A. Fink and E. Bohn, J. Colloid Interface Sci., 1968, 26, 62–69 CrossRef.
- H. Haberland, M. Karrais, M. Mall and Y. Thurner, J. Vac. Sci. Technol., A, 1992, 10, 3266–3271 CrossRef CAS.
- Y. Huttel, L. Martínez, A. Mayoral and I. Fernández, MRS Commun., 2018, 8, 947–954 CrossRef CAS PubMed.
- A. M. Ahadi, H. Libenská, T. Košutová, M. Cieslar, V. Červenková, D. Prokop, M. Dopita, H. Biederman and J. Hanuš, J. Phys. D: Appl. Phys., 2022, 55, 215201 CrossRef.
- O. Kylián, R. Štefaníková, A. Kuzminova, J. Hanuš, P. Solař, P. Kúš, M. Cieslar and H. Biederman, Plasma Phys. Controlled Fusion, 2020, 62, 014005 CrossRef.
- P. Solař, J. Kousal, J. Hanuš, K. Škorvánková, A. Kuzminova and O. Kylián, Sci. Rep., 2021, 11(1), 6415 CrossRef PubMed.
- O. H. Asnaz, N. Kohlmann, H. Folger, F. Greiner and J. Benedikt, Plasma Processes Polym., 2022, e2100190 CrossRef.
- G. Xu, M. Tazawa, P. Jin and S. Nakao, Appl. Phys. A: Mater. Sci. Process., 2005, 80, 1535–1540 CrossRef CAS.
- J. J. Mock, M. Barbic, D. R. Smith, D. A. Schultz and S. Schultz, J. Chem. Phys., 2002, 116, 6755–6759 CrossRef CAS.
- J. Drewes, S. Ali-Ogly, T. Strunskus, O. Polonskyi, H. Biederman, F. Faupel and V. Alexander, Plasma Processes Polym., 2021, 19, 2100125 CrossRef.
- N. G. Bastús, J. Piella and V. Puntes, Langmuir, 2016, 32, 290–300 CrossRef PubMed.
- H. Shen, G. Lu, T. Zhang, J. Liu, Y. Gu, P. Perriat, M. Martini, O. Tillement and Q. Gong, Nanotechnology, 2013, 24, 285502 CrossRef PubMed.
- S. J. Oldenburg, PhD. thesis, Rice Univ., Houston, TX, USA, 2000.
- O. Havnes, C. K. Goertz, G. E. Morfill, E. Grün and W. Ip, J. Geophys. Res., 1987, 92, 2281 CrossRef.
- A. Petersen, O. H. Asnaz, B. Tadsen and F. Greiner, Commun. Phys., 2022, 5, 308 CrossRef.
- C. B. Fleddermann, J. H. Beberman, J. T. Verdeyen, C. B. Fledderman, J. H. Beberman, G. Hebner, L. J. Overzet and J. T. Verdeyen, J. Appl. Phys., 1985, 58, 1344–1348 CrossRef CAS.
- D. Nelli, M. Cerbelaud, R. Ferrando and C. Minnai, Nanoscale Adv., 2021, 3, 836–846 RSC.
- C. T. Kirk, Phys. Rev. B, 1988, 38, 1255 CrossRef CAS PubMed.
- A. Fidalgo and L. M. Ilharco, J. Non-Cryst. Solids, 2001, 283, 144–154 CrossRef CAS.
- A. Zamchiy, E. Baranov, I. Merkulova, S. Khmel and E. Maximovskiy, J. Non-Cryst. Solids, 2019, 518, 43–50 CrossRef CAS.
- M. Zapata Herrera, J. Aizpurua, A. K. Kazansky and A. G. Borisov, Langmuir, 2016, 32, 2829–2840 CrossRef CAS PubMed.
- O. A. Yeshchenko, I. M. Dmitruk, A. A. Alexeenko, A. V. Kotko, J. Verdal and A. O. Pinchuk, Plasmonics, 2012, 7, 685–694 CrossRef CAS.
- L. Mangolini and U. Kortshagen, Phys. Rev. E: Stat., Nonlinear, Soft Matter Phys., 2009, 79, 1–8 CrossRef PubMed.
Footnotes |
| † Electronic supplementary information (ESI) available. See DOI: https://doi.org/10.1039/d2na00806h |
| ‡ These authors contributed equally to this work. |
| § Currently at: Department of Chemical Engineering, Engineering II, University of California–Santa Barbara, Santa Barbara, CA 93106, United States. |
| This journal is © The Royal Society of Chemistry 2023 |