
High temporal resolution transparent thermoelectric temperature sensors for photothermal effect sensing†
Junhee
Lee‡
 a,
Seongkwon
Hwang‡
bc,
Nari
Hong‡
a,
Jeonghun
Kwak
c,
Jae Eun
Jang
a,
Seungjun
Chung
*bd and
Hongki
Kang
*a
a,
Seongkwon
Hwang‡
bc,
Nari
Hong‡
a,
Jeonghun
Kwak
c,
Jae Eun
Jang
a,
Seungjun
Chung
*bd and
Hongki
Kang
*a
aDepartment of Electrical Engineering and Computer Science, Daegu Gyeongbuk Institute of Science and Technology (DGIST), Daegu 42988, Republic of Korea. E-mail: hkang@dgist.ac.kr
bSoft Hybrid Materials Research Center, Korea Institute of Science and Technology, Seoul 02792, Korea. E-mail: seungjun@kist.re.kr
cDepartment of Electrical and Computer Engineering, Inter-University Semiconductor Research Center (ISRC), and Soft Foundry Institute, Seoul National University, Seoul 08826, Korea
dKHU-KIST Department of Converging Science and Technology, Kyung Hee University, Seoul, 02447, Korea
First published on 18th October 2022
Abstract
We propose inkjet-printed high-speed and transparent temperature sensors based on the thermoelectric effect for direct monitoring of the photothermal effect. They consist of highly transparent organic thermoelectric materials that allow excellent biocompatibility and sub-ms temporal resolution, simultaneously. Our transparent thermoelectric temperature sensors can be used to advance various photothermal biomedical applications.
New conceptsWe propose a new concept of using a thermoelectric temperature sensor for the direct measurement of the photothermal effect for the first time. The photothermal effect has been actively adopted in various biomedical applications from cancer therapy to neuromodulation using a variety of plasmonic nanomaterials. Accurate measurement of the fast-changing local temperature by the photothermal effect is imperative to understand the temperature-dependent biological behaviors and to execute the new biomedical engineering technologies within the safety guidelines. However, previous temperature sensors have not been able to capture the temperature changes directly due to poor transparency and slow responses. Therefore, despite its popularity, the photothermal effect analysis has only relied on either indirect measurement or computational analysis. We demonstrate that biocompatible polymer thermoelectric materials are optimized to achieve transparency to become insensitive to laser irradiation for direct photothermal effect sensing while maintaining high thermoelectric temperature sensitivity. With the fundamentally fast response of the thermoelectric effect, we successfully demonstrate that the direct photothermal effect can be monitored at high speed (μs resolution). With these unprecedented performances, we strongly believe that the new concept of our temperature sensors can help to understand interesting phenomena at the intersection of photothermal nanomaterials and biological systems. |
Introduction
Exploiting the photothermal effect using plasmonic nanomaterials has been suggested for various biomedical engineering, chemical engineering, and microfabricated device applications.1–7 The photothermal effect provides unique heat generation characteristics compared with other conventional heat generation methods such as Joule heating based on micro heaters. Because the absorbed optical energy from a light source is converted to thermal energy by the plasmonic nanomaterials, the thermal effect can be highly localized down to sub-micron spatial resolution. The thermal effect is wirelessly controlled by the illuminated light, enhancing spatial selectivity. The introduction of various plasmonic nanomaterials also enables the photothermal effect to be wavelength selective, expanding the selectivity over a wide range of wavelengths. In addition, the plasmonic photothermal heating and cooling have been reported to be as fast as a nanosecond in nanomaterials, and the resultant environment heating is on a sub-ms time scale.8,9 With the benefits of high spatiotemporal resolution wireless heating, the photothermal effect is reported to be particularly useful for various biomedical engineering applications such as neuromodulation, photothermal therapy, photothermal polymerase chain reaction (PCR), retina function restoration, and photothermal drug delivery.10–19 For example, a few ms long laser pulses can induce excitatory stimulation of neuronal cells by depolarizing the transmembrane potential.20 On the other hand, 20 ms or longer pulses have been reported to cause inhibitory stimulation of neuronal cells.21 To understand the underlying mechanism, therefore, it is important to monitor precise temperature changes at high temporal resolution and within close proximity.Despite numerous experimental validations of the efficacy of the plasmonic photothermal effect across various applications, it is still challenging to precisely monitor the temperature change by the photothermal effect, especially in high temporal resolution at a short distance. For example, resistance temperature detectors (RTDs) made of transparent electrodes compatible with the illuminated light can be utilized, but the operation of RTDs is typically slow, on a scale of tens of ms, and can cause undesirable self-heating behaviors. High-speed diodes have been suggested for high temporal resolution temperature sensing, but their limited transparency hinders direct integration with the photothermal effect.22 Alternatively, the resistance change of a biological medium has been measured using a bulky glass pipette to anticipate the photothermal effect in the sub-ms time domain.23 However, due to the large size of the sensor and the instrumentation configuration, it is difficult to measure local temperature near the cells of interest or to configure a microarray of the temperature sensors. Therefore, it is necessary to develop highly transparent, high-speed temperature sensing micro-devices with biocompatible materials for photothermal bioengineering applications.
Exploiting the thermoelectric (TE) effect is an attractive strategy to measure localized thermal energy with a high temporal resolution. Specifically, the Seebeck effect, where an electric potential can be built by a temperature gradient across the TE legs,24,25 allows estimation of the localized heat by measuring the generated voltage between the TE legs at a sub-ms resolution. The Seebeck coefficient (S), which is a measure of the magnitude of induced TE voltage in response to a temperature difference, is expressed by S = −ΔV/ΔT where ΔV and ΔT respectively denote the TE voltage and temperature difference between the two ends of the TE material (Fig. S1 in the ESI†). However, there are critical limitations in the usage of intrinsically toxic inorganic TE materials, such as bismuth telluride and lead telluride alloys, for bioengineering applications. In addition, their brittle nature has been a bottleneck to their use in a wide range of deformable applications. The development of biocompatible organic TE devices is therefore highly desirable. Poly(3,4-ethylenedioxythiophene)polystyrene sulfonate (PEDOT:PSS) is one of the most promising candidates as a TE material satisfying these demands owing to its high Seebeck coefficient, biocompatibility, mechanical flexibility, and solution processability.26,27 Outstanding transmittance in the visible light spectrum can also be achieved if the thickness of the PEDOT:PSS film is approximately 50 nm, which is an advantage to deliver irradiated light for the photothermal effect through the TE legs. Moreover, low-temperature inkjet printing allows the realization of transparent PEDOT:PSS onto flexible substrates with a high degree of design freedom without complicated patterning processes.
In this work, we develop transparent TE temperature sensors with biocompatible polymers for a high-speed photothermal effect analysis in proximity. We use inkjet-printed PEDOT:PSS as a TE material that transduces the photothermally induced temperature changes to voltage differences with sub-ms time resolution. The printed TE layer is optimized to achieve high optical transmittance (>95%) from 380 nm to 850 nm, which is minimally affected by irradiated light such as near-infrared light for photothermal effect generation. Our transparent TE temperature sensor can measure photothermally induced temperature changes in sub-micrometer proximity to the sensor with sub-ms time resolution. The TE temperature sensor is sufficiently highly transparent to conduct optical imaging and neural signal recording, such as calcium imaging. We also demonstrate that the biocompatible TE temperature sensors on a flexible substrate are suitable for wearable or implantable biomedical applications.
Results and discussion
PEDOT:PSS transparent thermoelectric temperature sensors
Fig. 1a illustrates the concept and design of our transparent temperature sensors based on the TE response (layers 1 and 2) and the proposed implementation of the photothermal effect (layers 3 and 4) for testing the temperature sensing capability. In contrast with previously reported temperature monitoring using opaque inorganic sensors, PEDOT:PSS-based ultra-thin TE sensors show high transparency in the visible light spectrum, which facilitates light travel through PEDOT:PSS films for inducing the photothermal effect and bio-imaging. To fabricate TE sensors on a biocompatible and flexible polymer substrate, 100 μm-thick parylene C, low-temperature inkjet printing was employed to deposit the PEDOT:PSS TE legs and electrodes. The inkjet printing conditions such as a pulse waveform, substrate temperature, drop spacing, and jetting frequency were carefully optimized for well-defined PEDOT:PSS droplets in flight and uniformly printed PEDOT:PSS films (Fig. S2a and b in the ESI†). Note that the minimum width of PEDOT:PSS legs of 35 μm was achieved without undesirable edge-waviness after conducting UV/ozone surface treatments (Fig. S2c and d in the ESI†). Because the transparency and the sheet resistance of inkjet-printed PEDOT:PSS films were adjustable with different numbers of printing passes, as shown in Fig. 1b, 1-pass and 8-pass inkjet printing were conducted for TE legs and electrodes, respectively. The 1-pass and 8-pass printed PEDOT:PSS layers showed an average transmittance of 97% and 80% in the visible light spectrum (Fig. 1c) and sheet resistance of 315.6 and 38.62 Ω sq−1 (Fig. 1d), respectively. Interestingly, the Seebeck coefficient, which is the most critical parameter to determine the TE effect, was not dependent on the thickness of the inkjet-printed PEDOT:PSS layers, exhibiting a value of 10.07 ± 0.94 μV K−1 (Fig. 1d). The electrical conductivity, Seebeck coefficient, sheet resistance, and transmittance of the inkjet-printed PEDOT:PSS films with different thicknesses are summarized in Table S1 (ESI†). The temperature sensitivity of the 50 nm-thick inkjet-printed PEDOT:PSS legs also showed good linearity over a range of temperature changes (ΔT) from 0.2 K to 40 K, indicating the minimum sensing resolution and maximum operating temperature of our TE sensors, respectively (Fig. 1e). Herein, we used 1-pass printed PEDOT:PSS film as the transparent TE layer and 8-pass printed PEDOT:PSS films as the electrodes connected to both sides of the TE layer.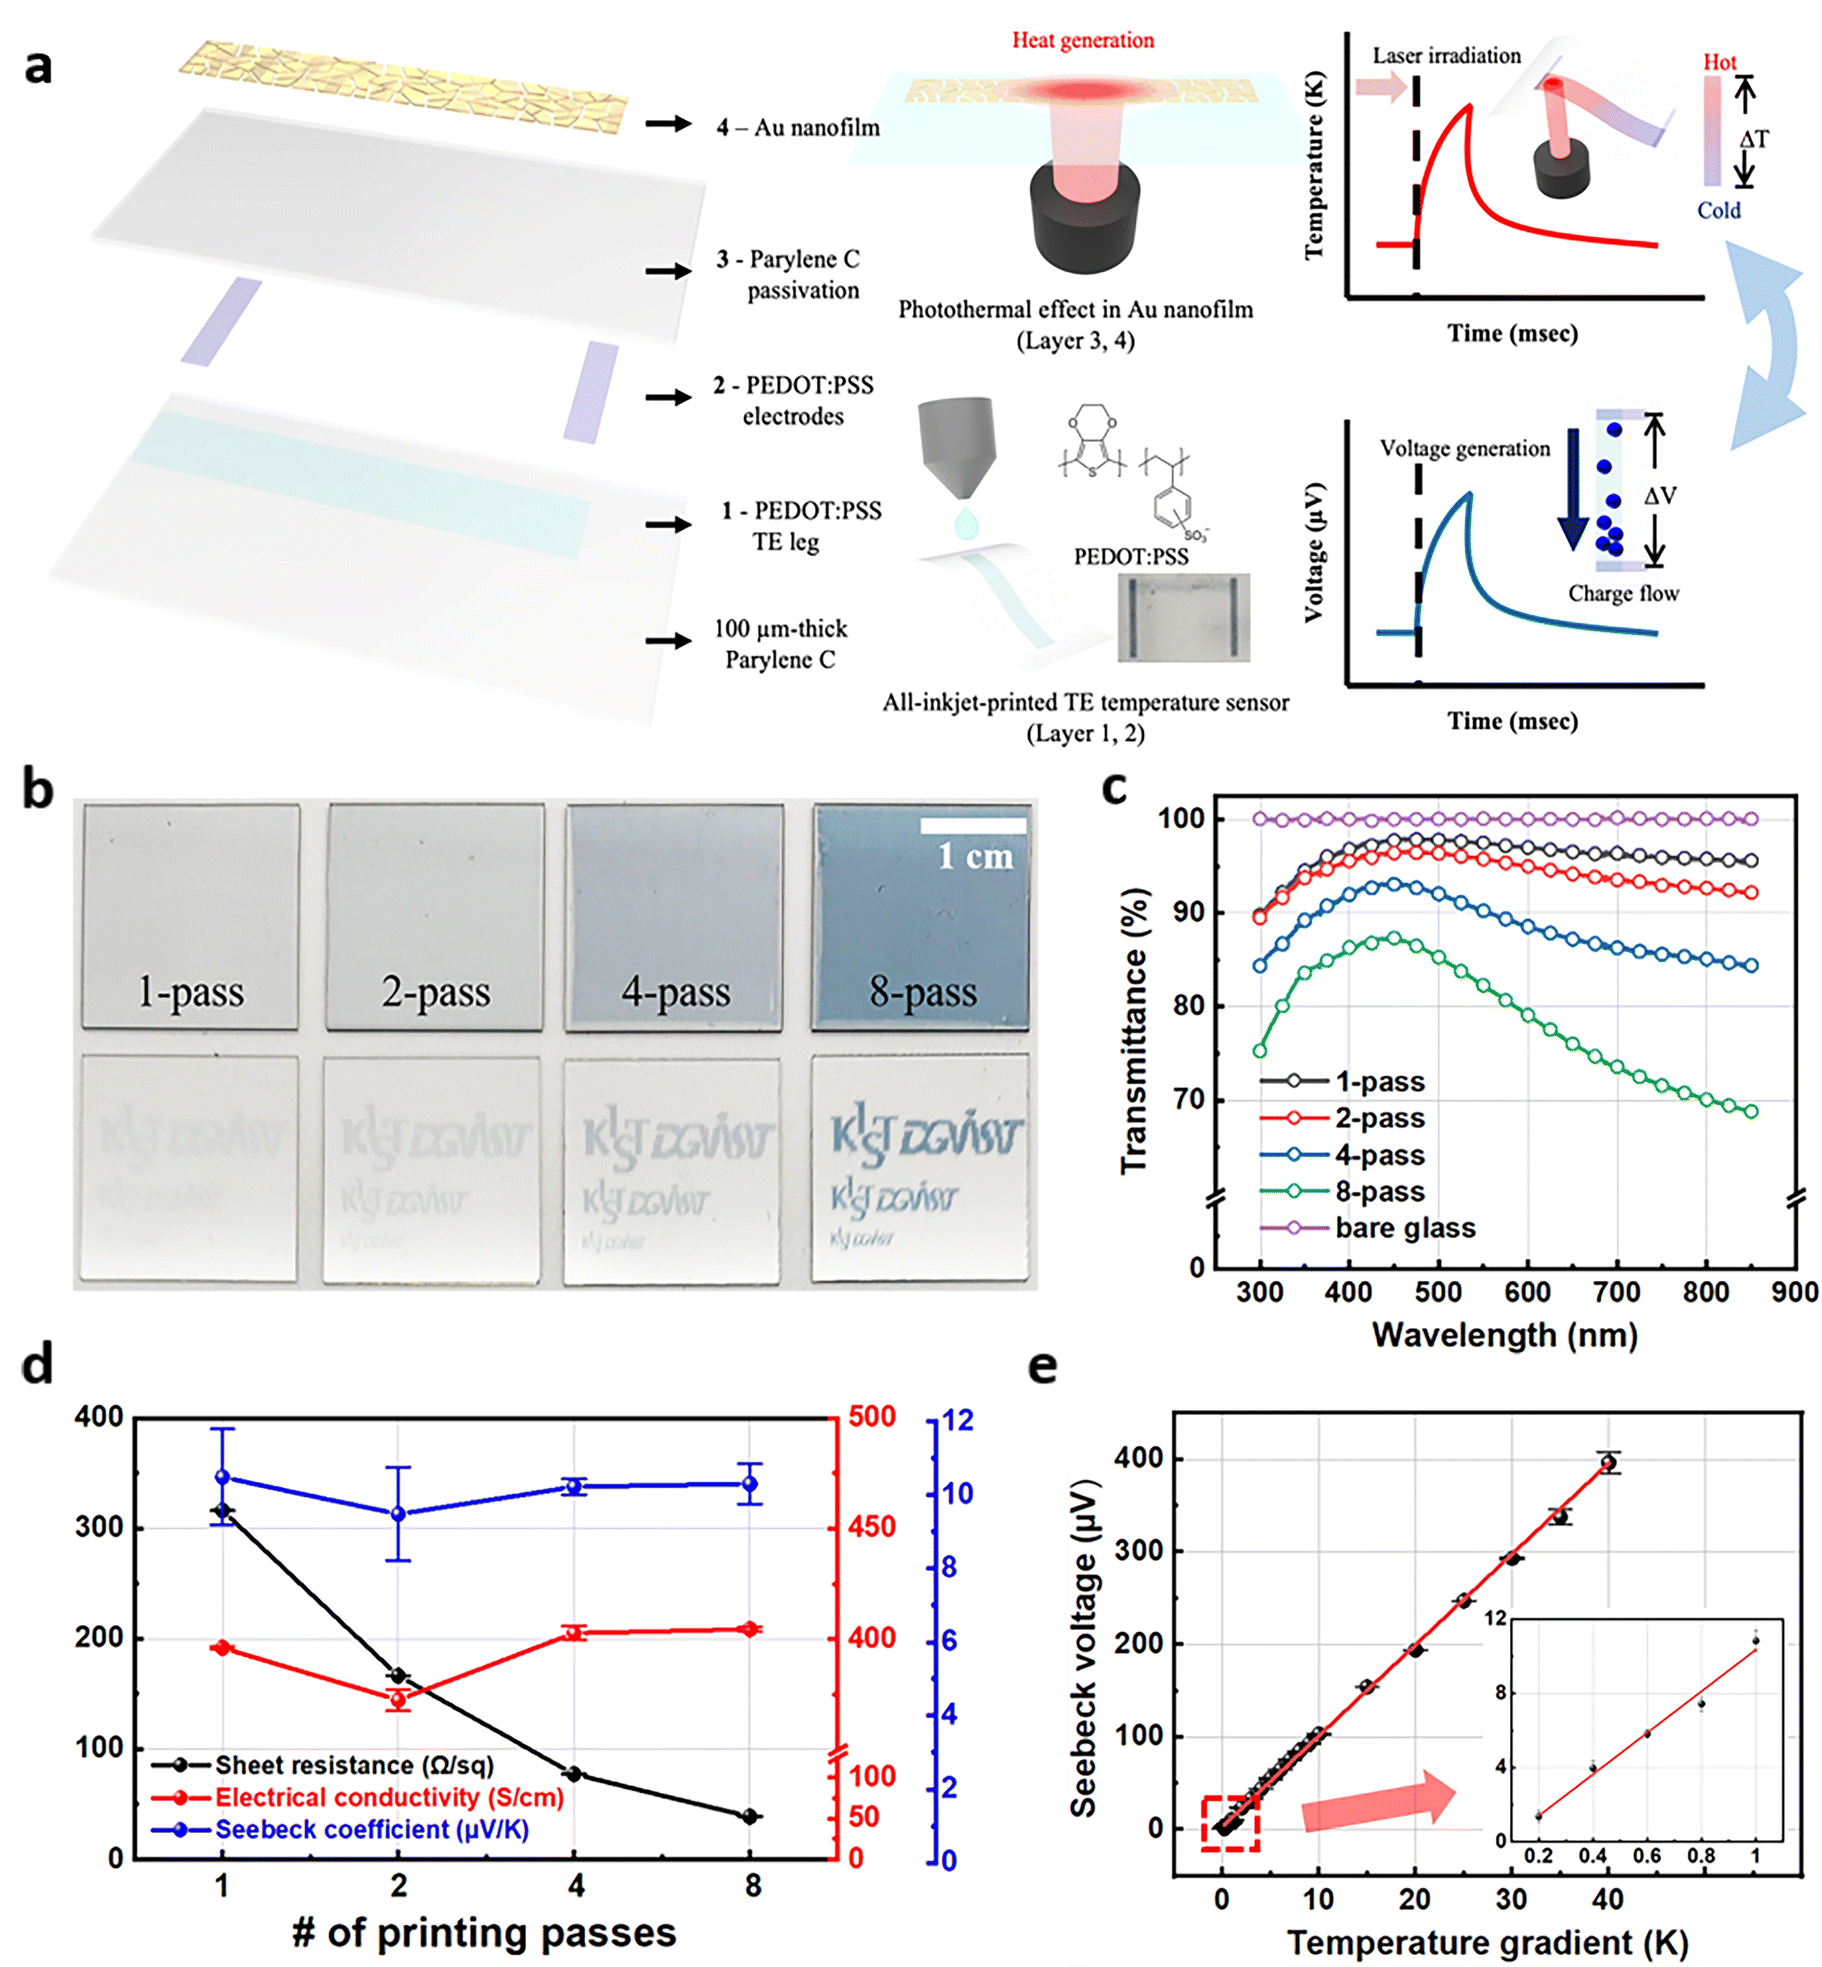 | ||
| Fig. 1 Inkjet-printed TE transparent temperature sensors: (a) Conceptual illustration of high temporal resolution of the all-inkjet-printed TE transparent temperature sensor and its application to photothermal effect sensing. The TE temperature sensor is composed of PEDOT:PSS layers 1 and 2. Layer 4 (Au nanofilm) represents a thermoplasmonic Au layer to induce the photothermal effect. Layer 3 (parylene C) is for physical separation between the TE sensor and the thermoplasmonic Au layer. Illustrations on the middle represent how the TE sensor is fabricated, and how the photothermal effect is induced by light. Resultant signal changes (Seebeck voltages and temperature) are also illustrated on the right. (b) Photographs of inkjet-printed PEDOT:PSS films and patterns with different printing passes (scale bar: 1 cm). (c) Transmittance spectra and (d) measured sheet resistance, electrical conductivity and Seebeck coefficient of PEDOT:PSS films with different printing passes. (e) Experimentally measured TE performance of inkjet-printed PEDOT:PSS legs and its linear fitted value in ΔT ranging from 0.2 K to 40 K. | ||
Photothermal effect sensing using the thermoelectric temperature sensor
We first optimized the operation of the TE temperature sensor for maximum photothermal effect sensitivity. The TE temperature sensor consisted of a 50 nm-thick inkjet-printed PEDOT:PSS (7 mm × 1 mm) TE leg and silver electrodes fabricated on glass substrates, as shown in Fig. 2a. Note that the 1-pass printed PEDOT:PSS and inkjet-printed silver were used as p-type thermoelectric leg and highly conductive electrodes, respectively. In addition, because the PEDOT:PSS films were deposited by inkjet printing maintaining a distance between a nozzle and a substrate, it was difficult to align polymers via shear force. To implement the photothermal effect near the sensor, we integrated a photothermal layer onto the TE temperature sensors as follows. A 500 nm-thick parylene C film was deposited onto the top of the TE temperature sensor for passivation. A thermally evaporated 5 nm-thick plasmonic gold nanofilm was then deposited onto the parylene C layer (Fig. 1a). The plasmonic gold nanofilm at 5 nm thickness is known to absorb near-infrared (NIR) light to generate the efficient photothermal effect.28 We then irradiated the photothermal gold layer via an NIR laser (785 nm, spot size: 1 mm) transmitting through the transparent PEDOT:PSS layer, as illustrated in Fig. 2a. While the irradiation position of the 1 s laser pulse was moved along the TE layer from the edge to the center (from position 1 to 4), we recorded the Seebeck voltage across the TE layer at a 25 kHz sampling rate after 10 kHz low-pass filtering for noise reduction, and the maximum temperature values in the ROIs (white circles in the thermographic images on the right) with a diameter about 2 mm centered on the laser-irradiated spot using a thermographic camera (Fig. 2a). Note that consistent temperature changes were observed over a whole region of the plasmonic gold nanofilm via the photothermal effect (Fig. 2b). However, the Seebeck voltages generated via the temperature gradient across the PEDOT:PSS TE layer were strongly dependent upon the relative position of the irradiation, exhibiting maximized Seebeck voltage when the NIR laser was irradiated at the edge of the TE layer (position 1) due to the maximum temperature gradient, as shown in Fig. 2b. Also, the waveform of the voltage change was nearly identical to the waveform of the temperature change, which was simultaneously observed by the thermographic camera (Fig. 2c). However, as the irradiation position moved toward the center (towards position 4), the generated Seebeck voltage was significantly reduced. These results indicated that the optimum operating conditions of the TE temperature sensor entails placing the photothermal effect of interest near the edge of the TE layer to secure the maximum temperature gradient (i.e., ΔT). Using the optimized operation principle of the photothermal effect sensing, we characterized the sensitivity of the temperature sensor. By comparing the observed temperature change with the recorded voltage change upon a 1 s NIR laser pulse, we found that the generated Seebeck voltage is linearly proportional to the temperature change, exhibiting temperature sensitivity of 3.19 μV K−1 with good linearity in a range of temperature change from 0.2 K to 40 K (Fig. 2d). The recorded baseline rms (root-mean-square) voltage noise was 0.52 μV, corresponding to the limit of detection (LoD) of 0.49 °C, which is compatible with various biomedical engineering applications. Note that the baseline output voltage noise of the TE temperature sensor is dominated by the thermal noise of the resistance of the TE layer (R: 10.2 kΩ).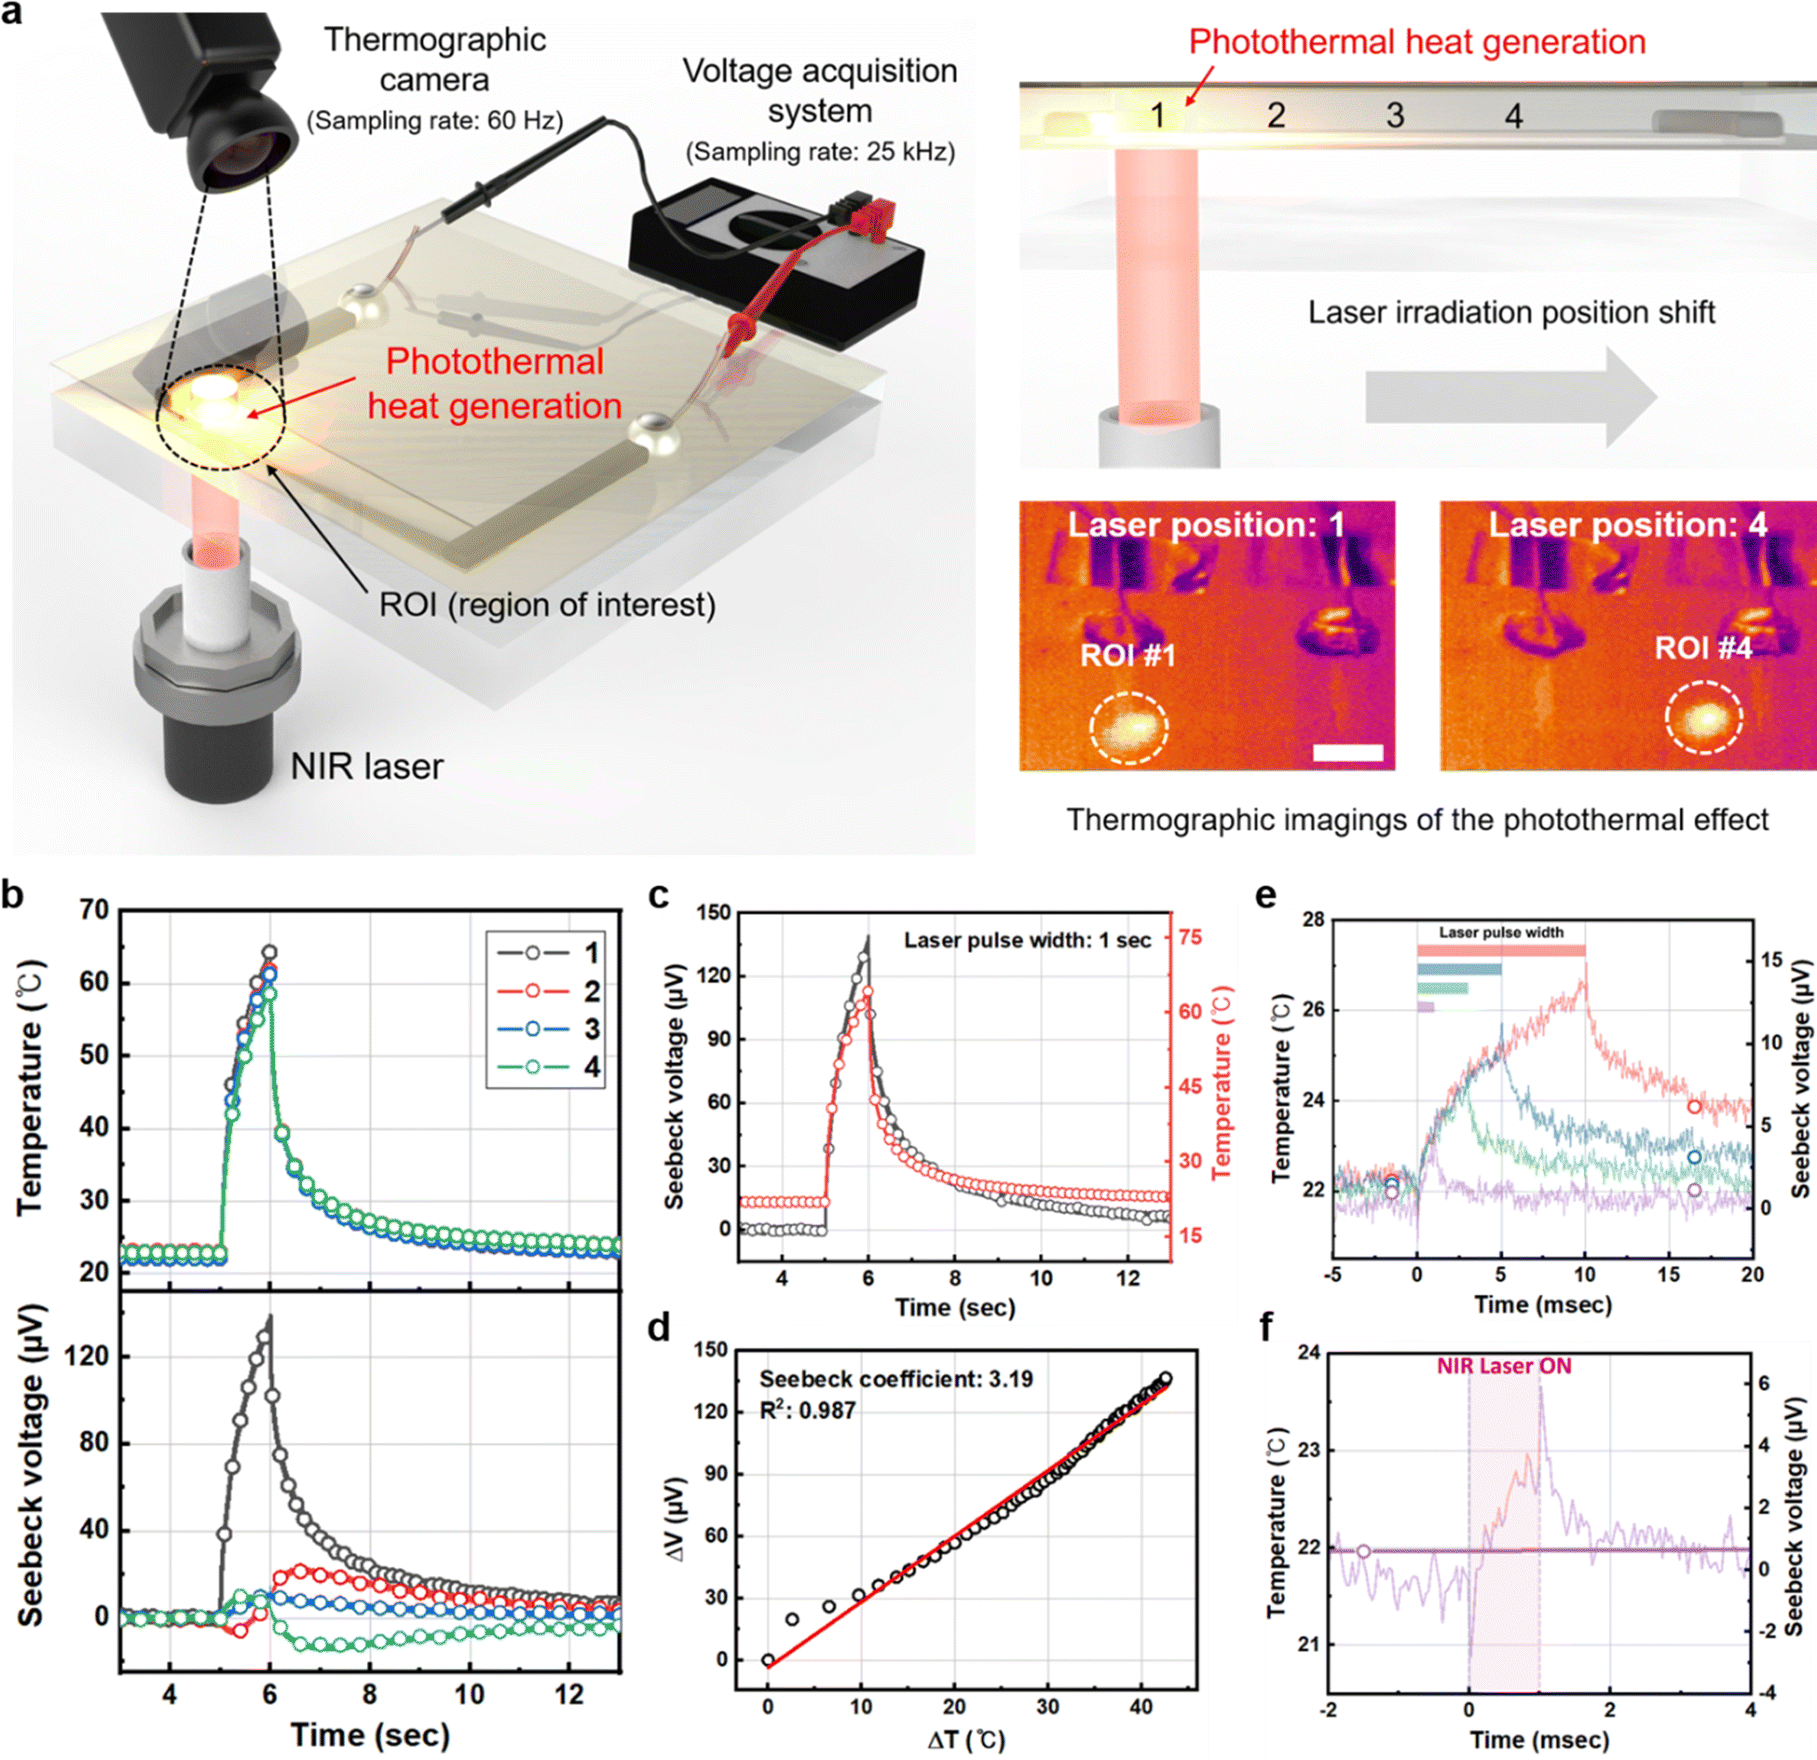 | ||
| Fig. 2 Optimization of the photothermal effect sensing: (a) Schematic of the photothermal effect implementation and sensing using the PEDOT:PSS TE temperature sensor by irradiation of the NIR laser. The laser irradiation spot position is shifted from one end of the TE layer to the center. Simultaneously, Seebeck voltage across the TE layer is recorded using a voltage signal acquisition system, and the maximum temperature value is recorded by a thermographic IR camera in the ROIs (white circles in the thermographic images on the right), as illustrated (scale bar: 2 mm). (b) Temperature (top) and voltage (bottom) changes with various positions of the irradiated laser spot upon 1 s long laser irradiation from Time = 5 s. (c) The overlaid transient characteristics of the temperature and voltage changes upon 1 s long photothermal effect. (d) The TE characteristics of the TE temperature sensor upon the photothermal effect. The slope of linear fitting represents the Seebeck coefficient. (e) Transient characteristics (solid lines) of the Seebeck voltage and converted temperature of the TE temperature sensor as the NIR laser pulse width was reduced: 10 ms (red), 5 ms (blue), 3 ms (green), and 1 ms (purple). The same color bars above the graph represent the duration of the NIR laser irradiation. The same-colored hollow circles represent simultaneously recorded temperature data using the thermographic IR camera sampled at 60 Hz. (f) Close-up of the 1 ms NIR pulse condition in (e). | ||
The temporal resolution of the TE temperature sensing was also characterized. We gradually reduced the NIR laser pulse width from 1 s to 1 ms. We observed a similar response in the measured Seebeckvoltages upon the temperature changes recorded by the thermographic camera (Fig. S3 in the ESI†). However, with the limited frame rate of the thermographic camera recording (60 fps; 16.67 ms time duration between frames), the thermographic camera failed to monitor maximum temperature changes by the photothermal effect when <15 ms laser pulses were irradiated (Fig. 2e). On the other hand, owing to the high sampling rate of the voltage recording (fs = 25 kHz), the TE temperature sensor was capable of accurately capturing the detailed transient characteristics of the temperature changes upon laser irradiation duration as short as 1 ms (Fig. 2f). Therefore, it is evident that the TE temperature sensor can directly sense the photothermal effect with sub-ms temporal resolution.
We fabricated a TE temperature sensor consisting of fully biocompatible components on a 100 μm-thick parylene C substrate. A 1-pass inkjet-printed PEDOT:PSS layer (7 mm × 1 mm) and 8-pass inkjet-printed PEDOT:PSS layers were used as a TE layer and electrodes, respectively (Fig. 3a). Note that there was no temperature difference in the 8-pass printed PEDOT:PSS electrode; therefore, it would not contribute to the thermoelectric effects. The total resistance of the PEDOT:PSS-only TE temperature sensor was optimized to be 3.04 kΩ, lower than the previous one for lower baseline rms noise. A 500 nm-thick parylene C film and a 5 nm-thick gold nanofilm were then deposited sequentially for passivation and the photothermal effect, respectively. We irradiated the NIR laser at the edge of the TE layer for <100 ms, and good linearity between the temperature change and Seebeck voltage was observed with a sensitivity of 1.63 μV K−1 (Fig. 3b and c). Note that the lower temperature sensitivity compared to the Seebeck coefficient of the inkjet-printed PEDOT:PSS TE legs in the previous section may have originated from two factors. First, there can be heat loss during the conduction of the photothermally generated heat through the parylene C passivation layer and their interfaces. Second, the temperature gradient generated by the photothermal effect is not uniform, in contrast with the standard TE effect characterization setup described in the previous section. Despite the reduced sensitivity of the sensor, the converted temperature values are still fairly accurate as we relied on simultaneously measured temperature values by the thermographic camera. The LoD of the PEDOT:PSS-only TE temperature sensor was 0.59 °C, extracted from the recorded baseline rms voltage noise of 0.32 μV, which is still favorable for biomedical engineering applications.
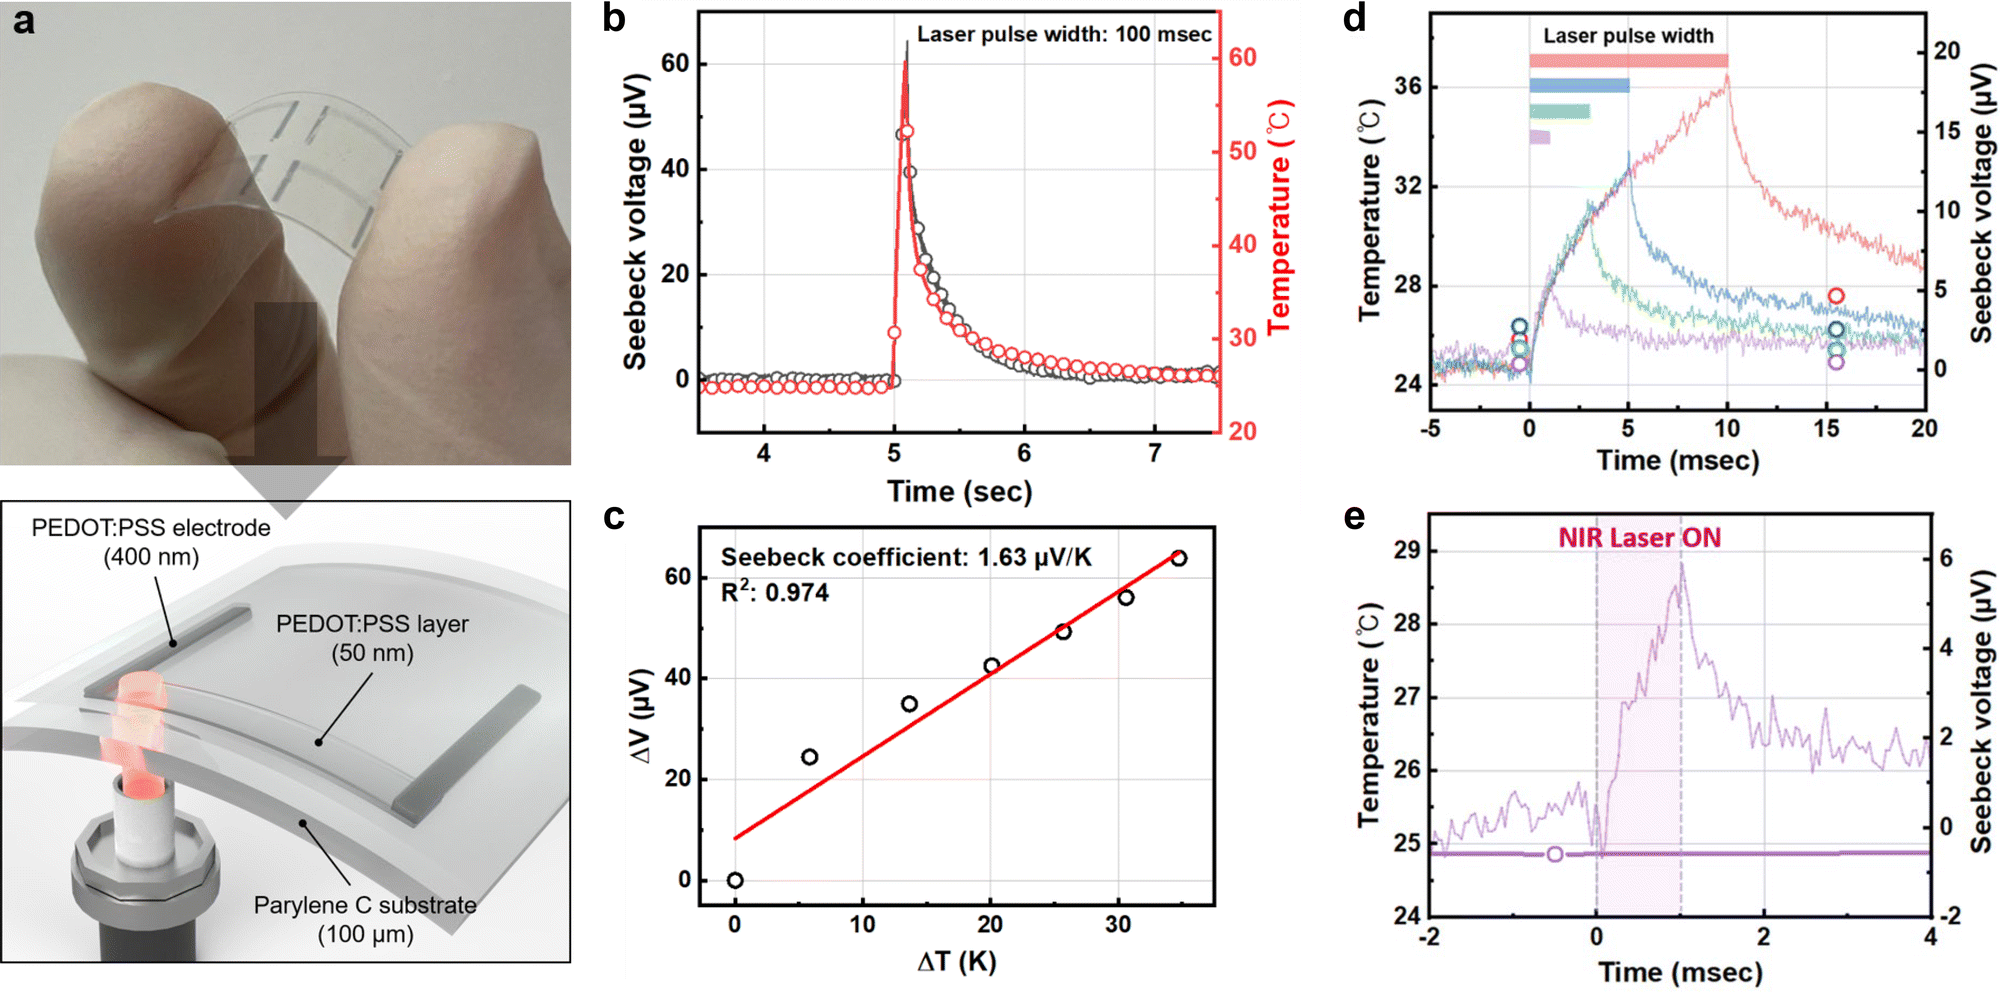 | ||
| Fig. 3 Photothermal effect sensing using the flexible PEDOT:PSS-only TE temperature sensor: (a) photograph (top) and schematic (bottom) of the flexible PEDOT:PSS-only TE temperature sensor on a flexible parylene C substrate. (b) The transient characteristics of the temperature and Seebeck voltage changes of the flexible PEDOT:PSS-only TE temperature sensor upon 100 ms long photothermal effect generation. (c) The TE characteristics of the TE temperature sensor upon the photothermal effect. (d) Transient characteristics (solid lines) of the Seebeck voltage and converted temperature of the flexible PEDOT:PSS-only TE temperature sensor (NIR laser pulse durations are the same as in Fig. 2e). The same-colored hollow circles represent simultaneously recorded temperature data using the thermographic IR camera sampled at 60 Hz. (e) Close-up of the 1 ms NIR pulse conditions in (d). | ||
We also characterized the temporal resolution of the flexible PEDOT:PSS-only TE temperature sensor by reducing the NIR laser pulse width from 100 ms to 1 ms. As in the case of the sensors on the glass substrate, the flexible PEDOT:PSS-only TE temperature sensor was capable of accurately monitoring the temperature changes compared to the thermographic camera at a short NIR laser pulse width (<10 ms) (Fig. 3d). Due to the optimized baseline rms voltage noise owing to the reduced total resistance, the flexible PEDOT:PSS-only TE temperature sensor on parylene C was more suitable for high temporal resolution temperature sensing. When comparing the temperature changes by NIR laser irradiation for 1 ms, it was evident that the PEDOT:PSS-only TE temperature sensor exhibited enhanced temperature sensing capability (Fig. 3e). The PEDOT:PSS-only TE temperature sensor can monitor the temperature changes by the photothermal effect with a temporal resolution of 1 ms.
Optical bio-imaging through the transparent temperature sensors
Next, we validated the usefulness of the high transparency of the PEDOT:PSS TE layer for fluorescence microscopic bio-imaging experiments. As illustrated in Fig. 4a, we cultured hippocampal neurons on PEDOT:PSS TE temperature sensors passivated with 500 nm-thick parylene C. The cultured neurons were imaged on an inverted microscope through the PEDOT:PSS layer (ROIs marked in red boxes in Fig. 4a). Details of the cell culture and bio-imaging protocols are provided in the Experimental section. After culturing the neurons for 14 days in vitro, we observed the formation of a neuronal network through the transparent PEDOT:PSS layer (Fig. 4b). With the optimized transmittance of the 1-pass PEDOT:PSS TE layer (>95%), it was possible to obtain clear cellular morphology by phase-contrast imaging (left images in Fig. 4b). In addition, there was no noticeable difference in cell visibility between the images through the PEDOT:PSS region and through the glass substrate region. This was a significant improvement compared with other transparent or semi-transparent bioelectronic devices that have been suggested for microscopic bio-imaging through the devices at less than 50% transmittance.29 We also verified that fluorescence microscopic imaging of the cultured cells could be conducted through the TE temperature sensor without intensity reduction (right images in Fig. 4b). Owing to the wide spectrum of the transmittance in the visible light spectrum, the fluorescence signals from live/dead assays, which used the most common excitation/emission wavelengths (live cells: 494/517 nm, dead cells: 528/617 nm), were successfully detected. We then quantified cell viability within the PEDOT:PSS region (ROI-1 in Fig. 4b). This assay of the cultured cells confirmed that the device structure we fabricated did not show a significant difference in biocompatibility from the control group (Fig. 4c, p = 0.5823, n = 12 ROIs).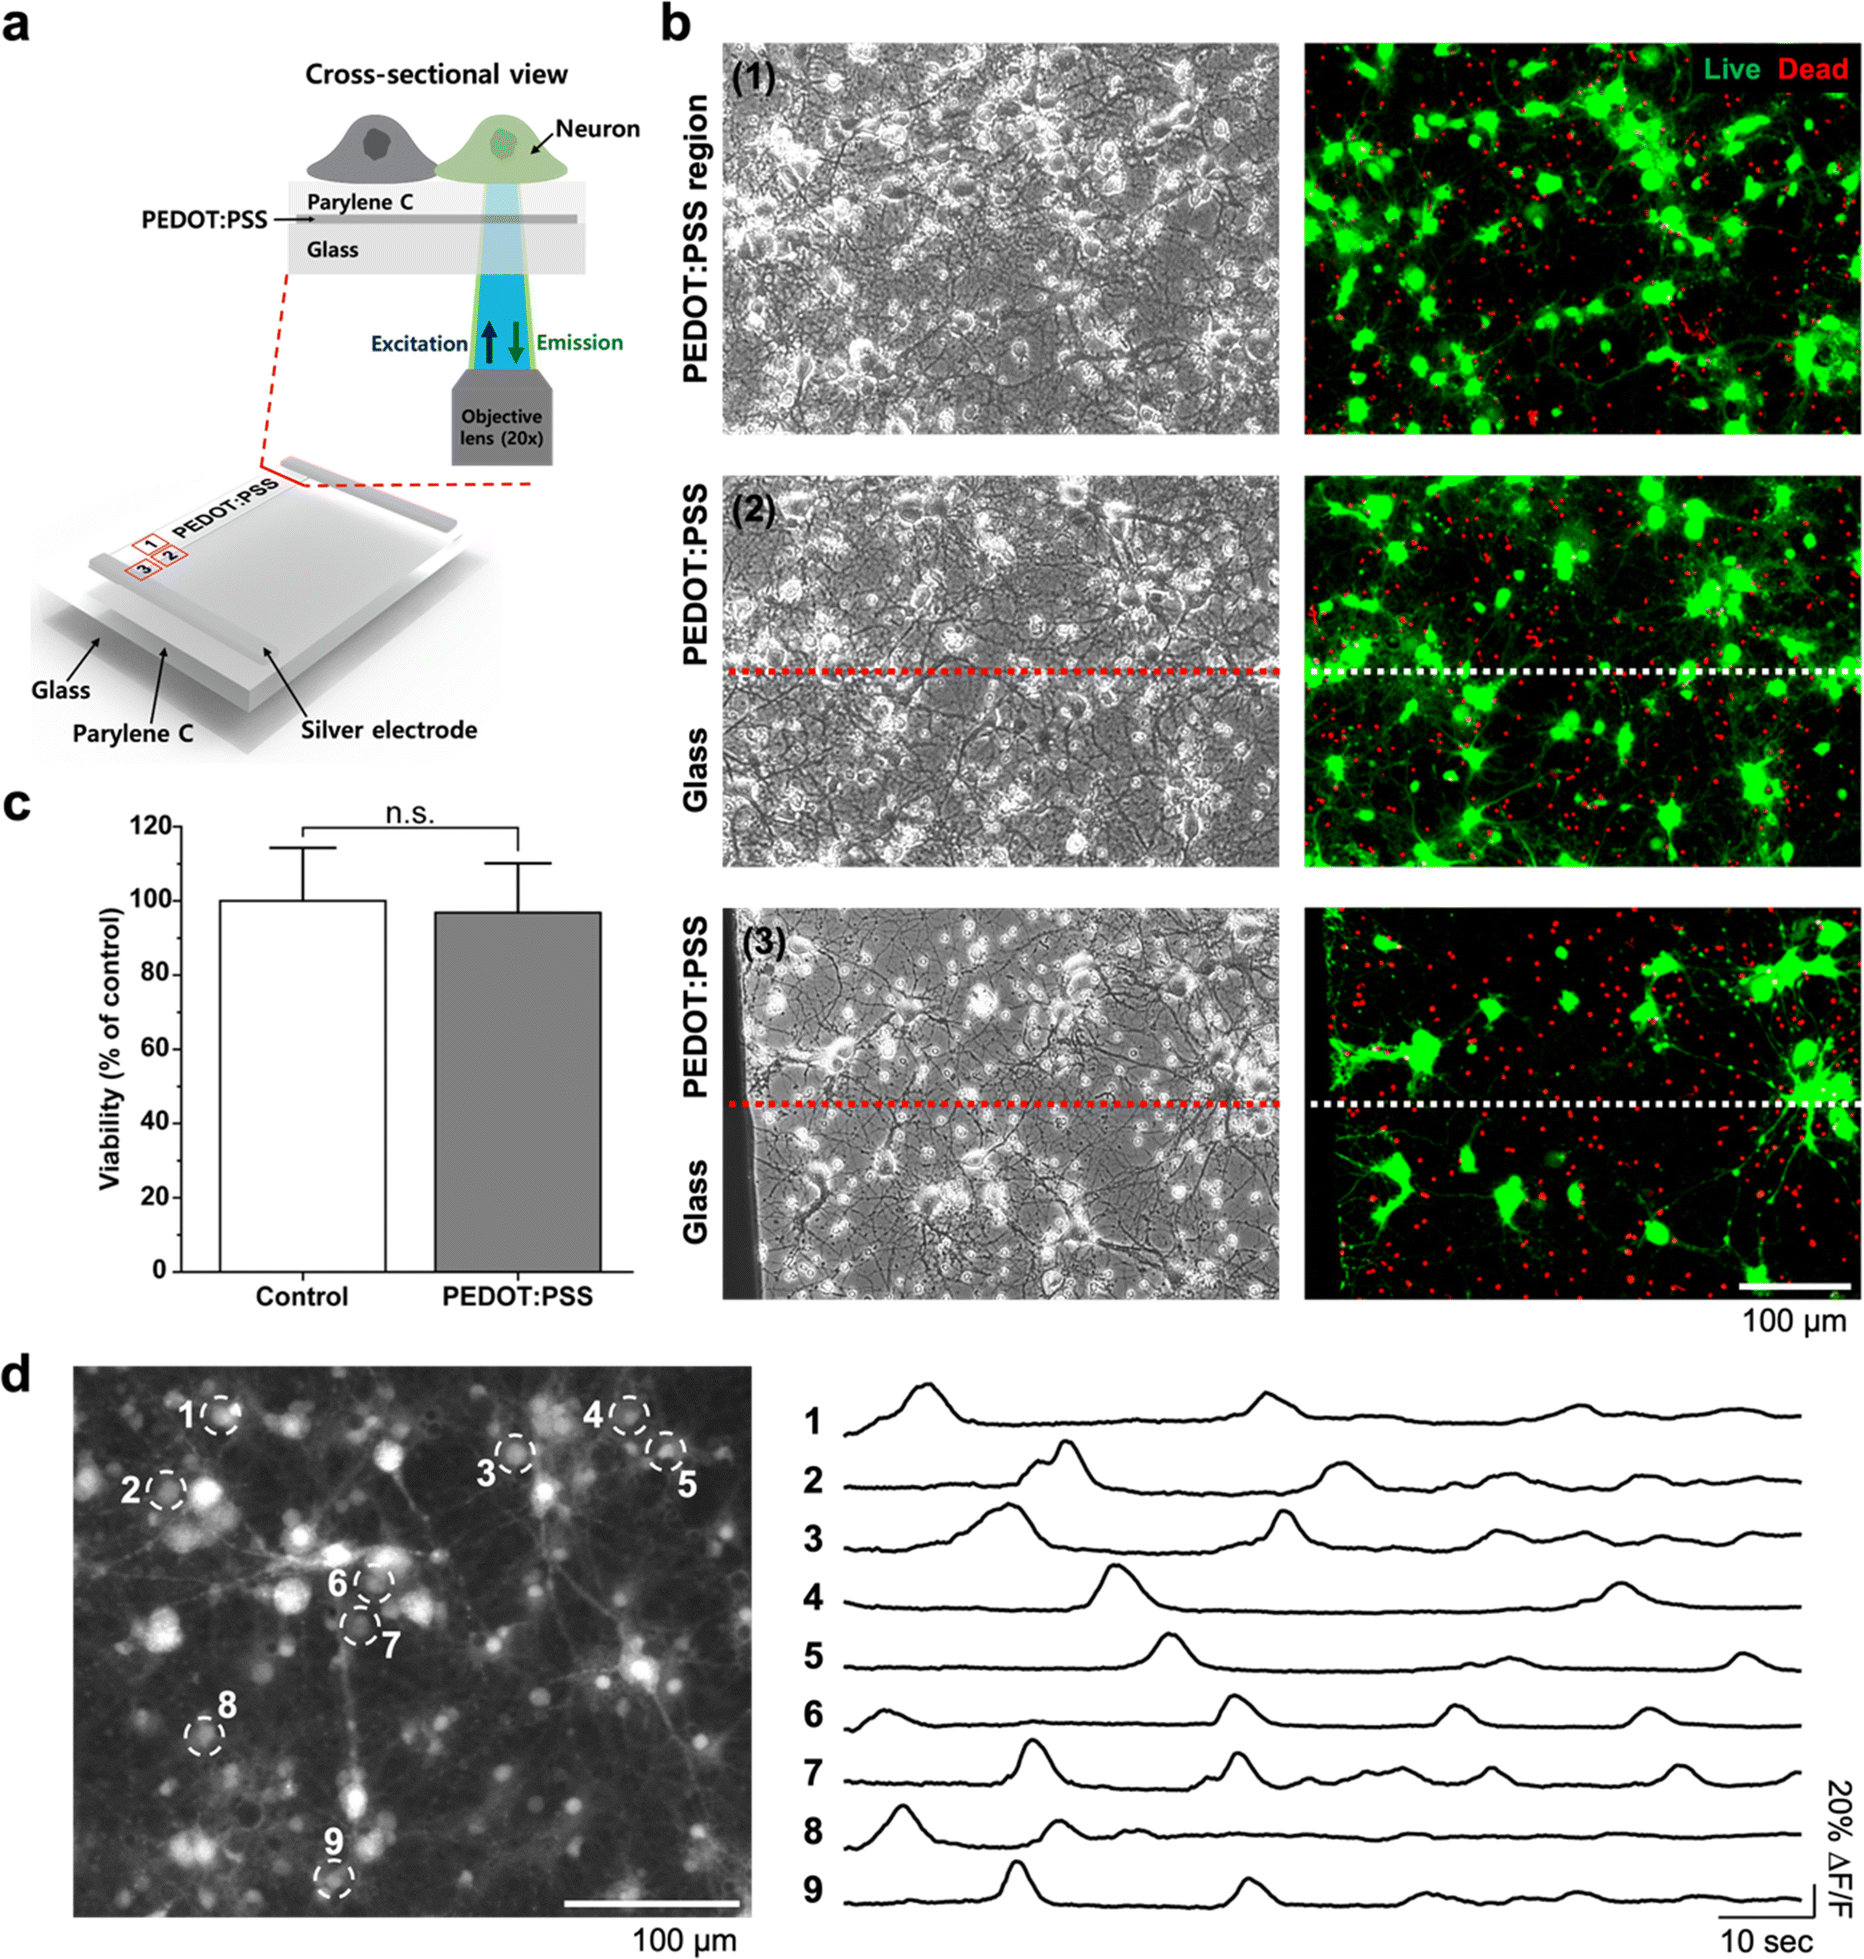 | ||
| Fig. 4 Optical bio-imaging through the transparent TE temperature sensor: (a) Schematic of fluorescence microscopic bio-imaging through the PEDOT:PSS TE temperature sensor using an inverted microscope. Red boxes are regions of interest (ROIs) for imaging. (b) Phase-contrast (left) and fluorescence (right) images obtained from the middle (ROI-1) and boundaries of the PEDOT:PSS region (ROI-2 and 3). Green and red fluorescence indicates live and dead cells, respectively. (c) Cell viability within the PEDOT:PSS region (ROI-1) assessed by live/dead assay. The data are expressed as percentages of control values (neurons cultured on glass substrates without a TE sensor) and presented as mean ± SD. PEDOT:PSS: 96.85 ± 13.31%, Control: 100 ± 14.29%. n = 12 ROIs (each ROI from each sensor). Unpaired t-test (p = 0.5823). (d) Fluorescence image of calcium indicator (OGB-1, Ex./Em.: 494/523 nm)-labeled neuronal network (left) and spontaneous calcium signals recorded from the cells marked with white dashed circles (right). | ||
We further tested the possibility of optical recording of cellular activity through the transparent TE temperature sensors. If it is possible to achieve neuronal signals optically through the TE layer, it would be possible to observe the effect of temperature change on the activity of cells directly interfacing with the TE temperature sensor. We conducted conventional live cell calcium imaging of the same cultured neuronal network at 18 days in vitro using an inverted fluorescence microscope. As shown in Fig. 4d and Movie 1 (ESI†), spontaneous calcium signals were clearly observed within the PEDOT:PSS region (ROI-1 in Fig. 4a) with a good signal-to-noise ratio. Because of the limitations of the microscope instrument we used (i.e., a low imaging frame rate of 4.183 Hz), the obtained optical signals reflected only slowly changing calcium concentrations without a sharp onset of calcium transient and fast fluctuations. However, the results confirmed that high-quality optical neuronal recording could be achieved through the transparent TE temperature sensors, which can open up various combinations of high-speed optical neuronal recording and high-speed temperature sensing.
Discussion
The PEDOT:PSS TE temperature sensors developed in this work have the following advantages over other previously reported types of transparent temperature sensors. The all-inkjet-printed PEDOT:PSS temperature sensors are sufficiently transparent to be utilized in bio-imaging. Even direct laser irradiation through the PEDOT:PSS TE legs could induce the photothermal effect at the thermoplasmonic gold layer on top. The PEDOT:PSS TE layer was highly transparent so that it showed minimal interference with the direct illumination of light. When the light in the NIR region was irradiated on the PEDOT:PSS TE temperature sensor with the gold nanofilm for 1 s, the effect of the PEDOT:PSS layer on the maximum temperature change was only 8% (Fig. 5). Owing to the fast response of the TE effect, the photothermal effect can be monitored in situ in a sub-ms time domain. Exploiting these benefits, we successfully measured the fast response of the photothermal effect that occurred in the sub-micrometer distance (500 nm apart) at high temporal resolution (100 μs). For example, it would even be possible to measure temperature changes according to a few hundred-μs long pulses of a laser in neural stimulation.30,31 Despite efforts to develop transparent temperature sensors, such as transparent RTDs and transparent diodes, none of the microsensors were able to directly sense the high-speed photothermal effect. In addition, unlike other temperature sensing devices that are often limited by self-heating, our TE temperature sensor generates output voltage signals by taking the thermal energy as the input and hence avoids the concern of self-heating. Moreover, because the TE temperature sensor only requires recording of the Seebeck voltage change across the TE layer, we can easily integrate the TE temperature sensors with typically used low-noise voltage neural recording systems for neural interfaces. Lastly, the superior sensor performance reported herein is achieved with materials that are actively used in various biomedical engineering applications and are known to be biocompatible.32–34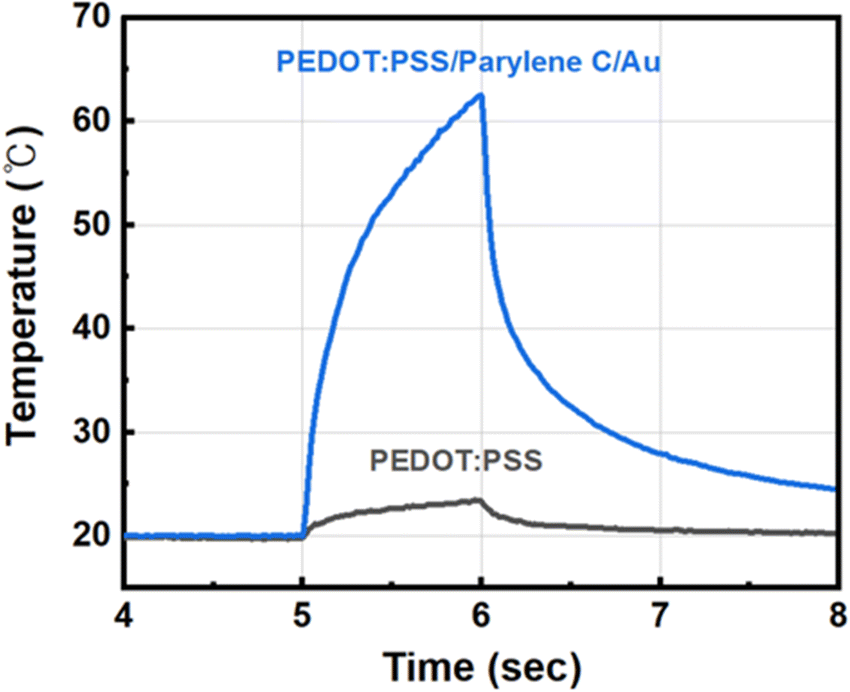 | ||
| Fig. 5 Temperature changes of the PEDOT:PSS TE temperature sensors on the glass substrate with and without the gold nanofilm. The NIR laser irradiation pulse width was 1 s long from 5 s to 6 s in time. | ||
While the TE temperature sensors in this work were fabricated in millimeter sizes for characterizing mm-scale photothermal effect experiments, it is also possible to design the sensors on a μm-scale. Because the baseline output voltage noise of the sensor is dominated by the thermal noise of the resistances of the TE layer, we can retain the same baseline noise level by keeping the aspect ratio of the TE layer as we scale down the width of the PEDOT:PSS TE layer. For example, the width of the inkjet-printed PEDOT:PSS can be easily scaled down to 20 μm with a length of 140 μm to sense a single-cell photothermal effect at a resolution of tens of μm without any change in the Seebeck effect.21,35 Furthermore, with our technology, it is possible to fabricate a high-density array of microscale temperature sensors to monitor the spatiotemporal profile of the photothermal effect. For example, this would be especially useful when combined with microfluidic channels of a biological medium flow or when neural signal propagation is observed corresponding to the spatiotemporal temperature changes.36 Fundamentally, it would also be possible to fabricate sub-micron devices if the PEDOT:PSS layer is photolithographically patterned to measure the photothermal effect at the nanoscale for intracellular photothermal therapy.37 From a material perspective, inkjet-printed transparent carbon nanotube (CNT) films could also be considered to achieve a higher Seebeck voltage while maintaining the transparency and flexibility of the TE sensors.
With the successful demonstration of both high temporal resolution temperature sensing with simultaneous photothermal heating and optical activity recordings of living cells, we expect that the transparent PEDOT:PSS TE temperature sensors can be utilized in various bioengineering experiments for in-depth analysis of cellular behaviors according to the thermal effect. As it has been experimentally found that there is a correlation between local heating and electrophysiological signals (e.g., action potentials and calcium transients), the ability to measure both the optical neural signal and temperature change at high temporal resolution would allow investigation of the relationship between rapid temperature change and extracellular signals at high spatiotemporal resolution.20,37,38 For example, an in-depth analysis can be carried out by combining our TE sensors with voltage-sensitive dye imaging that allows high spatiotemporal resolution optical recording of both the action potential and subthreshold transmembrane voltage of neuronal cells beyond 1 kHz.39–42
Experimental section
Thermoelectric temperature sensor fabrication
To produce well-defined PEDOT:PSS TE legs, ultraviolet (UV) ozone treatments with a power density of 18 mW cm−2 were conducted onto the target substrates for 10 min, which delivered sufficient hydrophilic surface properties. On the prepared substrates, PEDOT:PSS TE legs were deposited using an inkjet printing system (OmniJet300, Unijet Corp.) with different printing passes on demand, and then annealed on a 100 °C hot plate for 10 min in ambient conditions. PEDOT:PSS were purchased at Sigma-Aldrich. To form highly conductive electrodes, the nanoparticle-type silver ink (DGP 40LT-15C, ANP Corp.) was inkjet-printed, and then annealed on a 150 °C hot plate for 30 min. All reagents were used as received.Characterization of PEDOT:PSS thermoelectrics
The TE properties of inkjet-printed PEDOT:PSS were characterized depending on the thickness of the films. Their sheet resistance and film thickness were measured using a semiauto sheet resistance/resistivity (Rs/Res) measurement system (Cress Box, Napson Co.) and a stylus-based surface profiler (Alpha-Step IQ, KLA Tencor Co.), respectively. The Seebeck coefficient was measured using a four-point probe TE measurement system (TEP 600, Seepel instruments) at temperature differences of ±0.5, ±1.5, and ±2.5 K. Transmittance measurements were conducted using a UV-Vis-NIR spectrometer (V-600, Jasco) in the wavelength range of 300–850 nm. The TE sensors were characterized using two Peltier devices for heating/cooling to secure a temperature difference, and then it was monitored using a thermometer with two thermocouple wires. The TE output performance was measured using a source meter (Keithley 2400) in thermal equilibrium.Photothermal effect experiment
A 500 nm-thick parylene C layer was coated on the TE temperature sensor for passivation by chemical vapor deposition using a parylene coating system (OBT-PC300, Obang Technology). After that, a plasmonic photothermal 5 nm-thick gold layer was deposited at a 0.5 Å s−1 deposition rate using a thermal evaporator (KVE-T2004, Korea Vacuum Tech).28Thermoelectric temperature sensing
For the temperature sensing test, a near-infrared diode laser at 785 nm (TEM-F-785, CNI lasers) was irradiated on the tip of the TE layer of the prepared TE temperature sensor. The NIR laser was irradiated on the plasmonic gold photothermal layer through the transparent PEDOT:PSS TE layer and transparent substrates. The laser beam formed a 1 mm-diameter of irradiation area. In order to adjust the irradiation time of the laser, the timing of the NIR laser on/off was controlled by TTL pulses while the laser power was kept constant. An infrared thermographic camera (A325SC, FLIR) with a close-up IR lens (T197201, FLIR) was used to measure the maximum temperature value via the photothermal effect in the ROI of 2 mm-diameter centered on the laser beam to exclude outside interference. We simultaneously amplified the Seebeck voltage change occurring across the TE layer by a low noise voltage preamplifier (SR-560, Stanford Research Systems). The voltage was amplified with a gain of 100 V/V and a low-pass filter at 10 kHz for noise reduction. The amplified voltage signals were digitized by a voltage acquisition system (MEA2100-Mini-Systems, Multi Channel Systems) at 25 kHz of sampling frequency and were analyzed using MATLAB (MathWorks). All these experiments were conducted in a grounded Faraday cage (FAR05F, Thorlabs) to block an external electromagnetic field. The baseline rms voltage noise was calculated from 1-second-long data of the voltage signal recorded before illuminating the near-infrared diode laser. See the experimental setup in Fig. S4 in the ESI.†Cell culture
Hippocampi, dissected from E18 Sprague Dawley rat brains, were dissociated in Hanks’ Balanced Salt Solution (HBSS; WELGENE) by gentle pipetting. After centrifuging the cell suspension for 2 min at 1000 rpm, the supernatant was replaced with a cell culture plating medium. The components of the medium were Neurobasal medium (Gibco), B-27 supplement (Gibco), 2 mM GlutaMAX supplement (Gibco), 1% penicillin–streptomycin (Gibco), and 12.5 μM L-glutamine (Gibco). The dissociated neurons were plated on the TE temperature sensor with a density of 700 cells per mm2. Prior to the cell plating, the sensor, passivated with 500 nm-thick parylene C, was coated with poly-D-lysine (PDL; Gibco) (0.05 mg ml−1 in Dulbecco's Phosphate Buffered Saline (DPBS; WELGENE)) overnight. The cultures were maintained in an incubator set at 37 °C with 5% CO2. Half of the medium was exchanged with a fresh medium (containing the same components as the plating medium except L-glutamine) twice a week. All experiments were performed in accordance with the guidance of the Institutional Animal Care and Use Committee (IACUC) of Daegu Gyeongbuk Institute of Science and Technology (DGIST), and all experimental protocols were approved by the IACUC of DGIST (DGIST-IACUC-21041903-0002).Optical bio-imaging and analysis
All fluorescence and phase-contrast images of cultured neuronal networks were acquired using a CMOS camera (DS-Qi2, Nikon) mounted on an inverted microscope (ECLIPSE Ti, Nikon) with a 20× objective lens (S Plan Fluor ELWD, Nikon). For live/dead assay, 200 μl of staining solution (2 μM calcein AM and 4 μM ethidium homodimer-1 in DPBS) was added to cultured cells with 800 μl of culture medium and incubated for 20 min. By using a mercury lamp light source (INTENSILIGHT C-HGFI, Nikon) with optical filters (FITC cube set: 465–495 nm/505 nm/512–558 nm; TRITC cube set: 527–553 nm/565 nm/577–633 nm (Ex./DM./Em.), Nikon), fluorescence images were captured, and the number of live and dead cells were manually counted. As a control group for normalization and comparison of cell viability, the same procedure was performed on cells seeded on PDL-coated glass substrates without a TE temperature sensor. Viability was calculated by dividing the number of live cells by the total number of cells and expressed as a percentage of the control group, set to 100%. Graphical and statistical analyses with unpaired t-test were carried out using OriginPro 2020b (OriginLab). For calcium imaging, a commercial calcium indicator, Oregon green BAPTA-1 (OGB-1; Invitrogen), was loaded into the cultured cells by a protocol modified from a previous study.43 Dye stock solution was prepared by dissolving 50 μg of OGB-1 in 48 μl of dimethyl sulfoxide (DMSO; Sigma-Aldrich) and 2 μl of Pluronic F-127 (Sigma-Aldrich), and then dye loading solution was made by diluting 5 μl of the stock solution into 2 ml of the maintenance medium. The existing cell culture medium was replaced with the loading solution and incubated for 30 min. After the loading process, the solution was removed, and the cells were gently washed using the medium without dye solution. Following the stabilization for 30 min, calcium signals were measured. To minimize autofluorescence, phenol red-free medium was used in all processes. With the same light source and optical filter (FITC cube set) used for live/dead assay, fluorescence images were collected for 2 min at 4.183 Hz. To extract calcium signals from individual cells, a region of interest (ROI) for each cell body was manually selected, and the mean intensity of each ROI was computed from the acquired image sequences. Next, each intensity trace was fitted with an exponential function, and the fit was subtracted from the original trace to correct intensity decay due to photobleaching. Lastly, a calcium transient of each ROI was obtained by calculating the change in intensity relative to the baseline intensity (ΔF/F = (F − F0)/F0) from the corrected trace. F is the intensity at a specific time point, and F0 is the baseline intensity defined as the average intensity for 10 s at the beginning and end of the measurement. All signal processing was performed using MATLAB (MathWorks).Conclusions
In this work, we introduced a high temporal resolution transparent temperature sensor based on the thermoelectric effect and demonstrated its application to direct high-speed sensing of a laser-induced photothermal effect at submicron proximity. Inkjet-printed PEDOT:PSS films were used as flexible, transparent thermoelectric sensing layers exhibiting excellent transmittance >95% and sensing linearity. The operation principle of the transparent thermoelectric temperature sensor was developed to maximize the sensitivity of local photothermal sensing induced by a near-infrared laser and a thermoplasmonic gold layer with a limit of detection of around 0.5 K. Owing to the fast response of the sensor based on the thermoelectric effect, ms time scale photothermal effect behavior (as short as 1 ms) was successfully monitored with a sub-ms temporal resolution. The high optical transmittance of our temperature sensor allows high-quality fluorescence microscopic cellular imaging, including calcium signal imaging of live cells through transparent PEDOT:PSS thermoelectric layers. With growing interest in the use of photothermal effects in various biomedical engineering applications, high temporal resolution sensing of the photothermal temperature changes associated with various optical imaging techniques can open up new opportunities in both engineering and scientific studies. Moreover, inkjet printing of the PEDOT:PSS thermoelectric layer provides a high degree of design freedom on various flexible substrates, and therefore our temperature sensor is expected to be widely utilized in various applications with arbitrary shapes.Author contributions
Junhee Lee: conceptualization, methodology, writing – original draft preparation. Seongkwon Hwang: conceptualization, methodology, writing – original draft preparation. Nari Hong: methodology, writing – original draft preparation, validation. Jeonghun Kwak: investigation. Jae Eun Jang: investigation. Seungjun Chung: conceptualization, supervision, writing – original draft preparation, writing – reviewing and editing, funding acquisition. Hongki Kang: conceptualization, supervision, writing – original draft preparation, writing – reviewing and editing. All authors discussed the results and revised and approved the manuscript.Conflicts of interest
There are no conflicts to declare.Acknowledgements
S. H. and S. C. appreciate the support from National R&D Program through the National Research Foundation of Korea (NRF) funded by the Ministry of Science and ICT (MSIT) (NRF-2020M3D1A2101799) and the Korean Institute of Science and Technology (KIST) Future Resource Research Program (2E31813). J. L., N. H., J. E. J., and H. K. appreciate the supports from the Basic Research Program through the NRF funded by the MSIT (2021R1A4A1028652) and from the DGIST R&D Programs of the MSIT (19-CoE-BT-03, 21-IJRP-01).References
- B. He, S. Jia, M. Zhao, Y. Wang, T. Chen, S. Zhao, Z. Li, Z. Lin, Y. Zhao and X. Liu, Adv. Mater., 2021, 33, 2004406 CrossRef CAS PubMed.
- A. S. Kuenstler, Y. Chen, P. Bui, H. Kim, A. DeSimone, L. Jin and R. C. Hayward, Adv. Mater., 2020, 32, 2000609 CrossRef CAS PubMed.
- G. Baffou, F. Cichos and R. Quidant, Nat. Mater., 2020, 19, 946 CrossRef CAS PubMed.
- H. J. Kim, B. Kim, Y. Auh and E. Kim, Adv. Mater., 2021, 33, 2005940 CrossRef CAS.
- S. H. C. Askes and E. C. Garnett, Adv. Mater., 2021, 33, 2105192 CrossRef CAS.
- Z. Li, Z. Ye, L. Han, Q. Fan, C. Wu, D. Ding, H. L. Xin, N. V. Myung and Y. Yin, Adv. Mater., 2021, 33, 2006367 CrossRef CAS.
- X. Wu, Y. Jiang, N. J. Rommelfanger, F. Yang, Q. Zhou, R. Yin, J. Liu, S. Cai, W. Ren, A. Shin, K. S. Ong, K. Pu and G. Hong, Nat. Biomed. Eng., 2022, 6, 754 CrossRef CAS PubMed.
- G. Baffou and R. Quidant, Laser Photonics Rev., 2013, 7, 171 CrossRef CAS.
- C. Xie and Z. Qin, J. Heat Transfer, 2022, 144, 1 CrossRef PubMed.
- H. Gholami Derami, P. Gupta, K. Weng, A. Seth, R. Gupta, J. R. Silva, B. Raman and S. Singamaneni, Adv. Mater., 2021, 33, 2008809 CrossRef CAS.
- H. Kang, W. Hong, Y. An, S. Yoo, H.-J. Kwon and Y. Nam, ACS Nano, 2020, 14, 11406 CrossRef CAS PubMed.
- H. Kang, G.-H. Lee, H. Jung, J. W. Lee and Y. Nam, ACS Nano, 2018, 12, 1128 CrossRef CAS.
- C. Xu, Y. Jiang, Y. Han, K. Pu and R. Zhang, Adv. Mater., 2021, 33, 2008061 CrossRef CAS.
- Y. Liu, H. Wang, S. Li, C. Chen, L. Xu, P. Huang, F. Liu, Y. Su, M. Qi, C. Yu and Y. Zhou, Nat. Commun., 2020, 11, 1 CrossRef CAS.
- B.-H. Kang, Y. Lee, E.-S. Yu, H. Na, M. Kang, H. J. Huh and K.-H. Jeong, ACS Nano, 2021, 15, 10194 CrossRef.
- J. H. Son, B. Cho, S. Hong, S. H. Lee, O. Hoxha, A. J. Haack and L. P. Lee, Light: Sci. Appl., 2015, 4, e280 CrossRef CAS.
- D. Nelidova, R. K. Morikawa, C. S. Cowan, Z. Raics, D. Goldblum, H. P. N. Scholl, T. Szikra, A. Szabo, D. Hillier and B. Roska, Science, 2020, 368, 1108 CrossRef CAS.
- J. Qiu, Y. Shi and Y. Xia, Adv. Mater., 2021, 33, 2104729 CrossRef CAS.
- N. Hong and Y. Nam, Nat. Commun., 2020, 11, 6313 CrossRef CAS.
- L. Paris, I. Marc, B. Charlot, M. Dumas, J. Valmier and F. Bardin, Biomed. Opt. Express, 2017, 8, 4568 CrossRef CAS.
- S. Yoo, J.-H. Park and Y. Nam, ACS Nano, 2019, 13, 544 CrossRef CAS PubMed.
- J. Lee, N. Hong, W. Hong, D. Kim, Y. Hwang, J. Jang and H. Kang, Adv. Mater. Technol., 2021, 2100923 Search PubMed.
- S. K. Rastogi, R. Garg, M. G. Scopelliti, B. I. Pinto, J. E. Hartung, S. Kim, C. G. E. Murphey, N. Johnson, D. S. Roman, F. Bezanilla, J. F. Cahoon, M. S. Gold, M. Chamanzar and T. Cohen-Karni, Proc. Natl. Acad. Sci. U. S. A., 2020, 117, 13339 CrossRef CAS.
- S. W. Angrist, Direct energy conversion., Allyn and Bacon, Boston, MA, 1965 Search PubMed.
- L. E. Bell, Science, 2008, 321, 1457 CrossRef CAS.
- D. C. Martin, Nat. Mater., 2007, 6, 626 CrossRef CAS.
- S. Hwang, I. Jeong, J. Park, J.-K. Kim, H. Kim, T. Lee, J. Kwak and S. Chung, ACS Appl. Mater. Interfaces, 2020, 12, 26250 CrossRef CAS.
- J. W. Lee, H. Kang and Y. Nam, Nanoscale, 2018, 10, 9226 RSC.
- T. Ryynänen, A. Pelkonen, K. Grigoras, O. M. E. Ylivaara, T. Hyvärinen, J. Ahopelto, M. Prunnila, S. Narkilahti and J. Lekkala, Front. Neurosci., 2019, 13, 1 Search PubMed.
- A. G. Xu, M. Qian, F. Tian, B. Xu, R. M. Friedman, J. Wang, X. Song, Y. Sun, M. M. Chernov, J. M. Cayce, E. D. Jansen, A. Mahadevan-Jansen, X. Zhang, G. Chen and A. W. Roe, Sci. Adv., 2019, 5, 1 Search PubMed.
- J. B. Ford, M. Ganguly, J. Zhuo, M. T. McPheeters, M. W. Jenkins, H. J. Chiel and E. D. Jansen, J. Neural Eng., 2021, 18, 056016 CrossRef.
- W. Yang, Y. Gong and W. Li, Front. Bioeng. Biotechnol., 2021, 8, 1 Search PubMed.
- M. Golda-Cepa, K. Engvall, M. Hakkarainen and A. Kotarba, Prog. Org. Coat., 2020, 140, 105493 CrossRef CAS.
- N. Sultana, H. C. Chang, S. Jefferson and D. E. Daniels, J. Pharm. Invest., 2020, 50, 437 CrossRef CAS.
- Y. Weissler, N. Farah and S. Shoham, J. Neural Eng., 2017, 14, 055001 CrossRef CAS.
- B. A. McKenzie and W. H. Grover, PLoS One, 2017, 12, 1 Search PubMed.
- D. Zhu, L. Feng, N. Feliu, A. H. Guse and W. J. Parak, Adv. Mater., 2021, 33, 2008261 CrossRef CAS.
- J. L. Jenkins, W. R. Adams, J. B. Ford, S. Evans, A. M. Mahadevan-Jansen, M. R. Hutchinson and D. Jansen, in Optical Techniques in Neurosurgery, Neurophotonics, and Optogenetics, ed. S. K. Mohanty; A. W. Roe; S. Shoham, SPIE, 2021, p. 81 Search PubMed.
- D. Shoham, D. E. Glaser, A. Arieli, T. Kenet, C. Wijnbergen, Y. Toledo, R. Hildesheim and A. Grinvald, Neuron, 1999, 24, 791 CrossRef CAS PubMed.
- Y. Gong, C. Huang, J. Z. Li, B. F. Grewe, Y. Zhang, S. Eismann and M. J. Schnitzer, Science, 2015, 350, 1361 CrossRef CAS.
- K. D. Piatkevich, S. Bensussen, H. Tseng, S. N. Shroff, V. G. Lopez-Huerta, D. Park, E. E. Jung, O. A. Shemesh, C. Straub, H. J. Gritton, M. F. Romano, E. Costa, B. L. Sabatini, Z. Fu, E. S. Boyden and X. Han, Nature, 2019, 574, 413 CrossRef CAS PubMed.
- J. Wu, Y. Liang, S. Chen, C.-L. Hsu, M. Chavarha, S. W. Evans, D. Shi, M. Z. Lin, K. K. Tsia and N. Ji, Nat. Methods, 2020, 17, 287 CrossRef CAS PubMed.
- M. J. Jang and Y. Nam, Neurophotonics, 2015, 2, 1 Search PubMed.
Footnotes |
| † Electronic supplementary information (ESI) available. See DOI: https://doi.org/10.1039/d2mh00813k |
| ‡ J. L., S. H., and N. H. contributed equally to this work. |
| This journal is © The Royal Society of Chemistry 2023 |