
 Open Access Article
 This Open Access Article is licensed under a
 Creative Commons Attribution 3.0 Unported Licence
Accurate calculation of second osmotic virial coefficients of proteins using mixed Poisson–Boltzmann and extended DLVO theory†
Srdjan
Pusara
 ,
Wolfgang
Wenzel
and
Mariana
Kozlowska
*
,
Wolfgang
Wenzel
and
Mariana
Kozlowska
*
Institute of Nanotechnology, Karlsruhe Institute of Technology (KIT), Hermann-von-Helmholtz-Platz 1, 76344 Eggenstein-Leopoldshafen, Germany. E-mail: mariana.kozlowska@kit.edu
First published on 3rd July 2023
Abstract
The state of proteins in aqueous solution is determined by weak, nonspecific interactions affected by pH, solvent composition, and ionic strength. Protein–protein interactions play a crucial role in determining protein stability and solubility. The second osmotic coefficient (B22) provides insight into effective interactions between proteins in solution. Models for calculating B22 are valuable for estimating interactions, explaining measured phenomena, and reducing experimental time. However, existing models, like the Derjaguin–Landau–Verwey–Overbeek (DLVO) theory, assume a simple spherical shape for proteins. Owing to the fact that proteins exhibit diverse shapes and charge distributions, influencing their electrostatic properties and overall interactions, DLVO accuracy is significantly reduced for nonspherical proteins. To address this limitation, we introduce the xDLVO-CGhybr model, which combines Poisson–Boltzmann (PB) and Debye–Hückel (DH) theories to account for electrostatic interactions between proteins. PB is used for short intermolecular distances (<2 nm) with an all-atom resolution, while DH is employed for longer distances on a coarse-grained level. Additionally, xDLVO-CGhybr incorporates an improved coarse-grained Lennard-Jones (LJ) potential derived directly from the all-atom potential to capture dispersion interactions. This model improves the calculated B22 values compared to existing models and can be applied to proteins with arbitrary shape and charge under various solvent conditions (up to 1 M monovalent salt concentration). We demonstrate the application of xDLVO-CGhybr to bovine trypsin inhibitor, ribonuclease A, chymotrypsinogen, concanavalin A, bovine serum albumin, and human immunoglobulin type I proteins, validating the model against experimental data.
Design, System, ApplicationProteins, as complex macromolecules, exhibit diverse structures, functions, and sizes, making them the most versatile biological species. Understanding protein behaviour in diverse solutions is essential for numerous scientific, pharmaceutical, and technological applications. However, the intricate complexity of protein–protein interactions and their dependence on solution conditions may lead to chemical and physical instability of protein solutions, posing challenges in their processing and target application. Predicting the state of proteins in specific conditions using molecular modelling and theoretical calculations of the second osmotic virial coefficient, which indicates the overall interactions between two macromolecules in a solution, tends to accelerate the discovery of adequate processing conditions and guide experiments. Here, we introduce a new theoretical model called xDLVO-CGhybr to calculate protein solution stability, modulated by diverse protein–protein interactions, by incorporating the most essential interaction potential terms governing protein behaviour. In future applications, this model can be utilised to provide quantitative predictions of protein solubility when coupled with other models that consider protein–solvent interactions. Furthermore, by bridging the gap between macroscopic experimental observables and microscopic structure–function relationships, our research contributes to a deeper understanding of protein behaviour in solution. |
1. Introduction
Protein–protein interactions (PPIs) in aqueous solution are of great interest from both a fundamental science and a technology standpoint. Specific protein interactions are typically more directional and greater in magnitude than non-specific interactions. Such specific interactions in living systems, for example, force proteins into biologically relevant assemblies, which provide a distinct biochemical function than for the molecule in the monomer state.1 In addition, such interactions are responsible for particular recognition, such as substrate to enzyme binding, antigen to antibody binding, or enzyme inactivation.2On the other hand, weaker, nonspecific interactions play a crucial role in determining the state of proteins in solution, therefore, they determine the protein's solubility and its tendency to undergo transient aggregation or precipitation. Protein aggregation is a significant issue for the biopharmaceutical industry from a technological standpoint,3 and it continues to be one of the barriers to the development of biotherapeutics. In general, it is essential to know how to minimise and restrict protein aggregation in specific conditions. Therefore, understanding protein–protein interactions and their dependencies upon the change of solution conditions is essential for designing and developing effective strategies to control protein stability and prevent undesirable aggregation or precipitation. This can significantly impact the performance and shelf-life of protein-based products.4,5
To understand conditions that lead to protein aggregation,6,7 assembly, gel formation or protein crystallisation,8,9 it is necessary to comprehend forces that act between proteins on a molecular level.10 Nonspecific interactions are mostly governed by weak noncovalent interactions, such as attractive van der Waals and hydrophobic interactions, and attractive or repulsive short- and long-range electrostatic interactions. The stability of protein solutions is determined by the balance between repulsive and attractive forces, therefore understanding of these interactions on a quantitative level is an important step towards prediction of processability conditions.
The second osmotic virial coefficient, B22, serves as a valuable indicator of the overall interactions between two macromolecules in a solution,11 as well as a measure of weak, nonspecific interactions.12 The B22 coefficient is defined by the deviation of the solution from ideal behaviour and quantifies the extent to which the osmotic pressure differs from that of an ideal solution:
 | (1) |
In addition to its theoretical significance, the experimental determination of the second osmotic virial coefficient provides a valuable source for weak PPIs. This technique has been widely employed by researchers to semi-quantitatively predict or explain various thermodynamic properties, including protein solubility,14–16 crystallisation,17,18 aggregation propensity,19 and the critical temperature for liquid–liquid phase separation.20 As such, the second osmotic virial coefficient serves as a versatile tool for understanding the behaviour of macromolecules in solution and has become an indispensable part of the modern biotechnology toolkit.21 In their pioneering work, George and Wilson demonstrated that the measured second osmotic virial coefficients could be correlated to crystallisation behaviour.17,22 It needs to fall within a narrow interval known as the “crystallisation slot” for protein crystals to be formed. If the values are below the crystallisation slot (indicating stronger attraction), amorphous precipitates would form instead. Since then, the second osmotic virial coefficient has been also used to understand protein solubility at different concentrations and solution conditions. Here, solubility of macromolecules or particles can be modelled using either the thermodynamic relationship between solubility and second osmotic virial coefficients,14,18 or through semi-empirical models, in which adjustable parameters are fitted from experimental data.15,16
Various experimental techniques can be used to measure second osmotic virial coefficients, including membrane osmometry,12,23 self interaction chromatography,7 dynamic or static light scattering,24–27 sedimentation equilibrium, and small angle X-ray or neutron scattering (SAXS/SANS).28,29 However, these techniques have limitations, as they can be time-consuming or require large amounts of protein samples, making them unsuitable for quick screening of PPIs under various solution conditions. Furthermore, B22 measurements can yield different results when different experimental techniques are used, or even when the same technique is applied by different researchers. Finally, experimentally determined B22 values do not provide information about the origin of PPIs or which molecular interactions contribute the most to the observed macroscopic effects. In addition, B22 was reported also to be calculated using all-atom or coarse-grained molecular dynamics with explicit solvent, via free energy techniques.30 However, the B22 coefficients obtained differ significantly from experimental results. To achieve better agreement with experiments in this case, Lennard-Jones interactions needed to be weakened by a factor of approximately 0.1.11,30
The importance of developing theoretical models to rapidly evaluate PPIs under a broad range of solution conditions is evident. Second osmotic coefficients can be derived using concepts of statistical thermodynamics,13 where B22 is defined as an integral measure of the pair interaction potential W(r) experienced by particles in solution:
 | (2) |
Various computational methods have been employed to calculate B22 values. For example, Monte Carlo simulations31 have been used to integrate the Mayer f-function (equal to the negative of the term in brackets in eqn (2)) in the six-dimensional relative configurational space.32,33 Molecular dynamics,30 Brownian dynamics34,35 and Monte Carlo simulations36 have been used to simulate dilute protein solutions to obtain the radial distribution function (RDF),34,35 which can be used to determine the Mayer function through the relationship RDF-1 = f-function. Additionally, the PMF has been determined by counting configurations in which proteins interact or by using free energy techniques.30,37 In these calculations, proteins were modelled using either sphere models,38,39 coarse grained (CG) models,30,33 or full all-atom representations,11 while the solvent was mostly represented implicitly. Some researchers have also focused on optimising the force field by tuning the nonbonded parameters to match the experimentally determined B22 values.30 Aside from the aforementioned computationally expensive methods, there are also simplified models available for calculating second osmotic virial coefficients, where proteins are represented as spheres. One widely used model is based on the colloidal DLVO (Derjaguin–Landau–Verwey–Overbeek) theory,40 which describes the interaction between proteins as a combination of spherically symmetric van der Waals forces and repulsive electrostatic interactions between charged macroions surrounded by small ions:
| W(r) = Wdisp(r) + Wel(r). | (3) |
Among protein–protein interactions, electrostatic interactions are particularly important, as the protonation states of amino acids are pH-dependent and can vary based on the local protein environment. Moreover, proteins come in a range of shapes and can exhibit significant charge anisotropy, which can impact their physicochemical properties. As a result, the behaviour of proteins in solution is influenced by a variety of solution conditions, modulating to a huge extent the electrostatic PPIs. It includes solution pH, ionic strength, and the addition of polyelectrolytes or small molecule additives. One common approach for modulating PPIs in solution is to adjust the salt concentration, which weakens repulsive electrostatic interactions. In addition, according to the Lifshitz theory of electrodynamic forces,44,45 changing the ionic strength can also have an impact on dispersion interactions, with some estimates suggesting a change of around 10% at high ionic strengths.41 However, including the effects of ionic strength on dispersion interactions is challenging, and therefore, in the majority of theoretical models dispersion interactions are assumed to be independent of ionic strength.
Most theoretical models to calculate B22 values use simplified continuum models to simulate electrostatic interactions. They are mainly based on Debye–Hückel theory. However, DH theory is an approximation, especially valid for diluted solutions at low ionic strengths (e.g. of 0.1 M), and has not been extensively tested for its validity in representing biomolecular electrostatics. Some attempts have been made to move beyond Debye–Hückel theory. Kim et al. have used a fast multipole method solved by a boundary element method to model electrostatic interactions at a residue-level coarse-grained structure.46 Song et al. have proposed the extended Debye–Hückel continuum model to improve solvation dynamics.47 In addition, Neal et al. have used Poisson–Boltzmann theory to solve the electrostatic potential between atomistically represented proteins to compute B22.11 The PB equation is a partial differential equation that describes the electrostatic potential and ion distribution around charged molecules or macromolecules in an electrolyte solution.48 It takes into account the charges on a molecule, the dielectric constant of the solvent, and the concentration of ions in the solution. It is a popular approach for calculating the electrostatic interaction of proteins and other biomolecules.48–51 However, computational cost of PB for macromolecules restricts this method only to a small number of relative protein orientations. In addition, PB theory cannot take into account ion specificity.53 Therefore, Boström et al. have modified the Poisson–Boltzmann method and incorporated ion-specific effects in spherical protein representations.38,39,52,53
Recently, we have reported the xDLVO-CG model, which is an approach to compute second osmotic virial coefficients of proteins by adapting the equations of extended DLVO (xDLVO) theory for the use on coarse-grained protein structures.54 While the xDLVO-CG model showed reasonable agreement with experimental values for B22 coefficients, some discrepancies were observed for large and irregularly-shaped proteins, such as bovine serum albumin and monoclonal antibodies. While computationally efficient, we have found that this approach may not capture molecular-level details on short protein–protein distances, accounted for in the higher resolution (computationally expensive) models.
To improve accuracy of xDLVO-CG and better model complex biological systems, we report here the xDLVO-CGhybr model, which includes modified electrostatic potential term. The xDLVO-CGhybr model employs a hybrid approach that combines Poisson–Boltzmann theory and Debye–Hückel theory to calculate the electrostatic contribution to the total interaction potential, regardless of protein size and shape. Given the computational complexity of solving PB equations for protein systems, particularly when determining second osmotic virial coefficients for diverse starting orientations, COM distances, and salt concentrations, we chose a hybrid approach. This strategy effectively balances computational efficiency and accuracy. Additionally, in the present report we also implemented a coarse-grained-based Lennard-Jones potential that is carefully parameterized to match reference all-atom potentials for accurate prediction of dispersion-based PPIs. To validate the accuracy of our model, we tested it on six different proteins with varying complexity and shape: bovine trypsin inhibitor (BPTI), ribonuclease A (RbnA), chymotrypsinogen (ChmT), concanavalin A (ConcA), bovine serum albumin (BSA) and human immunoglobulin type I (IgG1). The new implementation demonstrates improved predictions of B22 values at ionic strength of 10 mM to 1 M and arbitrary pH.
2. Theoretical background
2.1. Interaction potential in xDLVO-CGhybr model
In the xDLVO-CGhybr model, the interaction potential, denoted as W(r), is computed by summing up the electrostatic, Wel(r), dispersion, Wdisp(r), osmotic, Wosm(r), and ion-protein, Wi-pr(r) potential terms between pairs of proteins. The resulting equation for the interaction potential is:| W(r) = Wel(r) + Wdisp(r) + Wosm(r) + Wi-pr(r). | (4) |
2.2. Electrostatic interactions
The xDLVO-CGhybr model employs a hybrid approach to calculate the electrostatic interaction energy between two proteins. At short protein separations, i.e. up to R0 + 2 nm, where R0 represents the COM distance between proteins in their crystal structure, the model uses the Poisson–Boltzmann equation and all-atom protein structures to compute electrostatic interaction energy (EPB). At larger distances, the Debye–Hückel model and coarse-grained protein structures are used instead (EDB): | (5) |
 | ||
| Fig. 1 Illustration of hybrid (all-atom and coarse-grained) scheme used to calculate electrostatic interactions between proteins in xDLVO-CGhybr model. | ||
In contrast, xDLVO-CG is a purely coarse-grained model that calculates all potential terms, including the electrostatic interaction energy, using simplified shape-based CG representations without the use of the hybrid resolution, as we implemented in xDLVO-CGhybr.
The linearized Poisson–Boltzmann equation can be expressed using the following formula:51
 | (6) |
 | (7) |
In xDLVO-CGhybr, when proteins are located in close proximity to each other, the electrostatic interaction energy, EPB(r), is obtained by calculating several energy terms and their difference shown in eqn (8). Therefore, EPB(r) is the difference between the total electrostatic free energy of the protein complex and the electrostatic energies of the individual, separated proteins:
| EPB(r) = Gcomplex(r) − GProt1(r) − GProt2(r), | (8) |
When the protein separation exceeds R0 + 2 nm, electrostatic interactions are computed using the computationally less expensive Debye–Hückel model as follows:
 | (9) |
 | (10) |
2.3. The dispersion potential
In the xDLVO-CGhybr model, the dispersion interactions between proteins are calculated through either the Hamaker potential or the Lennard-Jones potential. The Hamaker potential describes the attraction forces between molecules arising from electromagnetic quantum fluctuations.44,45,56 It is derived by integrating the London dispersion forces, between two homogeneous spheres,57 and is represented by following equation: | (11) |
Furthermore, the dispersion interactions between proteins were also calculated based on the Lennard-Jones potential, represented by following equation:
 | (12) |
3. Computational details
3.1. Preparation of protein structures
The all-atom structures of proteins were taken from the protein data bank (PDB) with the codes 1bpi, 3rn3, 2cga, 3nwk, 4f5s and 1mco for bovine BPTI, RbnA, ChmT, ConcA, BSA and IgG1, respectively. The chosen PDB structures were checked if they contain the missing residues, and in case they did, they were reconstructed by the Swiss Model program.56 The protonation states of protein residues were assigned at desired pH (see in Results and Discussion) by using PROPKA method (version 3.3)48,60 and PDB2PQR online web server.61 Such starting all-atom structures of proteins were used for the PB calculation with Adaptive Poisson–Boltzmann Solver (APBS)60 on short distances (described in section 3.2), where partial charges and van der Waals radii were assigned to the atoms using the CHARMM force field.62 The protonated all-atom structures were also used for the CG mapping (with approximately 500 atoms per one bead) for all other calculations for the intermolecular distances higher than R0+ 2 nm, as depicted in Fig. 1. CG mapping was performed by using a shape-based coarse-grained model,59 implemented in the VMD program (version 1.9.3).63 Center of each bead was placed in the COM of the corresponding atoms. The bead radius was assigned to the radius of gyration, whereas the charge of the bead was calculated as a sum of partial charges of all atoms comprising the bead. Upon CG mapping of BPTI and RbnA, each protein unit was represented by 4 beads, while ChmT, ConcA, BSA, and IgG1 were represented by 8, 15, 20, and 40 beads, respectively (see Fig. S1†).3.2. Poisson–Boltzmann calculations
Adaptive Poisson–Boltzmann Solver (APBS) was used to conduct Poisson–Boltzmann calculations on all-atom protein structures studied.48,60 Specifically, it was used to solve the linearized finite difference Poisson–Boltzmann equation (lpbe). The iterative solver was initially applied on coarse grid dimensions with fewer grid points and larger size, obtained by expanding the molecular dimensions by a factor of 1.7. Subsequently, the resulting Dirichlet boundary conditions were utilised to solve the equation on a smaller region of interest using a finer grid, obtained by increasing the molecular dimensions by 20 Å. For lpbe calculations of each protein, the number of grid points, the dimensions of the coarse grid and of the fine mesh domain were set by the internal APBS script. To obtain the electrostatic binding energy of the protein complex for a specific COM distance or ionic strength, six lpbe calculations were required: two for the complex and two for each protein. These calculations were performed with the same grid spacing to ensure proper cancellation of self-solvation energies. The electrostatic interaction energy was then calculated as the difference between the electrostatic energy of the complex and the electrostatic energies of the separated proteins. APBS calculations were carried out at 20 different monovalent salt concentrations ranging from 10 mM to 1 M NaCl. Specifically, concentrations were incremented by 27 mM up to 0.2 M, and by 70 mM for concentrations exceeding 0.2 M. The sodium and chloride radii were set to 2.0 Å and 2.23 Å, respectively. For each calculation at specific salt concentration, one of the proteins was kept fixed in space, while another protein was translated along the vector connecting their COMs, by incrementing the distance by 1 Å in each step. The second protein was moved up to a distance of R0 + 2 nm from its starting COM distance R0, and APBS calculations were performed at each intermediate distance (in total 120 lpbe calculations for one concentration).Multiple Debye–Hückel boundary conditions were employed, and the molecular surface was smoothed using 9-point harmonic averaging64 with the solvent (water) probe radius set to 1.4 Å and the solvent density set to 10 quadrature points per Å.2 The cubic B-spline discretization was used to map protein charges to the grid. The internal dielectric constant of all proteins studied was set to 4.0, while the external dielectric constant was set to 78.4 (the dielectric constant of water medium).
3.3. LJ parameters for CG model
The CG beads, obtained with procedure explained in section 3.1, were assigned Rmin values equal to the radius of gyration of their constituent atoms. The sigma parameter in the LJ potential was set as Rmin = 21/6σ, and the epsilon parameters were adjusted to match the all-atom LJ potential. The all-atom LJ potential was obtained by using CHARMM36m parameters calculated on a translation trajectory created by translating proteins over vectors between COMs of protein pairs from five different relative orientations.62,65 The CG LJ potential was fitted to the all-atom potential by varying epsilon parameters using a least squares algorithm. The interaction parameters between different beads were determined using Lorentz–Berthelot combining rules.Finally, the depth of the CG LJ potential was scaled to match the Hamaker dispersion potential, as LJ parameters are usually optimised for vacuum and have a weaker effective interaction in a solvent.30,66,67 For that, we have used either AH values reported in the literature (see Table S1†) or assigned a general value of 5 kBT, i.e. according to fundamental Lifshitz theory of electrodynamic forces.44,45 Such value is characteristic to a variety of proteins. The list of parameters used for LJ scaling is given in Table S1 in the ESI.† We have to point out that the only adjustable parameter in our model is the Hamaker constant for each of the proteins (see eqn (11)).
3.4. Calculations of second osmotic virial coefficients
PMF was calculated by summing interactions between the corresponding bead pairs from each protein pair, according to eqn (4)–(12). The PMF and B22 were calculated by the in-house code, and B22 was determined by numerical integration of the PMF over different protein–protein orientations according to eqn (2). Protein–protein orientations were sampled by the procedure described in our previous work,54 except that due to higher computational cost of PB calculations at short COM distances, PMF was determined over less protein–protein configurations, i.e. by starting from 83 starting radial positions. For each starting configuration the PMF was calculated by translating proteins over vector connecting COMs of two protein pairs, up to a distance of R0 + 30 nm, where R0 is the initial distance.Additionally, to enable a comprehensive comparison of xDLVO-CGhybr with other models, we also calculated B22 values using our previously reported xDLVO-CG model,54 spherical xDLVO model16,41 and an all-atom FMAPB2 model.66 The FMAPB2 uses an all-atom protein representation in combination with an implicit solvent model and is publicly available on a web server (https://pipe.rcc.fsu.edu/fmapb2/). For xDLVO calculations, the protein charge was set to be equal to the charge obtained by PROPKA, and the protein radius was set to be equal to the experimentally determined hydrodynamic radius from the literature.
4. Results and discussion
To validate our model, we performed calculations on six diverse proteins: BPTI, RbnA, ChmT, ConcA, BSA, and IgG1. These proteins vary in size and shape, ranging from small and intermediate (BPTI, RbnA and ChmT with 58aa, 124aa and 395aa, respectively) to large (ConcA, BSA and IgG1 with 474aa, 583aa and 1287aa, respectively) proteins. Moreover, they represent either simple spherical or ellipsoidal to more irregular shapes. The structure and shape of the six proteins studied are shown in Fig. 2, along with their corresponding electrostatic maps. From the visualisation of the electrostatic maps one can notice that the proteins selected possess various degrees of positive (in blue) and negative (in red) charge localization. Some proteins in the pH given show less charge anisotropy (e.g. RbnA, Fig. 2b), while in most cases proteins possess larger differences in the surface changes. | ||
| Fig. 2 The visualisation of the structure and electrostatic maps of six proteins studied in the present work: a) bovine trypsin inhibitor (BPTI) at pH 4.9 (total charge of +6), b) ribonuclease A (RbnA) at pH 3 (total charge of +16), c) chymotrypsinogen (ChmT) at pH 3 (total charge of +17), d) concanavalin A (ConcA) at pH 4 (total charge of +25), e) bovine serum albumin (BSA) at pH 7.4 (total charge of −16), and f) human immunoglobulin type 1 (IgG1) at pH 6.5 (total charge of +27). The protein surface is coloured according to the electrostatic potential calculated by APBS, with blue, red and white colours indicating regions of excess positive, negative and neutral charges respectively. The sizes of the proteins in the illustrations are not to scale, but are depicted for viewer convenience. | ||
Given the diverse characteristics of these six proteins in terms of their size and shape, as well as the availability of experimentally measured data for their second osmotic virial coefficients, we regard this dataset as a suitable basis for validating the accuracy and applicability of the xDLVO-CGhybr model. We compared the calculated results to the experimental B22 values reported in the literature. The results section is organised as follows: first, we discuss the impact of employing the hybrid Poisson–Boltzmann/Debye–Hückel scheme and the criteria for switching between models. Next, we present B22 calculations with the new method developed and validate results in comparison with experimental data and other models. In the end, we briefly discuss the impact of including Lennard-Jones interactions versus Hamaker dispersion potential on the accuracy of calculations.
4.1. Poisson–Boltzmann and Debye–Hückel approaches in xDLVO-CGhybr
In this study, we aimed to improve the accuracy of the electrostatic part of the PMF reported in xDLVO-CG by using a hybrid approach based on Poisson–Boltzmann and Debye–Hückel theory. Specifically, we employed PB calculations on all-atom structures at short COM distances, and Debye–Hückel calculations on coarse-grained structures at larger COM distances, as depicted in Fig. 1. To demonstrate criteria used for the linking of two different methods, the comparison of the electrostatic energy term of interactions between two different proteins: BPTI and IgG1 using PB and DH has been performed, as illustrated in Fig. 3. The results are plotted as a function of the COM distance between the two proteins and the vertical dashed orange line indicates the point at which the electrostatic potential in the xDLVO-CGhybr model switches from PB to DH. | ||
| Fig. 3 Comparison of calculated energy of electrostatic interactions at 10 mM NaCl between a) two BPTI and b) two IgG1 proteins by solving Poisson–Boltzmann equations (applied to the full all-atom structure of proteins) and by using Debye–Hückel theory (applied to the coarse-grained model of proteins). The vertical dashed orange line indicates the COM distance (at R0 + 2 nm), where electrostatic potential in xDLVO-CGhybr is switched from Poisson–Boltzman to Debye–Hückel model. | ||
The analysis of IgG1 and BPTI revealed that the largest differences are observed at short COM distances, i.e. around 2 nm from the position of the proteins in their crystal structure. Note that the COM between BPTI and IgG1 in the crystal is 2.41 nm and 7 nm, respectively. The energies are fairly similar at larger protein separations. This indicates that DH theory cannot properly describe repulsion interactions between proteins on shorter distances. At these distances, repulsion energy obtained by using the Debye–Hückel model is generally smaller than those obtained by PB theory, i.e. by a factor of three to five or more. This conclusion applies to all proteins studied (see Fig. S2†). A smooth transition from PB to Debye–Hückel potential was observed at intermediate COM distances that are on average of R0 + 2 nm. For this reason, we implemented different integration schemes that switch at this distance. The Debye–Hückel equation is an analytical solution of the PB equation for interaction between two homogeneously charged spheres of equal radius. It gets more approximative, while using it for other cases.
The larger deviation between these two models at short separations is expected because specific (local) residue–residue interactions can be better described by all-atom protein representation and PB theory. At the protein–protein interface, the effective dielectric constant can shift from the solvent to the protein interior. As a result, these residues effectively interact as if they belong to the same protein within its low dielectric environment. This results in a higher repulsive charge–charge interaction than if they were placed in a solvent medium. As the protein–protein separation increases, residues become more solvated, thus beginning to feel the dielectric environment of the solvent, reducing repulsion.68 The effects of dielectric discontinuity become significant only at separations less than Debye length.
The PB numerical methods determine the dielectric constant by rolling a solvent sphere with its probe radius over the protein surface, which distinguishes the solvent region from the protein interior region, each having a different dielectric constant. Therefore, the electrostatic interactions between proteins depend greatly on their unique shape and charge distribution. The energy of polarisation, arising from the dielectric interface (as described in the second term of eqn (7)), is affected mostly by partial atomic charges located near the surface. These factors, along with others, contribute significantly to the interaction energy and are better described by PB theory49 than by DH. We found that the new hybrid approach in xDLVO-CGhybr provides fairly accurate modelling of electrostatic effects, which should lead to better agreement of second osmotic coefficients in comparison to experiments in comparison to previously reported methods.
4.2. Calculation of B22 coefficients for small sized proteins
Fig. 4b presents the calculated B22 coefficients for BPTI at pH 4.9 using xDLVO-CGhybr, in comparison to xDLVO-CG, FMAPB2, and xDLVO models. The calculated values at low and medium salt concentrations decrease faster towards negative values of B22 (i.e. stronger attractive interactions) with increasing ionic strength using xDLVO and xDLVO-CG methods. Theoretically determined B22 data points, derived using the xDLVO-CGhybr model, cross zero at approximately 0.42 M, following a similar trend to the experimental data. Calculated values of B22 coefficients show nearly quantitative agreement with experimental results of Farnum et al., who performed static light experiments to measure the experimental B22 values.70 To the best of our knowledge, no other experimental B22 measurements were performed on BPTI protein. In comparison, the B22 values obtained using xDLVO-CG are shifted more to the negative values. The zero-crossing point is located at a lower ionic strength of 0.36 M NaCl. B22 values calculated with FMAPB2 correlate with xDLVO-CGhybr results and match with experimental data at most of the points except at the lowest ionic strength of 0.3 M. At this ionic strength, the FMAPB2 model results in a B22 value of −2.05 × 10⁻⁵ mol ml g−2, while the experimentally determined value is 3.32 × 10⁻⁴ mol ml g−2. xDLVO-CGhybr gives a value of 3.32 × 10⁻⁴ mol ml g−2. Differences between calculations made with these two different methods differ more at lower ionic strengths. Given the lack of available experimental measurements, it is hard to judge which model performs better at low salt conditions. In general, both xDLVO-CGhybr and FMAPB2 follow experimentally obtained trends better than other methods.
 | ||
| Fig. 4 Visualisation of BPTI (a) and RbnA (c) proteins using the coarse-grained model implemented in xDLVO-CGhybr. The new cartoon representation of all-atom proteins is given for clarity. Calculated B22 coefficients for BPTI at pH 4.9 (b) and RbnA at pH 3 and pH 4 (upper and lower panel) (d) as a function of NaCl concentration. B22 values are compared with the values obtained with xDLVO-CG (dashed red), FMAPB2 (dashed orange) and xDLVO (green dots) models and experimental results (red circles). | ||
The xDLVO model overestimates the B22 values and is out of range of experimental values except at the first point. From Fig. 2a, we see that at pH 4.9, the protein has a relatively high charge as for its small size (+6 according to the PROPKA method). Fig. S1a† shows that BPTI has mostly positive local charge distribution which contributes to high electrostatic repulsion, necessitating an intermediate salt concentration to screen electrostatic interactions and shift protein–protein interactions from repulsive to attractive ones. This may be the reason for the poorer description of electrostatic PPIs in xDLVO. It should be mentioned that other researchers, such as Mereghetti et al., have employed also Brownian dynamics simulations to calculate the second osmotic virial coefficients of BPTI solutions.34 There, they have used an all-atom protein representation, aiming to compute B22 and diffusion coefficients, however they could only achieve a semi-quantitative agreement with experimental data.
 | ||
| Fig. 5 Changes of the PMF of BPTI at pH 4.9 with increasing NaCl concentration using xDLVO-CGhybr (a). Comparison of the PMF at 1 M NaCl obtained by xDLVO-CGhybr and xDLVO-CG models (b). | ||
As the ionic strength increases, the repulsion between proteins is diminished due to electrostatic screening, resulting in decrease of B22 coefficients. At the highest salt concentration (1 M NaCl), the experimentally determined B22 value is −2.70 × 10⁻⁶ mol ml g−2, while the value calculated using the xDLVO-CGhybr model is −2.72 × 10⁻⁶ mol ml g−2. This shows a good agreement of data and indicates that the B22 coefficient is close to the zero-crossing point. Such a small value of B22 is insufficient to indicate sufficiently strong attractive PPIs, thus aggregation should happen at higher ionic strengths. The B22 values calculated at pH 4 using xDLVO-CGhybr follow a similar trend, but they are slightly shifted towards negative values, i.e. more prone aggregation, due to a decrease in protein charge (+16 and +13 at pH 3 and pH 4, respectively). Calculated values of B22 at pH 4 also show repulsive interactions at almost all salt concentrations considered. They agree nearly quantitatively with experimental data, except at the first two points at low ionic strength. From Fig. 4d, it is evident that increasing the ionic strength up to 1 M NaCl is not sufficient to shift PPIs in RbnA towards attraction since B22 does not cross the zero-point. The reason behind the repulsive interactions in this case is the high protein charge of RbnA, despite its small size. The distribution of positive charges throughout the protein is uniform (see Fig. S1b†), without any significant charge anisotropy that can reduce the electrostatic repulsion.
In comparison to the xDLVO-CGhybr, B22 values obtained from the xDLVO-CG model are slightly higher at low salt concentrations (below 0.3 M NaCl). They shift towards negative values at higher salt concentrations, resulting in larger discrepancies from experimental data. The FMAPB2 model exhibits a similar trend to xDLVO-CG calculations until around 0.2 M NaCl, but at higher ionic strengths, FMAPB2 fails to reproduce experimental trends of B22 of RbnA. The data indicate strong attractive interactions and fast decrease of B22, which is not observed in experiment. B22 calculated with the xDLVO model fall outside the range of experimental values and the values calculated with xDLVO-CG and xDLVO-CGhybr. The positive shift throughout the entire salt concentration range is visible (see Fig. 4d), except at the highest ionic strength where it matches experimental data. This demonstrates once again that the proper representation of the protein shape is important for the B22 calculation. Since RbnA is far away from the spheric form (see Fig. 2b), standard DLVO methods cannot result in good agreements with experiments.
4.3. Calculation of B22 coefficients for medium-sized proteins
 | ||
| Fig. 6 Visualisation of ChmT (a) and ConcA (c) proteins using the coarse-grained model implemented in xDLVO-CGhybr. The new cartoon representation of all-atom proteins is given for clarity. Calculated B22 coefficients by using xDLVO-CGhybr model and experimental results for ChmT at pH 3 (b). Data calculated by xDLVO-CG, FMAPB2 and xDLVO are marked by dashed red, dashed orange and green dots, respectively. B22 coefficients for ConcA at pH 4 and pH 5 (d) in comparison with reported experimental data. | ||
Since ConcA predominantly exists as a dimer at the acidic pH range considered, calculations were performed between pairs of dimers (depicted in Fig. 6c). The experimental B22 measurements revealed that ConcA exhibits attractive PPIs, which cross the zero point at approximately 0.12 M NaCl.7 The B22 coefficients calculated by the FMAPB2 and xDLVO models did not align with the experimental data and have therefore been omitted from the graph presented in Fig. 6d for simplicity (instead, see Fig. S3†). Our results show that both xDLVO-CGhybr and xDLVO-CG models can reproduce the general trends of experimental data and, more importantly, properly account repulsion interactions between dimers of ConcA in low ionic strengths, allowing to properly estimate its solubility and conditions, where aggregation happens. Overall, attractive interactions between proteins in solution are also well accounted for, however only till ca. 0.25 M NaCl. At higher salt concentrations, the agreement between theoretically and experimentally determined values is less quantitative than we have observed for other proteins.
At pH 4, the xDLVO-CG values are more positive than values reported in experiment, i.e. contribution of repulsion electrostatics is stronger than in other cases. The implementation of the new algorithm, where the electrostatic interactions are calculated on the smaller distances between proteins using PB, has significantly improved the quality of the B22 values, i.e. xDLVO-CGhybr model outperforms xDLVO-CG in this case. However, at pH 5, the xDLVO-CG model provides a nearly quantitative match with the experimentally measured data, therefore the performance of both methods shows the dependence on the pH used, which directly impacts the electrostatic potential on the protein surface. Nonetheless, since the xDLVO-CG model performs well only at one pH value, the strong agreement at pH 5 is more likely to be a coincidence than a systematic indication of its predictive capability. Therefore, we assume that limitations of the xDLVO-CGhybr model for the ConcA protein could be attributed to several factors. Firstly, the uncertainty in the correspondence between the protein charges assigned by the PROPKA method and the actual physical charges. Secondly, the ability of the protein to specifically absorb certain ions, which can alter its effective charge, is not accounted for in this model. Third, the ConcA protein and its dimer possess some degree of conformational flexibility80–82 as a function of pH, which cannot be accounted for in our model which considers proteins like rigid bodies.
4.4. B 22 calculations for large proteins
 | ||
| Fig. 7 Visualisation of BSA (a) and IgG1 (c) proteins using the coarse-grained model implemented in xDLVO-CGhybr. The new cartoon representation of all-atom proteins is given for clarity. Calculated B22 coefficients for BSA at pH 7.4 (b) and IgG1 at pH 6.5 (d) as a function of NaCl concentration. Due to the computational cost of PB, twenty salt concentrations were used for the calculation of IgG1 in xDLVO-CGhybr. B22 values are compared with the values obtained with xDLVO-CG (dashed red), FMAPB2 (dashed orange) and xDLVO (green dots) models and experimental results (circles and triangles). | ||
As shown in Fig. 7b, calculations with xDLVO-CGhybr model yield significantly improved results compared to previous calculations using the xDLVO-CG model.54 Calculated B22 values match the experimental values of Ma et al.26 much better and keep the repulsive character of PPIs up to 1 M NaCl, following experimental trends. While at higher salt concentrations, the data calculated with xDLVO-CGhybr closely resembles the FMAPB2 data (based on all-atom structure of proteins), at lower ionic strengths, xDLVO-CGhybr exhibits significantly lower deviations from the experimentally measured values, indicating its better performance. In contrast, at NaCl salt concentration above 0.1 M, the spherical xDLVO model fails to properly reproduce B22 coefficients. The calculated values are decreasing abruptly towards the negative range, incorrectly predicting strong aggregation of BSA at these conditions. This highlights the limitations of simple spherical models like (x)DLVO in predicting the behaviour of complex proteins like BSA. Therefore, such models rely heavily on fitted parameters to achieve quantitative agreement with experimental data. On the contrary, with hybrid treatment of the electrostatic interactions between proteins in the developed xDLVO-CGhydr model, the behaviour of BSA, in solutions under both low and high ionic strength conditions, are accurately predicted. This finding underscores the importance of developing more advanced models that incorporate the structural and dynamic complexities of proteins to better understand their behaviour in various environments.
The B22 data calculated by xDLVO-CGhybr model, along with other models (refer to Fig. 7d), exhibit closer agreement with the experimental values reported by Roberts et al.86 compared to the findings reported by Le Brun et al.5 In the latter case, the higher B22 values indicate stronger repulsion interactions between proteins. In comparison to the xDLVO-CG model, yielding values that were closer to the experimentally determined ones and similar to those obtained using the all-atom FMAPB2 model,54 a clear improvement in the calculation of the second osmotic virial coefficients by the new model is visible (marked with the black line in Fig. 7d). In contrast, the simplified xDLVO model yielded data that are completely outside the experimental range, further highlighting its limited predictive power for large and irregular proteins.
IgG1 is the largest protein we have studied, and its complex shape highlights the need for more rigorous theoretical approaches to obtain more quantitative results. Still, we observe that improvement of the accuracy of the electrostatic interactions and the anisotropy of the protein shape refine the theoretical calculation of the B22 coefficients. Moreover, more experimental data points of B22 in diverse conditions would increase the validation set for future predictions. Several studies have been conducted using DLVO or xDLVO to model second osmotic coefficients of monoclonal antibodies in different solution conditions,27,33 as well as to study its PPIs at higher protein concentrations.87 These studies typically involved the use of various levels of coarse graining, and the models were often based on direct parametrization from experimental data.
4.5. Modelling dispersion interactions: comparing Hamaker and Lennard-Jones potentials
The interaction between two molecules, as proposed by the Lifshitz theory of van der Waals forces, is rooted in the dipole field created by quantum fluctuations.44,88 This results in mutual polarisation between molecules and with the solvent, giving rise to net attractive dispersion interactions.44,45,56 The McLachlan formulation, which involves excess polarizability and dielectric permittivities at imaginary frequencies, can be used to calculate these interactions. However, modelling dispersion interactions is challenging, and the widely used Hamaker potential, which involves integrating the attractive part of Lennard-Jones potential between two homogeneous spheres, offers a simplified approach.57 Nevertheless, determining the Hamaker constant according to Lifshitz–McLachlan theory is practically limited due to the requirement to know optical properties such as refractive indices and dielectric functions of proteins and solvent media.89 As a result, other approaches are typically used in practice, such as fitting the Hamaker constant from experiments or using Lennard-Jones potential. Using Lennard-Jones parameters from all-atom force fields can result in interactions that are overly attractive, leading to overestimated assembly, i.e. negative B22 values. Empirical factors ranging from 0.1 to 0.3, which depend on the protein system being studied, are often used to scale these interactions.11,32,66,67 Some researchers have attempted a hybrid approach, using LJ potential at short distances and Hamaker potential at larger distances, while scaling the LJ potential with an empirical factor to enable a smooth transition between potentials.67In the present study, we have utilised LJ potentials to calculate dispersion interactions between proteins. They were scaled to match the depth of interaction of Hamaker potential with AH obtained from literature (see Table S1†). To show the difference in the B22 calculation using LJ and Hamaker dispersion potentials, in Fig. 8 we demonstrate results for BPTI and IgG1 proteins using both approaches. We have observed that both LJ and Hamaker potential give similar B22 values, and correlate well with experimental data. While Hamaker potential is more convenient to use since it does not require additional parametrization, Lennard-Jones potential can better model anisotropy of dispersion interactions caused by protein orientations. Therefore, it may be preferable to use LJ potential in cases where more accurate and quantitative modelling is required.
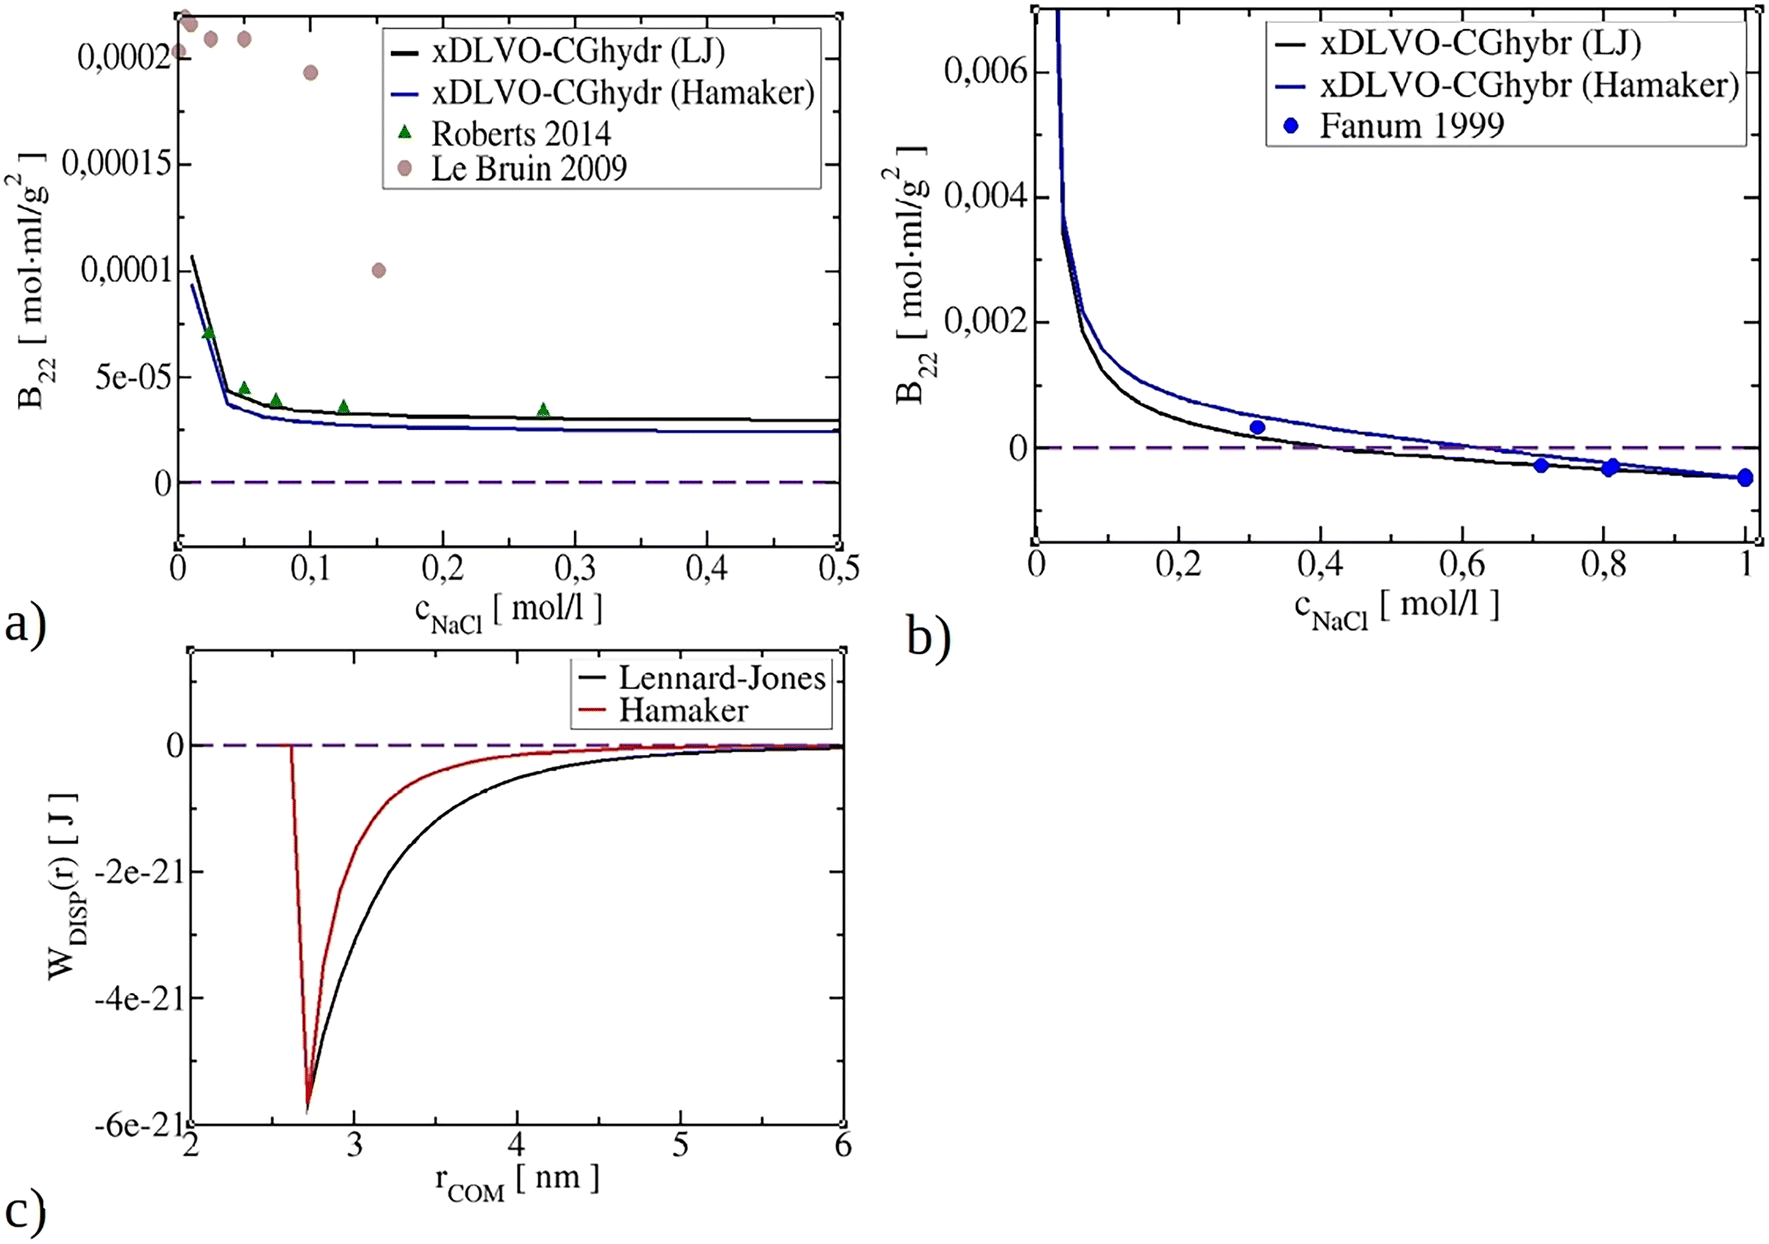 | ||
| Fig. 8 Impact of modelling dispersion interactions (Lennard-Jones or Hamaker dispersion) on the value of the B22 coefficients for IgG1 (a), BPTI (b). Comparison of Lennard-Jones versus Hamaker potential for BPTI (c). | ||
It is important to note that current B22 models rely on the depth of dispersion interactions either through Hamaker constant or LJ scaling factor, thus, require further advancements in the field, particularly in simplifying the determination of dispersion interactions and Hamaker constants using Lifshitz–McLachlan theory for any protein system. These developments would greatly benefit predictive screening of solution conditions for desired protein phase behaviour. Finally, our results suggest that accurately evaluating electrostatic interactions is more crucial for improving the overall predictive power of the model, while the choice between Hamaker or Lennard-Jones potentials has less impact.
Conclusions
In conclusion, we have developed the xDLVO-CGhybr model to accurately calculate the second osmotic virial coefficients of proteins at different pH as a function of the monovalent salt concentration. The new model represents a significant improvement over our previously reported xDLVO-CG model. By using a hybrid approach that combines Poisson–Boltzmann and Debye–Hückel theories, xDLVO-CGhybr more properly calculates the electrostatic contribution to the total interaction potential between proteins of arbitrary size and shape. Additionally, we have introduced a carefully parameterized coarse-grained Lennard-Jones potential in the PMF that enables accurate predictions of dispersion-based PPIs matched to the reference all-atom potentials.To validate the accuracy of the model, we conducted extensive tests on six different proteins, ranging from small molecules like BPTI to large and complex proteins such as IgG1. Our results showed that the xDLVO-CGhybr model outperformed other theoretical models, such as xDLVO and FMAPB2, giving improved predictions of the B22 values. It enables the assessment of protein stability, solubility, and precise solubility calculations at different concentrations, pH values, and ionic strengths. These results demonstrate the potential of the xDLVO-CGhybr model as a reliable tool for studying protein interactions and the behaviour of proteins in solution, particularly in the context of pharmaceutical and biotechnological applications. Moreover, the results obtained underscore the crucial role of accurate modelling of electrostatic interactions in determining overall PPIs in solution and the calculation of the B22 coefficients.
However, the xDLVO-CGhybr model does have certain limitations. It assumes rigid protein structures based on the available PDB database structures, while proteins in solution can undergo conformational changes that affect their interactions with other molecules. Additionally, the model's accuracy is influenced by the available protonation schemes, which may not fully capture the pH dependence of protein–protein interactions. Addressing these limitations and exploring alternative models that incorporate flexible structures and improved protonation schemes could enhance the accuracy and versatility of the model. Therefore, future developments may focus on advancing the xDLVO-CGhybr model by implementing advanced orientational sampling techniques that could efficiently explore relevant relative protein orientations, further improving predictions. Additionally, the integration of machine learning algorithms could enhance the speed and accuracy of the computation of interaction potential, expanding the model's scope and enabling more efficient exploration of parameter space.
Author contributions
Conceptualization: S. P., W. W. and M. K.; methodology: S. P., W. W. and M. K.; software, S. P.; validation: S. P. and M. K.; formal analysis: S. P. and M. K.; investigation: S. P.; resources: W. W.; data curation: S. P.; writing – original draft preparation: S. P. and M. K.; writing – review and editing: S. P., W. W. and M. K.; visualisation: S. P.; supervision: W. W. and M. K.; project administration: M. K.; funding acquisition: W. W. All authors have read and agreed to the published version of the manuscript.Conflicts of interest
There are no conflicts to declare.Acknowledgements
This research has been funded by Deutsche Forschungsgemeinschaft (DFG) SPP priority programme DiSPBiotech (SPP1934, project number WE1863/30-2). W. W. and M. K. acknowledge funding by the DFG under the GRK 2450 “Scale bridging methods of computational nanoscience”.References
- G. Chiesa, S. Kiriakov and A. S. Khalil, BMC Biol., 2020, 18, 35 CrossRef PubMed.
- I. M. A. Nooren, EMBO J., 2003, 22, 3486–3492 CrossRef CAS PubMed.
- M. E. M. Cromwell, E. Hilario and F. Jacobson, AAPS J., 2006, 8, E572–E579 CrossRef CAS PubMed.
- A. C. A. Roque, C. R. Lowe and M. A. Taipa, Biotechnol. Prog., 2004, 20, 639–654 CrossRef CAS PubMed.
- V. Le Brun, W. Friess, S. Bassarab, S. Mühlau and P. Garidel, Eur. J. Pharm. Biopharm., 2010, 75, 16–25 CrossRef CAS PubMed.
- P. Braun and A.-C. Gingras, Proteomics, 2012, 12, 1478–1498 CrossRef CAS PubMed.
- A. Quigley and D. R. Williams, Eur. J. Pharm. Biopharm., 2015, 96, 282–290 CrossRef CAS PubMed.
- S. D. Durbin and G. Feher, Annu. Rev. Phys. Chem., 1996, 47, 171–204 CrossRef CAS PubMed.
- R.-B. Zhou, H.-L. Cao, C.-Y. Zhang and D.-C. Yin, CrystEngComm, 2017, 19, 1143–1155 RSC.
- D. Leckband and S. Sivasankar, Colloids Surf., B, 1999, 14, 83–97 CrossRef CAS.
- B. L. Neal, D. Asthagiri and A. M. Lenhoff, Biophys. J., 1998, 75, 2469–2477 CrossRef CAS PubMed.
- M. J. Uttinger, C. S. Hundschell, V. Lautenbach, S. Pusara, S. Bäther, T. R. Heyn, J. K. Keppler, W. Wenzel, J. Walter, M. Kozlowska, A. M. Wagemans and W. Peukert, Soft Matter, 2022, 18, 6739–6756 RSC.
- W. G. McMillan and J. E. Mayer, J. Chem. Phys., 1945, 13, 276–305 CrossRef CAS.
- L. F. M. Franco and P. de A. Pessôa Filho, Braz. J. Chem. Eng., 2013, 30, 95–104 CrossRef CAS.
- S. Ruppert, S. I. Sandler and A. M. Lenhoff, Biotechnol. Prog., 2001, 17, 182–187 CrossRef CAS PubMed.
- M. Herhut, C. Brandenbusch and G. Sadowski, Fluid Phase Equilib., 2016, 422, 32–42 CrossRef CAS.
- A. George, Y. Chiang, B. Guo, A. Arabshahi, Z. Cai and W. W. Wilson, in Methods in Enzymology, Elsevier, 1997, vol. 276, pp. 100–110 Search PubMed.
- B. Guo, S. Kao, H. McDonald, A. Asanov, L. L. Combs and W. W. Wilson, J. Cryst. Growth, 1999, 196, 424–433 CrossRef CAS.
- A. C. Dumetz, A. M. Snellinger-O'Brien, E. W. Kaler and A. M. Lenhoff, Protein Sci., 2007, 16, 1867–1877 CrossRef CAS PubMed.
- M. Kastelic and V. Vlachy, J. Phys. Chem. B, 2018, 122, 5400–5408 CrossRef CAS PubMed.
- J. Valente, R. Payne, M. Manning, W. Wilson and C. Henry, Curr. Pharm. Biotechnol., 2005, 6, 427–436 CAS.
- A. George and W. W. Wilson, Acta Crystallogr., Sect. D: Biol. Crystallogr., 1994, 50, 361–365 CrossRef CAS PubMed.
- C. Ersch, L. L. C. Meijvogel, E. van der Linden, A. Martin and P. Venema, Food Hydrocolloids, 2016, 52, 982–990 CrossRef CAS.
- O. D. Velev, E. W. Kaler and A. M. Lenhoff, Biophys. J., 1998, 75, 2682–2697 CrossRef CAS PubMed.
- F. Bonneté, S. Finet and A. Tardieu, J. Cryst. Growth, 1999, 196, 403–414 CrossRef.
- Y. Ma, D. M. Acosta, J. R. Whitney, R. Podgornik, N. F. Steinmetz, R. H. French and V. A. Parsegian, J. Biol. Phys., 2015, 41, 85–97 CrossRef CAS PubMed.
- D. Roberts, R. Keeling, M. Tracka, C. F. van der Walle, S. Uddin, J. Warwicker and R. Curtis, Mol. Pharmaceutics, 2014, 11, 2475–2489 CrossRef CAS PubMed.
- B. L. Neal, D. Asthagiri, O. D. Velev, A. M. Lenhoff and E. W. Kaler, J. Cryst. Growth, 1999, 196, 377–387 CrossRef CAS.
- D. J. Scott, T. R. Patel and D. J. Winzor, Anal. Biochem., 2013, 435, 159–165 CrossRef CAS PubMed.
- A. C. Stark, C. T. Andrews and A. H. Elcock, J. Chem. Theory Comput., 2013, 9, 4176–4185 CrossRef CAS PubMed.
- L. J. Quang, S. I. Sandler and A. M. Lenhoff, J. Chem. Theory Comput., 2014, 10, 835–845 CrossRef CAS PubMed.
- A. Grünberger, P.-K. Lai, M. A. Blanco and C. J. Roberts, J. Phys. Chem. B, 2013, 117, 763–770 CrossRef PubMed.
- C. Calero-Rubio, A. Saluja and C. J. Roberts, J. Phys. Chem. B, 2016, 120, 6592–6605 CrossRef CAS PubMed.
- P. Mereghetti, R. R. Gabdoulline and R. C. Wade, Biophys. J., 2010, 99, 3782–3791 CrossRef CAS PubMed.
- S. R. McGuffee and A. H. Elcock, J. Am. Chem. Soc., 2006, 128, 12098–12110 CrossRef CAS PubMed.
- M. Lund and B. Jönsson, Biophys. J., 2003, 85, 2940–2947 CrossRef CAS PubMed.
- A. Jost Lopez, P. K. Quoika, M. Linke, G. Hummer and J. Köfinger, J. Phys. Chem. B, 2020, 124, 4673–4685 CrossRef CAS PubMed.
- M. Boström, F. W. Tavares, B. W. Ninham and J. M. Prausnitz, J. Phys. Chem. B, 2006, 110, 24757–24760 CrossRef PubMed.
- M. Boström, F. W. Tavares, S. Finet, F. Skouri-Panet, A. Tardieu and B. W. Ninham, Biophys. Chem., 2005, 117, 217–224 CrossRef PubMed.
- E. Hückel, in Ergebnisse der exakten naturwissenschaften, Springer Berlin Heidelberg, Berlin, Heidelberg, 1924, vol. 3, pp. 199–276 Search PubMed.
- D. E. Kuehner, H. W. Blanch and J. M. Prausnitz, Fluid Phase Equilib., 1996, 116, 140–147 CrossRef CAS.
- M. Herhut, C. Brandenbusch and G. Sadowski, Biotechnol. J., 2016, 11, 146–154 CrossRef CAS PubMed.
- M. Schleinitz, D. Teschner, G. Sadowski and C. Brandenbusch, J. Mol. Liq., 2019, 283, 575–583 CrossRef CAS.
- E. M. Lifshitz and M. Hamermesh, in Perspectives in Theoretical Physics, Elsevier, 1992, pp. 329–349 Search PubMed.
- J. Laven and J. P. C. Vissers, Colloids Surf., A, 1999, 152, 345–355 CrossRef CAS.
- B. Kim and X. Song, Phys. Rev. E, 2011, 83, 011915 CrossRef PubMed.
- X. Song, J. Chem. Phys., 2009, 131, 044503 CrossRef PubMed.
- N. A. Baker, D. Sept, S. Joseph, M. J. Holst and J. A. McCammon, Proc. Natl. Acad. Sci. U. S. A., 2001, 98, 10037–10041 CrossRef CAS PubMed.
- P. Ren, J. Chun, D. G. Thomas, M. J. Schnieders, M. Marucho, J. Zhang and N. A. Baker, Q. Rev. Biophys., 2012, 45, 427–491 CrossRef PubMed.
- N. A. Baker, in Methods in Enzymology, Elsevier, 2004, vol. 383, pp. 94–118 Search PubMed.
- N. A. Baker, Curr. Opin. Struct. Biol., 2005, 15, 137–143 CrossRef CAS PubMed.
- M. Boström, F. W. Tavares, D. Bratko and B. W. Ninham, J. Phys. Chem. B, 2005, 109, 24489–24494 CrossRef PubMed.
- E. R. A. Lima, E. C. Biscaia, M. Boström, F. W. Tavares and J. M. Prausnitz, J. Phys. Chem. C, 2007, 111, 16055–16059 CrossRef CAS.
- S. Pusara, P. Yamin, W. Wenzel, M. Krstić and M. Kozlowska, Phys. Chem. Chem. Phys., 2021, 23, 12780–12794 RSC.
- S. Asakura and F. Oosawa, J. Polym. Sci., 1958, 33, 183–192 CrossRef CAS.
- S. Damodaran, Biochemistry, 2013, 52, 8363–8373 CrossRef CAS PubMed.
- H. C. Hamaker, Physica, 1937, 4, 1058–1072 CrossRef CAS.
- S. Damodaran, Langmuir, 2012, 28, 9475–9486 CrossRef CAS PubMed.
- A. Arkhipov, P. L. Freddolino and K. Schulten, Structure, 2006, 14, 1767–1777 CrossRef CAS PubMed.
- E. Jurrus, D. Engel, K. Star, K. Monson, J. Brandi, L. E. Felberg, D. H. Brookes, L. Wilson, J. Chen, K. Liles, M. Chun, P. Li, D. W. Gohara, T. Dolinsky, R. Konecny, D. R. Koes, J. E. Nielsen, T. Head-Gordon, W. Geng, R. Krasny, G. Wei, M. J. Holst, J. A. McCammon and N. A. Baker, Protein Sci., 2018, 27, 112–128 CrossRef CAS PubMed.
- T. J. Dolinsky, P. Czodrowski, H. Li, J. E. Nielsen, J. H. Jensen, G. Klebe and N. A. Baker, Nucleic Acids Res., 2007, 35, W522–W525 CrossRef PubMed.
- J. Huang, S. Rauscher, G. Nawrocki, T. Ran, M. Feig, B. L. de Groot, H. Grubmüller and A. D. MacKerell, Nat. Methods, 2017, 14, 71–73 CrossRef CAS PubMed.
- W. Humphrey, A. Dalke and K. Schulten, J. Mol. Graphics, 1996, 14, 33–38 CrossRef CAS PubMed.
- S. T. Kottmann, Theor. Chem. Acc., 2008, 119, 421–427 Search PubMed.
- M. J. Abraham, T. Murtola, R. Schulz, S. Páll, J. C. Smith, B. Hess and E. Lindahl, SoftwareX, 2015, 1–2, 19–25 Search PubMed.
- S. Qin and H.-X. Zhou, J. Phys. Chem. B, 2019, 123, 8203–8215 CrossRef CAS PubMed.
- D. Asthagiri, B. L. Neal and A. M. Lenhoff, Biophys. Chem., 1999, 78, 219–231 CrossRef CAS PubMed.
- F. Pizzitutti, M. Marchi and D. Borgis, J. Chem. Theory Comput., 2007, 3, 1867–1876 CrossRef CAS PubMed.
- P. Ascenzi, A. Bocedi, M. Bolognesi, A. Spallarossa, M. Coletta, R. Cristofaro and E. Menegatti, Curr. Protein Pept. Sci., 2003, 4, 231–251 CrossRef CAS PubMed.
- M. Farnum and C. Zukoski, Biophys. J., 1999, 76, 2716–2726 CrossRef CAS PubMed.
- K. A. Dickson, M. C. Haigis and R. T. Raines, in Progress in Nucleic Acid Research and Molecular Biology, Elsevier, 2005, vol. 80, pp. 349–374 Search PubMed.
- P. M. Tessier, H. R. Johnson, R. Pazhianur, B. W. Berger, J. L. Prentice, B. J. Bahnson, S. I. Sandler and A. M. Lenhoff, Proteins: Struct., Funct., Bioinf., 2002, 50, 303–311 CrossRef PubMed.
- K. A. Walsh and H. Neurath, Proc. Natl. Acad. Sci. U. S. A., 1964, 52, 884–889 CrossRef CAS PubMed.
- P. M. Tessier, A. M. Lenhoff and S. I. Sandler, Biophys. J., 2002, 82, 1620–1631 CrossRef CAS PubMed.
- H. Bajaj, V. K. Sharma and D. S. Kalonia, Biophys. J., 2004, 87, 4048–4055 CrossRef CAS PubMed.
- P. E. Pjura, A. M. Lenhoff, S. A. Leonard and A. G. Gittis, J. Mol. Biol., 2000, 300, 235–239 CrossRef CAS PubMed.
- H.-G. Schiefer, H. Krauss, H. Brunner and U. Gerhardt, J. Bacteriol., 1975, 124, 1598–1600 CrossRef CAS PubMed.
- D. F. Senear and D. C. Teller, Biochemistry, 1981, 20, 3076–3083 CrossRef CAS PubMed.
- T. T. Herskovits, R. Jacobs and K. Nag, Biochim. Biophys. Acta, Protein Struct. Mol. Enzymol., 1983, 742, 142–154 CrossRef CAS PubMed.
- G. H. McKenzie, W. H. Sawyer and L. W. Nichol, Biochim. Biophys. Acta, Protein Struct., 1972, 263, 283–293 CrossRef CAS PubMed.
- H. E. Auer and T. Schilz, Int. J. Pept. Protein Res., 2009, 24, 462–471 Search PubMed.
- S. H. Koenig, R. D. Brown, C. F. Brewer and A. D. Sherry, Biochem. Biophys. Res. Commun., 1982, 109, 1047–1053 CrossRef CAS PubMed.
- T. Topală, A. Bodoki, L. Oprean and R. Oprean, Med. Pharm. Rep., 2014, 87, 215–219 Search PubMed.
- Y. Park and G. Choi, Korean J. Chem. Eng., 2009, 26, 193–198 CrossRef CAS.
- M. S. Castelli, P. McGonigle and P. J. Hornby, Pharmacol. Res. Perspect., 2019, 7(6), e00535 Search PubMed.
- D. Roberts, R. Keeling, M. Tracka, C. F. van der Walle, S. Uddin, J. Warwicker and R. Curtis, Mol. Pharmaceutics, 2015, 12, 179–193 CrossRef CAS PubMed.
- C. Calero-Rubio, R. Ghosh, A. Saluja and C. J. Roberts, J. Pharm. Sci., 2018, 107, 1269–1281 CrossRef CAS PubMed.
- C. M. Roth and A. M. Lenhoff, J. Colloid Interface Sci., 1996, 179, 637–639 CrossRef CAS.
- J.-L. Li, J. Chun, N. S. Wingreen, R. Car, I. A. Aksay and D. A. Saville, Phys. Rev. B: Condens. Matter Mater. Phys., 2005, 71, 235412 CrossRef.
Footnote |
| † Electronic supplementary information (ESI) available. See DOI: https://doi.org/10.1039/d3me00086a |
| This journal is © The Royal Society of Chemistry 2023 |