
 Open Access Article
 This Open Access Article is licensed under a Creative Commons Attribution-Non Commercial 3.0 Unported Licence
A novel bio-electrochemical sensor based on a 1,4-bis(triphenylphosphonium)butane)3[SiW11O39Ni(H2O)]/P@ERGO nanocomposite for the selective determination of L-cysteine and L-tryptophan†
Saeide
Ahmadi Direstani
and
Somayeh
Dianat
 *
*
Department of Chemistry, Faculty of Sciences, University of Hormozgan, Bandar Abbas 79161-93145, Iran. E-mail: s.dianat@hormozgan.ac.ir; Tel: +98 76 33670121
First published on 18th October 2023
Abstract
Designing and developing a low-cost and highly efficient nanocomposite featuring abundant active sites with excellent transfer ability for electrons and high conductivity is critically important and challenging for the detection of biomolecules. In this study, a novel bio-sensor based on a tetra-component nanocomposite containing 1,4-bis(triphenylphosphonium)butane (BTPB), SiW11O39Ni(H2O) (SiW11Ni), and phosphorus-doped electrochemically reduced graphene oxide (P@ERGO) was synthesized via an electrodeposition procedure. The prepared hybrid nanocomposite (i.e., (BTPB)SiW11Ni/GO) was characterized by Fourier transform infrared (FT-IR) spectroscopy, X-ray diffraction (XRD) analysis, transmission electron microscopy (TEM), and inductively coupled plasma-optical emission spectrometry (ICP-OES). The surface morphology, electrochemical, and electrocatalysis properties of the (BTPB)SiW11Ni/P@ERGO/GCE were evaluated by field emission scanning electron microscopy/EDS (FE-SEM/EDS), voltammetry, amperometry, and electrochemical impedance spectroscopy (EIS). In general, the (BTPB)SiW11Ni/P@ERGO/GCE-based bio-sensor exhibited satisfactory sensing performance for L-cysteine (Cys) and L-tryptophan (Trp) under optimized conditions. It showed good linearity in a wide-range of 10–2500 and 1–2000 μmol L−1 and a low limit of detection (LOD) of 0.12 and 0.83 μmol L−1 (S/N = 3) for Cys and Trp, respectively, via the amperometry method at the biological pH (= 7.0). Additionally, this bio-sensor showed excellent selectivity and high stability, resulting from the synergistic effect of SiW11Ni, BTPB, and P@RGO. Furthermore, the practical application potential of the (BTPB)SiW11Ni/P@ERGO bio-sensor was validated by detecting Cys and Trp in real samples.
1. Introduction
Amino acids have essential functions in human neuro-regulation, metabolism, and organ function processes.1L-Cysteine (Cys) is one of the S-containing amino acids with a critical role in the cellular metabolism and antioxidation defense system.2–4 The normal range of Cys in healthy blood plasma is 10–30 mmol L−1.5 Low concentrations of Cys can lead to heart and liver diseases and hair discoloration, while its high concentrations cause L-cystinuria, Parkinson's disease, and acquired immune deficiency syndrome.6L-Tryptophan (Trp) is an essential amino acid for the human body. Since Trp cannot be directly synthesized in the human body and is rarely found in vegetables, it must be consumed daily to keep the nitrogen balance.1,7 Furthermore, it is a precursor of several metabolites, such as serotonin and melatonin, to improve sleep, mood, and mental health.1,8 Trp supplements have often been used as antidepressants, and assist in sleep and weight loss to increase the serotonin and melatonin levels in body fluids.7 Trp in high concentrations may show side effects, including agitation, confusion, diarrhea, fever, nausea, etc.8 Moreover, an improper Trp metabolism produces a toxic product in the brain that is a possible reason for hallucinations, delusions, and schizophrenia.1,9 Recent reports have shown that the Trp concentration in human serum is very low (30–50 μmol L−1),10 and changes in its levels cause metabolic disorders.11,12 Therefore, accurate, simple, and fast methods are desired for determining Cys and Trp in many fields, such as food processing, biotechnology, and pharmaceutical industries.13–16Numerous analytical methods have been developed for amino acid quantification, e.g., high-performance liquid chromatography (HPLC),17,18 spectrophotometry,19 gas chromatography-mass spectroscopy (GC-MS),20 and electrochemistry.1,4,16 Among these methods, electrochemical procedures have attracted considerable interest in electro-active compounds because of their simplicity, low-cost, high sensitivity, and ease of miniaturization.
Nevertheless, the electrochemical detection of Cys and Trp has some severe drawbacks. The electro-oxidation of Cys and Trp on the unmodified electrodes usually involves a large overpotential and sluggish electron transfer kinetics.21,22 On the other hand, the need for high overpotential significantly reduces the detection selectivity and causes surface oxide formation and precipitation effects.23 One solution to overcoming these limitations is to design and prepare modified electrodes using carbon-based materials,24,25 metal nanoparticles,26,27 Schiff base complexes,28,29 metal oxides,30 and conducting polymers.31
Polyoxometalates (POMs) are a class of clusters formed from negatively charged inorganic transition metal–oxygen building blocks.32 One of the essential applications of POMs, especially Keggin-type POMs, is in the electrochemistry field.33 The multiple redox properties make them an exciting candidate for developing modified electrodes.34,35 The anionic cluster can undergo a fast and reversible multi-electron transfer process while maintaining the structure.25,36 However, the electrocatalytic activities of POM-modified surfaces are restricted due to their low specific surface area (SSA), leaching, aggregation, and solubility in aqueous solutions. Recently, to reach more excellent stability, many studies have been conducted on the design and synthesis of organic–inorganic nanohybrid compounds based on POMs as one of the most critical topics in materials chemistry.37,38 Moreover, the immobilization of POM-based compounds in supporting carbon materials enhances their electrocatalytic performance.25,36,39
Graphene is one of the best-supporting carbon materials in the electrocatalysis field. Graphene possesses good chemical stability, high thermal and electrical conductivity, excellent mechanical properties, and a significant SSA (about 2600 m2 g−1).40,41 This substance is an ideal candidate for a POM support material to overcome the low stability and low SSA of POMs. Therefore, the electrocatalytic activity of POMs can be enriched by the high SSA and good electrical conductivity of graphene.
To date, many studies have been conducted on POM/graphene oxide (GO) nanocomposites. In these efforts, GO was used as the precursor, and POMs were immobilized onto the reduced GO (RGO) using different reduction methods such as UV-photoreduction42,43 and chemical reduction by hazardous materials (e.g., hydrazine).44,45 However, these methods usually yielded POM/RGO nanocomposites in the powder form and so the surface of the electrode must be modified using a drop-casting method. The drop-casting method has inherent restrictions, including low stability and lack of film thickness control.46 The self-assembly process is the best way to achieve stable and regular modified electrodes. In some works, the POM/RGO nanocomposite is synthesized through a layer-by-layer growth of POM/GO, followed by UV-irradiation reduction. Under UV irradiation, a photoreduction reaction occurs in the film that converts GO to RGO due to the photoreduction activity of POM clusters. Preparing RGO from GO by electrochemical reduction has recently attracted much attention as a simple, fast, and green method.25,36,47 Chen et al.48 prepared an RGO/glassy carbon electrode (GCE) from a GO colloidal solution by cyclic voltammetric (CV) reduction to determine the catechol and hydroquinone isomers with high resolution. Guo et al.46 synthesized 12-molybdosilicic acid (H4SiMo12O40, SiMo12) and chitosan and electrochemically reduced graphene oxide (CS-ERGO/SiMo12) multilayer composite films on an indium tin oxide electrode (ITO) using an electrochemical growth method. The modified surface was used for electro-reduction of S2O82− in a linear detection range of 0.67 to 30.62 μmol L−1, a sensitivity of 0.0448 μA μmol−1 L, and a limit of detection (LOD) of 0.05 μmol L−1. Mai et al.49 prepared an RGO/copper composite by electrodeposition from a colloidal solution containing [CuIIEDTA]2− complexes and GO sheets. Li et al.50 synthesized a nanocomposite of ZnO nanorods and electro-reduced graphene oxide (ZnONRs/ERGO) for voltammetric detection of dopamine in two linear ranges of 0.01 to 6.0 μmol L−1 and 6.0 to 80 μmol L−1, and LOD of 3.6 nmol L−1. Recently, numerous studies have shown that a heteroatom-doped RGO surface can effectively improve the electrical conductivity and electrocatalytic activity of RGO. The product can be used in supercapacitor electrodes,51,52 lithium-ion batteries,53–55 fuel cells,56 and dye-sensitized solar cells.57 However, limited studies have been reported on the construction of a POM/P@RGO-modified electrode through electrochemical reduction.
M. Sharifi et al.25 designed and fabricated a nanocomposite-modified GCE based on (1,1′-(1,4-butanediyl)dipyridinium)3[SiW11O39Ni(H2O)]/P@ERGO ((bdpy)SiW11Ni/P-ERGO/GCE) by drop-casting and then electrochemical reduction. The modified electrode was applied as an iodate sensor with a sensitivity of 28.1 μA mmol−1 L and a low LOD (0.47 nmol L−1) in a linear range of 10–1600 μmol L−1. Ravanbakhsh et al.36 reported the construction of PW12/MOF/P@ERGO/GCE using the electrochemical reduction method, followed by investigating the electrochemical behavior of the modified electrode.
In the present study, a new modified GCE based on organic–inorganic nanocomposite (1,4-bis(triphenylphosphonium)butane))3[SiW11O39Ni(H2O)]/GO was prepared through a drop-casting technique, followed by the electrochemical reduction method from a BTPB colloidal solution in a 0.1 mol L−1 H3PO4. The modified GCE ((BTPB)SiW11Ni/P@ERGO/GCE) was introduced as a bio-sensor for Cys and Trp determination by amperometry. Furthermore, the electrochemical properties, selectivity, reproducibility, repeatability, and recovery in acetylcysteine tablets, milk, and egg white (as real samples) were investigated. However, the presence of BTPB in the nanohybrid compound improved the nanocomposite's stability and increased POM-loading on the RGO surface. The strong electrostatic interaction between SiW11Ni and BTPB led to this high stability and enhanced POM-loading on the support. In addition, (BTPB)SiW11Ni can electrostatically bond with P@ERGO by Pδ+ and π-electrons of BTPB without affecting the SiW11Ni electronic structure. The proposed plan for the renovation of SiW11Ni by BTPB and P@ERGO exhibits remarkable advantages, making it useful for practical applications.
2. Experiment
2.1. Reagents and materials
The K6[SiW11O39Ni(H2O)]·nH2O (SiW11Ni), and 1,4-bis(triphenylphosphonium)butane (BTPB) were synthesized according to the literature procedures.58,59 Tungstosilicic acid (H4SiW12O40·nH2O, SiW12), potassium acetate (CH3COOK), nickel(II) sulfate hexahydrate (NiSO4·6H2O), glacial acetic acid (HAc), phosphoric acid (H3PO4), sulfuric acid (H2SO4), boric acid (H3BO3), potassium hexacyanoferrate(III) (K3[Fe(CN)6]), Cys, and Trp were of analytical grade and were used as received. These materials were purchased from Sigma-Aldrich or Merck. All solutions were prepared using deionized water (DI water, 18 MΩ cm (25 °C), Milli Q, Millipore Inc.). Phosphate buffer saline (PBS) solutions were prepared using the stock solution of 0.01 mol L−1 H3PO4 and then adjusting the pH with the solution of 0.5 mol L−1 NaOH. The Britton–Robinson buffer (BRB) solution was prepared by mixing the 0.04 mol L−1 H3PO4, 0.04 mol L−1 boric acid, and 0.04 mol L−1 acetic acid that has been titrated to the desired pH (pH 2–9) with 0.2 mol L−1 NaOH. Commercial N-acetylcysteine-mucolytic effervescent tablets (600 mg of N-acetylcysteine per tablet) were purchased from Osve Pharmaceutical Inc., Iran. The milk sample was bought from a local marketplace in Bandar Abbas (Iran).2.2. Apparatus
The percentage immobilized on the GO surface of SiW11Ni was measured by inductively coupled plasma-optical emission spectrometry (ICP-OES, PerkinElmer Optima 7300 DV) through determining W contents in the (BTPB)SiW11Ni/GO nanocomposite. IR spectra of SiW11Ni, (BTPB)SiW11Ni, BTPB, GO, and (BTPB)SiW11Ni/GO were measured using the attenuated total reflectance Fourier transform-infrared (ATR FT-IR; spectrum two spectrometer-PerkinElmer) spectroscopy in the wavenumber range of 3400–400 cm−1. The crystalline structures of the SiW11Ni, BTPB, (BTPB)SiW11Ni, GO, and (BTPB)SiW11Ni/GO were characterized using an X-ray diffraction technique (XRD) with Cu Kα radiation on a PANalytical X’Pert Pro. The morphology of the (BTPB)SiW11Ni/GO and GO was examined by transmission electron microscopy (TEM, Zeiss-EM10C-100 KV-Germany). Morphological characteristics and elemental analysis of the bare GCE, P@SiW11Ni/GCE, and (BTPB)SiW11Ni/P@ERGO/GCE were examined by field emission scanning electron microscopy (FE-SEM, Zeiss-SIGMA VP-Germany), equipped with energy-dispersive X-ray spectrometry (EDS) and EDS-mapping. A Raman spectrometer (Raman Takram P50C0R10) was used to confirm the prepared GO. The recovery of Cys, Trp in real samples using a voltammetric method was validated using an HPLC (Knauer, Azura, Germany) equipped with a K-2600UV-visible detector. Chromatographic separations were performed using a Zorbax Eclipse Plus C18 column (4.6 mm × 250 mm) packed with a 5 μm particle size.2.3. Analytical measurements
The electrochemical analyses were performed using an Autolab potentiostat/galvanostat (P/GSTAT 302N). A three-electrode system, consisting of bare or modified GCE (GR-2S/N, Iran, Tehran, 2 mm in diameter), was used as the working electrode, an Ag/AgCl (3 mol L−1 KCl) electrode (Metrohm, Switzerland) as the reference electrode, and a platinum rod (IV-EL/EB-2200, Ivium, Eindhoven, Netherland) as the counter electrode. The voltammetric and amperometric experiments were performed using Autolab NOVA software version 2.1.5. For GCE modification using an electro-reduction method, the dissolved oxygen gas was eliminated by purging argon gas with high-purity (99.999%) into the electrolytic cell solutions for 15 min. Electrochemical impedance measurements were obtained by an electrochemical impedance spectroscope (EIS, μSTAT-I 400s, Metrohm Dropsens) in PBS solution (0.01 mol L−1, pH 3) containing [Fe(CN)6]3−/4− (0.5 mmol L−1) at a frequency range of 105–0.01 Hz.2.4. Synthesis of (BTPB)SiW11Ni
First, a SiW12 (7.0 g, 2.4 mmol) solution in 25 mL of hot DI water was prepared. Then, solutions of NiSO4·6H2O (0.8 g, 3.0 mmol) in 2.5 mL of hot DI water and CH3COOK (7.5 g, 76.4 mmol) in 7.5 mL of hot DI water (pH adjusted to 7 by CH3COOH) were added dropwise into the solution containing SiW12, separately. The prepared solution was stirred and preserved at 95 °C for 1 min. Afterward, BTPB was progressively added into this solution until no further precipitate formed. Finally, the pale green precipitate of (BTPB)SiW11Ni was filtered, washed with C2H5OH, and dried at ambient temperature (yield ∼ 89%).2.5. Synthesis of (BTPB)SiW11Ni/GO
GO was synthesized using a modified Hummers' method,60 and the obtained GO was confirmed using Raman spectroscopy. The Raman spectrum of GO is presented in the ESI† (Fig. 1S). To synthesize (BTPB)SiW11Ni/GO, first, a suspension of 5 mg GO and (BTPB)SiW11Ni (5 mg, 0.001 mmol) in 5 mL DI water was prepared. Then, the suspension was stirred at 45 °C for 1 h and sonicated for 5 min to obtain a homogeneous suspension. The obtained suspension was used to prepare the (BTPB)SiW11Ni/P@ERGO/GCE.2.6. Preparation of (BTPB)SiW11Ni/P@ERGO/GCE
First, the GCE surface was polished sequentially with 0.30 μm, 0.10 μm, and 0.05 μm α-Al2O3 suspension and washed with DI water. Then, the polished GCE was sonicated in an ultrasonic bath of DI water/ethanol/DI water each for 5 min, respectively. Afterward, the GCE was cleaned electrochemically with H2SO4 solution (0.5 mol L−1) by repeated potential cycling between −1.0 and +1.0 V (vs. Ag/AgCl) until the voltammograms remained unchanged. In the next step, 10 μL of synthesized (BTPB)SiW11Ni/GO suspension was drop-cast on the surface of bare GCE. Next, it was dried at ambient temperature overnight and rinsed with DI water. Then, GO was electrochemically reduced on the surface of GCE using chronoamperometry at the fixed potential of −1.5 V at various times of 30, 60, 90, and 120 s in H3PO4 (0.1 mol L−1) containing different concentrations of BTPB (0.56, 1.12, 1.68, 2.25 mmol L−1). An optimum analytical response was found at 60 s in the presence of BTPB (1.12 mmol L−1). Additionally, SiW11Ni/GCE, BTPB/GCE, (BTPB)SiW11Ni/GCE, and P@ERGO/GCE as the control working electrodes were prepared by a similar method in 0.1 mol L−1 H3PO4 in the absence of BTPB. The schematic representation of the preparation procedure of the as-prepared modified electrode is shown in Scheme 1.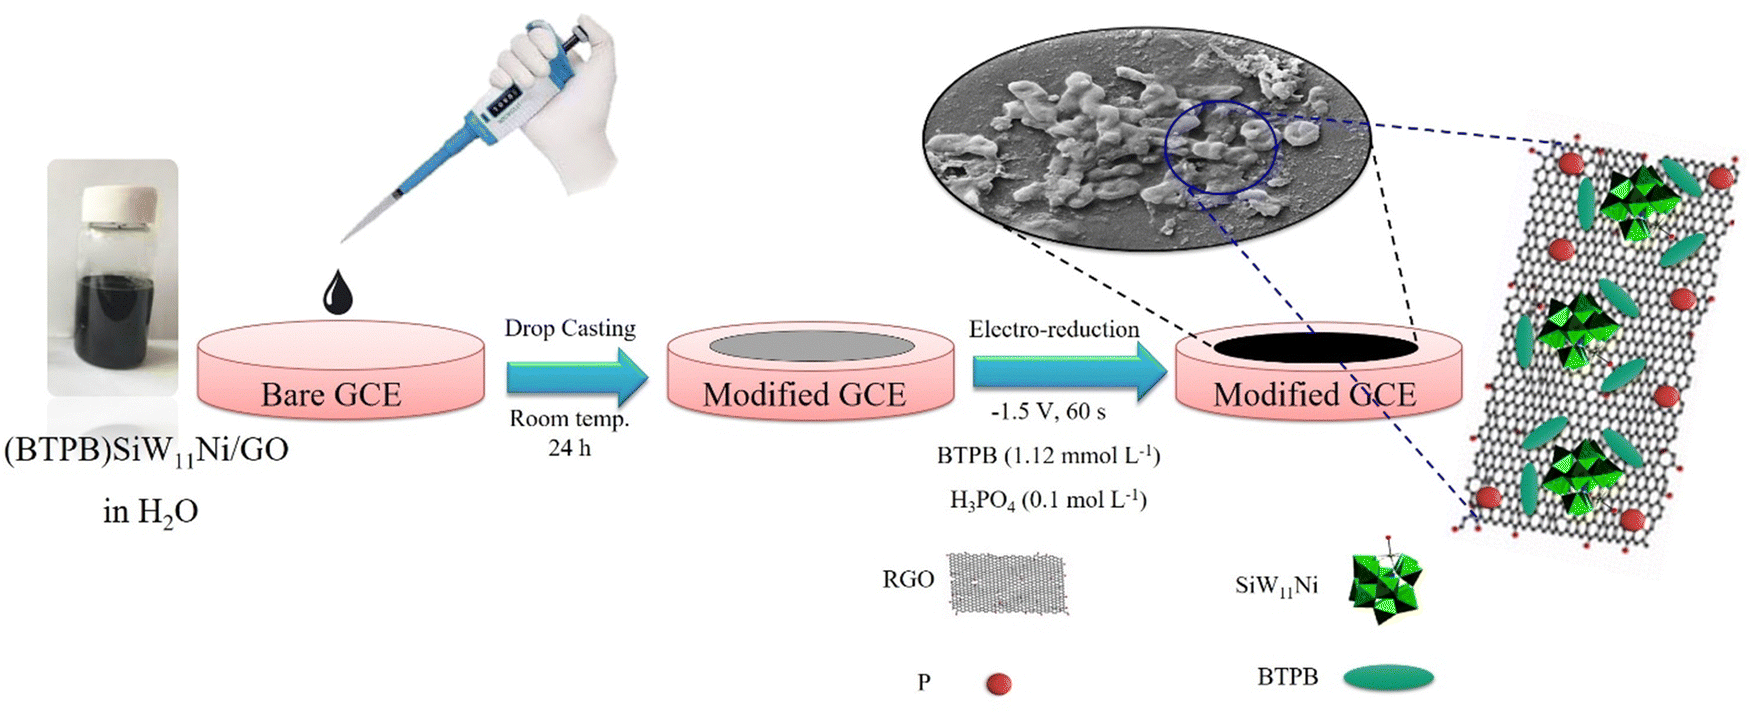 | ||
| Scheme 1 Stepwise procedure for the preparation of (BTPB)SiW11Ni/p@ERGO/GCE. | ||
3. Results and discussion
3.1. Physical characterization
The amounts of carbon, phosphorus, silicon, tungsten, and nickel in the (BTPB)SiW11Ni were determined by elemental analysis. Calculated values [%] are C: 10.15, P: 1.31, Si: 0.59, W: 42.78, and Ni: 1.24. On the other hand, experimental values [%] are C: 9.62; P: 1.51, Si: 0.52, W: 39.24, and Ni: 1.12. The results confirmed that experimental data agree with the theoretical data based on the (BTPB)3SiW11Ni formula. Additionally, the 1![[thin space (1/6-em)]](https://www.rsc.org/images/entities/char_2009.gif) :11.5:1 molar ratio in SiW11Ni demonstrates that the Keggin structure of SiW11Ni has been maintained during the functionalization with BTPB. The loading percentage of (BTPB)SiW11Ni on GO was calculated to be 0.72% by ICP-OES spectroscopy. The FTIR, and XRD of SiW11Ni, (BTPB)SiW11Ni, BTPB, GO, and (BTPB)SiW11Ni/GO, and TEM images of the GO and (BTPB)SiW11Ni/GO at the different magnifications are shown in the ESI† (Fig. 2S–4S, ESI†, respectively). The FT-IR data are summarized in Table 1S (ESI†). Generally, the characterization studies of (BTPB)SiW11Ni, and (BTPB)SiW11Ni/GO confirmed that the SiW11Ni, keeping with the Keggin structure, was uniformly distributed on the GO surface.
:11.5:1 molar ratio in SiW11Ni demonstrates that the Keggin structure of SiW11Ni has been maintained during the functionalization with BTPB. The loading percentage of (BTPB)SiW11Ni on GO was calculated to be 0.72% by ICP-OES spectroscopy. The FTIR, and XRD of SiW11Ni, (BTPB)SiW11Ni, BTPB, GO, and (BTPB)SiW11Ni/GO, and TEM images of the GO and (BTPB)SiW11Ni/GO at the different magnifications are shown in the ESI† (Fig. 2S–4S, ESI†, respectively). The FT-IR data are summarized in Table 1S (ESI†). Generally, the characterization studies of (BTPB)SiW11Ni, and (BTPB)SiW11Ni/GO confirmed that the SiW11Ni, keeping with the Keggin structure, was uniformly distributed on the GO surface.
3.2. Morphological characterization of (BTPB)SiW11Ni/P@ERGO/GCE
The morphologies and microstructures of the bare GCE, P@SiW11Ni/GCE, and (BTPB)SiW11Ni/P@ERGO/GCE were investigated by FE-SEM. As shown in Fig. 1A, images a, b the bare GCE displayed a smooth and uniform surface, which was transformed to a rough surface after the modification with the P@SiW11Ni, or (BTPB)SiW11Ni/P@ERGO (Fig. 1B and C, images a, b). Moreover, the EDS spectra of the bare GCE, P@SiW11Ni/GCE, and (BTPB)SiW11Ni/P@ERGO/GCE are displayed in Fig. 1A–C, image c. The EDS analysis and elemental mappings confirm the existence of C and O in the bare GCE (Fig. 1A, images c–e) and W, C, O, P, Si, and Ni in the P@SiW11Ni/GCE and (BTPB)SiW11Ni/P@ERGO (Fig. 1B and C, images c–i). The presence of P in the EDS spectrum and elemental mappings confirms the doping of P on the surface of the modified GCEs.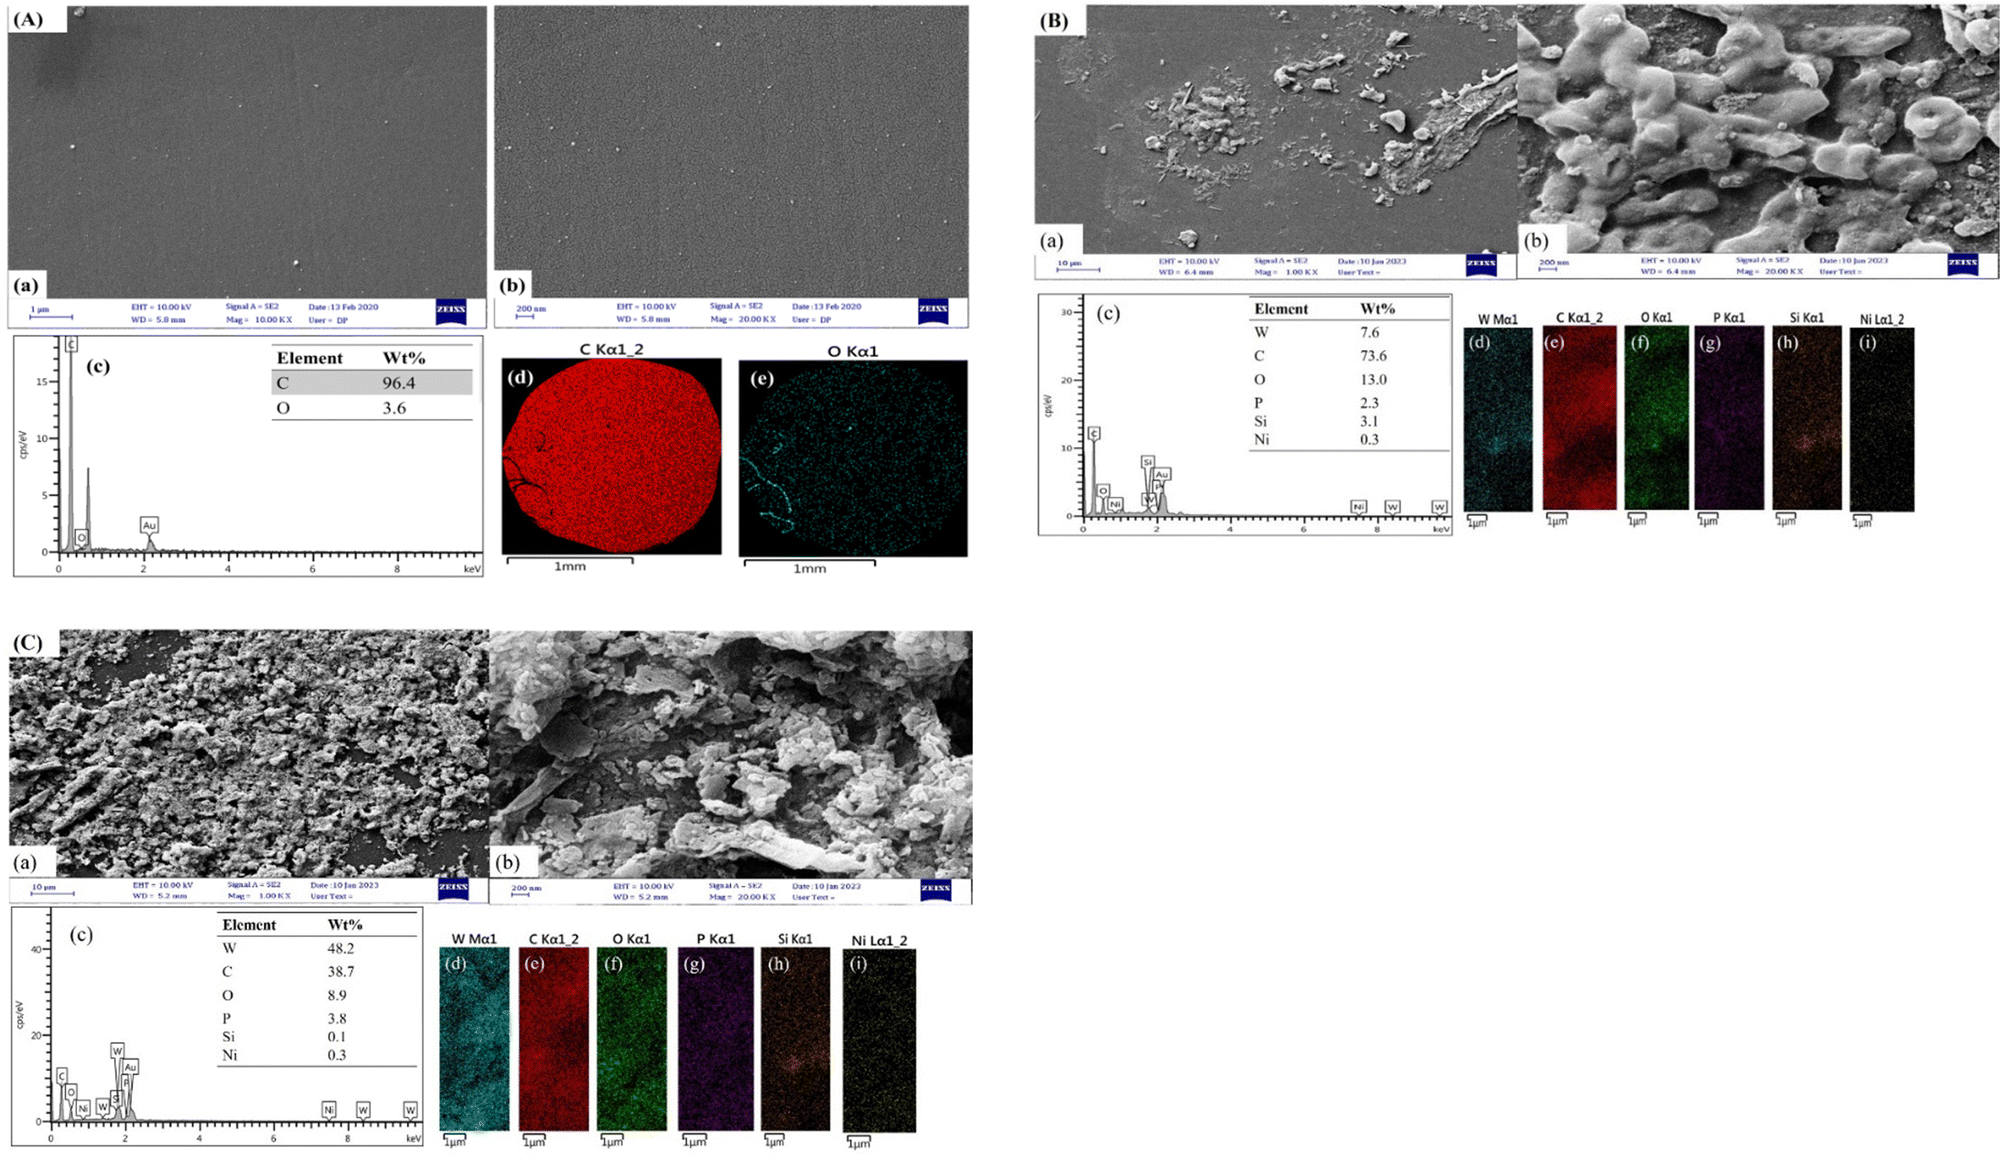 | ||
| Fig. 1 FE-SEM images, EDS pattern, and EDS elemental mapping of (A) bare GCE, (B) P@SiW11Ni/GCE, and (C) (BTPB)SiW11Ni/P@ERGO/GCE. | ||
3.3. Parameter optimization for (BTPB)SiW11Ni/P@ERGO/GCE coating
Optimizing the experimental parameters is crucial to achieve a modified electrode with improved electrochemical activity. Herein, the essential parameters, including the type and concentration of electrolyte additive and the electrodeposition time, are investigated. The following experiments were examined using CV. For this purpose, experiments were designed using the CV method in H3PO4 (0.1 mol L−1) as a supporting electrolyte at the fixed potential of −1.5 V. The results are displayed in the (Fig. 5S, ESI†). The results confirm that the (BTPB)SiW11Ni/P@ERGO/GCE prepared with 1.12 mmol L−1 BTPB as the electrolyte additive and electro-reduction time of 60 s have the best electrochemical behavior.3.4. Electrochemical behavior of (BTPB)SiW11Ni/P@ERGO/GCE
The electrochemical behavior of the (BTPB)SiW11Ni/P@ERGO/GCE was studied via a CV technique in H2SO4 (0.5 mol L−1, pH 0.5) electrolyte and compared with bare GCE and (BTPB)SiW11Ni/GCE (Fig. 2A). However, at the (BTPB)SiW11Ni/GCE, two pseudo-reversible redox couples with the half-wave potentials (E1/2 = (Epa + Epc)/2) of −424 (I–I′) and −527 (II–II′) mV were observed, respectively. These couples are related to the one- and two-electron transfer processes of WV → WIV and WIV → WII, respectively. However, at the (BTPB)SiW11Ni/P@ERGO/GCE, only one pair of redox peaks (I–I′) with the E1/2 of −205 mV appeared. However, the anodic peak II′ was not observed due to the high background current of this modified GCE. As presented in Fig. 2A, there is an increase in the peak currents at the (BTPB)SiW11Ni/P@ERGO/GCE (curve c) compared to the (BTPB)SiW11Ni/GCE (curve b). This increase confirms that the P@ERGO can upgrade electron transfer between the GCE and the (BTPB)SiW11Ni. The bare GCE (curve a) showed no significant peak current under the same conditions. | ||
| Fig. 2 (A) CVs obtained on the bare GCE (a), (BTPB)SiW11Ni/GCE (b), and (BTPB)SiW11Ni/P@ERGO/GCE (c) in H2SO4 (0.5 mol L−1, pH 0.5); scan rate of 100 mV s−1, (B) CV of the (BTPB)SiW11Ni/P@ERGO/GCE in H2SO4 (0.5 mol L−1, pH 0.5) at different scan rates from 5 to 400 mV s−1. The inset shows variations of the cathodic and anodic peak currents (peak I and peak I′) with scan rates, and (C) SWVs of the (BTPB)SiW11Ni/P@ERGO/GCE in BRB at different pHs (pH 2–9); step potential 2 mV, amplitude potential 20 mV. The arrow shows the shift in peak potentials upon increasing pH. The inset shows the variation of the cathodic peak potentials with pHs. | ||
The effect of the scan rate on the electrochemical behavior of the (BTPB)SiW11Ni/P@ERGO/GCE was investigated in H2SO4 (0.5 mol L−1, pH 0.5). The obtained results are shown in Fig. 2B. The redox couples I and I′ increase linearly with increasing the scan rate from 5 to 400 mV s−1 (inset of Fig. 2B), demonstrating that the electrochemical properties of the (BTPB)SiW11Ni/P@ERGO/GCE are surface-controlled. Additionally, the peak potential remained almost constant with increasing scan rate, indicating the very fast electron transfer kinetics on the surface of the modified electrode.
The effect of pH on the electrochemical properties of the (BTPB)SiW11Ni/P@ERGO/GCE was examined in BRB (pH 2–9) using SWV (Fig. 2C). As can be seen, the current of the cathodic peak (ipc) decreases with increasing pH. Meanwhile, the cathodic peak potential (Ep) shifts negatively and linearly as pH increases in the range of pH 2.0–9.0 with a linear regression equation of Epc (V) = −0.0529pH + 0.3552 (R2 = 0.9904). The relationship between cathodic peak potential and pH follows the Nernst equation,61eqn (1).
 | (1) |
3.5. Electrochemical properties of (BTPB)SiW11Ni/P@ERGO/GCE in [Fe(CN)6]3−/4−
The surface electron transfer properties of the bare and modified GCEs were evaluated using the [Fe(CN)6]3−/4− redox probe. Fig. 3A, curve a exhibits a redox couple at the bare GCE with a ΔEp about 95.6 mV and ipc of 1.59 μA in Fe(CN)63−/4− solution in 0.01 mol L−1 PBS (pH 3) containing 0.1 mol L−1 KCl. The immobilization of BTPB on the GCE led to a noticeable decrease in ΔEp and an increase in faradaic peak currents (ip) (Fig. 3A, curve b). This result confirms that the BTPB can develop electron transfer efficiency, due to its unique electronic structure. However, a higher ΔEp is found along with decreasing ip for the SiW11Ni/GCE and (BTPB)SiW11Ni/GCE (Fig. 3A, curve c and d). The SiW11Ni and (BTPB)SiW11Ni films serve as a barrier layer and block the electron transfer of the [Fe(CN)6]3−/4− redox couple and the GCE surface. The (BTPB)SiW11Ni/GCE shows a larger ΔEp than the bare GCE but smaller than the SiW11Ni/GCE. The better reversible behavior of (BTPB)SiW11Ni/GCE versus SiW11Ni/GCE can be attributed to the BTPB's high electrical conductivity. Furthermore, it can be observed from Fig. 3A, curve e, that the P@ERGO/GCE possesses the most considerable background current with remarkably higher ΔEp than the bare GCE. But with stabilizing the (BTPB)SiW11Ni hybrid compound on the P@ERGO substrate, the background current, and also ΔEp decreases, so that the (BTPB)SiW11Ni/P@ERGO/GCE displays the best electrochemical activity (Fig. 3A, curve f). The quantitative data extracted from these voltammograms are presented in Table 1. This result confirms that the (BTPB)SiW11Ni/P@ERGO/GCE displays the best electrochemical activity regarding the synergistic effect between the SiW11Ni, BTPB, and P@ERGO.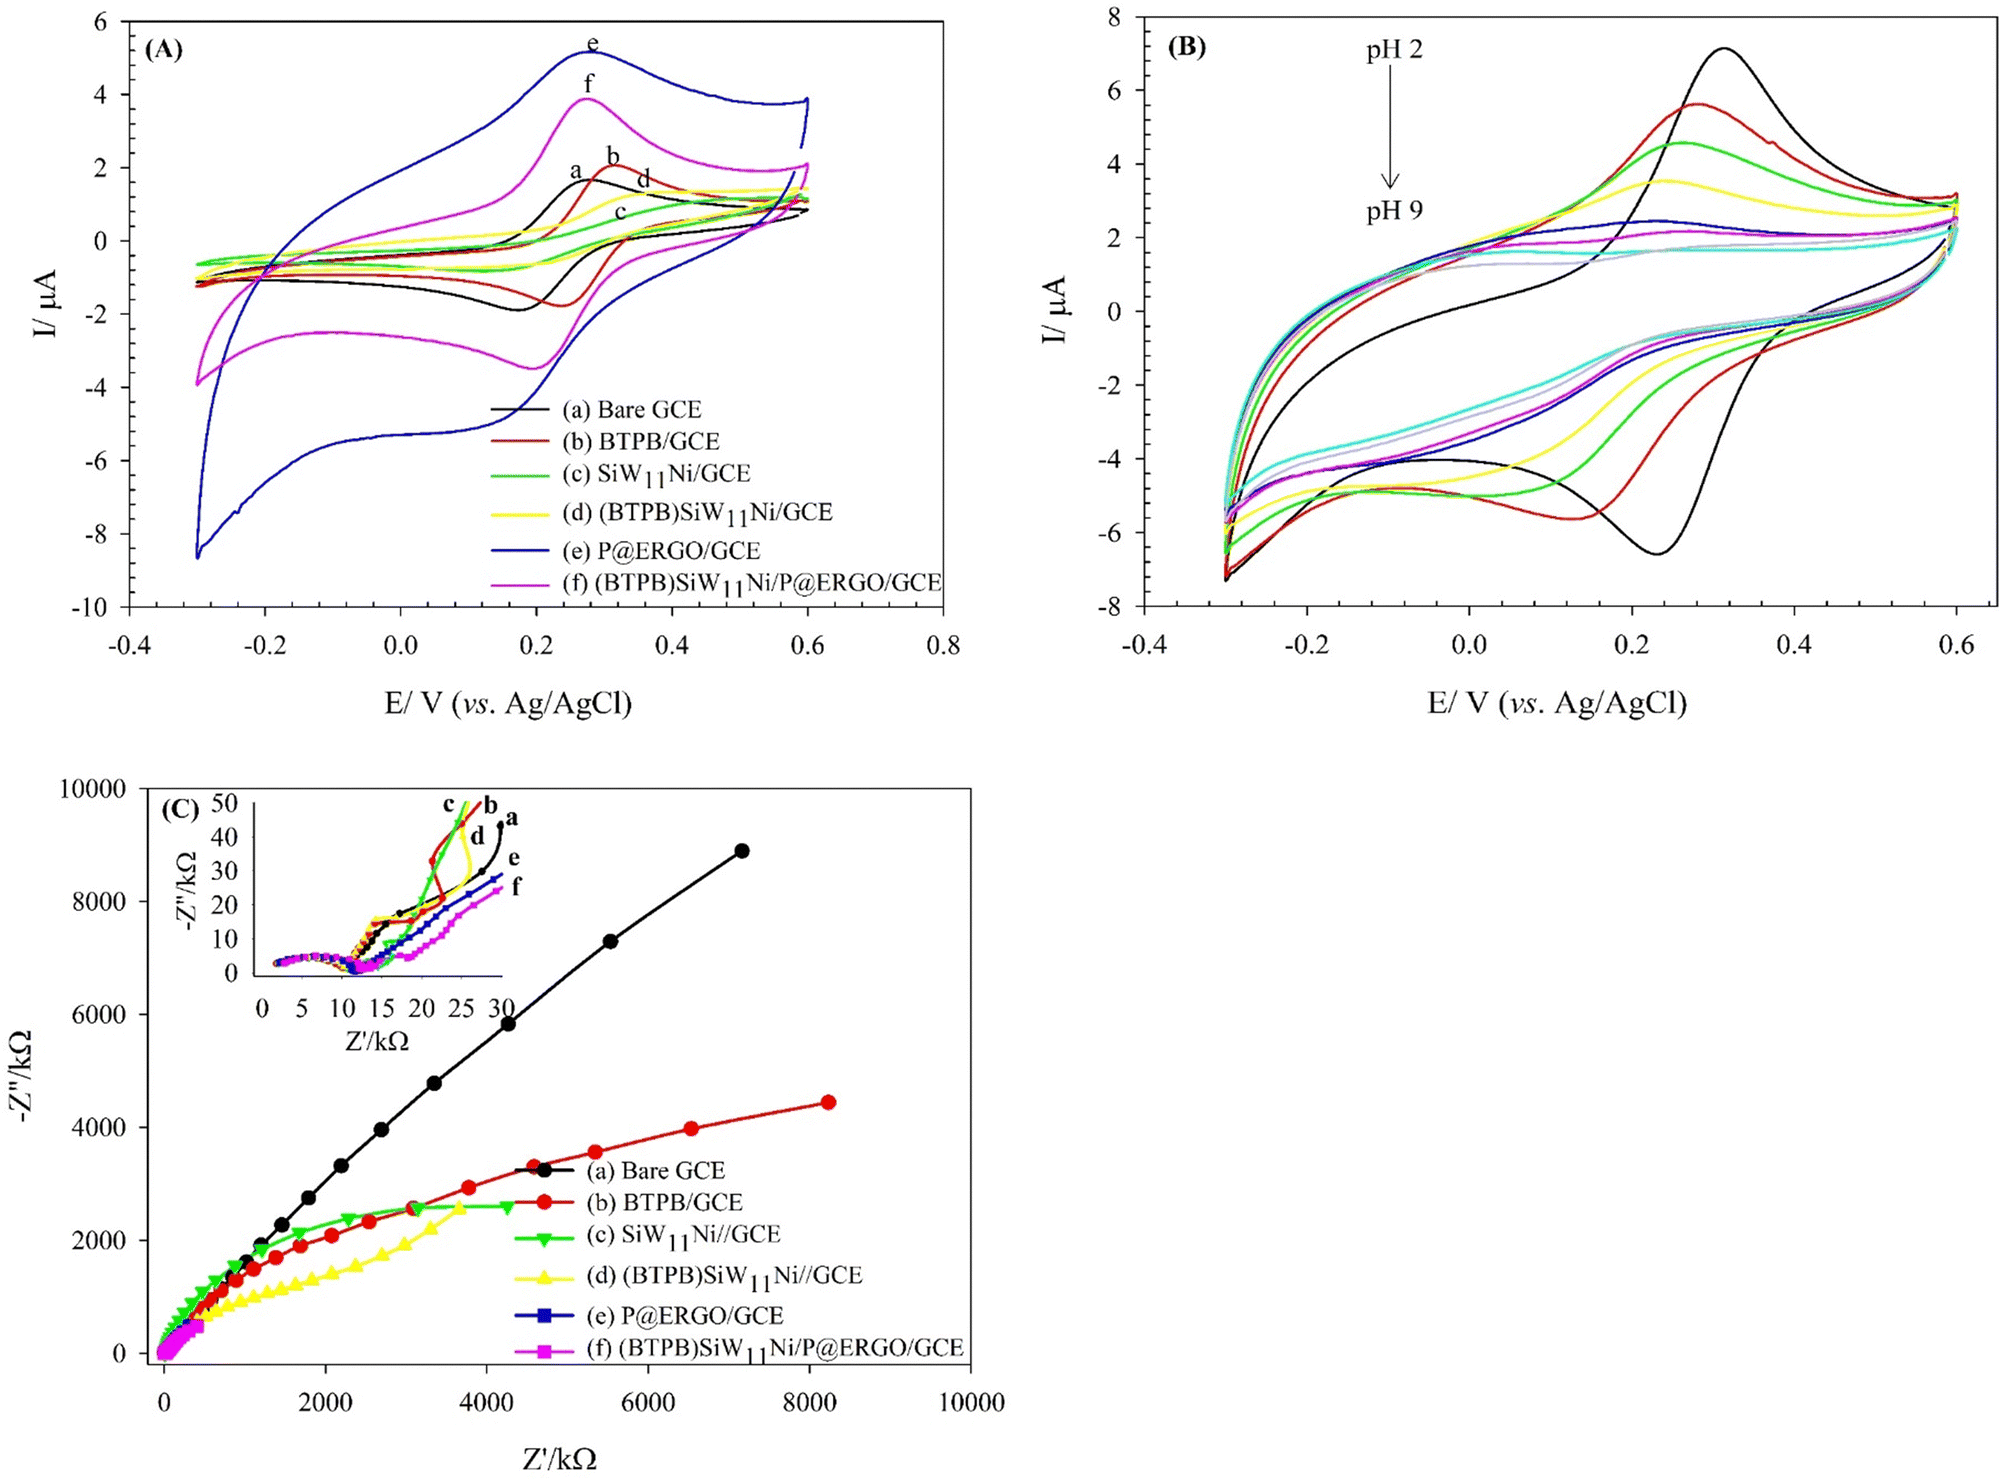 | ||
| Fig. 3 CVs obtained in the presence of [Fe(CN)6]3−/4− (0.5 mmol L−1) redox probe, (A) in PBS solution (0.01 mol L−1, pH 3) containing KCl (0.1 mol L−1) as the supporting electrolyte on the bare GCE (a), BTPB/GCE (b), SiW11Ni/GCE (c), (BTPB)SiW11Ni/GCE (d), P@ERGO/GCE (e), and (BTPB)SiW11Ni/P@ERGO/GCE (f); scan rate: 50 mV s−1. (B) On the (BTPB)SiW11Ni/P@ERGO/GCE in BRB containing KCl (0.1 mol L−1) at different pHs (pH 2–9); scan rate: 50 mV s−1, (C) electrochemical impedance spectra of the bare GCE (a), BTPB/GCE (b), SiW11Ni/GCE (c), (BTPB)SiW11Ni/GCE (d), P@ERGO/GCE (e), and (BTPB)SiW11Ni/P@ERGO/GCE (f) in PBS solution (0.01 mol L−1, pH 3) containing [Fe(CN)6]3−/4− (0.5 mmol L−1); frequency range of 105–0.01 Hz. | ||
| Electrode | ΔE/mV ± SDa | |ipc|/μA ± SDa | i pa/μA ± SDa |
|---|---|---|---|
| a SD: standard deviation. | |||
| Bare GCE | 95.67 ± 0.004 | 1.59 ± 0.026 | 1.43 ± 0.592 |
| BTPB/GCE | 65.46 ± 0.005 | 1.66 ± 0.024 | 1.80 ± 0.073 |
| SiW11Ni/GCE | 266.84 ± 0.006 | 0.48 ± 0.052 | 0.28 ± 0.031 |
| (BTPB)SiW11Ni/GCE | 135.96 ± 0.005 | 0.40 ± 0.061 | 0.39 ± 0.044 |
| P@ERGO/GCE | 141.80 ± 1.100 | 1.53 ± 0.190 | 1.23 ± 0.170 |
| (BTPB)SiW11Ni/P@ERGO/GCE | 65.42 ± 0.006 | 2.43 ± 0.102 | 2.76 ± 0.159 |
The electrochemical results revealed that the electrolyte pH is an influential factor in the electrochemical behavior of the (BTPB)SiW11Ni/P@ERGO/GCE. The [Fe(CN)6]3−/4− redox system has been applied as an electrochemical active probe to study the pH effect on the electrochemical response of the (BTPB)SiW11Ni/P@ERGO/GCE.62
Fig. 3B shows the CVs of the (BTPB)SiW11Ni/P@ERGO/GCE in the presence of [Fe(CN)6]3−/4− (0.5 mmol L−1) in BRB containing KCl (0.1 mol L−1) at pHs 2–9. According to Fig. 3B, the ΔEp increases, and the ip values decrease as pH rises. However, almost no peak could be observed at pHs higher than 6. Indeed, the surface of the modified electrode with a positive charge is slowly neutralized with increasing OH− concentration. Consequently, the electrostatic interaction between the surface of (BTPB)SiW11Ni/P@ERGO/GCE and [Fe(CN)6]3−/4− redox couple decreases.
Moreover, EIS is an effective electrochemical technique to investigate the interfacial electrical performances of electrochemical sensors.10Fig. 3C shows the Nyquist plot patterns of the bare, and various modified GCEs. Using the simulation program, the charge transfer resistance (Rct) value of the bare GCE is estimated to be 10.2 kΩ, which is slightly increased to 12.2, 11.6, and 14.6 kΩ after modification with BTPB, P@ERGO, and (BTPB)SiW11Ni/P@ERGO, respectively. However, an evident increase of the Rct value to 6849.7, 2341.6 kΩ is observed after the bare GCE is modified with SiW11Ni, (BTPB)SiW11Ni, due to the very low conductivity of SiW11Ni. Generally, the increase in the Rct value confirms the formation of a modifier layer adsorbed on the electrode surface, which exhibits a barrier effect on the electron transfer kinetics between the redox couple and electrode interface. The lower Rct value of (BTPB)SiW11Ni/GCE versus SiW11Ni/GCE can be ascribed to the electronic structure of BTPB. Furthermore, the very low value of Rct for (BTPB)SiW11Ni/P@ERGO/GCE compared to (BTPB)SiW11Ni/GCE can be due to the excellent conductivity of P@ERGO.
The electro-active surface area of the bare GCE, and (BTPB)SiW11Ni/P@ERGO/GCE were obtained via a CV method in [Fe(CN)6]3−/4− (0.5 mmol L−1) containing KCl (0.1 mol L−1) at different scan rates in the range of 5–400 mV s−1 (Fig. 4A and C). For comparison, the electro-active surface area of the BTPB/GCE, SiW11Ni/GCE, and (BTPB)SiW11Ni/GCE were obtained via a similar method. The results were displayed in the (ESI,† Fig. 6S). The electro-active surface area was estimated using the Randles Sevcik equation (eqn (2)):
| ip = 2.69 × 10⁵n3/2AeffD01/2ν1/2Cp | (2) |
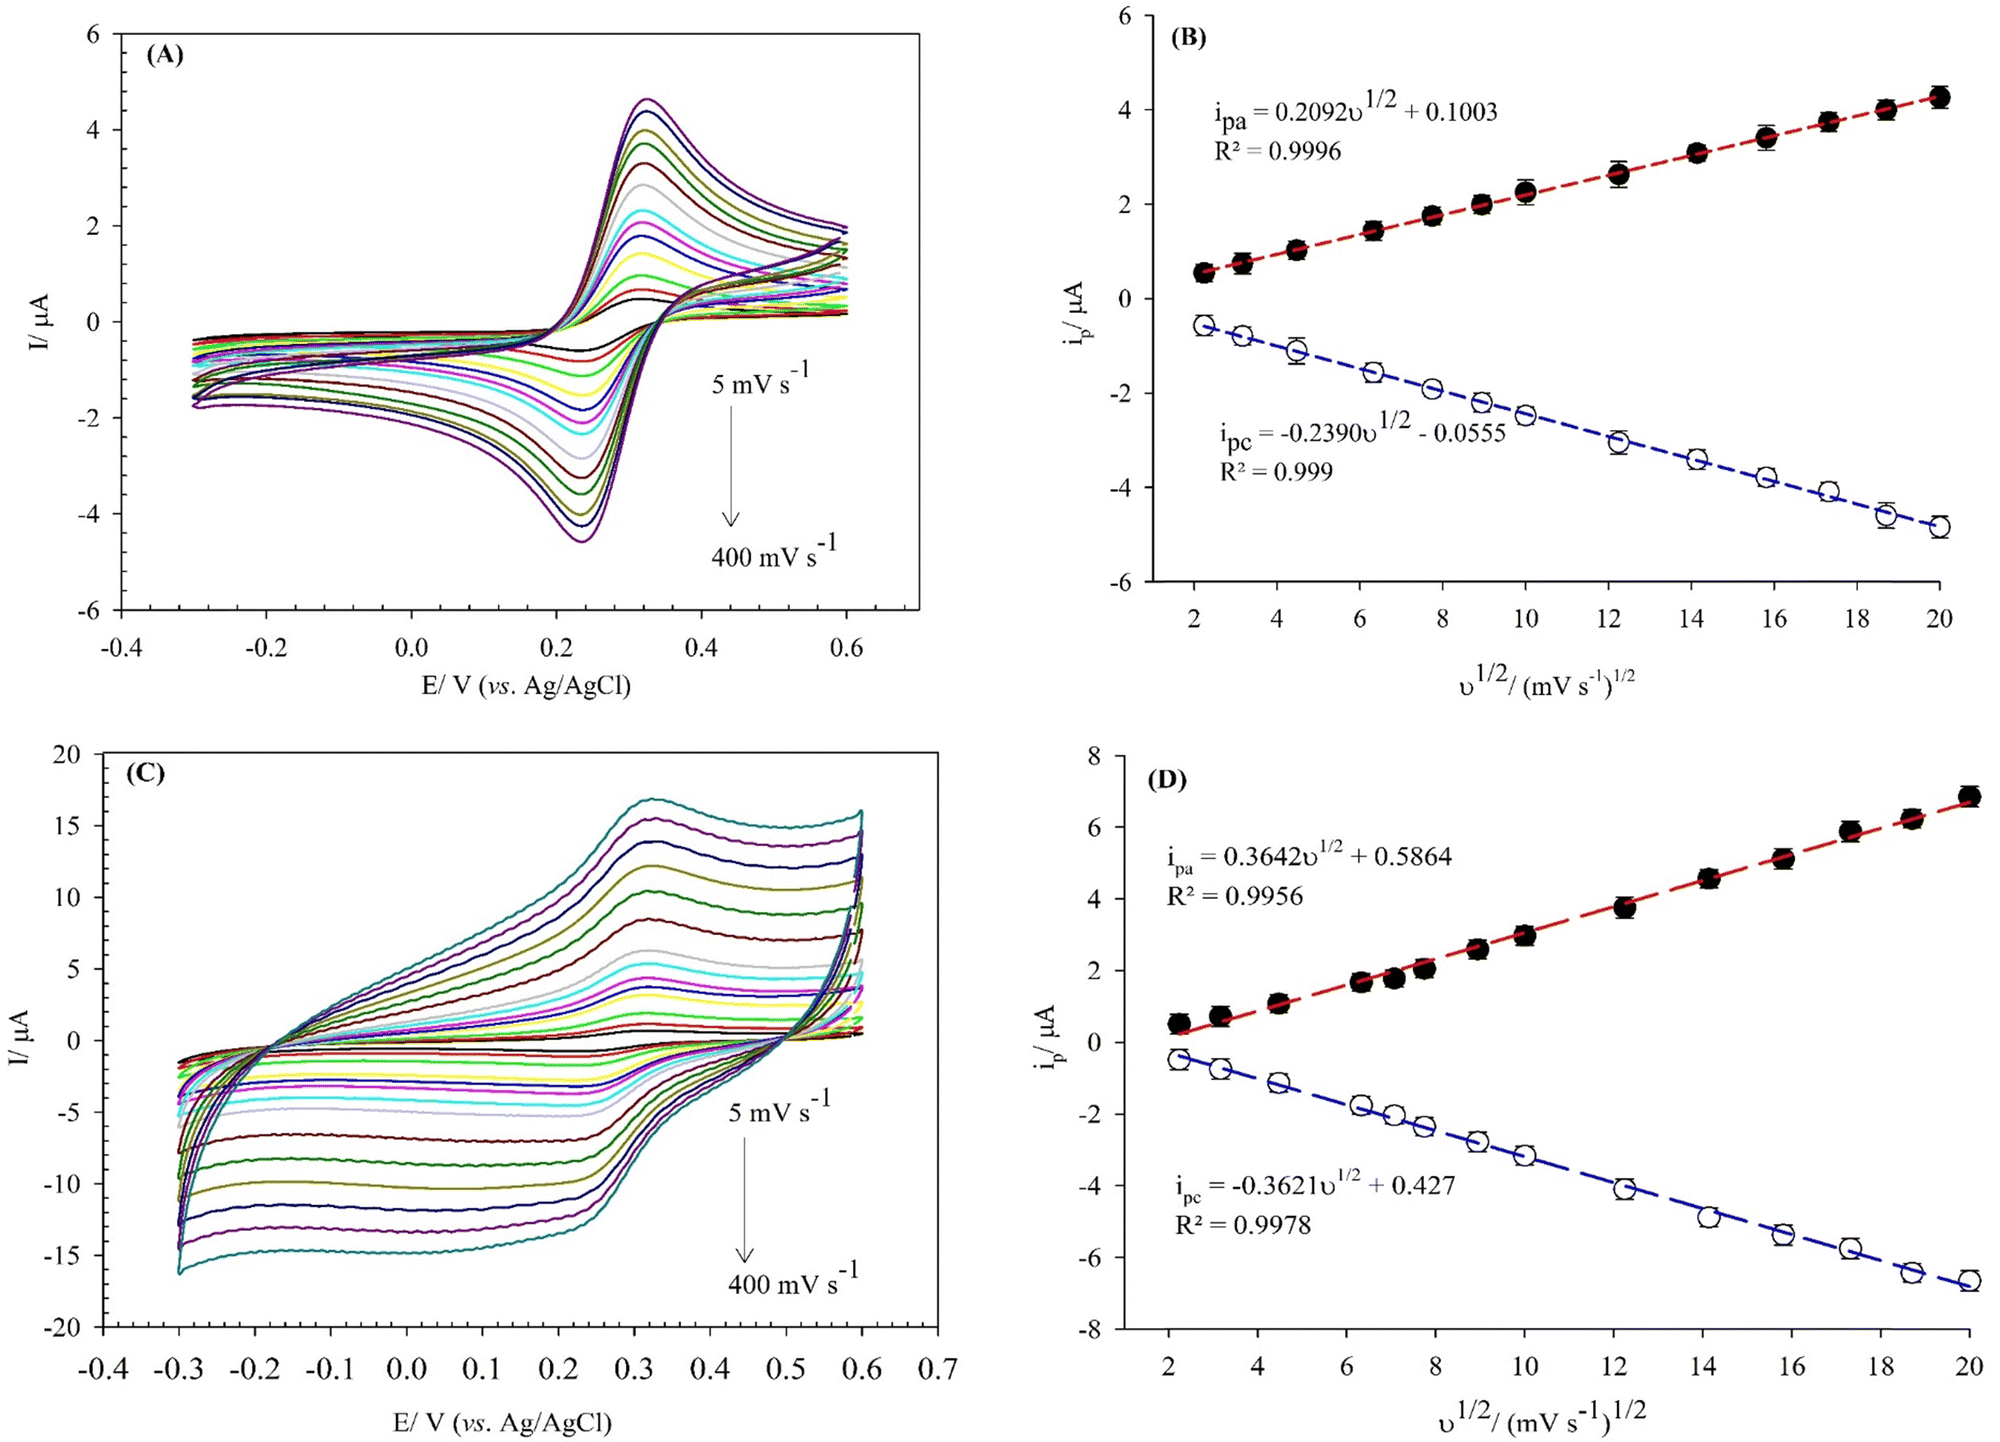 | ||
| Fig. 4 CVs obtained in the presence of [Fe(CN)6]3−/4− (0.5 mmol L−1) redox probe on the (A) bare GCE, and (C) (BTPB)SiW11Ni/P@ERGO/GCE at different scan rates from 5 to 400 mV s−1. Variations of the anodic and cathodic peak currents on the (B) bare GCE, and (D) (BTPB)SiW11Ni/P@ERGO/GCE with square root of scan rates. | ||
3.6. Electrocatalytic activity of (BTPB)SiW11Ni/P@ERGO/GCE
The electrocatalytic properties of the (BTPB)SiW11Ni/P@ERGO/GCE for electro-oxidation of Cys and Trp was studied in 0.01 mol L−1 PBS (pH = 7) using the amperometry method. The obtained results are shown in Fig. 5A and C. A very fast current response was identified upon adding the Cys or Trp into the stirred PBS (0.01 mol L−1, pH 7) at an optimum potential (−0.5 V, and +0.1 V for Cys, and Trp, respectively). Besides, the currents increased with continuously adding Cys or Trp. This increase could be due to the good electron transfer rate of the modifier and the rapid diffusion of the Cys or Trp from the electrolyte to the (BTPB)SiW11Ni/P@ERGO/GCE surface. In Fig. 5B and D, the ip values are plotted vs. [Cys] or [Trp]. As shown in Fig. 5B, the ipc is proportional to [Cys] over the range of 10–250 μmol L−1, and 300–2500 μmol L−1 with linear equations of |ipc| (μA) = 0.8059[Cys] (μmol L−1) + 12.5590 (R2 = 0.9907) and |ipc| (μA) = 0.0774[Cys] (μmol L−1) + 237.6979 (R2 = 0.9973), respectively. Fig. 5D shows a linear response range of 1–2000 μmol L−1 for Trp, with linear equation of ipa (μA) = 0.1120[Trp] (μmol L−1) + 8.9289 (R2 = 0.9781). The LODs and LOQs are 0.12 μmol L−1 and 0.39 μmol L−1 for Cys, respectively, while they are 0.83 μmol L−1 and 2.78 μmol L−1 for Trp, respectively. The sensitivity values of (BTPB)SiW11Ni/P@ERGO/GCE for Cys, and Trp were 805.9 and 112.0 μA mmol−1 L, respectively. The linear range, LOD, and sensitivity of this modified surface and similar reports in the response of Cys and Trp are presented in Table 2. The results demonstrate that the modified surface can be used to determine Cys and Trp in a wider linear range at a less positive potential and at the biological pH. | ||
| Fig. 5 (A) Current–time responses of (BTPB)SiW11Ni/P@ERGO/GCE in PBS (0.01 mol L−1, pH 7) at −0.5 V with the increasing of Cys concentration. (B) Corresponding calibration plot of the absolute value of steady-state currents obtained against concentrations of Cys. (C) Current–time responses of (BTPB)SiW11Ni/P@ERGO/GCE in PBS (0.01 mol L−1, pH 7) at +0.1 V with an increasing of Trp concentration. (D) Corresponding calibration plot of the value of steady-state currents obtained against concentrations of Trp. | ||
| Modified electrode | Analyte | Sweep mode | Linear range/μM | Potential/V vs. Ag/AgCl | pH | LOD/μM | Sensitivity/μA mM−1 | Ref. |
|---|---|---|---|---|---|---|---|---|
| a N,N′-Bis(salicylidene)-1,2-phenylenediaminocobalt(III). b Carbon paste electrode. c Poly(ethylenimine). d Poly(sodium-p-styrenesulfonate). e Indium tin oxide. f Not recorded. g Graphite. | ||||||||
| (CoSal)a4SiW12/CPEb | Cys | Amperometry | 0.01–1.0 | +0.3 | 5.0 | 9.67 × 10⁻³ | 16 | 63 |
| [PEIc/PSSd]2/Au@2Ag/[PEI/P2Mo17V]2/ITOe | Cys | Amperometry | 0.025–7.625 | +0.75 | 5.0 | 0.0276 | 1794.6 | 64 |
| POM/RGO/GCE | Trp | SWV | 1.0 × 10⁻⁵–1.0 × 10⁻³ | +0.9 | 6.0 | 2 × 10⁻⁶ | 10.56 × 10⁶ | 45 |
| PMoV@Fe3O4/GCE | Trp | DPV | 0.093–162.4 | +0.8 | 7.0 | 17 × 10−3 | 121 | 65 |
| (PMo9V3/CoTsPc)6/ITO | Cys | Amperometry | 0.25–170 | +0.9 | 7.0 | 0.01 | 20 | 66 |
| MnWO4/RGO/GCE | Trp | DPV | 0.001–120 | N.R.f | 7.0 | 4.4 × 10⁻³ | 43.3 | 67 |
| Prickly ball-like Co–La oxides/RGO/CPE | Cys | Amperometry | 1.0–888 | +0.55 | 7.0 | 0.1 | 4.3 | 68 |
| Gg/RGO–RuO | Trp | DPV | 0.5–240 | +0.7 | 7.0 | 0.236 | N.R. | 69 |
| CeO2/RGO–GCE | Trp | LSV | 0.06–1.0 | +0.8 | 5.5 | 5.6 × 10⁻³ | N.R. | 10 |
| 1.0–8.0 | ||||||||
| 10–100 | ||||||||
| (BTPB)SiW11Ni/P@ERGO/GCE | Cys | Amperometry | 10–250 | −0.5 | 7.0 | 0.12 | 805.9 | This work |
| 300–2500 | 77.4 | |||||||
| Trp | 1–2000 | +0.1 | 7.0 | 0.83 | 112.0 | This work | ||
3.7. Electro-oxidation mechanism of Cys and Trp
The electro-oxidation mechanism of Cys and Trp at the (BTPB)SiW11Ni/P@ERGO/GCE was investigated by examining the effect of scan rate and pH on the currents and potentials of the peak, respectively (Fig. 6). Fig. 6A and B show the CVs of 7.0 mmol L−1 Cys and 100 μmol L−1 Trp in PBS (0.01 mol L−1, pH 7) at the (BTPB)SiW11Ni/P@ERGO/GCE with different scan rates (10–400 mV s−1). The anodic peak currents of Cys and Trp linearly increased with the increased square root of the scan rate (ν1/2) (insets of Fig. 6A and B). This result confirms that the oxidation reactions of Cys and Trp at the (BTPB)SiW11Ni/P@ERGO/GCE are diffusion-controlled redox processes. The linear regression equation relating ipa to the ν1/2 was found to be ipa (μA) = 0.2640ν1/2 (mV1/2 s−1/2) + 0.0453 (R2 = 0.9901) (inset of Fig. 6A) for Cys and ipa (μA) = 0.3663ν1/2 (mV1/2 s−1/2) − 1.3695 (R2 = 0.9963) (inset of Fig. 6B) for Trp.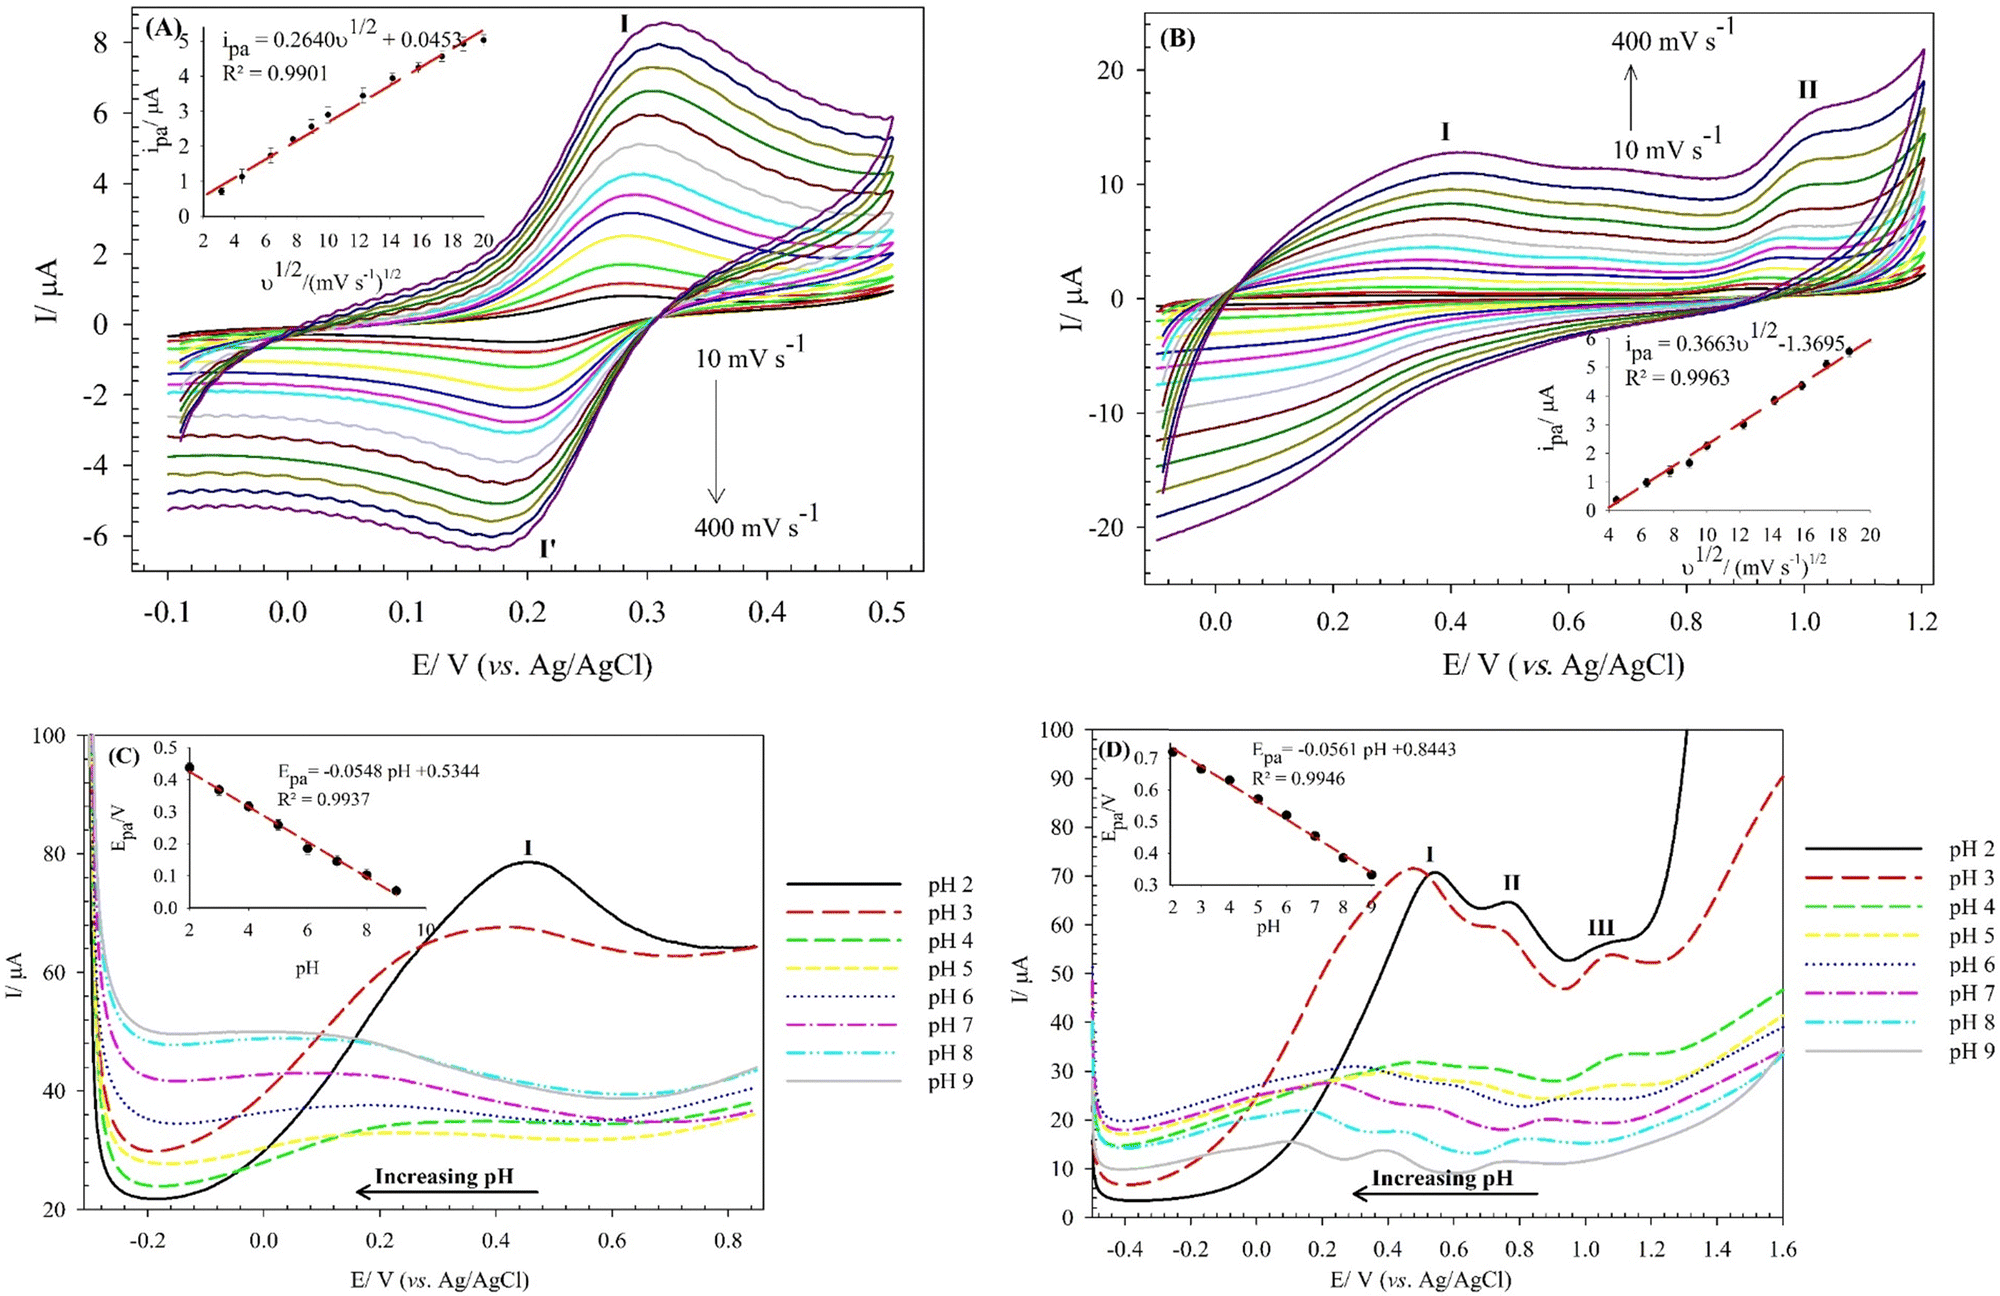 | ||
| Fig. 6 CVs of the (BTPB)SiW11Ni/P@ERGO/GCE in the presence of (A) 7.0 mmol L−1 of Cys, and (B) 100 μmol L−1 of Trp in PBS (0.01 mol L−1, pH 7) at different scan rates from 10 to 400 mV s−1. The insets show variations of the anodic peak currents (peak I) with scan rates, SWVs of the (BTPB)SiW11Ni/P@ERGO/GCE in the precence of (C) 200 μmol L−1 of Cys, and (D) 500 μmol L−1 of Trp in BRB at different pHs (pH 2–9); step potential 2 mV, amplitude potential 20 mV. The arrows show the shift in peak potentials upon increasing pH. The insets show the variation of the anodic peak potentials (peak I) with pHs. | ||
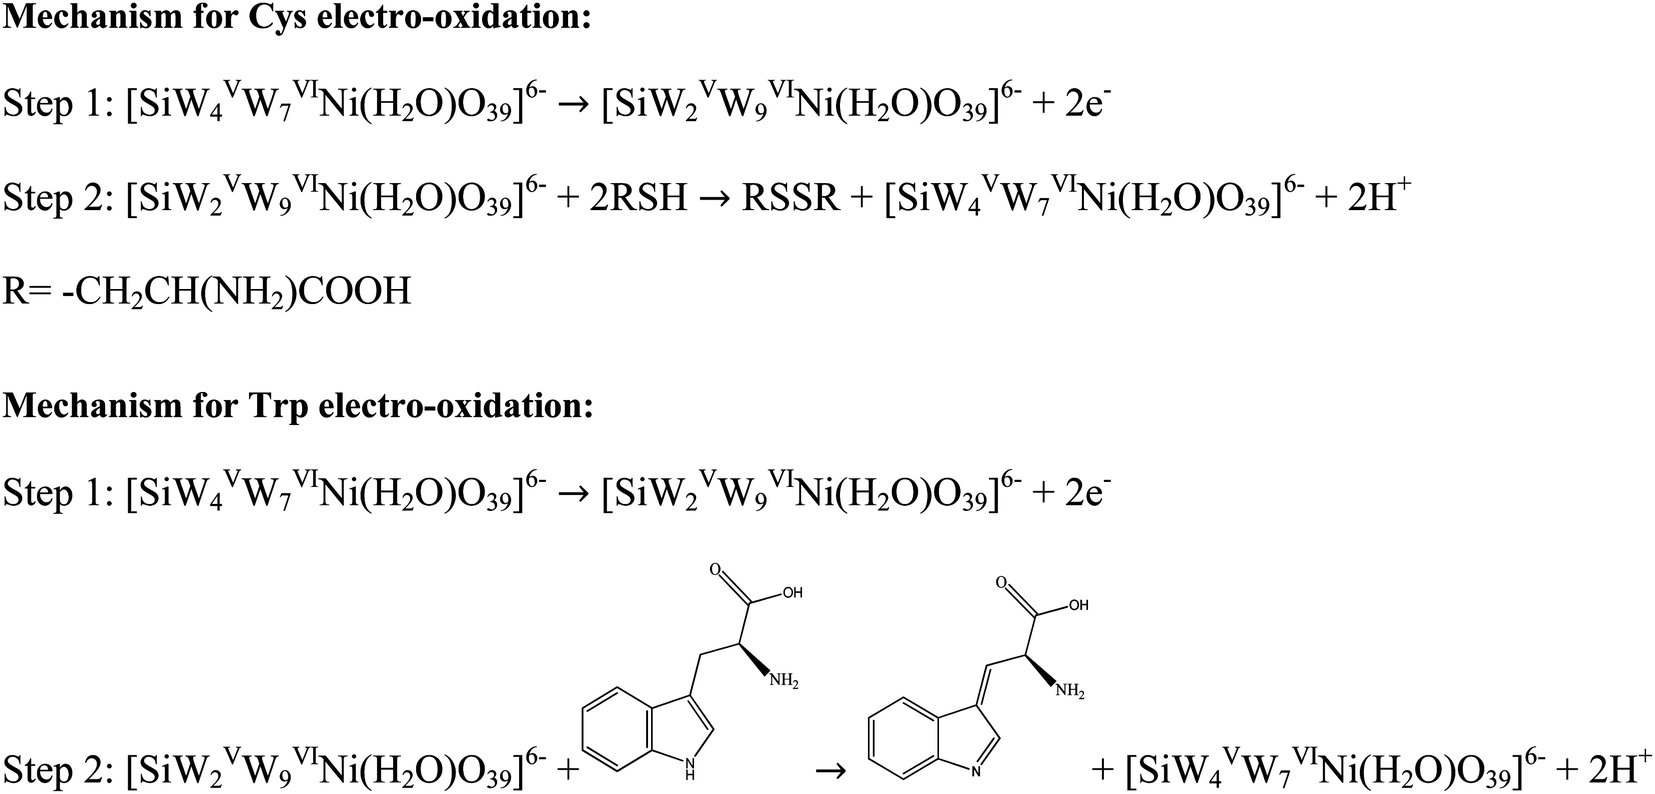
The effect of pH on the Epa of 200 μmol L−1 Cys and 500 μmol L−1 Trp was studied by SWV at a pH range of 2–9 using BRB. The obtained results are shown in Fig. 6C and D. The Epas for Cys and Trp displayed similar trends and shifted to more negative values with increasing pH from 2 to 9. This observation indicates that the oxidation of both analytes at the (BTPB)SiW11Ni/P@ERGO/GCE is a proton-involved catalytic reaction.63 A significant correlation was found between the Epas and pH with linear equations of Epc (V) = −0.0548pH + 0.5344 (R2 = 0.9937) for Cys and Epa (V) = −0.0561pH + 0.8443 (R2 = 0.9946) for Trp. The slope values of linear plots (54.8 and 56.1 mV pH−1 for Cys and Trp, respectively) are close to the theoretical value of 59.2 mV pH−1. This result suggests that the electro-oxidation of Cys, or Trp, at the (BTPB)SiW11Ni/P@ERGO/GCE, includes an equivalent number of protons and electrons. Accordingly, the electrocatalytic oxidation of Cys can be described as follows: the [SiWV4WVI7Ni(H2O)O39]6− component of modifier is electro-oxidized to [SiWV2WVI9Ni(H2O)O39]6−, which oxidize Cys to cysteine. An electrocatalytic oxidation of Trp can also be performed, similar to the oxidation of Cys (Scheme 2).
 | ||
| Scheme 2 The redox pathways of Cys, and Trp at the (BTPB)SiW11Ni/P@ERGO/GCE. | ||
3.8. Stability, repeatability, and reproducibility of the (BTPB)SiW11Ni/P@ERGO/GCE
One of the main goals of analytical electrochemistry is to achieve a sensor or a bio-sensor with high stability. On the other hand, the POM-based modified electrodes ordinarily have low stability in aqueous solutions because POMs can simply permeate from the surface of the modified electrode into the electrolyte. Therefore, the stability of the (BTPB)SiW11Ni/P@ERGO/GCE is one crucial parameter that must be evaluated. The stability of this bio-sensor was estimated using the amperometry technique in 0.01 mol L−1 PBS (pH 7). The result was presented in the (Fig. 7S-A, ESI†). Moreover, the long-term stability of the bio-sensor was evaluated by SWV measurements under ambient air over a four-week period. The results are shown in the (Fig. 7S-B, ESI†). Generally, these results confirmed that the (BTPB)SiW11Ni/P@ERGO/GCE bio-sensor has excellent stability that can be attributed to the presence of BTPB and immobilization of the (BTPB)SiW11Ni hybrid compound on the GO surface, which decreases the solubility of POMs in aqueous solutions.To investigate the repeatability of the (BTPB)SiW11Ni/P@ERGO/GCE, six different SWV measurements with one modified GCE were performed in 0.01 mol L−1 PBS (pH 7). Furthermore, six modified GCEs were prepared under identical conditions to validate the reproducibility. The relative standard deviation (RSD) measurements for the repeatability and reproducibility were 2.12% and 4.11%, respectively, demonstrating excellent precision for the fabricated bio-sensor. The obtained repeatability and reproducibility results are shown in the, Fig. 7S-C and D (ESI†), respectively.
3.9. Interference study
Selectivity is a vital parameter for sensors that indicates the selective response of the sensor toward the target analyte in the presence of other species. The effects of potential interferents for Cys and Trp determination at the modified electrode were studied by adding these species into PBS (0.01 mol L−1, pH 7) by the amperometry method (Fig. 7A and B, respectively). As shown in Fig. 7A and B, no significant change in the signal was found for each excess injection of ascorbic acid (AA) at 2-fold, arginine (Arg), glutathione (GSH), and uric acid (UA) at 1-fold, alanine (Ala), lysine (Lys), histidine (His), glutamic acid (Gln), leucine (Leu), and dopamine (DA) at 1/4-fold concentrations of Cys, and AA at 5-fold, Arg, Leu, and Lys at 4-fold, GSH at 3-fold, Gln at 1-fold, Ala, and UA at 1/2-fold, His, and DA at 1/5-fold concentrations of Trp. However, a significant response was observed with more addition of Cys or Trp. These results show the excellent selectivity of the (BTPB)SiW11Ni/P@ERGO/GCE to determine Cys and Trp in complex media. | ||
| Fig. 7 Effect of interfering species on the detection of (A) 200 μmol L−1 Cys at potential of −0.5 V, and (B) 100 μmol L−1 Trp at potential of +0.1 V at (BTPB)SiW11Ni/P@ERGO/GCE in PBS (0.01 mol L−1, pH 7). | ||
3.10. Determination of Cys and Trp in real samples
The analytical applicability of the proposed bio-sensor was assessed using N-acetylcysteine-mucolytic effervescent tablets (600 mg of N-acetylcysteine per tablet), egg white, and milk samples as real samples for Cys and Trp determination. Also, the commercial N-acetylcysteine-mucolytic effervescent tablet solution sample was prepared by dissolving one effervescent tablet in 400 mL of DI water, followed by injecting 10 μL of the sample into a voltammetric cell containing 20 mL PBS (0.01 mol L−1, pH 7.0). The egg white sample was prepared by suspending 400 mg of a finely powdered sample in 100 mL of PBS (0.01 mol L−1, pH 7.0). The suspension was placed in an ultrasonic bath for 15 min to disaggregate and disperse the particles and then filtered. Afterward, 10 mL of the filtrated solution was injected into a voltammetric cell. The milk sample was prepared by injecting 10 μL of this sample into 10 mL of PBS (0.01 mol L−1, pH 7.0) and then transferring it into the electrochemical cell without pretreatment. The experiments were done by the standard addition process, using SWV. The voltammetric analysis was carried out at the constant potential of about +0.1 V, an equilibration time of 5 s, a step potential of 2 mV, and a pulse amplitude of 20 mV. The Cys or Trp solutions with the known concentrations were added to the real samples to evaluate the recovery percentage of the injected analyte. The accuracy of the method was validated by HPLC analysis. The obtained results are listed in Table 3. The recovery values close to 100% with RSD smaller than 5% indicated the excellent accuracy of the proposed (BTPB)SiW11Ni/P@ERGO/GCE. Moreover, the lack of significant difference between SWV and HPLC analysis confirmed the accuracy and validity of the prepared bio-sensor. Therefore, it can be concluded that the bio-sensor has the potential ability to determine the trace levels of Cys and Trp in real samples.| Analyte | Sample | Originally (μmol L−1) | Spiked (μmol L−1) | SWV | HPLC | ||||
|---|---|---|---|---|---|---|---|---|---|
| Found (μmol L−1) | RSDa (%) | Recovery (%) | Found (μmol L−1) | RSD (%) | Recovery (%) | ||||
| a Relative standard deviation. b Not detected. | |||||||||
| Cys | N-Acetylcysteine (600 mg) | 4.59 | 0 | 4.31 ± 1.19 | 3.21 | 93.90 | — | — | — |
| 20 | 24.42 ± 1.22 | 4.04 | 99.31 | — | — | — | |||
| 60 | 65.13 ± 1.13 | 3.62 | 100.84 | 65.58 ± 1.13 | 3.51 | 101.53 | |||
| 100 | 105.31 ± 1.21 | 3.51 | 100.69 | 106.47 ± 1.17 | 3.46 | 101.79 | |||
| Milk | NDb | 0 | 0.15 ± 1.03 | 4.32 | — | — | — | — | |
| 20 | 19.75 ± 1.23 | 4.09 | 98.75 | — | — | — | |||
| 60 | 59.81 ± 0.97 | 3.29 | 99.68 | 60.43 ± 1.09 | 4.04 | 100.72 | |||
| 100 | 98.71 ± 1.04 | 3.25 | 98.71 | 100.26 ± 1.11 | 3.19 | 100.26 | |||
| Trp | Egg white | ND | 0 | 0.13 ± 1.26 | 4.30 | — | — | — | — |
| 20 | 19.82 ± 1.19 | 3.41 | 99.10 | — | — | — | |||
| 60 | 59.73 ± 1.14 | 3.62 | 99.55 | 60.14 ± 1.14 | 3.34 | 100.23 | |||
| 100 | 101.27 ± 1.09 | 3.28 | 101.27 | 102.32 ± 1.06 | 3.61 | 102.32 | |||
| Milk | ND | 0 | 0.12 ± 1.09 | 3.61 | — | — | — | — | |
| 20 | 19.76 ± 1.20 | 3.48 | 98.84 | — | — | — | |||
| 60 | 58.79 ± 1.16 | 3.27 | 97.98 | 60.54 ± 1.10 | 3.11 | 100.9 | |||
| 100 | 99.87 ± 1.24 | 4.05 | 99.87 | 101.56 ± 1.12 | 3.56 | 101.56 | |||
4. Conclusions
A novel bio-sensor based on POMs, BTPB, and P@ERGO was prepared and applied as an efficient electrocatalyst in the electrochemical determination of Cys and Trp. The (BTPB)SiW11Ni/P@ERGO/GCE bio-sensor revealed an excellent electrocatalytic activity for the oxidation of Cys and Trp. The essential characteristics of this bio-sensor are good stability, favorable repeatability, reproducibility, and convenient fabrication of the modified electrode. Moreover, the bio-sensor has specific features, including a low LOD, good linear range, high sensitivity, and excellent selectivity. Overall, this bio-sensor can be used to accurately measure Cys and Trp in real samples. All of these properties are favorable for enhancing the performance of these bio-sensors.Conflicts of interest
There are no conflicts to declare.Acknowledgements
The authors are grateful for the financial support from the Research Council of the University of Hormozgan.References
- X. Liu, J. Zhang, J. Di, Y. Long, W. Li and Y. Tu, J. Colloid Interface Sci., 2017, 505, 964–972 CrossRef CAS PubMed.
- Y.-M. Go and D. P. Jones, Free Radical Biol. Med., 2011, 50, 495–509 CrossRef CAS PubMed.
- Y.-P. Hsiao, W.-Y. Su, J.-R. Cheng and S.-H. Cheng, Electrochim. Acta, 2011, 56, 6887–6895 CrossRef CAS.
- P. T. Lee, J. E. Thomson, A. Karina, C. Salter, C. Johnston, S. G. Davies and R. G. Compton, Analyst, 2015, 140, 236–242 RSC.
- A. Karimi, S. Husain, M. Hosseini, P. A. Azar and M. Ganjali, Microchem. Acta, 2020, 187, 1–9 CrossRef PubMed.
- G. Ziyatdinova, E. Kozlova and H. Budnikov, Electrochim. Acta, 2018, 270, 369–377 CrossRef CAS.
- A. Özcan and Y. Şahin, Biosens. Bioelectron., 2012, 31, 26–31 CrossRef PubMed.
- K.-Q. Deng, J.-H. Zhou and X.-F. Li, Colloids Surf., B, 2013, 101, 183–188 CrossRef CAS PubMed.
- K.-J. Huang, C.-X. Xu, W.-Z. Xie and W. Wang, Colloids Surf., B, 2009, 74, 167–171 CrossRef CAS PubMed.
- B. Wu, L. Xiao, M. Zhang, C. Yang, Q. Li, G. Li, Q. He and J. Liu, J. Solid State Chem., 2021, 296, 122023 CrossRef CAS.
- G. F. Oxenkrug, Ann. N. Y. Acad. Sci., 2010, 1199, 1–14 CrossRef CAS PubMed.
- R. N. Goyal, S. Bishnoi, H. Chasta, M. A. Aziz and M. Oyama, Talanta, 2011, 85, 2626–2631 CrossRef CAS PubMed.
- H. Nishiuchi, M. Kohmura and H. Wakabayashi, Food Sci. Technol. Res., 2011, 17, 341–346 CrossRef CAS.
- Y. Wu, P. Deng, Y. Tian, Z. Ding, G. Li, J. Liu, Z. Zuberi and Q. He, Bioelectrochemistry, 2020, 131, 107393–107401 CrossRef CAS PubMed.
- M. Mehmandoust, N. Erk, M. Alizadeh and S. Salmanpour, J. Food Meas. Charact., 2021, 15, 5288–5295 CrossRef.
- W. Khamcharoen, C. S. Henry and W. Siangproh, Talanta, 2022, 237, 122983–122990 CrossRef CAS PubMed.
- K. Shen, L. Wang, Q. He, Z. Jin, W. Chen, C. Sun and Y. Pan, Anal. Chem., 2019, 92, 1763–1769 CrossRef PubMed.
- A. Savych, O. Polonets, L. Morozova, K. Syrovatko and T. Recun, Pharmacia, 2022, 69, 337–343 CrossRef CAS.
- X. Xiang, X. Sha, S. Su, Z. Zhu, S. Guo, H. Yan, D. Qian and J. A. Duan, J. Sep. Sci., 2018, 41, 996–1008 CrossRef CAS PubMed.
- K. i. Ichihara, C. Kohsaka and Y. Yamamoto, Anal. Biochem., 2021, 633, 114423 CrossRef CAS PubMed.
- F. Cao, Y. Huang, F. Wang, D. Kwak, Q. Dong, D. Song, J. Zeng and Y. Lei, Anal. Chim. Acta, 2018, 1019, 103–110 CrossRef CAS PubMed.
- Y. Zhang, G. I. Waterhouse, Z.-P. Xiang, J. Che, C. Chen and W. Sun, Food Chem., 2020, 326, 126976 CrossRef CAS PubMed.
- N. Sattarahmady and H. Heli, Anal. Biochem., 2011, 409, 74–80 CrossRef CAS PubMed.
- S. Dianat and A. Karimi-Takallo, Inorg. Chem. Res., 2021, 5, 215–223 Search PubMed.
- M. Sharifi, S. Dianat and A. Hosseinian, RSC Adv., 2021, 11, 8993–9007 RSC.
- D. C. Patra and S. P. Mondal, ACS Appl. Nano Mater., 2023, 6, 3111–3120 CrossRef CAS.
- D. S. Sipuka, T. I. Sebokolodi, F. O. Olorundare, C. Muzenda, O. V. Nkwachukwu, D. Nkosi and O. A. Arotiba, Electrocatalysis, 2023, 14, 9–17 CrossRef CAS.
- V. Bressi, Z. Akbari, M. Montazerozohori, A. Ferlazzo, D. Iannazzo, C. Espro and G. Neri, Sensors, 2022, 22, 900–914 CrossRef CAS PubMed.
- G. V. Lima, L. dos Santos Mello, E. R. Dockal and M. F. de Oliveira, Microchem. J., 2022, 175, 107209 CrossRef CAS.
- M. Narayanan, N. P. S. Chauhan and P. Perumal, RSC Adv., 2023, 13, 5565–5575 RSC.
- T. Basili, H. Y. Kalyon, M. Gencten, M. Macit and Y. Sahin, New J. Chem., 2023, 47, 691–707 RSC.
- M. R. Horn, A. Singh, S. Alomari, S. Goberna-Ferrón, R. Benages-Vilau, N. Chodankar, N. Motta, K. K. Ostrikov, J. MacLeod and P. Sonar, Energy Environ. Sci., 2021, 14, 1652–1700 RSC.
- T. Ueda, ChemElectroChem, 2018, 5, 823–838 CrossRef CAS.
- Z. Li, J. Zhang, X. Jing, J. Dong, H. Liu, H. Lv, Y. Chi and C. Hu, J. Mater. Chem. A, 2021, 9, 6152–6159 RSC.
- S. Shahsavarifar, M. Masteri-Farahani and M. R. Ganjali, Langmuir, 2021, 37, 1925–1931 CrossRef CAS PubMed.
- H. Ravanbakhsh, S. Dianat and A. Hosseinian, RSC Adv., 2022, 12, 9210–9222 RSC.
- B. D’Cruz, M. O. Amin and E. Al-Hetlani, Ind. Eng. Chem. Res., 2021, 60, 10960–10977 CrossRef.
- A. Karimi-Takallo, S. Dianat and A. Hatefi-Mehrjardi, J. Electroanal. Chem., 2021, 886, 115139 CrossRef CAS.
- J. W. Jordan, G. A. Lowe, R. L. McSweeney, C. T. Stoppiello, R. W. Lodge, S. T. Skowron, J. Biskupek, G. A. Rance, U. Kaiser and D. A. Walsh, Adv. Mater., 2019, 31, 1904182 CrossRef CAS PubMed.
- B. Sang, Z.-w. Li, X.-h. Li, L.-g. Yu and Z.-j. Zhang, J. Mater. Sci., 2016, 51, 8271–8295 CrossRef CAS.
- Y. Xia, G. Li, Y. Zhu, Q. He and C. Hu, Microchem. J., 2023, 190, 108726 CrossRef CAS.
- H. Li, S. Pang, S. Wu, X. Feng, K. Müllen and C. Bubeck, J. Am. Chem. Soc., 2011, 133, 9423–9429 CrossRef CAS PubMed.
- J. Chen, S. Liu, W. Feng, G. Zhang and F. Yang, Phys. Chem. Chem. Phys., 2013, 15, 5664–5669 RSC.
- M. L. Yola, N. Atar, T. Eren, H. Karimi-Maleh and S. Wang, RSC Adv., 2015, 5, 65953–65962 RSC.
- Ö. A. Yokuş, F. Kardaş, O. Akyıldırım, T. Eren, N. Atar and M. L. Yola, Sens. Actuators, B, 2016, 233, 47–54 CrossRef.
- W. Guo, X. Tong and S. Liu, Electrochim. Acta, 2015, 173, 540–550 CrossRef CAS.
- R. Liu, Z. Xian, S. Zhang, C. Chen, Z. Yang, H. Li, W. Zheng, G. Zhang and H. Cao, RSC Adv., 2015, 5, 74447–74456 RSC.
- L. Chen, Y. Tang, K. Wang, C. Liu and S. Luo, Electrochem. Commun., 2011, 13, 133–137 CrossRef CAS.
- Y. Mai, M. Zhou, H. Ling, F. Chen, W. Lian and X. Jie, Appl. Surf. Sci., 2018, 433, 232–239 CrossRef CAS.
- F. Li, B. Ni, Y. Zheng, Y. Huang and G. Li, Surf. Interfaces, 2021, 26, 101375 CrossRef CAS.
- K. Gopalakrishnan, S. Sultan, A. Govindaraj and C. Rao, Nano Energy, 2015, 12, 52–58 CrossRef CAS.
- D. Zhang, Y. Zhang, Y. Luo, Y. Zhang, X. Li, X. Yu, H. Ding, P. K. Chu and L. Sun, Nano Res., 2018, 11, 1651–1663 CrossRef CAS.
- J. Wang, L. Shen, H. Li, X. Wang, P. Nie, B. Ding, G. Xu, H. Dou and X. Zhang, Electrochim. Acta, 2014, 133, 209–216 CrossRef CAS.
- N. Lingappan and D. J. Kang, Electrochim. Acta, 2016, 193, 128–136 CrossRef CAS.
- R. Ding, J. Zhang, J. Qi, Z. Li, C. Wang and M. Chen, ACS Appl. Mater. Interfaces, 2018, 10, 13470–13478 CrossRef CAS PubMed.
- R. Carrera-Cerritos, V. Baglio, A. Aricò, J. Ledesma-García, M. Sgroi, D. Pullini, A. Pruna, D. Mataix, R. Fuentes-Ramírez and L. Arriaga, Appl. Catal., B, 2014, 144, 554–560 CrossRef CAS.
- Z. Wang, P. Li, Y. Chen, J. He, J. Liu, W. Zhang and Y. Li, J. Power Sources, 2014, 263, 246–251 CrossRef CAS.
- T. J. Weakley and S. Malik, J. Inorg. Nucl. Chem., 1967, 29, 2935–2944 CrossRef CAS.
- J.-C. Chang, W.-Y. Ho, I.-W. Sun, Y.-K. Chou, H.-H. Hsieh and T.-Y. Wu, Polyhedron, 2011, 30, 497–507 CrossRef CAS.
- D. C. Marcano, D. V. Kosynkin, J. M. Berlin, A. Sinitskii, Z. Sun, A. Slesarev, L. B. Alemany, W. Lu and J. M. Tour, ACS Nano, 2010, 4, 4806–4814 CrossRef CAS PubMed.
- L. R. Faulkner and A. J. Bard, Electrochemical methods: fundamentals and applications, John Wiley and Sons, 2002 Search PubMed.
- J. Zhao, L. Luo, X. Yang, E. Wang and S. Dong, Electroanalysis, 1999, 11, 1108–1113 CrossRef CAS.
- S. Kakhki and E. Shams, J. Electroanal. Chem., 2013, 704, 249–254 CrossRef CAS.
- L. Zhang, L. Ning, Z. Zhang, S. Li, H. Yan, H. Pang and H. Ma, Sens. Actuators, B, 2015, 221, 28–36 CrossRef CAS.
- D. Zhu, Z. Bai, H. Ma, L. Tan, H. Pang and X. Wang, Sens. Actuators, B, 2020, 309, 127787 CrossRef CAS.
- M.-Y. Chu, J. Jiao, W. Zhu, X. Yang, T.-T. Yu, G.-X. Yang and H.-Y. Ma, Tungsten, 2022, 4, 138–148 CrossRef.
- R. Sundaresan, V. Mariyappan, S.-M. Chen, M. Keerthi and R. Ramachandran, Colloids Surf., A, 2021, 625, 126889 CrossRef CAS.
- S. Yang, G. Li, N. Xia, Y. Wang, P. Liu and L. Qu, J. Alloys Compd., 2021, 853, 157077 CrossRef CAS.
- M. B. Hegde, K. N. S. Mohana, A. M. Madhusudhana, M. Vinay, Y. A. Nayaka and N. K. Swamy, Graphene 2D Mater., 2021, 6, 25–34 CrossRef.
Footnote |
| † Electronic supplementary information (ESI) available. See DOI: https://doi.org/10.1039/d3ma00528c |
| This journal is © The Royal Society of Chemistry 2023 |