
 Open Access Article
 This Open Access Article is licensed under a Creative Commons Attribution-Non Commercial 3.0 Unported Licence
Synthesis and photophysical properties of (post-)functionalized BOAHY dyes with strong aggregation-induced emission†
Jonathan B. F.
Vandenwijngaerden‡
 a,
Jianjun
Huang‡
b,
Charlotte
Cresens
a,
Wim
Dehaen
b,
Luc
Van Meervelt
c,
Susana
Rocha
a,
Mark
Van der Auweraer
a and
Eduard
Fron
*ad
a,
Jianjun
Huang‡
b,
Charlotte
Cresens
a,
Wim
Dehaen
b,
Luc
Van Meervelt
c,
Susana
Rocha
a,
Mark
Van der Auweraer
a and
Eduard
Fron
*ad
aMolecular Imaging and Photonics, Department of Chemistry, KU Leuven, Celestijnenlaan 200F, 3001 Leuven, Belgium
bSustainable Chemistry for Metals and Molecules, Department of Chemistry, KU Leuven, Celestijnenlaan 200F, 3001 Leuven, Belgium
cBiochemistry, Molecular and Structural Biology, Department of Chemistry, KU Leuven, Celestijnenlaan 200F, 3001 Leuven, Belgium
dKU Leuven Core Facility for Advanced Spectroscopy, Celestijnenlaan 200F, 3001 Leuven, Belgium. E-mail: eduard.fron@kuleuven.be
First published on 15th September 2023
Abstract
A series of new difluoroboronate anchored acylhydrazone (BOAHY) derivates were prepared in good yields via a simple two-step reaction starting from commercially available reagents. The spectroscopic properties of these dyes can be easily tuned through appropriate functionalization and post-functionalization. While these BOAHYs are dim in solution, they are intensely fluorescent in the solid state, with absolute quantum yields up to 33%. By changing the solvent composition to reduce their solubility, the dyes form aggregates, thus switching on the fluorescence. Steady-state and time-resolved spectroscopy, as well as X-ray crystallography, provide a full characterization of these new BOAHYs and reveal the mechanism behind their aggregation-induced emission (AIE) behavior.
Introduction
Fluorescent molecules have been of interest to scientists for almost two centuries. G. G. Stokes studied the naturally occurring fluorophore quinine and was the first to correctly explain its behavior in terms of the absorption and emission of light, coining the term ‘fluorescence’ in 1852.1 The following decades saw the preparation of many types of new synthetic fluorophores. Among them, the organoboron dyes have attracted much attention in recent years because of their structural versatility, tunable photophysical properties, large absorption coefficient, high fluorescence quantum yield, good photostability and simple synthesis.2 Organoboron dyes consist of a π-conjugated organic core that chelates one or more difluoroboron (BF2) units. Without the difluoroboron group, excitation of the flexible organic core is mainly followed by non-radiative relaxation to the ground state. Introducing a difluoroboron unit causes the conjugated π-system to become more rigid and planar, which allows the molecule to relax through the emission of fluorescence photons.3,4 Furthermore, owing to its strong electron-withdrawing effect, the difluoroboron group can facilitate intramolecular charge transfer (ICT), leading to small bandgaps and long absorption and emission wavelengths.4–8 The benefits of incorporating this difluoroboron moiety have fueled the development of a multitude of organoboron compounds, including BODIPY,2,9,10 BOPAHY,11–13 BOPHY14,15 and BOPPY16 derivatives (Fig. 1). Applications such as light harvesting, optoelectronic devices, chemical sensing, biological imaging and medical theranostics have been reported for these dyes.2,8,10–16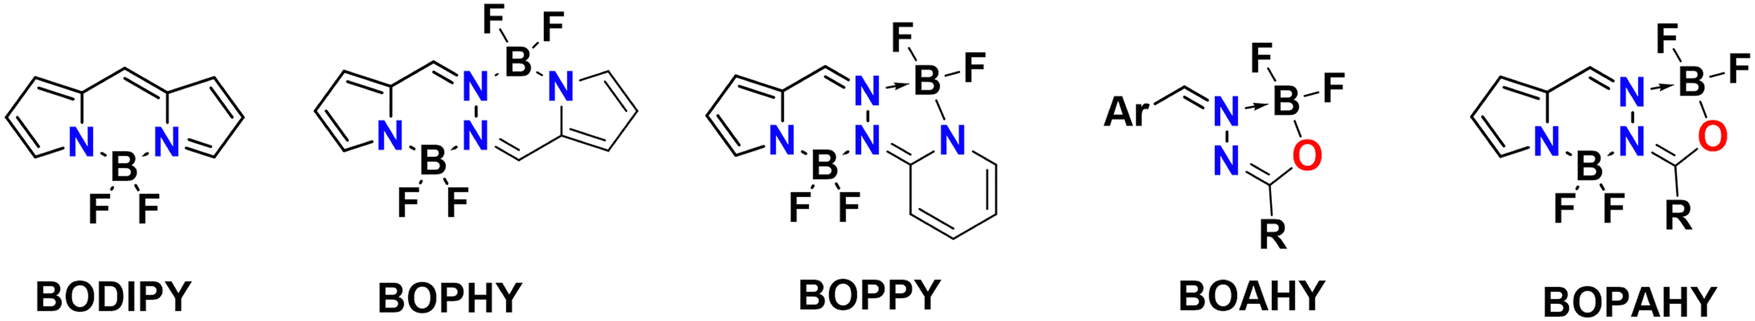 | ||
| Fig. 1 Reported molecular structures of organoboron complexes. | ||
However, the practical use of organoboron dyes in these fields is often limited by their weak emission in the solid state. While the rigid, planar organoboron core permits intense fluorescence in dilute solutions, this geometry also enables the dye molecules to pack tightly in aggregates or in the solid state. In such a tight packing the excited state is split by exciton interaction and, depending upon the exact packing geometry, the radiative transition from the lowest exciton state is often forbidden.17–20 This generally leads to a strong reduction of the fluorescence quantum yield. Strong intermolecular π–π stacking interactions between the aromatic rings of neighboring molecules sometimes enable fast non-radiative relaxation of the fluorophore after excitation and therefore further quench the fluorescence.4,5,21–24 In order to remedy these issues, on can try to prevent aggregation by improving the solubility of the dyes or by fine control of the concentration. Still, such efforts fail to make the dyes suitable for applications in film or solid state. In this case, proper substitution of the dye must lead to a packing where the transition from the lowest exciton state to the ground state is enhanced rather than forbidden as is the case in e.g. J-aggregates.25–32 For flexible chromophores where internal rotations in the conjugation chain can lead to rapid non-radiative deactivation,33–36 the fluorescence intensity can even be enhanced upon aggregation, as intra- and intermolecular interactions within the aggregates restrict vibrational and rotational motion, thus rigidifying the fluorophore and blocking non-radiative decay. The phenomenon that some molecules show strong fluorescence in the solid state, while their emission in dilute solution is relatively weak, was already described by Stokes in 1853.37 In the 1930s, Scheibe and Jelley were the first to report the emergence of a strong new band in the fluorescence spectrum of molecular aggregates, which was different from the monomer emission band.25,29,38,39 The new band and the increased fluorescence were correctly attributed to a combination of superradiance and rigidification induced by aggregation. Since 2001, this has been labelled ‘aggregation-induced emission’ (AIE).40–43
Recently, a new family of AIE-active organoboron fluorophores, known as difluoroboronate anchored acylhydrazones (BOAHY), was designed by Jiao and coworkers.7 BOAHY dyes contain one difluoroboron unit through N–B–O chelation. As such, these compounds are the monochelated form of the BOPAHY dyes, which coordinate two difluoroboron groups through an unsymmetrical combination of N–B–N and N–B–O bridges and which were investigated earlier by both our group as well as Jiao's.11–13,44 In this context, a series of new BOAHY derivates are presented here. Almost nonfluorescent in solution, these dyes show considerable fluorescence in the solid state, with fluorescence quantum yields up to 33%. This work reports the synthesis and post-functionalization of these new BOAHY dyes and provides an in-depth photophysical characterization in view of their AIE properties.
Results and discussion
Synthesis of the BOAHY derivates
BOAHYs 2a–2e were synthesized started from condensing 2-formyl pyrrole and carbohydrazide in ethanol with the assistance of acetic acid as catalyst (Scheme 1). The formed intermediate hydrazone ligand was subsequently deprotonated using triethylamine, followed by boron chelation in dry toluene to afford the desired BOAHY dyes. For instance, the simplest BOAHY compound, 3,5,7-trimethyl BOAHY 2a, was obtained with a yield of 55%. BOAHY 2b, featuring a 4-pyridyl substituent on the oxadiazaborole ring, was synthesized from 3,5-dimethyl-1H-pyrrole-2-carbaldehyde and pyridine-4-carbohydrazide, achieving an overall yield of 80%. Compound 2c, a meso-substituted BOAHY dye with a furan moiety at the 3-position, was synthesized with a yield of 78%, by introducing a five-membered heteroaromatic ring substituents. Halogenated BOAHYs 2d and 2e were obtained with yields of 60% and 25%, respectively, by utilizing bromohetaryl-substituted hydrazides and 2-formylated 3,5-dimethylpyrrole.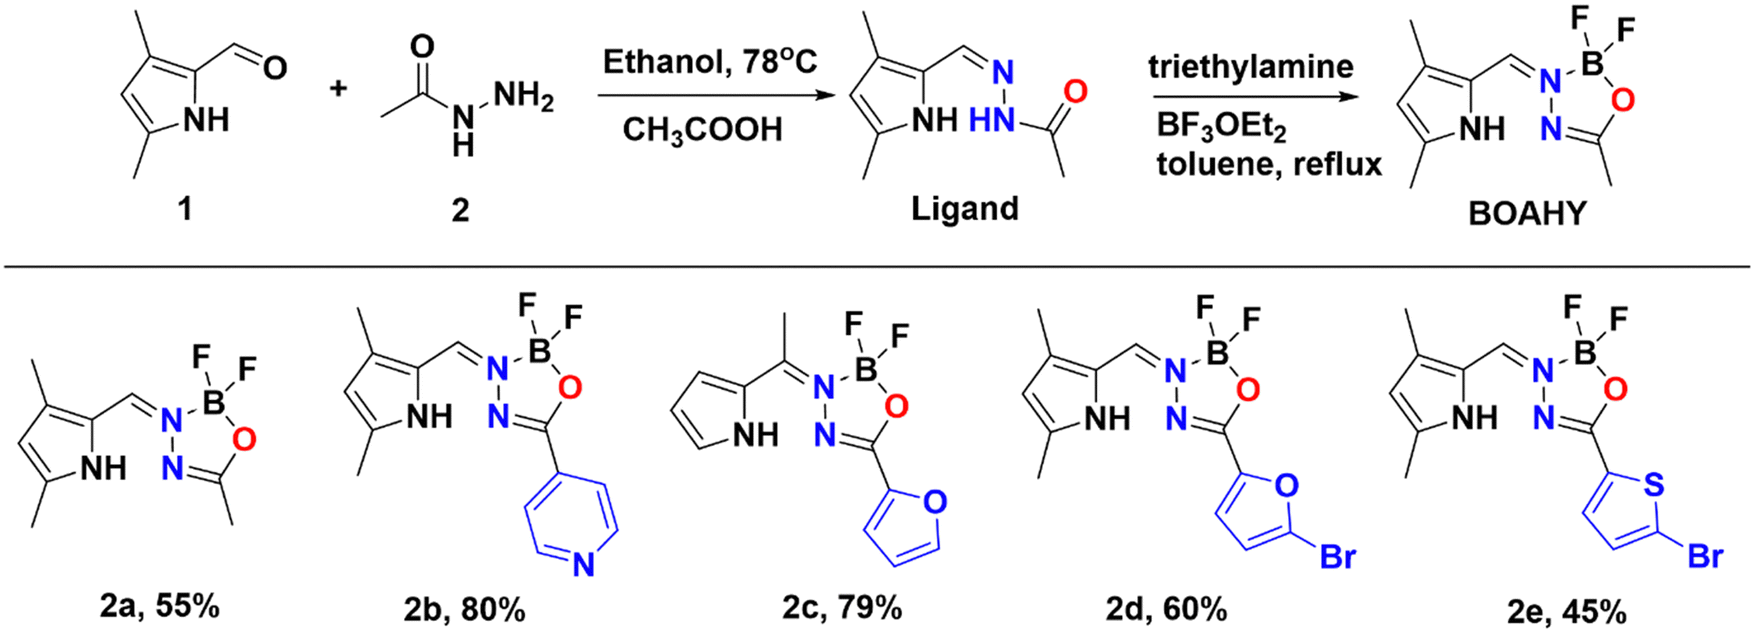 | ||
| Scheme 1 Synthesis of BOAHYs 2a–2e. | ||
Notably, post-functionalized BOAHYs 2f and 2g (as shown in Scheme 2) were efficiently derived from 2d and 2e, which possess a bromide functional group. The structures of all compounds 2a–2g were confirmed through high-resolution mass spectrometry and various NMR spectroscopic techniques including 1H, 11B, 13C, and 19F NMR spectroscopy, most of them were further confirmed by single X-ray crystallography (see ESI†).
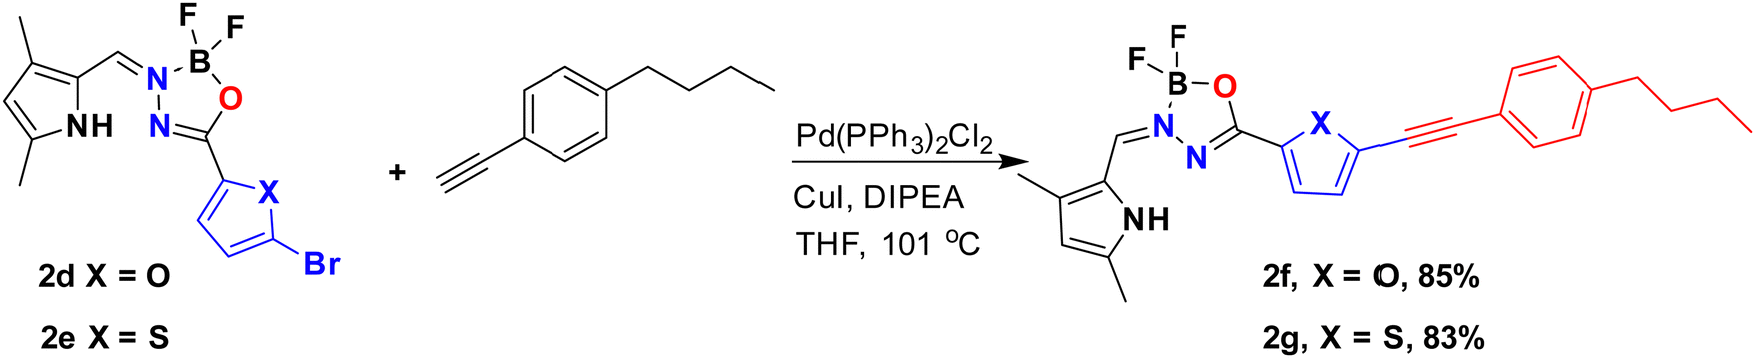 | ||
| Scheme 2 Synthesis of BOAHYs 2f–2gvia post-functionalization. | ||
X-ray crystallography
The molecular and crystal structure of compounds 2a–2g was determined by single-crystal X-ray diffraction (Fig. 2, Fig. S1–S7 and Tables S1–S4, ESI†).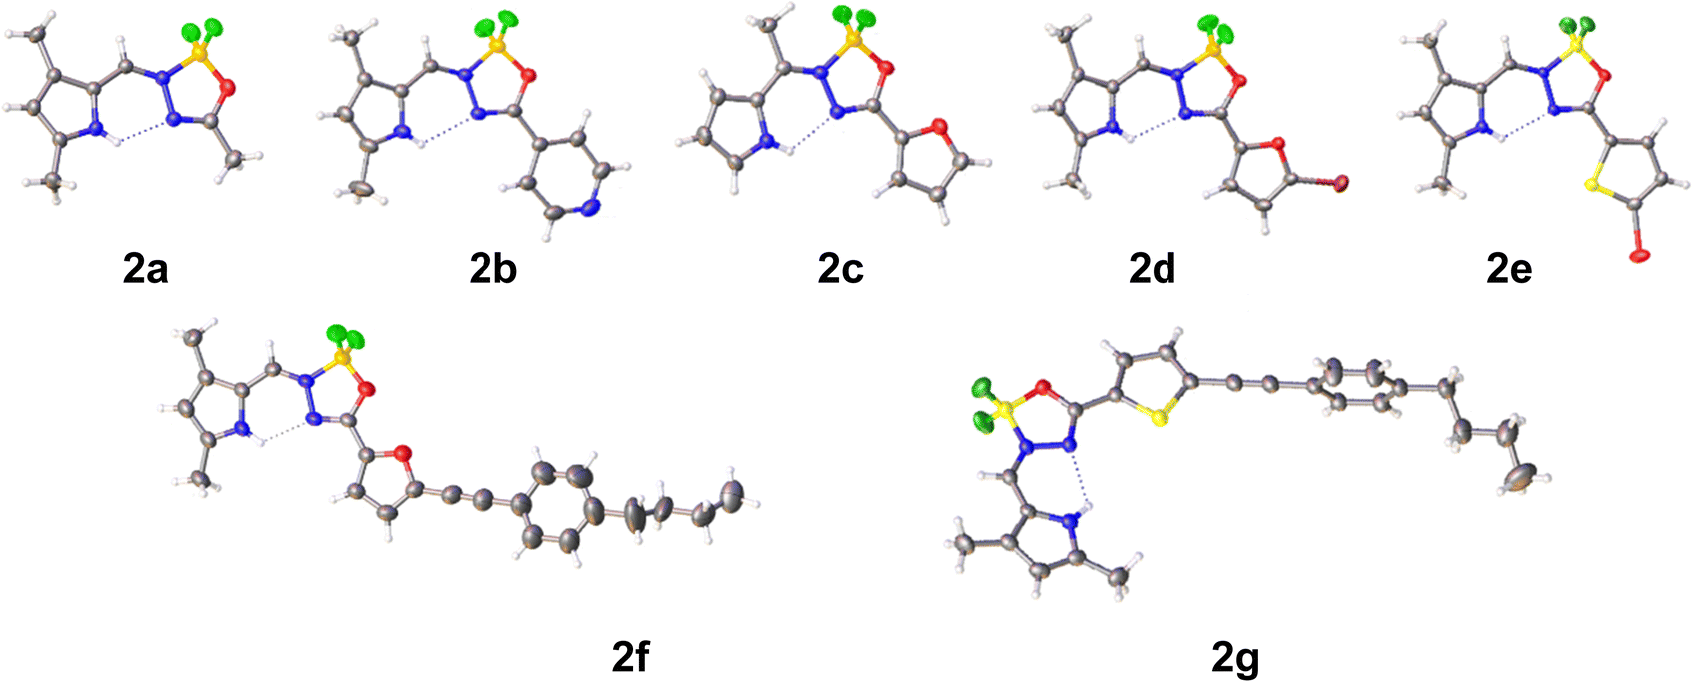 | ||
| Fig. 2 X-ray crystal structures of 2a–2g with thermal ellipsoids at 30% probability level. | ||
Crystals of 2a were obtained from DCM/pentane and belong to space group P![[1 with combining macron]](https://www.rsc.org/images/entities/char_0031_0304.gif) . The dihedral angle between the two rings is 9.39(15)°. In addition to an intramolecular N–H⋯N hydrogen bond [H10⋯N4 = 2.27(3) Å], two C–H⋯F interactions are observed in the crystal packing [H14A⋯F6i = 2.54 Å and H16A⋯F7ii = 2.50 Å; symmetry codes: (i) 1 + x, −1 + y, z, (ii) 1 − x, 1 − y, 2 − z].
. The dihedral angle between the two rings is 9.39(15)°. In addition to an intramolecular N–H⋯N hydrogen bond [H10⋯N4 = 2.27(3) Å], two C–H⋯F interactions are observed in the crystal packing [H14A⋯F6i = 2.54 Å and H16A⋯F7ii = 2.50 Å; symmetry codes: (i) 1 + x, −1 + y, z, (ii) 1 − x, 1 − y, 2 − z].
Crystals of 2b were obtained from DCM/pentane and belong to space group P. The central ring makes a dihedral angle of 6.13(13) and 1.77(11)° with the pyrrole and pyridine rings, respectively. An intramolecular N–H⋯N hydrogen bond [H10⋯N4 = 2.34(2) Å] helps to extend the conjugation and planarity. The crystal packing is characterized by formation of inversion dimers through C–H⋯N, C–H⋯F and π–π stacking interactions. Dimers stacked in columns along the a-direction [Cg2⋯Cg3i = 3.7255(14) Å; Cg2 and Cg3 are the centroids of the pyrrole and pyridine rings; symmetry code: (i) −x, 1 − y, 1 − z].
Compound 2c crystallizes from DCM/pentane in space group P21/c with two molecules (A and B) in the asymmetric unit. In molecule A the dihedral angles between the central ring and the pyrrole and furane rings are 4.93(14) and 4.30(14)°, respectively, while 6.30(13) and 3.59(17)° in the other molecule B. In addition to the intramolecular N–H⋯N hydrogen bonds [H14⋯N3 = 2.17 Å and H33⋯N22 = 2.20 Å] also intramolecular C–H⋯F interactions are present between the methyl group and one of the fluorine atoms [H12A⋯F18 = 2.53 Å and H31A⋯F37 = 2.46 Å]. Both molecules are linked by an N–H⋯F interaction [H33⋯F19i = 2.46 Å; symmetry code: (i) −1 + x, y, z]. This dimer motif is further extended by N–H⋯F and C–H⋯O interactions [H14⋯F38i = 2.48 Å and H15⋯O20i = 2.58 Å] resulting in layers parallel to (002). No real π–π stacking is observed between these layers.
Also compound 2d crystallizes in space group P21/c with two molecules (A and B) in the asymmetric unit (DCM/pentane used as solvent). Compared to 2c, the removal of the meso-methyl and introduction of bromo (on the furane) and methyl substituents (on the pyrrole) reduces the planarity of the molecule [dihedral angles between central ring and pyrrole and furane rings: 14.6(2) and 0.6(2)° for molecule A, 10.7(2) and 9.95(18)° for molecule B]. The usual intramolecular N–H⋯N interactions are observed [H14⋯N3 = 2.29(3) Å and H35⋯N24 = 2.17(4) Å]. Two types of dimers resulting from C–H⋯Br interactions are present in the crystal packing (Fig. S4, ESI†): C19–H19C⋯Br11 for the A–A inversion dimer, C19–H19B⋯Br32 and C40–H40B⋯Br11 for the A–B dimer. This dimer formation also leads to π⋯π stacking and Br⋯π interactions [Cg3⋯Cg5i = 3.4587(17) Å and Br32⋯Cg3ii = 3.8551(13) Å; Cg3 and Cg5 are the centroids of pyrrole ring N14 and furane ring O28; symmetry codes: (i) 1 – x, −1/2 + y, 3/2 − z, (ii) 1 − x, 1 − y, 1 − z].
Compound 2e crystallizes from DCM/pentane in space group P212121. The introduction of bromo and methyl substituents has no influence on the planarity of the molecule [dihedral angles between central ring and pyrrole and thiophene rings: 2.4(2) and 4.8(2)°]. Again, an intramolecular N–H⋯N hydrogen bond [H14⋯N3 = 2.23(4) Å] is present. In contrast to 2c and 2d, the thiophene S atom is turned away from the O atom in the central ring (s-trans). The crystal packing shows mainly interactions with the thiophene ring [H9⋯Cg1i = 2.84 Å; Cg1 is the centroid of the thiophene ring; symmetry code: (i) 1/2 + x, 3/2 − y, 1 − z] and pyrrole ring [Br11⋯Cg3ii = 3.3538(18) Å; Cg3 is the centroid of the pyrrole ring; symmetry code: (ii) 2 − x, 1/2 + y, 1/2 − z].
Compound 2f crystallizes from DCM/diethyl ether in space group P. The phenyl-butyl chain is disordered over two positions with occupancies 0.497(11)/0.503(11) for parts 1 and 2, respectively. Additional constraints on bond distances, angles, planarity and temperature factors were necessary for the disordered parts. The dihedral angles between the central ring and the pyrrole and furan rings are 9.2(3) and 3.6(3)°. An intramolecular N–H⋯N hydrogen bond is observed on both molecules [H25⋯N3 = 2.25 Å]. The orientation of the furan ring with respect to the central ring is similar to 2d. The furan ring is inclined by 14.1(7) and 74.9(8)° to the phenyl ring in part 1 and 2, respectively. The shortest Cg⋯Cg contact is between two pyrrole rings [Cg2⋯Cg3i = 3.699(3) Å; Cg2 and Cg3 are the centroids of the furan and pyrrole ring, respectively; symmetry code: (i) 2 − x, 1 − y, −z].
Compound 2g crystallizes from DCM/pentane in space group P with two molecules (A and B) in the asymmetric unit. The butyl chain in molecule B is disordered over two positions with occupancies 0.464(11)/0.536(11). Both molecules differ in the orientation of the butyl chain (rms deviation overlay of both molecules is 0.5969 Å). In molecule A the dihedral angles between the central ring and the pyrrole and thiophene rings are 9.47(19) and 6.68(18)°, respectively, while 9.7(2) and 6.61(19)° in the other molecule B. An intramolecular N–H⋯N hydrogen bond is observed on both molecules [H25⋯N3 = 2.26(3) and H57⋯N35 = 2.27(3) Å]. The orientation of the thiophene ring with respect to the central ring is similar to 2e. Both thiophene rings are involved in C–H⋯π interactions [H15⋯Cg5i = 2.82 Å, H49⋯Cg1i = 2.87 Å; Cg5 and Cg1 are the centroids of the thiophene rings in molecules A and B, respectively; symmetry code: (i) x, −1 + y, z]. In addition, C–H⋯F interactions are present between neighboring molecules [H29B⋯F32ii = 2.55 Å, H61A⋯F63 = 2.50 Å; symmetry code: (ii) 1 + x, −1 + y, z]. The shortest Cg⋯Cg contact is between two pyrrole rings [Cg3⋯Cg3 = 3.700(2) Å; Cg3 is the centroid of the pyrrole ring in molecule B; symmetry code: (iii) 2 − x, 1 − y, −z].
None of the crystal packings shows the presence of voids.
Steady-state spectroscopy in solution and solid state
The steady-state absorption and emission spectra of BOAHYs 2a–2g were measured in acetonitrile, heptane (2.0 × 10⁻⁵ mol L−1) and the solid state, in order to evaluate how their molecular structure and functional groups affect their photophysical properties. Fig. 3 shows the normalized absorption and emission spectra measured in solution. The corresponding spectra of solid powders are provided in the ESI† (Fig. S11, ESI†). The important spectroscopic data are listed in Table 1.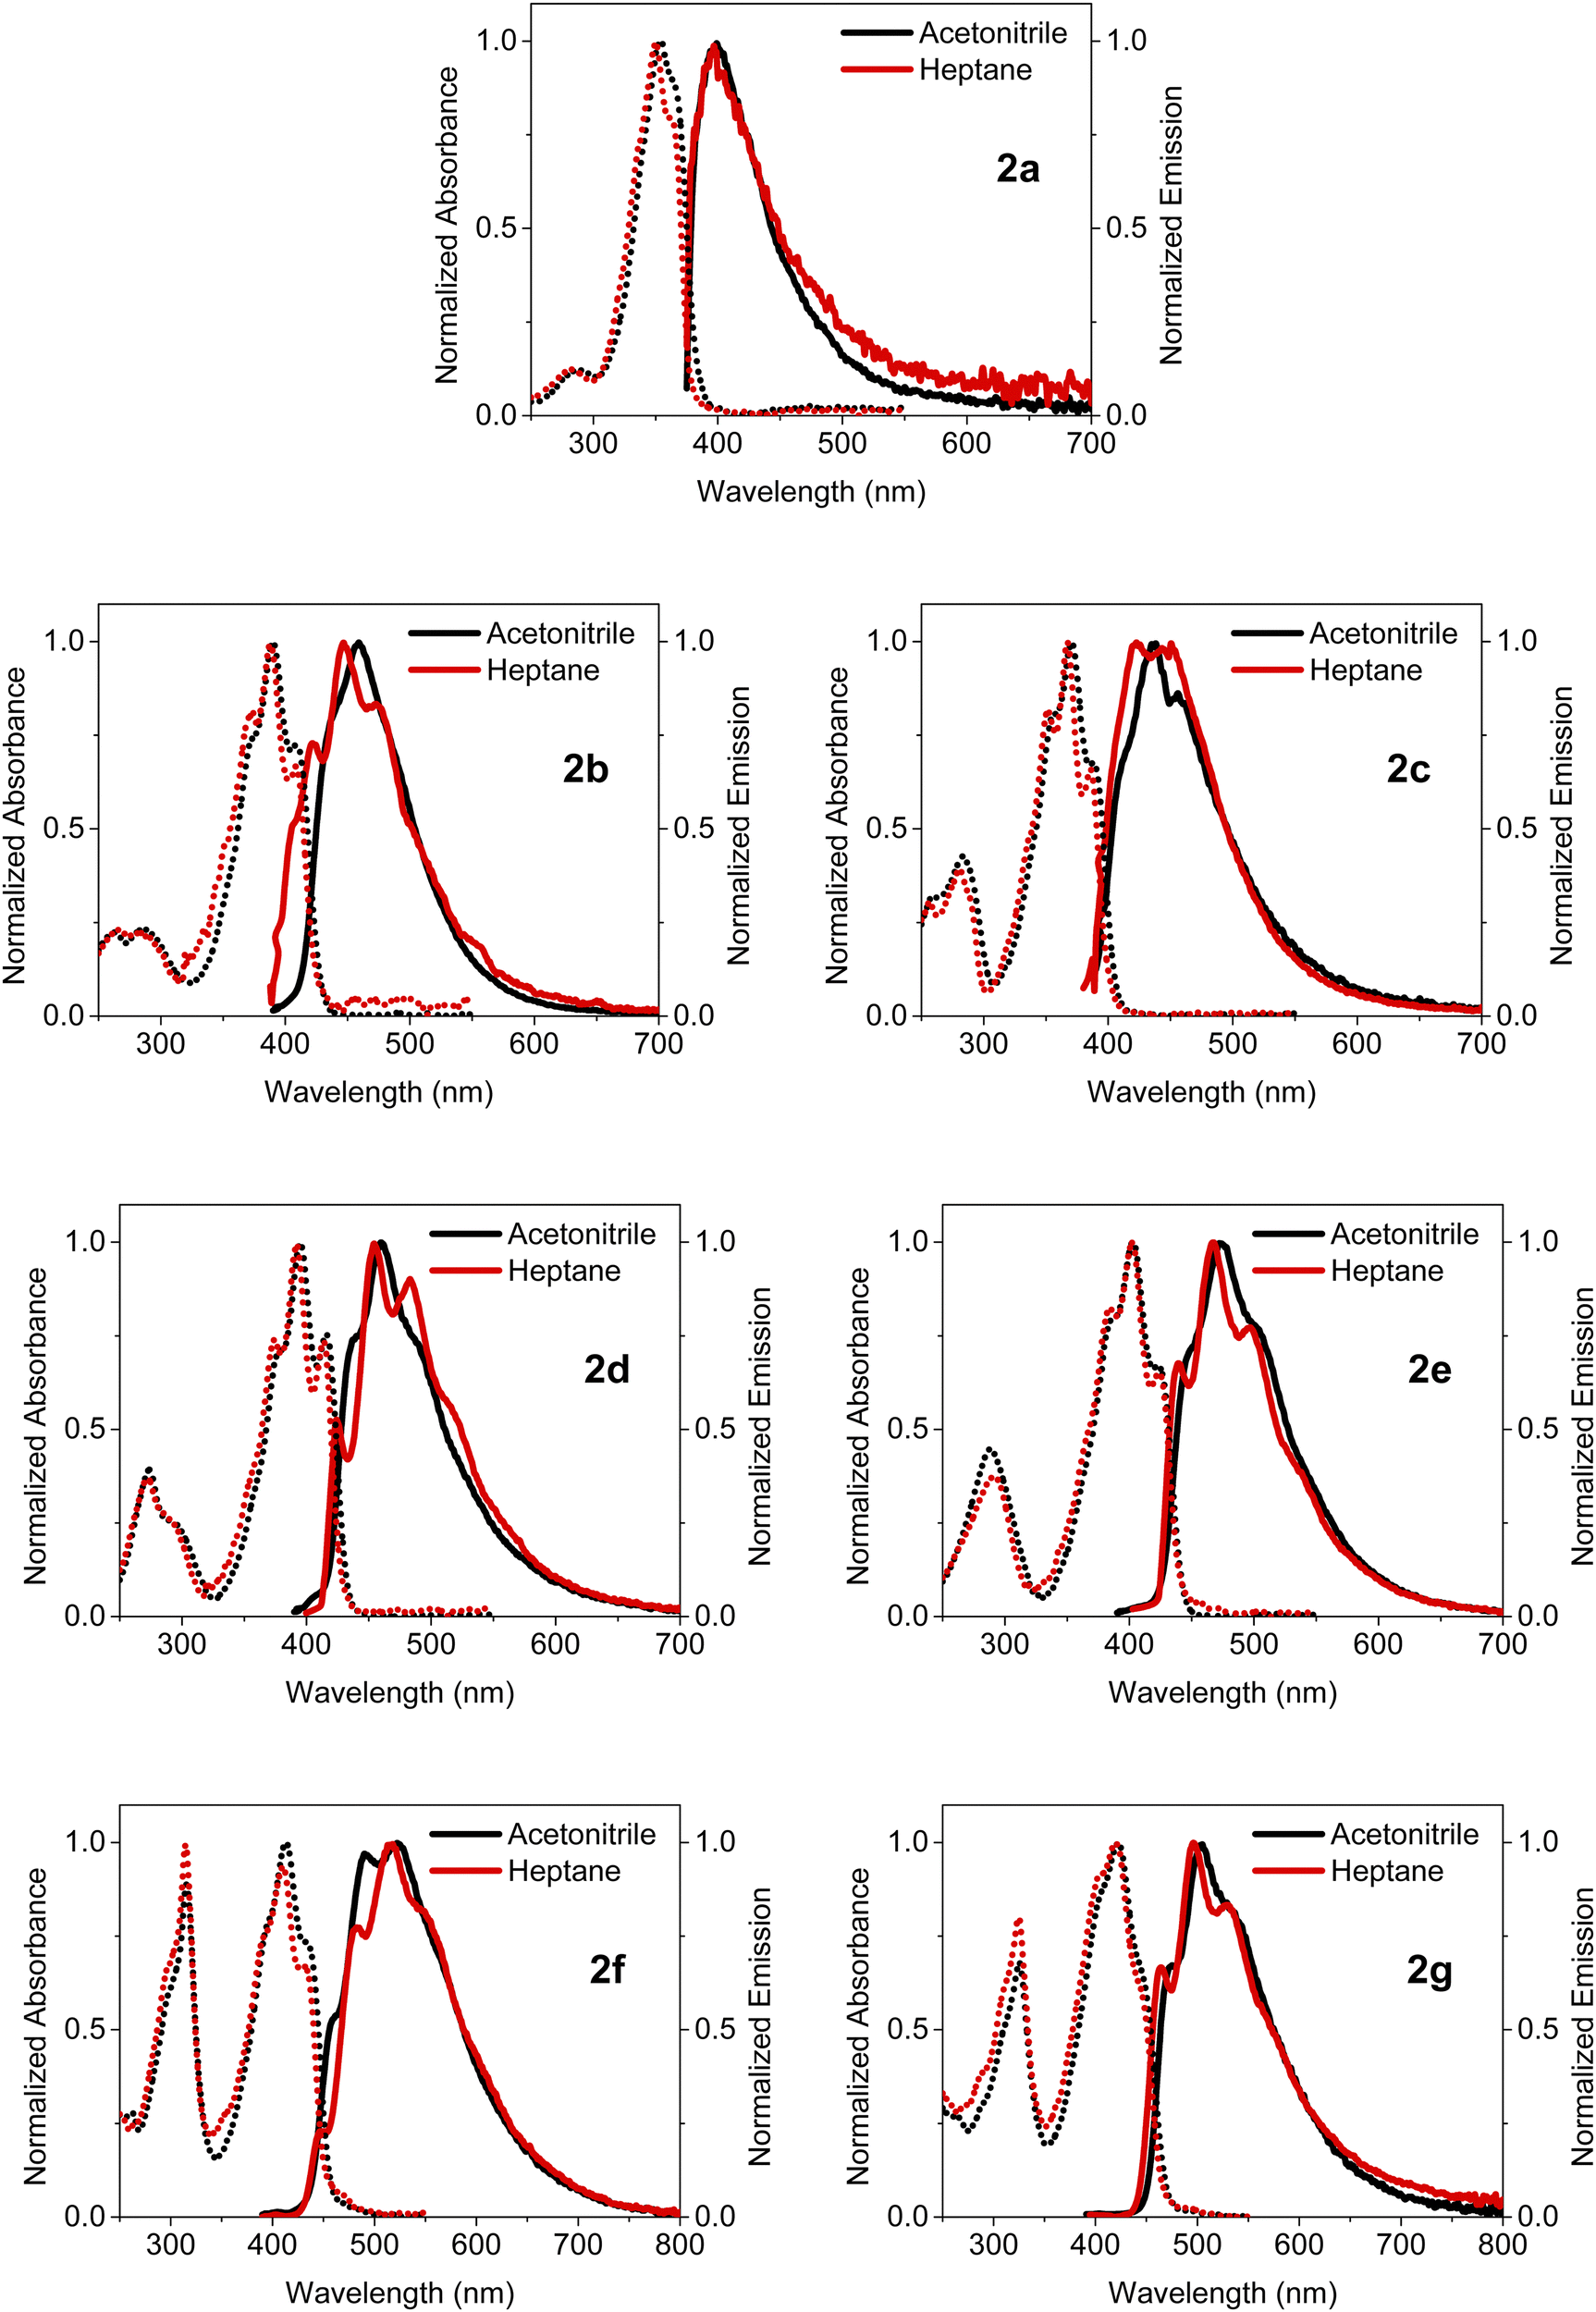 | ||
| Fig. 3 Normalized absorption and emission spectra of 2a–2g in acetonitrile and heptane. | ||
![[small nu, Greek, macron]](https://www.rsc.org/images/entities/i_char_e0ce.gif) abs–em is the Stokes shift (calculated from the maxima of the absorption and emission spectra), ϕF is the absolute fluorescence quantum yield, ε is the molar extinction coefficient at the absorption maximum
abs–em is the Stokes shift (calculated from the maxima of the absorption and emission spectra), ϕF is the absolute fluorescence quantum yield, ε is the molar extinction coefficient at the absorption maximum
| Molecule | Solvent | λ abs (nm) | λ em (nm) |
abs–em (cm−1) |
FWHMem (cm−1) | ϕ F | ε (L mol−1 cm−1) |
|---|---|---|---|---|---|---|---|
| 2a | Acetonitrile | 366 | 399 | 3190 | 3880 | <0.01 | 35![[thin space (1/6-em)]](https://www.rsc.org/images/entities/char_2009.gif) 000 000 |
| Heptane | 363 | 397 | 3380 | 4250 | <0.01 | ||
| Solid | 476 | 540 | 6800 | 3760 | 0.01 | ||
| Water/acetonitrile | 366 | 412 | 3980 | 3980 | <0.01 | ||
| 2b | Acetonitrile | 409 | 459 | 3860 | 3690 | <0.01 | 36900 |
| Heptane | 408 | 447 | 3340 | 4770 | <0.01 | ||
| Solid | 510 | 539 | 5260 | 4880 | 0.21 | ||
| Water/acetonitrile | 410 | 532 | 6840 | 4920 | 0.07 | ||
| 2c | Acetonitrile | 388 | 438 | 4120 | 4650 | <0.01 | 41800 |
| Heptane | 386 | 423 | 3610 | 4920 | <0.01 | ||
| Solid | 420 | 476 | 4240 | 3680 | 0.02 | ||
| Water/acetonitrile | 388 | 446 | 4460 | 4730 | <0.01 | ||
| 2d | Acetonitrile | 416 | 460 | 3580 | 3800 | <0.01 | 55000 |
| Heptane | 414 | 454 | 3480 | 3700 | <0.01 | ||
| Solid | 434 | 517 | 3700 | 2980 | 0.03 | ||
| Water/acetonitrile | 438 | 517 | 8750 | 3880 | 0.01 | ||
| 2e | Acetonitrile | 424 | 472 | 3630 | 3890 | <0.01 | 38700 |
| Heptane | 424 | 468 | 3510 | 3880 | 0.01 | ||
| Solid | 437 | 527 | 3910 | 2830 | 0.04 | ||
| Water/acetonitrile | 446 | 495 | 6320 | 3000 | 0.05 | ||
| 2f | Acetonitrile | 433 | 522 | 5060 | 4890 | <0.01 | 42200 |
| Heptane | 430 | 513 | 4900 | 4360 | 0.02 | ||
| Solid | 502 | 572 | 6970 | 3010 | 0.33 | ||
| Water/acetonitrile | 452 | 563 | 5940 | 3850 | 0.18 | ||
| 2g | Acetonitrile | 444 | 505 | 3840 | 4100 | 0.03 | 45000 |
| Heptane | 443 | 496 | 3650 | 4480 | 0.07 | ||
| Solid | 502 | 575 | 6590 | 3420 | 0.24 | ||
| Water/acetonitrile | 456 | 570 | 8840 | 4070 | 0.16 | ||
Having only methyl groups as substituent on its oxadiazaborole ring, 2a is used here as reference to which the other functionalized and post-functionalized compounds can be compared. In acetonitrile, 2a has a strong absorption band around 354 nm with a relatively large molar extinction coefficient of 3.5 × 10⁴ L mol−1 cm−1, which is in agreement with values reported earlier for similar dyes.44 Besides the maximum at 354 nm, which can be attributed to the  band of the S0 → S1 (π → π*) transition, the spectrum exhibits a shoulder around 366 nm corresponding to the
 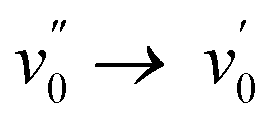 transition (vibrational progression of around 900 cm−1). The absorption spectra of 2b–2g show an additional vibrational band around 375 nm attributed to the
  transition (vibrational progression of around 1200 cm−1).
At 287 nm, a weak additional band appears in the spectrum of 2a, which can be assigned to the S0–S1 transition. Such a short-wavelength band around 250–350 nm is present in the absorption spectra of all other compounds and is generally weaker than the S0–S1 band, except for the post-functionalized molecules 2f and 2g where both bands have nearly the same magnitude.
By changing the substituent on the oxadiazaborole ring, the wavelength of the S0–S1 absorption band can be tuned over a spectral range from 366 to 444 nm. For example, inserting a (brominated) aromatic heterocyclic substituent such as a pyridine (2b) a furan (2d) or a thiophene (2e) increases the wavelength of the  transition in heptane from 363 nm to respectively 408 nm (2b), 386 nm (2c), 414 nm (2d) or 424 nm (2e). As both electron withdrawing (2b) or electron donating moieties (2c to 2e) lead to redshift, the effect of the substituent is rather due to an extension of the conjugated system rather than to the enhancement of intramolecular charge transfer. This lowers the HOMO–LUMO gap and causes a redshift of the absorption and emission spectra. Since thiophene has a higher aromaticity than furan, the π-electrons are more delocalized in the conjugated system containing thiophene.45 Therefore, the shift in absorption wavelength maximum is larger upon substitution with thiophene (424 nm for 2e) when compared to furan (416 nm for 2d). Quite surprisingly and in contrast with similar compounds11–13 the Stokes shift and FWHM of the emission band are not increased upon introduction of this substituent. This indicates very little electron–phonon coupling with rotation of this substituent or a difference in its coplanarity in ground and excited state. Moreover, the bromine functionality opens up synthetic possibilities for post-functionalization strategies, aimed at adding groups that could increase the conjugation length even more. In particular, the introduction of a 4-butylphenylacetylene moiety on the furan and thiophene rings resulted in a further redshift of the absorption and emission spectra to respectively 433 nm and 522 nm for 2f and 444 nm and 505 nm for 2g, due to a further increase in the size of the conjugated system. For all the investigated dyes, the molar extinction coefficients at the absorption maximum range between 3.5 and 5.5 × 10⁴ L mol−1 cm−1.
Compared to the absorption spectra in the apolar solvent heptane (with dielectric constant εR = 1.9), the absorption spectra of all compounds in the more polar solvent acetonitrile (εR = 37.5) are modestly redshifted over 0 to 226 cm−1. This could indicate that the BOAHY molecules have a modest ground state dipole moment and are slightly more polar in the excited state than in the ground state. To accurately determine the dipole interaction one needs to consider the larger polarizability of heptane relative to acetonitrile, an effect that induces an additional redshift as e.g. observed for BODIPY dyes.2,46
The emission spectra show, with exception of 2b and 2c, a redshift of 130 to 360 cm−1 from heptane to acetonitrile indicating a very small or absent dipole moment in the ground state and a small dipole moment in the S1 excited state. 2b and 2c show a larger redshift of respectively 590 and 810 cm−1 indicating a larger excited state dipole moment. As already mentioned for the absorption spectra, the observed shift underestimates the dipolar interactions as the larger polarizability of heptane normally induces a redshift from acetonitrile to heptane which has been observed for BODIPY dyes.2,46 The emission spectra of the dyes in acetonitrile and heptane feature a Stokes shift of 3190–5060 cm−1, which is substantially larger than the few hundreds of cm−1 typically reported for BODIPY dyes. This agrees with the observation that while for most BODIPY dyes2 the  or
or  vibronic bands are the most intense transitions in the S0 → S1 absorption band and in the fluorescence spectrum this is here the case for the
 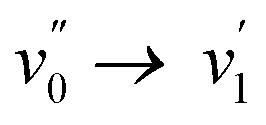 or
or 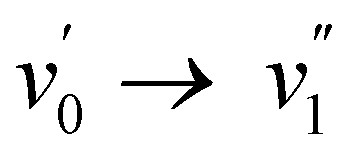 vibronic bands. The relative large Stokes shift and FWHM of the emission spectra are mainly related to electron–phonon coupling with the high frequency vibration of about 900 cm−1 (cfr. infra) rather than to coupling with low frequency vibration such a torsions around the conjugates system. This indicates that there is little change in planarity upon excitation. On the other hand, the changes in equilibrium bond length of the conjugated system are substantial for the BOAHY dyes. While the fluorescence band of 2a is structureless in solution, the emission spectra of some of the other compounds show vibronic maxima which are the mirror-image of the absorption spectra. For example, the emission spectrum of 2d in heptane has (shoulder) peaks around 424, 454, 483 and 520 nm, corresponding to a vibrational progression around 1450 cm−1. To better resolve this vibrational fine structure, the emission spectra of 2d and 2e were measured at 77 K in methyltetrahydrofuran (MeTHF) (Fig. S10, ESI†). The matching excitation spectra prove that the different fluorescence bands originate from the same apparent species.
The fluorescence quantum yields in solution are negligible for compounds 2a–2e (1% or below) and low for the post-functionalized dyes 2f and 2g (7% or below). However, in the solid state, some of these dyes show considerably higher fluorescence quantum yields. This is especially the case for 2b, 2f and 2g which have quantum yields of respectively 21%, 33% and 24% in the solid state, several times the multiple of their values in acetonitrile.
In order to elucidate the mechanisms behind the fluorescence quenching in solution and the amplification of fluorescence in solid state, the excited state dynamics of the BOAHYs were further examined by means of time-resolved spectroscopy. The fluorescence decays were determined in acetonitrile, a water acetonitrile mixture (fw = 0.99) and in the solid state using time correlated single photon counting (TC-SPC) and (only for acetonitrile) femtosecond fluorescence up-conversion (fsUC) (Fig. 4 and Tables S5, S6, ESI†). A scheme showing the main photophysical processes involved in the relaxation is presented in Fig. 5. The TC-SPC and fsUC decays were fitted to a double or triple exponential decay. For solutions of 2a to 2f, the fluorescence decay at room temperature is beyond the time resolution of TC-SPC, the low amplitude nanosecond decay components probably being due to impurities. These experiments are confirmed by the fsUC experiments which show for 2a a fluorescence decay time of about 2 ps and for 2b to 2f decay fluorescence decay times between 9 and 45 ps. Besides these components, the faster ones observed as rise and decay of fluorescence signal in the 0–1000 fs time window can be attributed to intramolecular vibrational relaxation of vibrational redistribution.47 Such ultrafast components have also been observed earlier in other BODIPY compounds via 2D electronic spectra and DFT calculations and attributed to solvation dynamics and vibrational modes strongly coupled to the electronic excitation.48 The time components reported in Table S6 (ESI†) with values of 1–8 ps suggest processes leading to severe depopulation of the S1 state as they feature large and positive relative amplitudes.
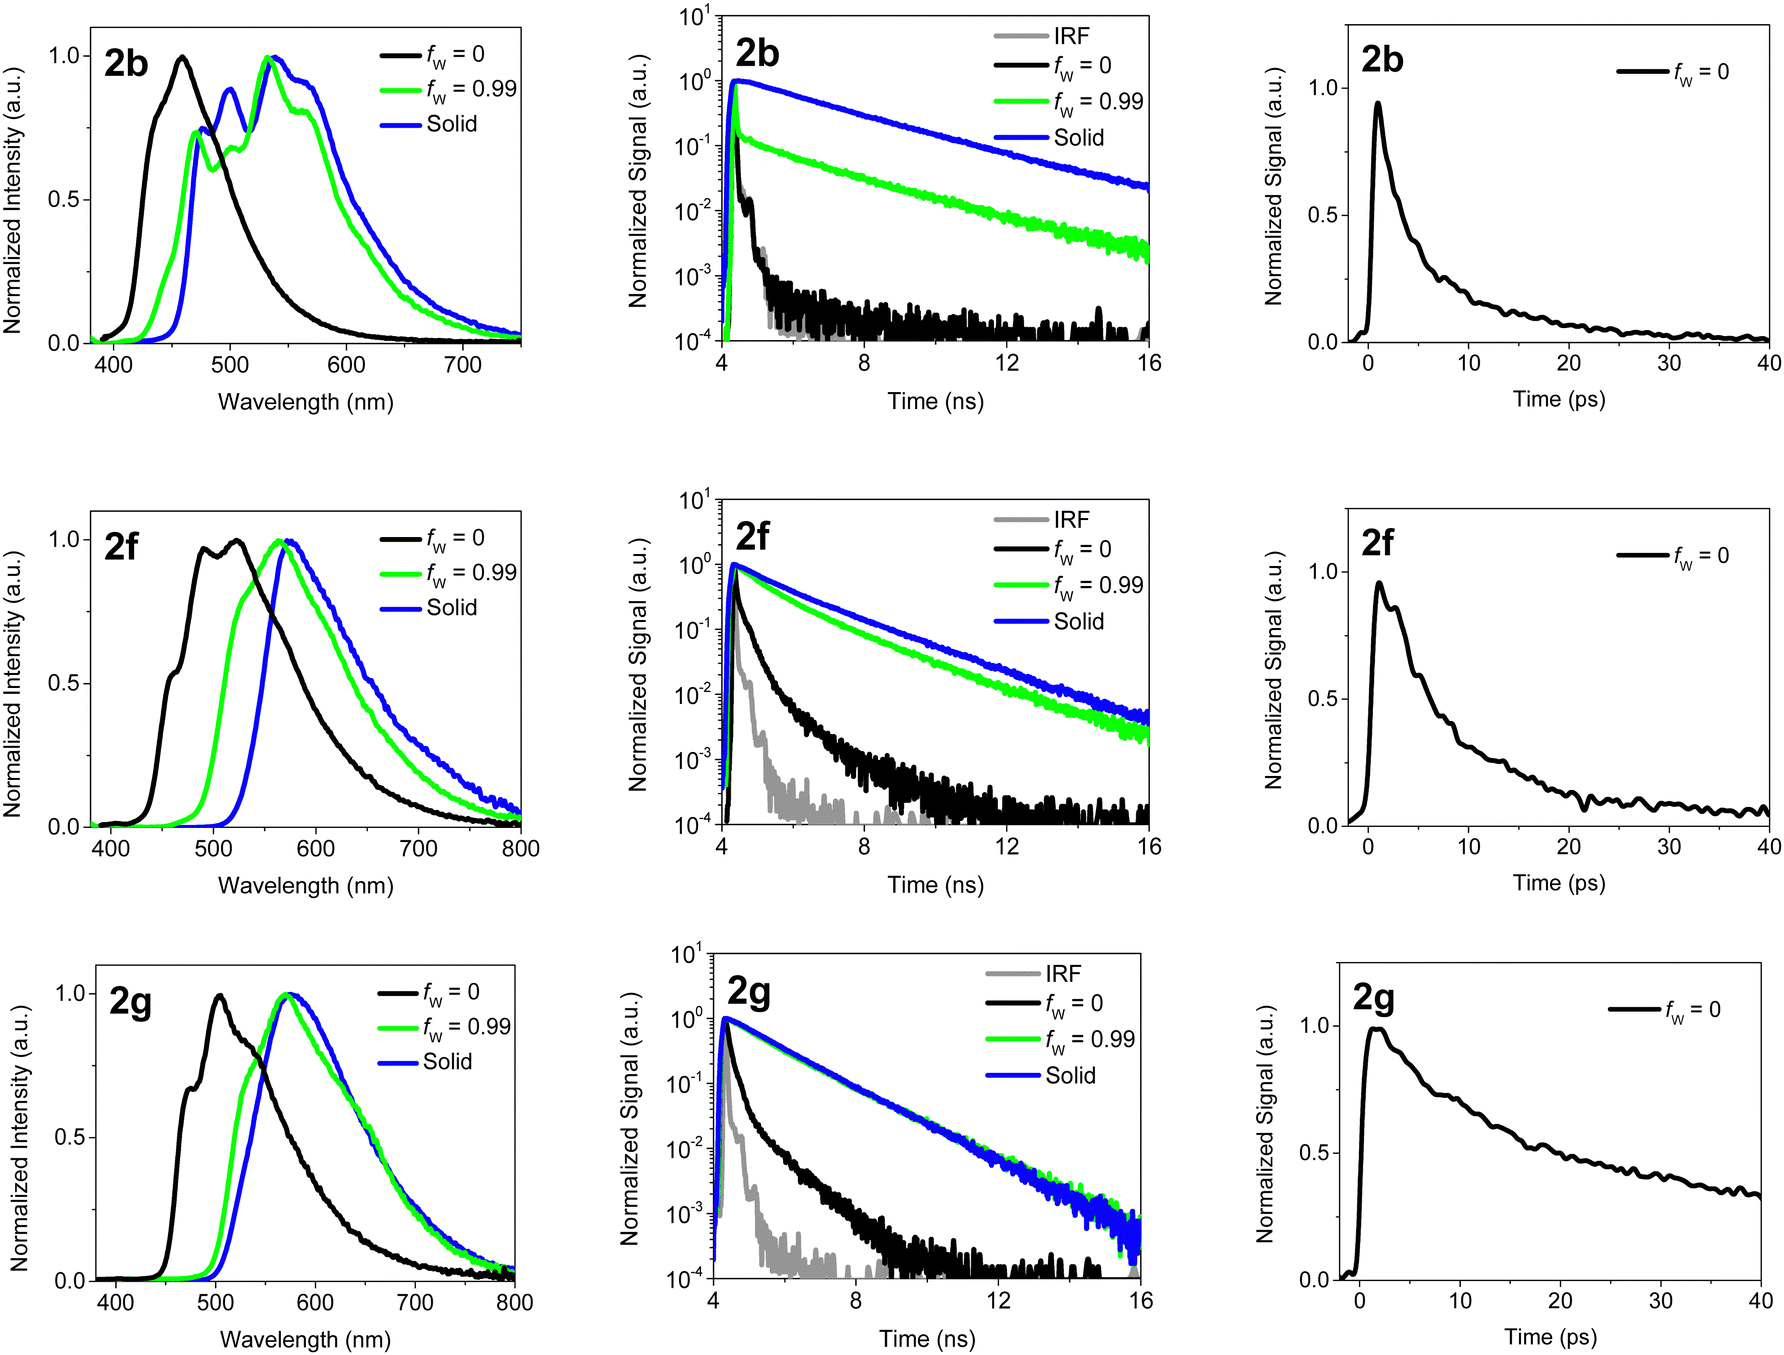 | ||
| Fig. 4 Left: Normalized emission spectra of 2b, 2f and 2g in solid state and solved in water/acetonitrile with water fractions fw = 0 and 0.99, excited at 360 nm. Middle and right: Corresponding fluorescence decays of 2b, 2f and 2g, excited at 360 nm and detected at 530 nm, measured with TC-SPC (middle) and fsUC (right, only acetonitrile). | ||
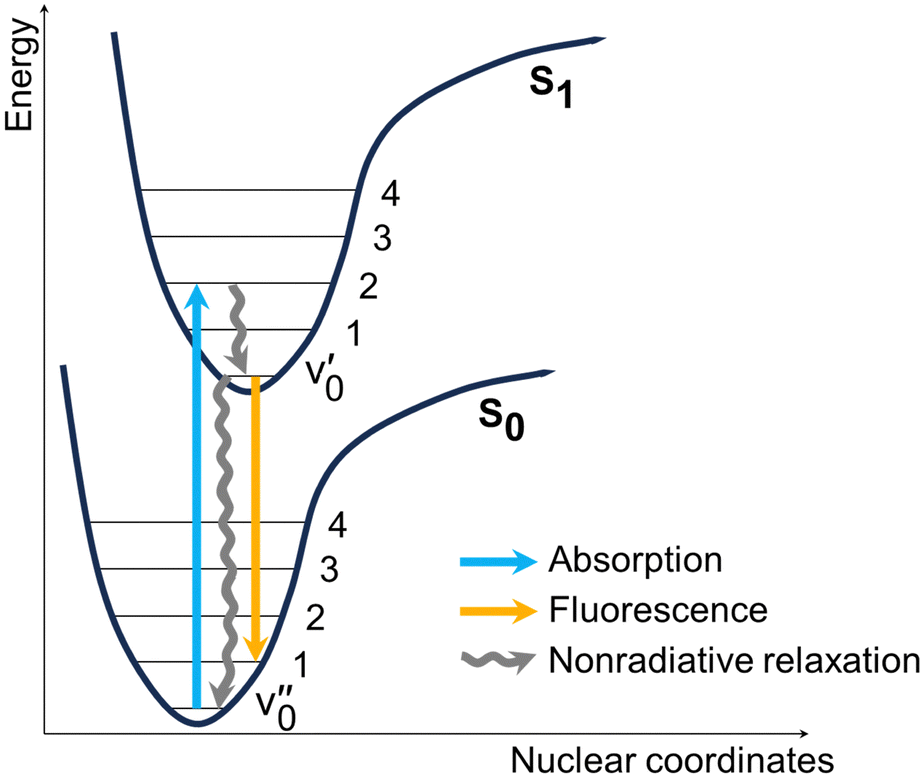 | ||
| Fig. 5 Generic scheme showing the photophysical processes that occur upon excitation of the dyes. Nonradiative relaxation includes both vibrational and rotational decay channels. | ||
These fast decays are the main reason for the low fluorescence quantum yields in solution as based on the molar extinction coefficients (Table 1), which resemble those of BODIPYs,2,46 similar fluorescence rate constants in the order of a few times 108 s−1 can be expected. For 2f and 2g the longer fluorescence decay times of 120 and 61 ps, as determined by fsUC, are compatible with the larger fluorescence quantum yields.
Fig. 4 shows the emission spectra of 2b, 2f and 2g in water/acetonitrile mixtures and in the solid state together with the corresponding fluorescence decays measured with TC-SPC or fsUC. Additional data for the other compounds can be found in the ESI† (Fig. S24, S25 and Tables S5, S6, ESI†). Compared to the spectra in acetonitrile the fluorescence spectra in the solid state are redshifted over 1820 cm−1 (2c) to 3230 cm−1 (2b) and even 6540 cm−1 for 2a. This shift can be attributed to intermolecular interactions which are partly due to exciton interaction.17–20,27,28,31
In contrast to what is generally observed for emission of molecular aggregates, the aggregate emission spectra still show some vibrational structure for 2b and 2e, and less outspoken for 2a, 2c and 2d. For 2b and to a smaller extent for 2a also fluorescence which resembles that of the dye monomers although redshifted over about 1000 cm−1 is still observed in the solid state. The absorption maxima of 2a to 2e are redshifted by 1000 to 2000 cm−1 and for 2f and 2g this shift is increased to respectively 3200 and 2600 cm−1. Furthermore the absorption spectra of 2a and 2b have a shoulder which is redshifted by respectively 4800 and 6300 cm−1.
For 2a to 2f the majority of the molecules is packed in such way that the exciton interaction leads to a redshift of 1000 to 3000 cm−1 for the absorption spectra and 1500 to 2500 cm−1 for the emission spectra. This means a packing similar to J-type aggregates for which emission from the lowest exciton state is allowed.17–20,27,28,31 For 2a and 2b a small fraction of the molecules form J-type aggregates where stronger intermolecular interactions lead to a redshift of the absorption by respectively 6300 and 4800 cm−1 while the emission is redshifted by 6500 and 3400 cm−1. While the absorption spectra indicate that only a small fraction of the dye molecules adopts this packing, these redshifted aggregates give a major contribution to the emission spectra. This suggests the occurrence of energy transfer between both types of aggregates.
Upon visual inspection, the fluorescence decays in the solid state are much slower than those in acetonitrile. Although the decays could be fitted to a bi- or tri-exponential decay, one should, in the absence of a kinetic scheme leading to such decays, realize that this fitting is not unique and that the decays could probably as well be fitted to a stretched exponential or a distribution of decay times.49,50 Therefore, in this case most individual decay times and their amplitudes have no physical meaning, except for the longest time component τ3 which can be interpreted as a lower limit for the decay time of the molecules. Besides a distribution over a range of packings leading to different decay rates, one should consider that such non-single-exponential luminescence decays of solids are often governed by energy transfer to non-fluorescent traps.22,23,50–56 In this case the longest decay time approaches the fluorescence decay time of the unquenched aggregates. The latter decay times ranging from 1.18 ns to 4.71 ns are 10 to 1000 times larger than those in acetonitrile. As this increase in decay time is accompanied by an increase of the fluorescence quantum yield, the non-radiative decay must be much slower in the solid state compared to the solution in acetonitrile. Since the non-radiative decay rate of BOAHY dyes is heavily influenced by viscosity,7 a possible explanation for such long decay times in the solid state could be the rigidification of the environment of the dyes. The rotations around the partial double bonds, which are mainly responsible for the fast non-radiative decay, are blocked due to the close packing of the dyes in the solid state, which causes longer decay times. To check that rotations are the main reason for the fluorescence quenching in solution at room temperature, the fluorescence decay of 2b in acetonitrile at 77 K was measured with TC-SPC. At this low temperature, most thermally activated rotations are blocked, leading to a fluorescence decay that is very similar to the one measured in solid state, with a long decay time of 2.94 ns (Fig. S24, ESI†). Hence, the BOAHYs in solution at room temperature lose most energy in a non-radiative way after excitation, probably via free rotations of the unchelated pyrrolic rings. The suppression of these rotations due to rigidification in the solid state cause the high fluorescence quantum yields of the solid powders compared to the solutions. When one compares spectra and fluorescence decay times of BOAHYs with the aryl substituted BOPAMs57 or BOPAHYs11 the generally much faster nonradiative decay of the BOAHYs is not reflected systematically in a significantly broader spectra or a significantly larger Stokes shift. This indicates that this pyrrole nucleus has a similar degree of coplanarity in the ground and excited state, perhaps related to H-bonding between the pyrrole NH and a nitrogen atom of the hydrazone moiety. In this case the rotation of the pyrrole is only an inducing and not an accepting mode for the internal conversion to the S0 state.58
Aggregation in water/acetonitrile mixtures
Stimulated by the stronger fluorescence in solid state, we investigated whether the emission of BOAHYs 2a–2g could be switched on by adjusting the solubility and inducing aggregation. To this end, mixtures of acetonitrile (good solvent) and water (non-solvent) were used to control the dissolution and aggregation of the fluorescent molecules. The steady-state absorption and emission spectra of 2a–2g in mixtures with different volumetric water fractions (fw) between 0% and 99% are available in the ESI† (Fig. S14–S20, ESI†). Some figures of merit for the solutions with the highest water fraction (fw = 0.99) are included in Table 1.For the methyl-substituted BOAHY 2a, neither the absorption spectrum nor the emission spectrum change much with increasing fw and the expected accompanying reduction of the solubility. The position of the S0–S1 0–0 absorption band is the same for 99% water as for pure acetonitrile. While the emission spectrum retains approximately the same shape and intensity, its maximum is slightly redshifted, which considering the small excited state dipole moment can be related to an increased polarity of the environment. The quantum yields are low in all water/acetonitrile mixtures and show only a small increase to 0.01 in the solid state. The same observations hold for 2c, with exception that for fw = 99% the absorbance is now reduced by about 50%. Thus, enhancing the emission by inducing aggregation could not be achieved for BOAHYs 2a and 2c.
For fw = 99% the fluorescence spectra of 2b and 2d–2g, nicely coincide with the solid state emission spectra (Fig. 4 and Fig. S15, S17–S20, S22, ESI†). A similar behavior is observed for the fluorescence quantum yields which are, although several times larger than in neat acetonitrile, with exception of 2e still smaller than in the solid state (Table 1). The latter can perhaps be due presence of water enhancing the local polarity. Looking in more detail (Fig S15–S20, ESI†) a gradual shift of the spectra can be observed. When gradually increasing the water fraction, the emission intensity first decreases, probably due to an increased polarity enhancing quenching by intramolecular charge transfer. Above circa 70–80% water (40% water for 2g), the fluorescence quantum yield greatly increases while the emission spectrum shifts to longer wavelengths (Fig. S23, ESI†). Fig. S23 (ESI†) also shows that the water content where the intensity starts to be enhanced increases in the order 2g < 2f < 2e < 2b < 2d which follows a decreasing hydrofobicity of the BOAHY dyes. Also the water content where the switch in the features of the emission spectra is observed (Fig. S15 and S17–S20, ESI†) follows the same order. This means that the onset of the spectral shift and the increase of the intensity is linked to onset of the precipitation of the BOAHY dyes. Also the absorption spectra (Fig. S15 and S17–S20, ESI†) are characterized by a loss of structure, a spectral broadening and a redshift of the S0–S1 0–0 absorption band for higher water contents.
These findings from steady-state spectroscopy clearly point out that with decreasing solubility, molecular aggregates are formed for these BOAHYs which even precipitate at the highest water content leading to a turbity of the solutions (Fig. S21, ESI†). This behavior is particularly prominent for 2b with pyridine substituent and the post-functionalized dyes 2f and 2g. In these aggregates, the strong dipole–dipole interactions together with the rigidification of the fluorophore give rise to an impressive increase of fluorescence intensity, which is the hallmark of the AIE effect. Because of the very fast (picosecond or subpicosecond) vibrational relaxation to the lowest excited exciton level after excitation, the aggregate emits at longer wavelengths in comparison to the monomer.
To verify the formation of aggregates with increasing water fraction and to better understand the excited state processes in the aggregates, the fluorescence decays were studied with TC-SPC. From Fig. 4 (and Fig S24, ESI†) it is clear that for the water/acetonitrile mixture with 99% water, the fluorescence decays of 2b and 2d–2g are significantly slower than in pure acetonitrile and start to resemble those of the solid state dyes. Especially, the fluorescence decay of 2f and 2g in the water/acetonitrile mixture (with long decay times of respectively 2.29 ns and 1.67 ns) is remarkably parallel to the decay of the solid powder (with long decay times of respectively 2.20 ns and 1.52 ns). For 2b the same is also observed at longer times, suggesting that we have here still a mixture of solid 2b and molecules of 2b in solution. For 2d and 2e the fluorescence decays although slower than in neat acetonitrile are still faster that in the solid state. This indicates that for fw = 99% not yet the solid phase is formed but rather small aggregates of 2d and 2e. The latter is also reflected in the emission spectrum of 2e which for fw = 99% still different from that in the solid state. In aggregates and in the solid state, the close packing of the dye molecules hinders the free rotations, leading to a decrease of the non-radiative decay rate and a longer decay time, much like in the solid state. Hence, these long decay times further corroborate that the BOAHY dyes form aggregates or precipitate in water/acetonitrile mixtures with a high water content.
In contrast to the other compounds the environment of 2a and 2c in solutions with a large fw resembles more that of neat acetonitrile rather than the solid state. Apparently no precipitation or aggregation occurs for 2a and 2c indicating a higher solubility of 2a and 2c in water, related to a less hydrophobic character. Actually one can try the estimate the hydrophobic character by comparing the number of 2nd or 3rd row elements with the number of the groups (–O–, ![[double bond, length as m-dash]](https://www.rsc.org/images/entities/char_e001.gif) N–, –NH–, BF) that can be involved in hydrogen bonding. This ratio decreases from 6/16 for 2a over 7/18 for 2c to 6/32 for 2g. In fact, the decrease of this ratio parallels the decrease of the value of fw where the transition from the solution to the solid state spectrum and intensity occurs (Fig. S15, S17–S20 and S23, ESI†).
N–, –NH–, BF) that can be involved in hydrogen bonding. This ratio decreases from 6/16 for 2a over 7/18 for 2c to 6/32 for 2g. In fact, the decrease of this ratio parallels the decrease of the value of fw where the transition from the solution to the solid state spectrum and intensity occurs (Fig. S15, S17–S20 and S23, ESI†).
Compatibility with biological imaging
Finally, the applicability in biological imaging was investigated for BOAHY 2f, because of its slightly higher fluorescence quantum yield compared to the other studied compounds and since the small dot-like aggregates formed when dissolved in aqueous medium were hypothesized to be most compatible with live-cell imaging (Fig. S26, ESI†). To this end, HeLa cells were incubated with 10 μM BOAHY 2f for 4 h, excess dye was washed away, and cellular internalization was investigated by staining the cellular membranes using the commercial near-infrared DiR dye.Fluorescence imaging (Fig. 6) reveals that 2f is predominantly found intracellularly with respect to the DiR stained plasma membrane after 4 h incubation. We hypothesize that this preferential intracellular build-up is caused by the hydrophobic character of the dye, which enables entrance into the cell, but that the formation of larger aggregates prevents it from being released back into the extracellular environment. Note that 2f was also not localized in the nucleus (which is perceived as a darker structure), probably because this hydrophobic character and size of the dye prevents them from entering through the nuclear pores.59 Additionally, staining of lysosomes using the commercial LysoTracker™ Deep Red dye revealed that 2f is not found in lysosomal vesicles after 4 h, but rather seems to be present at intracellular locations where fewer lysosomes are found (Fig. S27, ESI†). In addition, 2f does not seem to alter cell morphology or induce toxicity in the cells. These experiments illustrate the compatibility of BOAHY dye 2f with biological imaging in living mammalian cells.
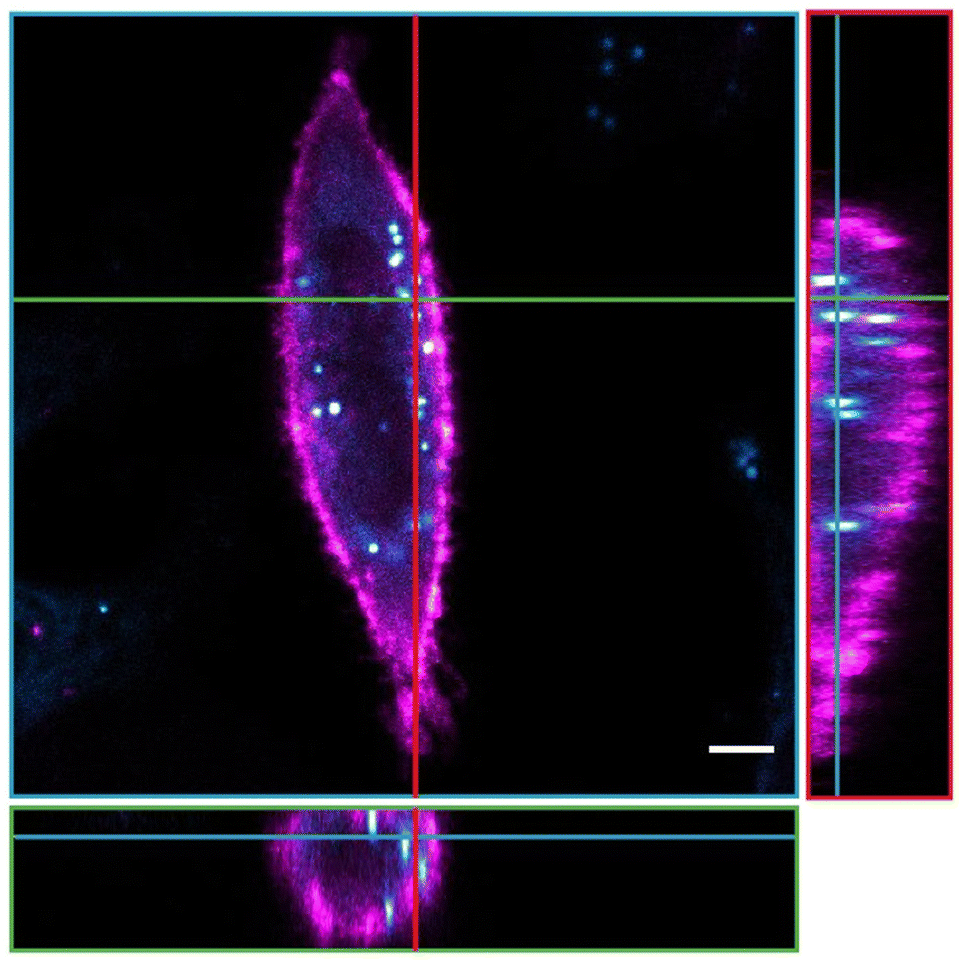 | ||
| Fig. 6 Fluorescence microscopy image of a HeLa cell incubated with BOAHY dye 2f (cyan) and stained with DiR membrane stain (pink). The figure displays the cross-section of a cell (blue borders and lines) with orthogonal YZ (red borders and lines) and XZ (green borders and lines). Scale bar 5 μm. | ||
Conclusion and outlook
In conclusion, a set of new BOAHY dyes were synthesized via a two-step reaction with good yields. Through proper functionalization and post-functionalization, their photophysical properties such as absorption and emission maxima could be tuned. Since the dyes are dim in solution but brightly fluorescent in the solid state, the properties related to their AIE behavior were thoroughly investigated by means of steady-state well as time-resolved spectroscopy techniques. It was found that the fluorescence could be switched on by changing the solubility of the dyes from good (acetonitrile) to poor (water/acetonitrile with 99% water). In a poor solvent, the BOAHYs form aggregates which causes a broader and redshifted absorption, a more intense redshifted emission, higher quantum yields and longer decay times, relative to the values in acetonitrile.In comparison to the methyl-substituted compound 2a, these results are especially outspoken for the pyridine-substituted dye 2b and for the post-functionalized dyes 2f and 2g, the most hydrophobic BOAHY dyes The latter two show improved quantum yields compared to their respective bromine-functionalized analogs 2d and 2e. Interestingly, the aggregates of BOAHY 2f are compatible with living mammalian cells, which opens the possibility of the application of BOAHY dyes as bright fluorescent probes for the visualization of biological samples.
As a continuation of this research, it would be fascinating to explore whether the fluorescence of BOAHY derivates can also be activated by adding metal salts. If selective chelation of a metal cation would induce rigidification of the fluorophore structure, this would allow to use these dyes as ion sensors.
Author contributions
Jonathan B. F. Vandenwijngaerden, Jianjun Huang: conceptualization, investigation, formal analysis, visualization, validation, writing – original draft, writing – review & editing; Charlotte Cresens, Luc Van Meervelt: investigation, formal analysis, visualization, writing – review & editing; Wim Dehaen, Susana Rocha, Mark Van der Auweraer, Eduard Fron: conceptualization, supervision, writing – review & editing.Conflicts of interest
There are no conflicts of interest to declare.Acknowledgements
J. B. F. V. thanks the Research Foundation – Flanders (FWO) for FWO-FR fellowship 11F3520N. J. H. appreciates the China Scholarship Council (CSC, No. 201906920069) for providing a doctoral scholarship. C. C. acknowledges the Research Foundation – Flanders (FWO) for FWO-FR fellowship 1121221N. W. D. thanks KU Leuven (grant C14/19/078) and FWO-Vlaanderen (grant W000620) for financial support. S. R. thanks the KU Leuven (grant IDN/20/021). The authors are grateful for the support from the Research Council of KU Leuven through the project C14/19/079 (FUEPONA) and the Research Foundation – Flanders (FWO) through the projects G0F8217N and G082215N. Mass spectrometry was made possible by the support of the Hercules Foundation of the Flemish Government (grant 20100225-7). L. V. M. thanks the Hercules Foundation for supporting the purchase of the diffractometer through project AKUL/09/0035.References
- G. G. Stokes, Philos. Trans. R. Soc. London, 1852, 142, 463–562 CrossRef.
- N. Boens, B. Verbelen, M. J. Ortiz, L. Jiao and W. Dehaen, Coord. Chem. Rev., 2019, 399, 213024 CrossRef CAS.
- H. Lu, J. Mack, Y. Yang and Z. Shen, Chem. Soc. Rev., 2014, 43, 4778–4823 RSC.
- Y. Yu, C. Yu, Q. Wu, H. Wang, L. Jiao, W. Y. Wong and E. Hao, J. Mater. Chem. C, 2019, 7, 4533–4542 RSC.
- D. Frath, J. Massue, G. Ulrich and R. Ziessel, Angew. Chem., Int. Ed., 2014, 53, 2290–2310 CrossRef CAS PubMed.
- D. Wang, M. M. S. Lee, G. Shan, R. T. K. Kwok, J. W. Y. Lam, H. Su, Y. Cai and B. Z. Tang, Adv. Mater., 2018, 30, 1802105 CrossRef PubMed.
- C. Yu, E. Hao, X. Fang, Q. Wu, L. Wang, J. Li, L. Xu, L. Jiao and W. Y. Wong, J. Mater. Chem. C, 2019, 7, 3269–3277 RSC.
- J. Heo, D. P. Murale, H. Y. Yoon, V. Arun, S. Choi, E. Kim, J. Lee and S. Kim, Aggregate, 2022, 1–35 Search PubMed.
- A. Treibs and F.-H. Kreuzer, Justus Liebigs Ann. Chem., 1968, 718, 208–223 CrossRef CAS.
- F. de Jong, J. Pokorny, B. Manshian, B. Daelemans, J. Vandaele, J. B. Startek, S. Soenen, M. Van der Auweraer, W. Dehaen, S. Rocha and G. Silveira-Dorta, Dyes Pigm., 2020, 176, 108200 CrossRef CAS.
- F. de Jong, D. Verhaeghe, K. Veys, J. Huang, W. Dehaen, D. Escudero, E. Fron and M. Van der Auweraer, Dyes Pigm., 2022, 206, 110662 CrossRef CAS.
- S. Pookkandam Parambil, F. de Jong, K. Veys, J. Huang, S. P. Veettil, D. Verhaeghe, L. Van Meervelt, D. Escudero, M. Van der Auweraer and W. Dehaen, Chem. Commun., 2020, 56, 5791–5794 RSC.
- T. Horsten, F. De Jong, D. Theunissen, M. Van Der Auweraer and W. Dehaen, J. Org. Chem., 2021, 86, 13774–13782 CrossRef CAS PubMed.
- S. Boodts, E. Fron, J. Hofkens and W. Dehaen, Coord. Chem. Rev., 2018, 371, 1–10 CrossRef CAS.
- L. I. Shamova, Y. V. Zatsikha and V. N. Nemykin, Dalton Trans., 2021, 50, 1569–1593 RSC.
- C. Yu, Z. Huang, X. Wang, W. Miao, Q. Wu, W.-Y. Wong, E. Hao, Y. Xiao and L. Jiao, Org. Lett., 2018, 20, 4462–4466 CrossRef CAS PubMed.
- M. Kasha, Rev. Mod. Phys., 1959, 31, 162–169 CrossRef CAS.
- M. Kasha, Radiat. Res., 1963, 20, 55–70 CrossRef CAS PubMed.
- A. S. Davydov, Sov. Phys. Uspekhi, 1964, 7, 145–178 CrossRef.
- T. Förster, in Modern Quantum Chemistry, Part IIIB, ed. O. Sinaoglu, Academic Press, New York, 1965, pp. 93–137 Search PubMed.
- J. Mei, N. L. C. Leung, R. T. K. Kwok, J. W. Y. Lam and B. Z. Tang, Chem. Rev., 2015, 115, 11718–11940 CrossRef CAS PubMed.
- K. Kemnitz, T. Murao, I. Yamazaki, N. Nakashima and K. Yoshihara, Chem. Phys. Lett., 1983, 101, 337–340 CrossRef CAS.
- F. Willig, A. Blumen and G. Zumofen, Chem. Phys. Lett., 1984, 108, 222–227 CrossRef CAS.
- E. G. McRae and M. Kasha, J. Chem. Phys., 2004, 28, 721–722 CrossRef.
- E. E. Jelley, Nature, 1936, 138, 1009–1010 CrossRef CAS.
- L. G. S. Brooker, F. L. White, D. W. Heseltin, G. H. Keyes, S. G. Dent and E. J. Van Lare, J. Photogr. Sci., 1953, 1, 173–183 CrossRef CAS.
- V. Czikkely, H. D. Försterling and H. Kuhn, Chem. Phys. Lett., 1970, 6, 207–210 CrossRef CAS.
- V. Czikkely, H. D. Försterling and H. Kuhn, Chem. Phys. Lett., 1970, 6, 11–14 CrossRef CAS.
- G. Scheibe, Angew. Chemie, 1939, 52, 331–637 Search PubMed.
- E. S. Emerson, M. A. Conlin, A. E. Rosenoff, K. S. Norland, H. Rodriguez, D. Chin and G. R. Bird, J. Phys. Chem., 1967, 71, 2396–2403 CrossRef CAS.
- A. P. Deshmukh, N. Geue, N. C. Bradbury, T. L. Atallah, C. Chuang, M. Pengshung, J. Cao, E. M. Sletten, D. Neuhauser and J. R. Caram, Chem. Phys. Rev., 2022, 3, 21401 CrossRef CAS.
- A. V. Buettner, J. Chem. Phys., 2004, 46, 1398–1401 CrossRef.
- L. J. E. Hofer, R. J. Grabenstetter and E. O. Wiig, J. Am. Chem. Soc., 1950, 72, 203–209 CrossRef CAS.
- G. Oster and Y. Nishijima, J. Am. Chem. Soc., 1956, 78, 1581–1584 CrossRef CAS.
- B. Wilhelmi, Chem. Phys., 1982, 66, 351–355 CrossRef CAS.
- M. Van der Auweraer, M. Van den Zegel, N. Boens, F. C. De Schryver and F. Willig, J. Phys. Chem., 1986, 90, 1169–1175 CrossRef CAS.
- G. G. Stokes, Philos. Trans. R. Soc. London, 1853, 143, 385–396 CrossRef.
- G. Scheibe, Angew. Chemie, 1936, 49, 563 CAS.
- G. Scheibe, Angew. Chemie, 1937, 50, 212–219 CrossRef CAS.
- F. Würthner, Angew. Chem., Int. Ed., 2020, 59, 14192–14196 CrossRef PubMed.
- J. Luo, Z. Xie, J. W. Y. Lam, L. Cheng, H. Chen, C. Qiu, H. S. Kwok, X. Zhan, Y. Liu, D. Zhu and B. Z. Tang, Chem. Commun., 2001, 1740–1741 RSC.
- Y. Hong, J. W. Y. Lam and B. Z. Tang, Chem. Soc. Rev., 2011, 40, 5361–5388 RSC.
- Y. Chen, J. W. Y. Lam, R. T. K. Kwok, B. Liu and B. Z. Tang, Mater. Horiz., 2019, 6, 428–433 RSC.
- C. Yu, C. Yu, C. Yu, X. Fang, Q. Wu, L. Jiao, L. Sun, Z. Li, P. K. So, W. Y. Wong and E. Hao, Org. Lett., 2020, 22, 4588–4592 CrossRef CAS PubMed.
- K. E. Horner and P. B. Karadakov, J. Org. Chem., 2013, 78, 8037–8043 CrossRef CAS PubMed.
- W. Qin, M. Baruah, M. Van der Auweraer, F. C. De Schryver and N. Boens, J. Phys. Chem. A, 2005, 109, 7371–7384 CrossRef CAS PubMed.
- G. De Belder, S. Jordens, M. Lor, G. Schweitzer, R. De, T. Weil, A. Herrmann, U. K. Wiesler, K. Müllen and F. C. De Schryver, J. Photochem. Photobiol., A, 2001, 145, 61–70 CrossRef CAS.
- Y. Lee, S. Das, R. M. Malamakal, S. Meloni, D. M. Chenoweth and J. M. Anna, J. Am. Chem. Soc., 2017, 139, 14733–14742 CrossRef CAS PubMed.
- M. Van der Auweraer, P. Ballet, F. C. De Schryver and A. Kowalczyk, Chem. Phys., 1994, 187, 399–416 CrossRef CAS.
- M. N. Berberan-Santos, E. N. Bodunov and B. Valeur, Chem. Phys., 2005, 315, 171–182 CrossRef CAS.
- L. Pandey and M. Van der Auweraer, J. Appl. Phys., 2011, 110, 53712 CrossRef.
- A. Blumen, J. Klafter and R. Silbey, J. Chem. Phys., 1980, 72, 5320–5332 CrossRef CAS.
- A. Blumen and R. Silbey, J. Chem. Phys., 1979, 70, 3707–3714 CrossRef CAS.
- S. G. Fedorenko and A. I. Burshtein, Chem. Phys., 1988, 128, 185–198 CrossRef CAS.
- G. Zumofen and A. Blumen, Chem. Phys. Lett., 1982, 88, 63–67 CrossRef CAS.
- A. Blumen and J. Manz, J. Chem. Phys., 1979, 71, 4694–4702 CrossRef CAS.
- J. Huang, F. de Jong, D. M. E. van Raamsdonk, J. Vandenwijngaerden, A. Inoue, D. Escudero, L. Van Meervelt, M. Van der Auweraer and W. Dehaen, Adv. Opt. Mater., 2023, 2301328 CrossRef.
- B. R. Henry and W. Siebrand, in Organic molecular photophysics, ed. J. B. Birks, John Wiley & Sons, London, 1973, vol. 1, p. 186 Search PubMed.
- Y. Yu, Y. Hong, C. Feng, J. Liu, J. W. Y. Lam, M. Faisal, K. M. Ng, K. Q. Luo and B. Z. Tang, Sci. China, Ser. B: Chem., 2009, 52, 15–19 CrossRef CAS.
Footnotes |
| † Electronic supplementary information (ESI) available. CCDC 2276919, 2276920 and 2277472–2277476. For ESI and crystallographic data in CIF or other electronic format see DOI: https://doi.org/10.1039/d3ma00511a |
| ‡ J. B. F. V. and J. H. are joint first authors. |
| This journal is © The Royal Society of Chemistry 2023 |