 Open Access Article
From waste to energy: luminescent solar concentrators based on carbon dots derived from surgical facemasks†
Antonino
Arrigo
 *a,
Ambra M.
Cancelliere
a,
Maurilio
Galletta
a,
Antonio
Burtone
b,
Giovanni
Lanteri
a,
Francesco
Nastasi
*a and
Fausto
Puntoriero
 a
a
aDepartment of Chemical, Biological, Pharmaceutical and Environmental Sciences, University of Messina, and Interuniversitary Research Center for Artificial Photosynthesis (Solar Chem, Messina Node), V. F. Stagno d’Alcontres 31, 98166 Messina, Italy. E-mail: antonino.arrigo@unime.it
bPrivate Laboratory Tech., Via Don Alfio Signorello n:9, 95032 Belpasso, CT, Italy
First published on 20th September 2023
Abstract
The enormous increase in the consumption of personal protection equipment, such as facemasks, mainly related to the COVID-19 pandemic, has shone light on the metric tons of plastic waste that are released into the oceans, with dramatic environmental concerns. Here, we report on the preparation of carbon dots (C-dots) following an environmentally friendly synthetic strategy using surgical facemasks as the starting material. Such C-dots are highly photostable and luminescent and were used to prepare luminescent solar concentrators exhibiting – once connected to silicon photovoltaic panels – a remarkable solar-to-energy conversion of 6.1%. Our results could suggest a way both to alleviate the serious environmental problem and to produce low-cost materials for solar energy conversion purposes.
Introduction
It has been estimated that around 26![[thin space (1/6-em)]](https://www.rsc.org/images/entities/char_2009.gif) 000 metric tons of plastic waste related to the COVID-19 pandemic have been released into the oceans since the diffusion of the pandemic. This is connected to the dramatic increase in the production and use of personal protection equipment, such as facemasks.1
000 metric tons of plastic waste related to the COVID-19 pandemic have been released into the oceans since the diffusion of the pandemic. This is connected to the dramatic increase in the production and use of personal protection equipment, such as facemasks.1
Unfortunately, only 14% of all plastic packaging is recycled globally, while the rest is released into the environment.2 Facemasks are not biodegradable and can be degraded into micro- and nano-plastics, which are ingested by higher organisms, such as fishes, and following the food chain, they can enter the human body, causing chronic health problems.3 Indeed, several international bodies (including the European Commission) are focusing their attention on the micro-plastics’ issue.
For these reasons, it is necessary to develop a convenient method for recycling these waste plastics,4 such as converting them into systems for producing valuable materials. Recently Abdelhameed et al.5 have developed a method to convert facemask waste into luminescent carbon dots (C-Dots).
C-Dots are nanoparticles consisting of a graphite core covered by an amorphous surface (shell). They are exclusively composed of non-toxic elements (C, N and O)6 and have useful properties such as high luminescence quantum yield, tunable band gap, photostability, good biocompatibility and low toxicity. Similar to semiconductor quantum dots, C-Dots are photoactive nanosystems that are capable of absorbing UV-Vis light to generate hole–electron pairs, which can recombine following a radiative pathway. The luminescence of C-dots is a function of excitation wavelength, which in turn is connected to the size of the nanoparticles and to the functionalization on the surfaces. For all these characteristics, C-Dots have been employed in various applications,7–10 including solar energy conversion.11,12 In this field, luminescent solar concentrators (LSCs) appear as an attractive technology. LSCs are transparent plastic materials (generally composed of acrylic polymers) where a chromophore is embedded in the solid matrix. The chromophore is photoexcited by solar radiation and emits light, which is then guided (due to total internal reflection) to the borders of the LSCs. When silicon-based photovoltaic (PV) panels are positioned at the borders of the LCSs, the light emitted from the chromophore is converted into electrical energy. The final purpose of LSC-PV devices is their integration into buildings and architectural structures, which leads us to consider applications on facades or rooftops.13
To the best of our knowledge, the record power conversion efficiency for an LSC-coupled PV cell is around 7.1% which was obtained in 2008 using a luminescent organic dye.14 Since then, several other luminophores have been employed in LSCs, but in the last few years, the interest moved to the use of semiconductor quantum dots thanks to their photochemical properties, such as (i) good photostability, (ii) large Stokes shift, and (iii) tunability of the photochemical properties by changing the size or surface functionalization.15 Despite all these advantages, the common semiconductor quantum dots are based on heavy metals, which have high toxicity and cost, and for this reason, the use of these systems at an industrial level might be limited. C-Dots seem to meet all these requirements, and therefore appear as good candidates for use in LSC devices.
To try to connect the need to recycle facemasks with the global energy problems,16,17 recently we have obtained carbon dots in size on average from 4 to 13 nm in diameter, starting from used surgical facemasks. Then, these C-Dots have been used to prepare LCSs, which appear transparent and slightly yellow coloured. Optical and photovoltaic characterization of the LSC-PV system has been performed, showing a power efficiency of 6.1%. This value is comparable to that of the best LSC-PV reported up to now, with the quite important advantage of being related to otherwise polluting waste objects.
Results and discussion
Preparation of C-Dots and their photophysical properties in solution
Carbon dots were synthesized from used facemasks, following a top-down approach, via a hydrothermal procedure using hydrogen peroxide (30% v/v). This synthetic route does not require many steps, nor specific purification processes and the main advantage is the absence of organic solvents or toxic materials; in addition, the use of nitric acid or other acids as typically used in hydrothermal synthesis is not required. On the other hand, it does not allow controlling the size of the obtained nanoparticles. Details of the conditions are described in the ESI.† The so-formed C-Dots were dispersed in dichloromethane and characterized using a Zeiss Merlinn M II, a high-resolution scanning electron microscope (SEM). As shown in Fig. 1, the C-Dots were evenly distributed, different in size on average from 4 to 13 nm in diameter.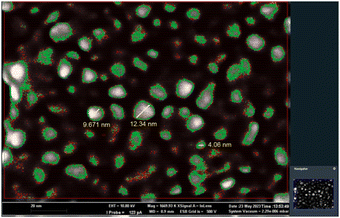 | ||
| Fig. 1 Image of the C-Dots (dispersed in dichloromethane) obtained using the high-resolution SEM. The C-Dots are grey colored and the green borders delimit the nanoparticles against the black background, which is the carbon-based support. The working distance is less than 1 mm. See the ESI† for further details. | ||
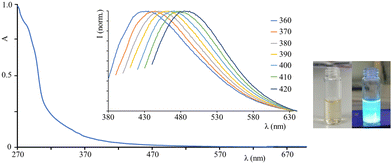
The absorption spectrum of C-Dots in dichloromethane solution (see Fig. 2-left) shows strong absorption in the UV region, with a band at around 290 nm which can be attributed to π → π* transitions and a (less intense) band at lower energy, assigned to n → π* transitions probably due to the presence of carbonyl groups on the C-Dots surface. The emission spectra (Fig. 2, inset) of the C-Dots are a function of the excitation wavelength, typical for these systems:18 exciting from 360 nm to 420 nm, the emission peak shifts from 435 nm to 488 nm (see Table 1 and Fig. 2). As a consequence, the luminescence quantum yield of C-Dots in solution varies by changing the excitation wavelength and therefore it is quite often neglected in the literature. Even if it is known that the luminescence is due to the hole–electron pair recombination, the luminescence mechanisms of C-Dots still remain unclear and the possible explanations are connected to the particle size, or to the surface functional groups, or to defects in the nanosystems.19,20
| λ max/nm (λexc/nm) | τ average/ns | |
|---|---|---|
| C-Dots in solution | 435 (360); 442 (370) | 3; 9 |
| 451 (380); 460 (390) | ||
| 468 (400); 477 (410) | ||
| 488 (420) | ||
| C-Dots in LSC | 438 (360); 442 (370) | 3; 9 |
| 449 (380); 463 (390) | ||
| 470 (400); 475 (410) | ||
| 485 (420) |
In fact, it is worth noting that any surface defect bringing sp2 and sp3 subunits acts as a surface energy trap, thus contributing to the multicolor emissions of C-Dots.21–25 Indeed, for the carbon-based nanomaterials, the photophysical properties are determined by the π states of the sp2 groups. The energy of these states lies in the band gap of the σ and σ* states of the sp3 matrix and results in intense emissions in the visible region and weak absorption bands in the near UV-Vis region.26
The presence of functional groups (in particular, carbonyl groups) is confirmed in the present case by the IR spectrum of the C-Dots (reported in the ESI,† Fig. S2), where the presence of a clear signal can be observed between 1750 cm−1 and 1690 cm−1.
The luminescence lifetime of C-Dots in aerated solution shows a biexponential decay with lifetimes of 3 ns and 9 ns (Table 1). It should be remembered that there is a wide range of nanoparticles of different sizes (from 4 to 13 nm) that contribute to these lifetimes. So, the excited-state decays are probably the dominating, mediated decays related to different groups of nanoparticles, as suggested by their constancy on changing emission wavelengths.
Fabrication of LSCs and their photophysical properties
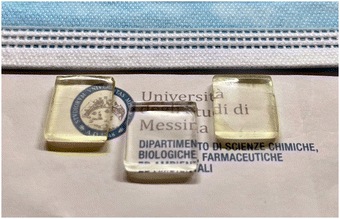
LSCs were produced by thermal polymerization involving lauryl methacrylate as a monomer, ethyl glycol dimethacrylate as a cross-linking agent, and lauroyl peroxide as an initiator,27 in the presence of C-Dots. Such a preparation strategy appears to be efficient and does not cause photodegradation of the systems compared with other strategies such as photochemical polymerization. The so-obtained LSCs are transparent and almost colourless (Fig. 3) and display the photoluminescence of the C-Dots from the edges under UV illumination of the top of the slab. According to Snell's law, for a polyacrylate waveguide (such as in this case) up to 75% of the light emitted by the luminescent species can be concentrated at the edge of the slab by total internal reflection.28The selection of polymer is important for the final performance of the LSCs because, over the waveguide, the matrix can partially absorb the emission light from the luminophore embedded in the LSCs, and this contribution cannot be neglected. Indeed, Meinardi et al.13 used Monte Carlo ray tracing simulations to investigate the absorption capability of the optical waveguide, which might decrease the efficiency of the LSCs. The studies revealed that conventional PMMA (polymethyl methacrylate) has considerably good transparency and absorbs less light than standard window glasses. For these reasons, among the possible rigid matrices to manufacture the LSC, we selected poly-acrylates.
The absorption spectrum of the C-Dots embedded into the LSCs (as shown in the ESI†) shows the same features as the colloidal dichloromethane solution. The fraction of photons absorbed by the LSC C-Dots, defined as ηabs-vis, is 25.16% calculated by integration from transmission spectra of the AM 1.5G solar spectrum from 370 nm to 1050 nm), and this value should be compared with the value of 14.31% for the blank sample (i.e. LSC without C-Dots), that is not negligible considering that some incident light is trapped in the waveguide.29
Once embedded in the LSCs, the luminescence of C-Dots remains dependent on the excitation wavelength and this dependence appears to be similar to that in solution: exciting from 360 nm to 420 nm, the emission peak shifts from 438 nm to 485 nm (Fig. 4 and Table 1). When comparing the solid to the colloidal phase, the C-dots emission does not seem to be significantly altered, despite the absence of solvent and the different chemical environment around the nanosystems, when the C-Dots are transferred from dichloromethane solution to the LSCs. Moreover, the photoluminescence decay of LSC C-Dots is biexponential, exhibiting the identical lifetimes exhibited by C-dots in solution (3 ns and 9 ns). All these results indicate that the photophysical properties of C-Dots are not significantly affected once embedded in the polyacrylic solid matrix, thus suggesting that surface functional groups do not influence on the excited states of nanostructures.
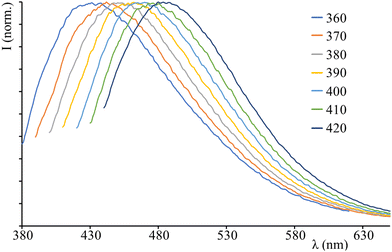 | ||
| Fig. 4 Emission spectra of LSC C-Dots exciting at different wavelengths (indicated on the top right of the panel). | ||
A typical measurement for testing the efficiency of the waveguides in the LSC is to check how the emission intensity and shape are influenced by the position of the irradiation light spot on the slab top surface. Ideally, when the irradiation light is moved from one edge to the other of the LSC top surface, the shape and emission maximum should not be altered. Practically, in most cases, the emission intensity decreases slightly when the source spot is moved away from the edge, thus increasing the optical path for light emission. This decrease in intensity can be explained by considering re-absorption events as a consequence of the increased optical path or by considering that the surface roughness, together with some bulk defects, can have an impact on the refractive index of the matrix, causing the loss of some photons over the optical path.30,31
To perform this test, we used a laser spot centred at 406 nm to irradiate the top of the LSCs and measured the emission from the edge. The emission maximum (525 nm for this excitation wavelength) is only slightly affected by the position of the laser spot on the LSC surface, due to some losses over the optical path and the geometric factors between the collection angle of the detector and the emission cone, but no variation of the band shape is observed, indicating that no significant re-absorption takes place (Fig. 5).
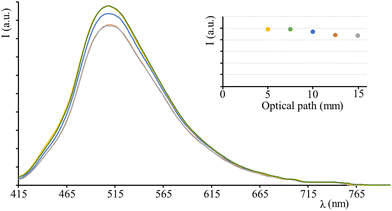 | ||
| Fig. 5 Luminescence spectra exciting the top surface of LSC C-Dots at different distances from the edge, using a laser at 406 nm. In the inset, the emission intensity vs optical path is shown. | ||
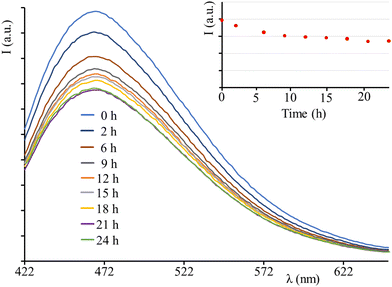
The photostability test of the LSC embedding C-Dots has been performed top irradiating the LSC using an AM 1.5G solar simulator (100 mW cm2) for 24 h, whilst registering the emission spectra. After a small decrease in the initial hours of irradiation (which appears common in the literature for other LSC systems),6 the emission intensity remains approximately constant, indicating the stability of the device and confirming the photostability of C-Dots in solution (Fig. 6).
Photovoltaic performance of the LSC-PV device
In order to measure the photovoltaic performance of the LSC-PV device, the LSC had been placed on a silicon photovoltaic (PV) cell, and irradiated perpendicularly at 100 mW cm2 using an AM 1.5G solar simulator.32 In our setup, just one edge of the LSC was in contact with the PV cell, while the other edges were uncovered. During the experiment, the short-circuit current intensity (mA) was detected and converted into the short-circuit current density J (mA cm−2) in order to take into account the area of the LSC in contact with the PV cell. The same experiment was also repeated for the blank sample, where some of the incident light is trapped in the waveguide and reaches the PV cell, providing a contribution to the photocurrent which cannot be neglected; so, this value is considered as a reference to estimate the real optical efficiency of the LSC C-Dots – PV device.However, since the short-circuit current density is only providing limited information on the efficiency of the system, more information can be interpreted from the optical efficiency ηopt of the LSC, defined by eqn (1).33
 | (1) |
 | (2) |
![[thin space (1/6-em)]](https://www.rsc.org/images/entities/char_2009.gif) long and Aedge
long and Aedge![[thin space (1/6-em)]](https://www.rsc.org/images/entities/char_2009.gif) short are the areas of the two edges of the rectangular slab. A large LSC directs more photons to the PV cell compared to a small LSC, and thus, JLSC is typically higher for larger LSCs. The role of the G factor (obviously higher for large LSCs than for small ones) is to counter-balance such contributions in eqn (1), taking into account the LSCs geometry in the optical efficiency of the device.35
short are the areas of the two edges of the rectangular slab. A large LSC directs more photons to the PV cell compared to a small LSC, and thus, JLSC is typically higher for larger LSCs. The role of the G factor (obviously higher for large LSCs than for small ones) is to counter-balance such contributions in eqn (1), taking into account the LSCs geometry in the optical efficiency of the device.35
The optical efficiency for the blank LSC is approximately 2.4%, due to the incident light trapped in the slab, and this is quite a high value for a blank, indicating an efficient waveguide of the rigid matrix and good quality of the surfaces and edges in the present solid material; ηopt for the LSC C-Dots system is about 6.1%. These results (illustrated in Table 2) clearly indicate that the luminescent C-Dots influence the efficiency of the LSC-PV device, and this can be further highlighted by subtracting ηopt of the blank LSC (2.4%) to ηopt of the LSC C-Dots (6.1%), in order to remove the contribution of the incident light: the resulting optical efficiency of 3.7% is the direct contribution by the C-Dots.
| LSC | I (mA) | J LSC (mA cm−2) | G factor | η opt (%) |
|---|---|---|---|---|
| Blank | 0.10 (±0.01) | 0.15 (±0.02) | 1.29 (±0.01) | 2.38 (±0.17) |
| C-Dot | 0.22 (±0.01) | 0.41 (±0.02) | 1.35 (±0.01) | 6.07 (±0.12) |
However, since ηopt does not take into account, the fraction of photons absorbed by the LSC C-Dots, we calculated the corrected optical efficiency ηopt,abs according to eqn (3).
 | (3) |
Moreover, comparison of the J–V curve registered for LSC-CDots coupled to the PV panel and the J–V curve of the PV panel without LSCs (see Fig. S7 in the ESI†) highlights that the fill factor of the device is not significantly affected by the presence of the LSCs. Finally, we studied the photovoltaic performance of the LSCs as a function of the position of the excitation light on the slab surface. To perform this experiment, we adopted the same set-up used to measure the influence of the distance on the emission intensity. The short-circuit current density is only slightly affected when the light spot moves from the edge to the center of the slab surface and then reaches a plateau, in agreement with the luminescence behavior under the same experimental conditions (Fig. 7).
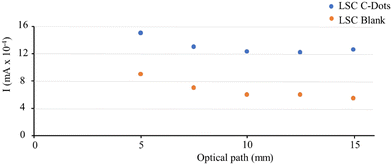 | ||
| Fig. 7 Short-circuit current intensity measured after exciting the top surface of LSC C-Dots at different distances from the edge, using a laser at 406 nm. | ||
Conclusions
Carbon dots derived from used facemasks have been prepared via hydrothermal procedures, without organic solvents or toxic materials and specific purification processes, and have been characterized by infrared spectroscopy and SEM, which showed that the size of the prepared C-dots is rather uniform, with a diameter ranging from 4 to 13 nm. Quite photostable luminescent solar concentrators (LSC) have been prepared by using these C-dots, by thermal polymerization involving poly-acrylate species as a monomer and cross-linking agents, and lauroyl peroxide as the initiator. The absorption and photophysical properties of these C-dots-based LSC have been compared to the same properties of the C-dots in dichloromethane solution: in both media, absorption spectra show absorption in the visible region and luminescence in the 380–600 nm region, with emission maxima depending on the excitation wavelength, typical for these nanosystems. Luminescence decay is biphasic and is dominated by lifetimes of the order of 3 and 9 ns. The C-dots LSC have been interfaced with silicon photovoltaic systems, and the systems so obtained exhibit a power efficiency for solar-to-electricity conversion of 6.1%, which is not far from the best reported literature value (7.1%), which however is based on more expensive synthetic luminescent organic dyes (ref. 12).The present results illustrate a strategy to address a serious environmental problem that is the enormous production of plastic wastes derived from surgical facemasks whose consumption is still impressively large.
Considering the thousands of tons of plastic wastes related to the COVID-19 pandemic emergency which have been released into the oceans (ref. 1), the transformation of surgical facemasks into a resource could substantially contribute both to alleviate the environmental problem and to produce low-cost materials for solar energy conversion purposes.
Conflicts of interest
There are no conflicts to declare.Acknowledgements
This work was funded in part by a grant from the Italian Ministry of Foreign Affairs and International Cooperation (PGR project on Artificial Photosynthesis, collaboration Italy-Japan, Grant Number JP21GR09) and in part by the European Union (NextGeneration EU), through the MUR-PNRR project SAMOTHRACE (ECS00000022).References
- A. M. Oliveira, A. L. Patrício Silva, A. M. V. M. Soares, D. Barcelo, A. C. Duarte and T. Rocha-Santos, J. Environ. Chem. Eng., 2023, 11, 109308 CrossRef CAS PubMed.
- (a) Y. Peng, P. Wu, A. T. Schartup and Y. Zhang, Proc. Natl. Acad. Sci. U. S. A., 2021, 118, 1–6 Search PubMed; (b) E. MacArthur, The new plastics economy: Rethinking the future of plastics & catalysing action, Ellen, MacArthur Foundation, 2017, p. 68, https://ellenmacarthurfoundation.org/the-new-plastics-economy-rethinking-the-future-of-plastics-and-catalysing Search PubMed.
- Y. Tokiwa, B. P. Calabia, C. U. Ugwu and S. Aiba, Int. J. Mol. Sci., 2009, 10, 3722–3742 CrossRef CAS.
- H. Du, S. Huang and J. Wang, Sci. Total Environ, 2022, 815, 152980 CrossRef CAS PubMed.
- M. Abdelhameed, M. Elbeh, N. S. Baban, L. Pereira, J. Matula, Y.-A. Song and K. B. Ramadi, Green Chem., 2023, 25, 1925 RSC.
- Y. Zhou, D. Benetti, X. Tong, L. Jin, Z. M. Wang, D. Ma, H. Zhao and F. Rosei, Nano Energy, 2018, 44, 378–387 CrossRef CAS.
- (a) S. N. Baker and G. A. Baker, Angew. Chem., Int. Ed., 2010, 49, 6726–6744 CrossRef CAS; (b) H. Li, Z. Kang, Y. Liu and S. Lee, J. Mater. Chem., 2012, 22, 24230–24253 RSC.
- X. Tian, A. Zeng, Z. Liu, C. Zheng, Y. Wei, P. Yang, M. Zhang, F. Yang and F. Xie, Int. J. Nanomed., 2020, 15, 6519 CrossRef CAS.
- K. O. Boakye-Yiadom, S. Kesse, Y. Opoku-Damoah, M. S. Filli, M. Aquib, M. M. B. Joelle, M. A. Farooq, R. Mavlyanova, F. Raza, R. Bavi and B. Wang, Int. J. Pharm., 2019, 564, 308–317 CrossRef CAS PubMed.
- S. Sawalha, K. Moulaee, G. Nocito, A. Silvestri, S. Petralia, M. Prato, S. Bettini, L. Valli, S. Conoci and G. Neri, Carbon Trends, 2021, 5, 100105 CrossRef CAS.
- (a) X. Gong, S. Zheng, X. Zhao and A. Vomiero, Nano Energy, 2022, 101, 107617 CrossRef CAS; (b) G. Liu, X. Wang, G. Han, J. Yu and H. Zhao, Mater. Adv., 2020, 1, 119 RSC; (c) J. Li, H. Zhao, X. Zhao and X. Gong, Nanoscale Horiz., 2023, 8, 83 RSC; (d) J. Chen, H. Zhao, Z. Li, X. Zhao and X. Gong, Energy Environ. Sci., 2022, 15, 799 RSC; (e) J. Li, J. Chen, X. Zhao, A. Vomiero and X. Gong, Nano Energy, 2023, 115, 108674 CrossRef CAS.
- X. Wang, Y. Zhang, J. Li, G. Liu, M. Gao, S. Ren, B. Liu, L. Zhang, G. Han, J. Yu, H. Zhao and F. Rosei, Small Methods, 2022, 6, 2101470 CrossRef CAS.
- F. Meinardi, F. Bruni and S. Brovelli, Nat. Rev. Mater., 2017, 2, 1–9 Search PubMed.
- L. H. Slooff, E. E. Bende, A. R. Burgers, T. Budel, M. Pravettoni, R. P. Kenny, E. D. Dunlop and A. A. Büchtemann, Phys. Status Solidi RRL, 2008, 2, 257–259 CrossRef CAS.
- J. Li, Y. Wub and X. Gong, Chem. Sci., 2023, 14, 3705 RSC.
- (a) N. Armaroli and V. Balzani, Angew. Chem., Int. Ed., 2007, 46, 52 CrossRef CAS; (b) M. H. V. Huynh and T. J. Meyer, Chem. Rev., 2007, 107, 5004 CrossRef CAS PubMed; (c) J. P. McEvoy and G. W. Brudvig, Chem. Rev., 2006, 106, 4455 CrossRef CAS PubMed; (d) M. Wasielewski, Acc. Chem. Res., 2009, 42, 1910 CrossRef CAS PubMed; (e) D. Gust, T. A. Moore and A. L. Moore, Acc. Chem. Res., 2009, 42, 1890 CrossRef CAS; (f) C. Herrero, A. Quaranta, W. Leibl, A. W. Rutherford and A. Aukauloo, Energy Environ. Sci., 2011, 4, 2353 RSC.
- S. Campagna, F. Nastasi, G. La Ganga, S. Serroni, A. Santoro, A. Arrigo and F. Puntoriero, Phys. Chem. Chem. Phys., 2023, 25, 1504 RSC.
- F. Yan, J. Li, X. Zhao and X. Gong, J. Phys. Chem. Lett., 2023, 14, 5975 CrossRef CAS PubMed.
- H. Ding, X.-H. Li, X.-B. Chen, J.-S. Wei, X.-B. Li and H.-M. Xiong, J. Appl. Phys., 2020, 127, 231101 CrossRef CAS.
- L. Đorđević, F. Arcudi, M. Cacioppo and M. Prato, Nat. Nano., 2022, 17, 112–130 CrossRef.
- D. B. Shinde and V. K. Pillai, Chem. – Eur. J., 2012, 18, 12522–12528 CrossRef CAS.
- Y. Q. Dong, C. Q. Chen, X. T. Zheng, L. L. Gao, Z. M. Cui, H. B. Yang, C. X. Guo, Y. W. Chi and C. M. Li, J. Mater. Chem., 2012, 22, 8764–8766 RSC.
- J. Peng, W. Gao, B. K. Gupta, Z. Liu, R. Romero-Aburto, L. H. Ge, L. H. Song, L. B. Alemany, X. B. Zhan, G. H. Gao, S. A. Vithayathil, B. A. Kaipparettu, A. A. Marti, T. Hayashi, J.-J. Zhu and M. P. Ajayan, Nano Lett., 2012, 12, 844–849 CrossRef CAS.
- H. P. Liu, T. Ye and C. D. Mao, Angew. Chem., Int. Ed., 2007, 46, 6473–6475 CrossRef CAS.
- S. Y. Lim, W. Shen and Z. Gao, Chem. Soc. Rev., 2015, 44, 362–381 RSC.
- Y. Wang and X. Gong, Adv. Mater. Interfaces, 2017, 4, 1700190 CrossRef.
- R. Mazzaro, A. Gradone, S. Angeloni, G. Morselli, P. G. Cozzi, F. Romano, A. Vomiero and P. Ceroni, ACS Photonics, 2019, 6, 2303–2311 CrossRef CAS.
- M. G. Debije and P. P. C. Verbunt, Adv. Energy Mater., 2012, 2, 12–35 CrossRef CAS.
- L. Zdrazil, S. Kalytchuk, M. Langer, R. Ahmad, J. Pospísil, O. Zmeskal, M. Altomare, A. Osvet, R. Zboril, P. Schmuki, C. J. Brabec, M. Otyepka and S. Kment, Appl. Energy Mater., 2021, 4, 6445–6453 CrossRef CAS.
- F. Meinardi, S. Ehrenberg, L. Dhamo, F. Carulli, M. Mauri, F. Bruni, R. Simonutti, U. Kortshagen and S. Brovelli, Nat. Phot., 2017, 11, 177–185 CrossRef CAS.
- I. Coropceanu and M. G. Bawendi, Nano Lett., 2014, 14, 4097–4101 CrossRef CAS PubMed.
- F. Purcell-Milton and Y. K. Gun'ko, J. Mater. Chem., 2012, 22, 16687 RSC.
- C. Yang, et al. , Joule, 2022, 6, 1–15 CrossRef.
- H. Zhao, D. Benetti, L. Jin, Y. Zhou, F. Rosei and A. Vomiero, Small, 2016, 38, 5354–5365 CrossRef.
- Y. Zhou, D. Benetti, Z. Fan, H. Zhao, D. Ma, A. O. Govorov, A. Vomiero and F. Rosei, Adv. Energy Mater., 2016, 6, 1501913 CrossRef.
Footnote |
| † Electronic supplementary information (ESI) available. See DOI: https://doi.org/10.1039/d3ma00507k |
| This journal is © The Royal Society of Chemistry 2023 |

