 Open Access Article
Structural and dielectric characterization of synthesized nano-BSTO/PVDF composites for smart sensor applications
Marwa M.
Hussein
*a,
Samia A.
Saafan
a,
H. F.
Abosheiasha
b,
Amira A.
Kamal
c,
Abd El-razek
Mahmoud
c,
Di
Zhou
 d,
Sergei V.
Trukhanov
 *ef,
Tatiana I.
Zubar
f,
Alex V.
Trukhanov
 ef and
Moustafa A.
Darwish
*a
aPhysics Department, Faculty of Science, Tanta University, Tanta 31527, Egypt. E-mail: truhanov86@mail.ru
bEngineering Physics and Mathematics Department, Faculty of Engineering, Tanta University, Tanta 31511, Egypt
cFerroelectric and Piezoelectric Lab, Physics Department, Faculty of Science, South Valley University, Qena 83523, Egypt
dElectronic Materials Research Laboratory, Key Laboratory of the Ministry of Education & International Center for Dielectric Research, School of Electronic Science and Engineering, Xi'an Jiaotong University, Xi'an 710049, China
eSmart Sensor Laboratory, National University of Science and Technology MISiS, Moscow 119049, Russia
fSSPA “Scientific and Practical Materials Research Centre of NAS of Belarus”, 19, P. Brovki str., Minsk, 220072, Belarus
First published on 24th October 2023
Abstract
In this study, nanoparticles of Ba1−xSrxTiO3 (where x = 0.0, 0.1, 0.2, 0.3, and 0.4) have been prepared using a chemical method. One of these pure perovskite compositions (x = 0.0) has been then mixed with Polyvinylidene fluoride (PVDF) polymer in different weight ratios (70% BaTiO3:30% PVDF, 50% BaTiO3:50% PVDF, and 30% BaTiO3:70% PVDF) to create composites. X-ray diffraction (XRD) analysis and Fourier-transform infrared spectroscopy (FTIR) have been used to investigate the formation of the desired nano samples. The findings demonstrate the nanocrystalline nature and high ferroelectric characteristics of the developed ferroelectric samples. Scanning electron microscopy (SEM), energy dispersive X-ray (EDX) spectroscopy, and transmission electron microscopy (TEM) have all been used to learn more about the samples. The samples' dielectric properties and P–E hysteresis loops have also been investigated, revealing that samples where x = 0.0, 0.1, and 0.2 have suitable properties for piezoelectric AC device applications. The ferroelectric and piezoelectric characteristics of BaTiO3 have been found to be diminished when PVDF was introduced. Furthermore, the dielectric properties and P–E hysteresis loop investigations can provide insight for researchers and engineers working in the ferroelectric and piezoelectric application fields to explore new possibilities.
1. Introduction
Materials science research is currently focused on developing multifunctional materials that possess a variety of physical properties that can be modified simultaneously. One such class of materials is known as ferroelectrics, which exhibit a wide range of properties, including superconductivity, ferroelectricity, and two-dimensional electron gases.1 These properties make ferroelectrics particularly attractive for technological applications. Ferroelectric materials are characterized by their electric dipoles, the switching behavior of which can be controlled by external fields. As a result of this feature, these materials have found use in many different fields, most notably energy storage,2 micro-electromechanical systems, sensors,3 device applications,4 supercapacitors,5 actuators, and resistive switching.Perovskite oxides, composed of transition metal ions with an empty d shell, are considered normal ferroelectrics. Besides, such materials can also exhibit magnetic properties if their B-site ions have a partially filled d shell. These magnetic properties may include antiferromagnetic, ferromagnetic, or ferrimagnetic.5,6 The presence of both magnetic and ferroelectric phenomena in these materials is called multiferroicity, making them particularly attractive for magnetoelectric applications.
Barium titanate (BaTiO3) is the most famous well-studied ferroelectric material ever. It has a high dielectric constant, high electrical resistivity, and excellent piezoelectric, ferroelectric, and chemical stability.7 Additionally, it is a non-toxic, environmentally-friendly material,8 making it a popular choice for applications such as dielectric capacitors, positive temperature coefficient (PTC) thermistors, ultrasonic transducers, optical data storage devices, and thermal energy harvesters.9 Some researchers have been focusing on understanding and manipulating the microstructure of perovskites and studying their electrical properties to produce functional materials.10 Also, controlling the microstructure is critical for improving dielectric and piezoelectric properties for many practical applications.11 Improved characteristics, such as a high dielectric constant, low loss tangent, and high Curie temperature, have been the focus of recent research on BaTiO3-based ceramics.12
Strontium titanate (SrTiO3) is another significant perovskite material, owing to its high chemical stability, thermal stability, carbon and sulfur tolerance, and mixed electronic-ionic conduction behavior.13 Sr2+ doping at the Ba2+ site may reduce the Curie temperature, making it beneficial in dynamic random-access memory (DRAM), for example.9 Moreover, recent research on SrTiO3 has been focused on the study of its electronic properties and the effects of different types of dopants on their properties. Moreover, it has been found that it has many potential applications in electronics and optoelectronics.9,13
Ba1−xSrxTiO3 is another class of ferroelectric materials that have been found to be easily changeable with regard to dielectric permittivity and loss, tuneability, and Curie temperature depending on the Ba/Sr molar ratio.14 These materials may be utilized in a variety of contexts, including as parts of microwave and other device capacitors.15 More recent research on Ba1−xSrxTiO3 synthesized by the sol–gel method has also revealed that the Sr content affects the crystalline structure, grain size, densification, thermal conductivity, and compressive strength.16
Polyvinylidene fluoride, also known as PVDF, is a widely studied electroactive polymer due to its versatility in a variety of applications, including energy generation, bio-materials, sensors, and actuators.17 PVDF is known to exhibit at least four different crystalline phases, characterized by distinct chain conformations; these are β, α, δ, and γ-phases,18 of which the β and α-phases are considered the most significant for practical uses. Research in the field of PVDF has been geared towards discovering new methods of synthesis processing techniques and investigating the relationship between the crystalline phases and the material's properties for various applications.19 The current area of study in ferroelectric materials includes the development of ferroelectric composites. It includes understanding how the microstructure may influence the properties and how to use these materials in real-world applications.
2. Experimental
2.1. Ferroelectric materials (Ba1−xSrxTiO3) preparation
Ba1−xSrxTiO3 nanoparticles (with varying x values of 0.0, 0.1, 0.2, 0.3, and 0.4) have been synthesized using the tartaric precursor method which is a very effective method in preparation with various advantages compared with other methods, as mentioned in literature.20–24 A combination of reagents, including Ba(NO3)2 (98.5% purity, sourced from Qualikems), Sr(NO3)2 (≥99.0% purity, sourced from Techno PharmChem), TiO2 (≥99.0% purity, sourced from Techno PharmChem), and C4H6O6 (≥99.0% purity, sourced from Techno PharmChem), have been weighed and mixed in specific ratios, with a molar ratio of 3![[thin space (1/6-em)]](https://www.rsc.org/images/entities/char_2009.gif) :
:![[thin space (1/6-em)]](https://www.rsc.org/images/entities/char_2009.gif) 1
1![[thin space (1/6-em)]](https://www.rsc.org/images/entities/char_2009.gif) :
:![[thin space (1/6-em)]](https://www.rsc.org/images/entities/char_2009.gif) 1 of tartaric acid to (Ba1−xSrx) nitrate to Ti dioxide. After dissolving the powders in distilled water and homogenizing the mixture by stirring for 30 minutes at room temperature, the mixture was heated at 80 °C for 2 hours to evaporate most of the water. Around 120 °C, the combination turns into a viscous gel that spontaneously burns to create the nanoparticles as a fine powder. The powder was then ground and pre-sintered for 24 hours at 300 °C, followed by sintering for 4 hours at 1100 °C. The powder has been compressed into disc-shaped pellets for further characterization and measurement.
1 of tartaric acid to (Ba1−xSrx) nitrate to Ti dioxide. After dissolving the powders in distilled water and homogenizing the mixture by stirring for 30 minutes at room temperature, the mixture was heated at 80 °C for 2 hours to evaporate most of the water. Around 120 °C, the combination turns into a viscous gel that spontaneously burns to create the nanoparticles as a fine powder. The powder was then ground and pre-sintered for 24 hours at 300 °C, followed by sintering for 4 hours at 1100 °C. The powder has been compressed into disc-shaped pellets for further characterization and measurement.
2.2. Preparation of ferroelectric/PVDF composites
The sample with x = 0.0 (BaTiO3) has been selected as the primary material for creating composites with PVDF polymer (CH2CF2)n, with a molecular weight of approximately 534![[thin space (1/6-em)]](https://www.rsc.org/images/entities/char_2009.gif) 000, sourced from Sigma Aldrich. The reason for selecting this ratio (x = 0.0) is presented in detail in the next discussion. Composites with varying contents of BaTiO3 have been then created by mixing the desired ratios of BaTiO3 and PVDF in the following proportions: 70 wt% BaTiO3:30 wt% PVDF (Sample B1), 50 wt% BaTiO3:50 wt% PVDF (Sample B2), and 30 wt% BaTiO3:70 wt% PVDF (Sample B3). The samples were weighed and mixed using an agate mortar and pressed into disc-shaped pellets for characterization and measurements.
000, sourced from Sigma Aldrich. The reason for selecting this ratio (x = 0.0) is presented in detail in the next discussion. Composites with varying contents of BaTiO3 have been then created by mixing the desired ratios of BaTiO3 and PVDF in the following proportions: 70 wt% BaTiO3:30 wt% PVDF (Sample B1), 50 wt% BaTiO3:50 wt% PVDF (Sample B2), and 30 wt% BaTiO3:70 wt% PVDF (Sample B3). The samples were weighed and mixed using an agate mortar and pressed into disc-shaped pellets for characterization and measurements.
2.3. Characterization
Several analytical methods have been used to analyze the ferroelectric samples; one of these methods is the XRD PANALYTICAL Co. Xpert Pro system was used at 1.54 Å, 54 kV, and 40 mA on a Cu-Kα (target). The FTIR measurements were taken using a JASCO FT/IR4100 Series instrument, which measured from 400 cm−1 to 4000 cm−1. Ba1−xSrxTiO3 particles (where x = 0.0, 0.1, 0.2, 0.3, and 0.4) have been analyzed for their surface microstructure using SEM (Zeiss EVO 10, Oberkochen, Germany). Nanoparticles of Ba1−xSrxTiO3 have also been analyzed for their chemical makeup using the EDX and an AZtecLive Advanced Ultim Max 40 detector (Oxford Instruments, Bognor Regis, UK). The TEM: JEM-2100 apparatus was used to measure the average particle size of the BaTiO3 sample (used to create the composites). The LCR meter (HIOKI 3532-50 LCR HITESTER) has been used to investigate the frequency and temperature dependence of the AC conductivity dielectric constant (ε′), and loss tangent (tan
![[thin space (1/6-em)]](https://www.rsc.org/images/entities/char_2009.gif) δ). The RADIANT Precision II Multiferroic Ferroelectric Test System was used to evaluate the ferroelectric characteristics at room temperature, utilizing a maximum voltage of 10 kV.
δ). The RADIANT Precision II Multiferroic Ferroelectric Test System was used to evaluate the ferroelectric characteristics at room temperature, utilizing a maximum voltage of 10 kV.
3. Results and discussion
3.1. XRD analysis
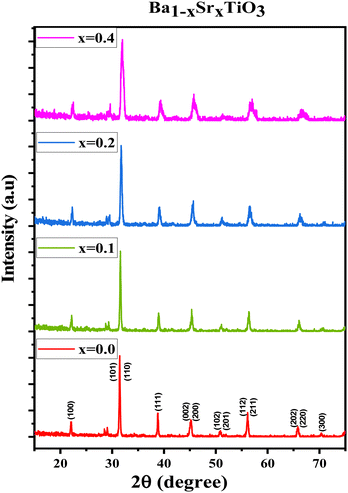
The XRD patterns for the prepared ferroelectric Ba1−xSrxTiO3 nanoparticles (with compositions x = 0.0, 0.1, 0.2, 0.3, and 0.4) are shown in Fig. 1. These plots reveal that the samples possess a perovskite structure with a primary tetragonal phase and a minor trace of an orthorhombic phase. For the sample x = 0.0, the most intense peaks found at the angles 2θ presenting the planes (hkl) are: 22.13° (100), 31.45° (101), 31.51° (110), 38.79° (111), 45.19° (002), 45.29° (200), 50.79° (102), 50.91° (201), 56.13° (112), 56.17° (211), 65.85° (202), 65.99° (220), 70.35° (300), 74.93° (301), 75.03° (310), the standard cards of BaTiO3 (JCPDS number 01-079-6629, P4mm space group; JCPDS number 01-084-9614, P4mm space group; and JCPDS number 01-076-8447, P4mm space group) all indicate the production of the perovskite phase of BaTiO3. For the rest of the samples, the XRD patterns are also represented in Fig. 1, which shows that the peaks of the same planes mentioned above confirm that the samples belong mostly to the tetragonal crystal structure according to the same mentioned standard cards in addition to other standard cards of Ba0.67Sr0.33TiO3 (JCPDS number 01-089-0274), and of Ba0.76Sr0.33TiO3 (JCPDS number 00-044-0093). For most of the samples, two tiny peaks are observed around 2θ = 28.49° and 2θ = 29.05°, which may be attributed to a minor orthorhombic phase according to the standard cards of Ba2TiO4 (JCPDS number 01-075-0677) with space group: P21nb and of Ba1.91Sr0.09TiO4 (JCPDS number 00-013-0522). The characteristic splitting behavior observed in some particular peaks in all samples confirms the predominant tetragonal crystal structure,25–27 which is a key factor in the perovskites' ferroelectric properties.28 Although the sharp and narrow peaks indicate the good crystalline nature of the samples, the slight broadening observed with the substitution of strontium occurs as a result of increasing the strain, as will be discussed below. In Fig. 1, a slight shift towards higher 2θ angles is observed as the strontium ratio increases too. This shift is attributed to the change in d-spacing, related to the lattice parameters, as the strontium is added.29The crystalline size (R) has been calculated by using Scherrer's equation:
 | (1) |
The following relation has calculated the lattice constants (a) and (c):
 | (2) |
 | (3) |
 | (4) |
 | (5) |
 | (6) |
 | (7) |
| Sample | Lattice constants (Å) | R (nm) Average crystallite size from XRD | D (kg m−3) | D x (kg m−3) | P (%) | Tetragonality (c/a) | Dislocation density (δ) (m−2) | The lattice strain (ε) (lin−2 m−4) | V (Å3) |
|---|---|---|---|---|---|---|---|---|---|
| BaTiO3 | a = 4.0217 ± 38 × 10−3 | 34.96 | 4598.92 | 5831.2 | 21.1 | 1.0208 | 8.17 × 10¹⁴ | 3.9 × 10⁻³ | 66.40 |
| c = 4.1057 ± 31.9 × 10⁻³ | |||||||||
| Ba0.9Sr0.1TiO3 | a = 4.0045 ± 1.44 × 10⁻³ | 32.27 | 4754.95 | 5873.6 | 19.0 | 1.0045 | 9.59 × 10¹⁴ | 3.6 × 10⁻³ | 64.51 |
| c = 4.0229 ± 18.9 × 10⁻³ | |||||||||
| Ba0.8Sr0.2TiO3 | a = 3.9985 ± 6.78 × 10⁻³ | 26.23 | 4679.56 | 5657.9 | 17.2 | 1.0019 | 1.45 × 10¹⁵ | 5.1 × 10⁻³ | 64.05 |
| c = 4.0062 ± 13.5 × 10⁻³ | |||||||||
| Ba0.7Sr0.3TiO3 | a = 3.9842 ± 85.45 × 10⁻³ | 24.69 | 4793.56 | 5794.8 | 17.2 | 1.0113 | 1.63 × 10¹⁵ | 4.8 × 10⁻³ | 63.96 |
| c = 4.0296 ± 32.3 × 10⁻³ | |||||||||
| Ba0.6Sr0.4TiO3 | a = 3.9660 ± 1.91 × 10⁻³ | 19.08 | 4575.70 | 5599.2 | 18.2 | 1.0139 | 2.74 × 10¹⁵ | 6.6 × 10⁻³ | 63.25 |
| c = 4.0212 ± 21.8 × 10⁻³ |
All of the processed samples have very low porosity percentages, as indicated in Table 1; this often raises permittivity, dielectric loss, conductivity, and residual polarization (Pr). It is possible that this will also raise the coercive electric field (Ec), the applied electric field needed to eliminate the remaining polarization. More densely packed and ordered dipoles in a ferroelectric material mean a stronger reaction to an applied electric field, which is why minimal porosity is preferable,33–35 as will be discussed later.
Looking at the tetragonality factor (c/a) calculations, the sample x = 0.0 gives the highest value due to the tetragonality effect of barium. The (c/a) is considered an essential factor for enhancing ferroelectric and piezoelectric properties,36,37 and this has been the reason for us to choose the ratio x = 0.0 to prepare the composites with the PVDF polymer.
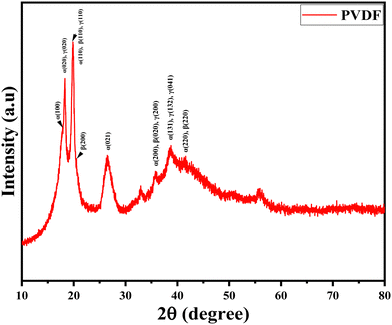
The XRD plot of pure PVDF polymer is presented in Fig. 2. According to JCPDS number 42-1650, JCPDS number 38-1638, and JCPDS number 42-1649, all of the three phases of PVDF (alpha (α), beta (β), and gamma (γ)) are present in the sample. Although several different crystal structures might display the same peaks, determining the exact phase composition can be difficult when dealing with the PVDF phases. The most obvious diffraction peaks are found around 2θ = 18.31°, 19.78°, 26.46°, 32.92°, 35.75°, and 38.54°. Moreover, the XRD peaks found at the angles 2θ presenting the planes (hkl) are: 17.86° (100), 18.31° (020), 19.91° (110), 26.5° (021), 35.70° (200), 38.62° (131), 41.3° (220) indicate the α-phase, while the peaks at 19.85° (110), 20.54° (200), 35.91° (020), and 41.59° (220) indicate the β-phase, and finally the peaks at 18.51° (020), 19.91° (110), 36.02° (200), 38.62° (132), and 38.76° (041) indicate the γ-phase of the polymer.38–41
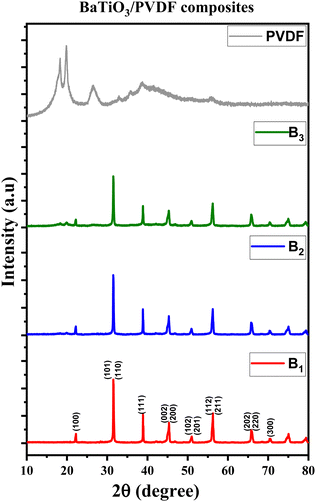
The XRD plots of B1, B2, and B3 composite samples, along with the XRD of the pure PVDF polymer, are drawn in Fig. 3. From this figure, it can be deduced that the tetragonal crystalline structure of BaTiO3 is obviously apparent in the BaTiO3/PVDF composites, where all the individual peaks of BaTiO3 are visible, indicating that it has retained its original phase. There is no direct interaction that causes any change in its phase. On the other hand, the two characteristic peaks associated with the orthorhombic structure shown above in the XRD pattern of pure BaTiO3 are not apparent at all in these XRD composite patterns, indicating that it became a negligible phase in the composites. Moreover, all the PVDF phases cannot be observed in the XRD of the composites, especially when increasing the BaTiO3 content, due to the large amount of Ba-TiO3 in the composites predominating the plots. Therefore, we have further investigated the PVDF phases in the pure PVDF sample, B1, B2, and B3 composite samples using FTIR spectroscopy.
3.2. FTIR analysis
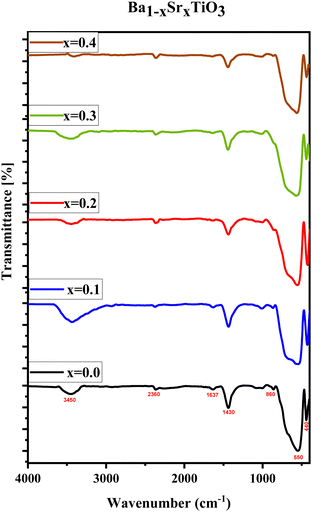
In the current work, FTIR spectroscopy was used to examine the chemical makeup of the samples. This approach is known to determine the vibrations of certain chemical bonds inside a molecule by absorbing electromagnetic radiation at precise frequencies. The FTIR data might give qualitative information on the surface or bulk chemical composition of the materials.42 The FTIR spectra of the Ba1−xSrxTiO3 nanoparticles (where x = 0.0, 0.1, 0.2, 0.3, and 0.4) are shown in Fig. 4. The FTIR results indicate the formation of the tetragonal structure of BaTiO3 through the observation of specific absorption peaks at 440 cm−1 and 550 cm−1. These peaks correspond to the stretching and bending vibrations of the oxygen and titanium atoms in the crystal lattice, confirming the perovskite-type structure of the BaTiO3.Additionally, these peaks also demonstrate the crystallization of the BaTiO3 nanoparticles.16,43–45 In addition, the absorption band at 1071 cm−1 is formed by the vibration of C–O–Ti in tetrabutyltitanate.46 The peak at 1637 cm−1 is attributed to the stretching vibration of C![[double bond, length as m-dash]](https://www.rsc.org/images/entities/char_e001.gif) O, and the peaks at 1435 cm−1, 860 cm−1, and 2365 cm−1 are identified as the anti-symmetric stretching and bending vibrations of CO3 groups. These peaks are caused by small, unavoidable traces of carbonate that have been formed due to tartaric acid reacting with barium titanate during the preparation process. Despite the fact that these carbonates are not evident in the XRD study, they are present in concentrations low enough to be discernible in the FTIR spectrum. The H–O vibrations of H2O molecules are linked to the absorption peak at 3450 cm−1.45–48 Strontium ions introduced at the barium site reduced the elementary unit cell volume and the bond length of Ti4+ and O2-, which in turn caused a minor shift and broadening of the characteristic absorption bands of BaTiO3.16,49,50 Overall, the FTIR results support the XRD findings regarding the formation of the perovskite structure.
O, and the peaks at 1435 cm−1, 860 cm−1, and 2365 cm−1 are identified as the anti-symmetric stretching and bending vibrations of CO3 groups. These peaks are caused by small, unavoidable traces of carbonate that have been formed due to tartaric acid reacting with barium titanate during the preparation process. Despite the fact that these carbonates are not evident in the XRD study, they are present in concentrations low enough to be discernible in the FTIR spectrum. The H–O vibrations of H2O molecules are linked to the absorption peak at 3450 cm−1.45–48 Strontium ions introduced at the barium site reduced the elementary unit cell volume and the bond length of Ti4+ and O2-, which in turn caused a minor shift and broadening of the characteristic absorption bands of BaTiO3.16,49,50 Overall, the FTIR results support the XRD findings regarding the formation of the perovskite structure.
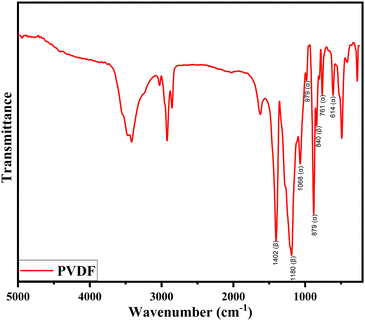
The FTIR spectra of pure PVDF polymer are shown in Fig. 5. These spectra provide structural details and enable the identification of the α and β crystalline forms. This is in agreement with previous research findings.40,51–53 The absorption bands in the spectrum correspond to the different crystalline phases, with bands at 614 cm−1, 761 cm−1, 879 cm−1, 979 cm−1, and 1068 cm−1 corresponding to the α-phase, and bands at 840 cm−1, 1180 cm−1, and 1402 cm−1 corresponding to the β-phase.52–54 It is found that the pure PVDF polymer is composed mainly of α and β-phases. The γ-phase is challenging to identify as it is not associated with unique FTIR bands. It is usually presented as shoulders, making it difficult to conduct quantitative classification without baseline correction, which would always include the other crystalline phases.40
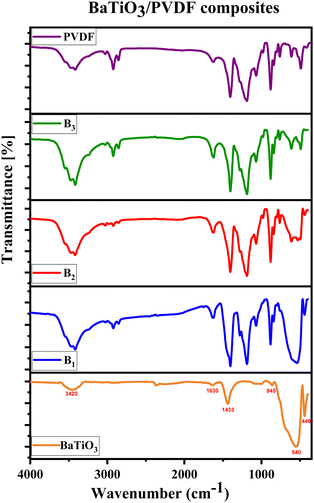
The pure PVDF polymer and the composites of B1, B2, and B3 are shown in FTIR spectra in Fig. 6. The simultaneous emergence of the bond peaks typical of BaTiO3 and PVDF polymer may verify the creation of the PVDF/BaTiO3 composite system. The XRD findings are corroborated by the FTIR data, which reveals the same phases seen in PVDF/BaTiO3 composite systems, but only in the α and β-phases of PVDF, with no discernible movement of the bands due to the presence of the BaTiO3 fillers. Variations in BaTiO3 concentration are responsible for the observed shifts in FTIR intensity from the pure PVDF polymer over the composition range. Using eqn (8) proposed by Gregorio & Cestari,55–57 the percentage of the β-phase inside the crystalline area (Fβ) may be quantitatively estimated from the absorbance values acquired from FTIR observations.
 | (8) |
| Sample | β-Fraction (%) |
|---|---|
| Pure PVDF | 44.097 |
| B 1 | 43.872 |
| B 2 | 44.140 |
| B 3 | 44.026 |
It seems that the β-phase fraction content remains almost constant in pure PVDF, B1, B2, and B3 composites, and the inclusion of BaTiO3 fillers to the PVDF polymer has not given the expected rise of β-phase fraction, as there is no ionic interaction between the PVDF polymer and the BaTiO3 particles to produce a β-phase of PVDF. In other words, there are no conformational changes in the PVDF structure.
3.3. TEM micrographs
Fig. 7(a)–(c) show the TEM micrographs of BaTiO3 in the diffraction mode, Fig. 7(d) and (e) show the HRTEM (high-resolution transmission electron microscopy) images, Fig. 7(f) shows the SAED (selected area electron diffraction) pattern, and Fig. 7(g) shows the particle size distribution histogram. The transmission electron microscope micrographs show fine particles and a few agglomerations. The interplanar spacing of BaTiO3 is measured as 0.2486 nm, which is the interplanar spacing of the (110) crystal plane. The average particle size, determined by interpolating TEM pictures using ImageJ software, is 37.5 nm, which is in reasonable agreement with the average crystallite size determined by interpolating XRD data with the Scherrer equation. The average size determined by XRD and TEM differs somewhat because XRD measures crystal-lite size while TEM records total particle size. The SAED pattern exhibits characteristic ring structures, demonstrating that the barium titanate is, in fact, a crystalline compound. In addition, the tetragonal phase of the produced BaTiO3 nanoparticles is verified by the presence of visible lattice fringes in the HRTEM image, as shown in Fig. 7(d).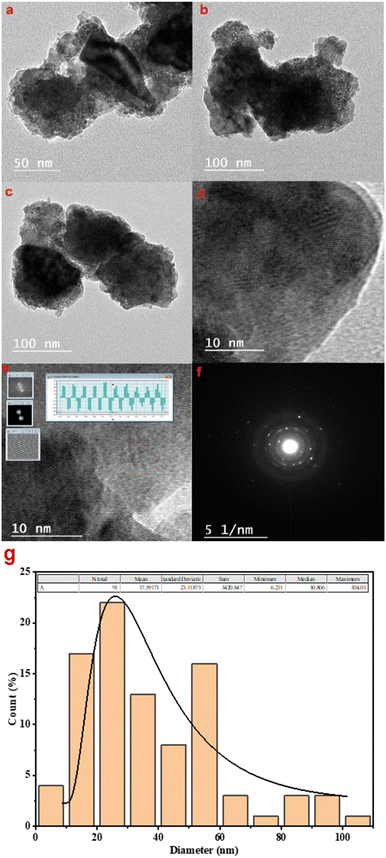 | ||
| Fig. 7 (a)–(c) TEM micrographs of BaTiO3 in the diffraction mode, (d) and (e) HRTEM images, (f) selected area electron diffraction (SAED) pattern, and (g) particle size distribution histogram. | ||
3.4. SEM and EDXS
Fig. 8 shows the results of the SEM analysis of the morphology and surface of Ba1−xSrxTiO3 samples. The SEM images show that the samples are compact and homogeneous, made up of tiny, spherical particles that include unevenly oriented grains in the form of aggregations. Another possible explanation for the sample holes is that the samples are in powder form. Chemical analysis of the materials has also been performed using EDX spectroscopy. Ba, Sr, Ti, and O are confirmed by the findings shown in Fig. 8, demonstrating that the samples were effectively manufactured without introducing any contaminants or unwanted elements. Furthermore, the intensity of strontium in the graphs increases with increasing strontium content, suggesting that it is fully incorporated into BaTiO3. However, due to the energy range of the characteristic peaks of Ti and Ba, it is impossible to observe the intensity change of these peaks clearly.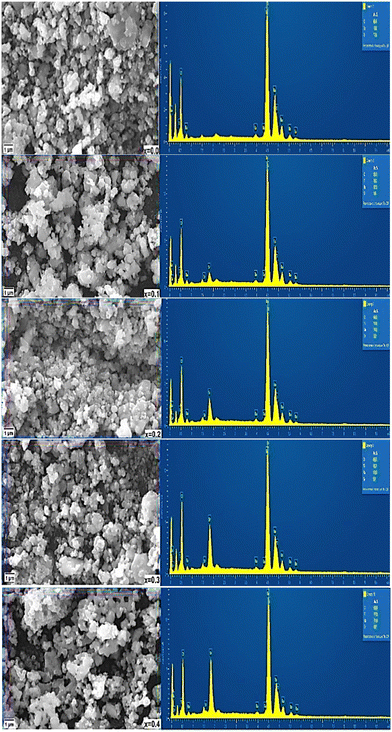 | ||
| Fig. 8 SEM micrographs (left) and corresponding EDX micrographs (right) of Ba1−xSrxTiO3 (where x = 0.0, 0.1, 0.2, 0.3, and 0.4). | ||
3.5. AC measurements
![[thin space (1/6-em)]](https://www.rsc.org/images/entities/b_char_2009.gif) δ) analysis.
The data presented in Fig. 9(a)–(i) demonstrates the relationship between temperature, ε′, and tan
δ) analysis.
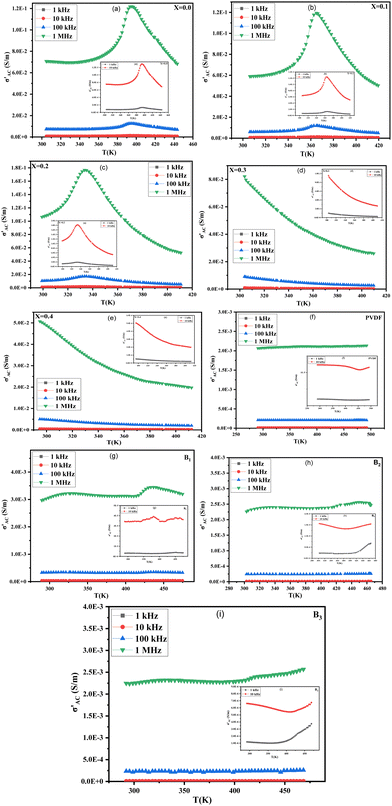
The data presented in Fig. 9(a)–(i) demonstrates the relationship between temperature, ε′, and tan![[thin space (1/6-em)]](https://www.rsc.org/images/entities/char_2009.gif) δ of Ba1−xSrxTiO3 (x = 0.0, 0.1, 0.2, 0.3, and 0.4), as well as PVDF, B1, B2, and B3 samples, in the range from room temperature to approximately 420 K. The measurements have been taken at different frequencies (1 kHz, 10 kHz, 100 kHz, and 1 MHz). The sample with x = 0.2 has exhibited the highest values for ε′ and tan
δ of Ba1−xSrxTiO3 (x = 0.0, 0.1, 0.2, 0.3, and 0.4), as well as PVDF, B1, B2, and B3 samples, in the range from room temperature to approximately 420 K. The measurements have been taken at different frequencies (1 kHz, 10 kHz, 100 kHz, and 1 MHz). The sample with x = 0.2 has exhibited the highest values for ε′ and tan![[thin space (1/6-em)]](https://www.rsc.org/images/entities/char_2009.gif) δ. The data shows that for the sample with x = 0.0, values of ε′ and tan
δ. The data shows that for the sample with x = 0.0, values of ε′ and tan![[thin space (1/6-em)]](https://www.rsc.org/images/entities/char_2009.gif) δ increase and reach a peak at a transition temperature (Curie temperature (TC)) of approximately 393 K in agreement with literature before decreasing as the sample transitions from tetragonal structure (ferroelectric phase) to cubic structure (paraelectric phase) with increasing temperature. Additionally, the samples with x = 0.0, 0.1, and 0.2 exhibit slight phase transitions from an orthorhombic to a tetragonal phase at about 307 K, which had been previously reported in the literature, too.58,59 The temperature at which a phase transition occurs in the sample x = 0.1 is roughly 365 K.
δ increase and reach a peak at a transition temperature (Curie temperature (TC)) of approximately 393 K in agreement with literature before decreasing as the sample transitions from tetragonal structure (ferroelectric phase) to cubic structure (paraelectric phase) with increasing temperature. Additionally, the samples with x = 0.0, 0.1, and 0.2 exhibit slight phase transitions from an orthorhombic to a tetragonal phase at about 307 K, which had been previously reported in the literature, too.58,59 The temperature at which a phase transition occurs in the sample x = 0.1 is roughly 365 K.
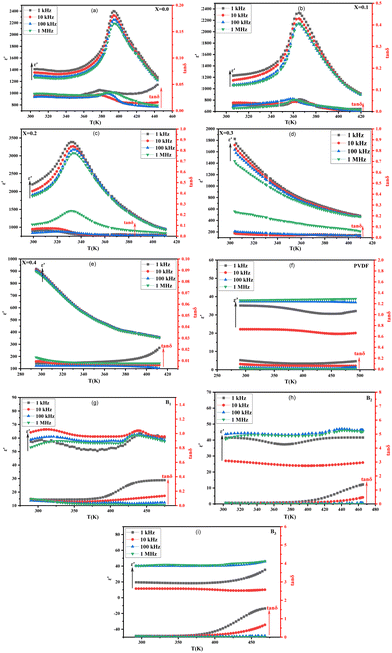 | ||
Fig. 9 (a)–(i) ε′ and tan![[thin space (1/6-em)]](https://www.rsc.org/images/entities/char_2009.gif) δ vs. temperature at different frequencies of Ba1−xSrxTiO3 (where x = 0.0, 0.1, 0.2, 0.3, and 0.4) samples, pure PVDF, and B1, B2, and B3 composites. δ vs. temperature at different frequencies of Ba1−xSrxTiO3 (where x = 0.0, 0.1, 0.2, 0.3, and 0.4) samples, pure PVDF, and B1, B2, and B3 composites. | ||
In contrast, the sample with x = 0.2 has a phase transition temperature of around 332 K. The rise in ε′ up to the transition temperature is thought to be caused by the separation of domains into multiple polar nano regions, which can be more responsive to weak fields than larger polar regions. Then, the decrease in ε′ after this temperature results from the structural transition from ferroelectric to paraelectric.29 The samples with a Sr content ratio of x = 0.3 and x = 0.4 do not display a phase transition within the temperature range examined, and the ε′ decreases as both temperature and frequency increase. Incorporating Sr ions into the BaTiO3 lattice leads to a shift in the TC towards room temperature. This is due to the replacement of Ba2+ ions by Sr2+ ions, which causes a deficiency of Ba2+ sites and increases internal compressive stress as the grain size decreases.60 So, the change in transition temperature with Sr doping can be explained on the basis that internal stress is changed due to the change in grain size.61 Also, with Sr substitution, there is a change in transition temperature because the bond strength between Sr–O differentiates from the Ti–O bond. This change in bond energy leads to a variation in the distortion of the octahedron, which also affects the c/a ratio (as observed in Table 1), resulting in a change in transition temperature.62
The decrease in the TC as Sr content increases may make Sr-substituted BaTiO3 more suitable for some applications. For example, when Sr is substituted into BaTiO3 in a ratio of x = 0.2, the TC is attained at 332 K, which is relatively low and thus makes it a suitable material for sensor applications that require temperature variations close to room temperature.63 As the Sr ratio increases, the ε′ decreases due to the smaller contribution of domain walls to ε′ caused by the addition of Sr. This results in a less distorted, more centrosymmetric, and less polar structure. Also, it is obvious that ε′ decreases with increasing frequency. This decrease in ε′ agrees with the relaxed nature of polarization with frequency.64 However, the frequency-dependent reduction in ε′ is not very noticeable at high temperatures. The lack of flaws or impurities has been established by XRD examination, which is reflected in the low value of the tan![[thin space (1/6-em)]](https://www.rsc.org/images/entities/char_2009.gif) δ. Because of their low dielectric loss and dielectric anomaly, the materials may be candidates for use in a wide range of devices, including microwaves.29 Both the polymer backbone and the functional groups connected to it have a role in determining PVDF's dielectric characteristics. As shown in the figure of pure PVDF, the ε′ of the PVDF sample exhibits a slight downward trend at the lower frequencies, then upward as the temperature increases.
δ. Because of their low dielectric loss and dielectric anomaly, the materials may be candidates for use in a wide range of devices, including microwaves.29 Both the polymer backbone and the functional groups connected to it have a role in determining PVDF's dielectric characteristics. As shown in the figure of pure PVDF, the ε′ of the PVDF sample exhibits a slight downward trend at the lower frequencies, then upward as the temperature increases.
Moreover, the ε′ of PVDF is observed to exhibit a non-linear behavior as a function of frequency, with decreased values at lower frequencies and increased values at higher frequencies. For example, in PVDF, ε′ is affected not only by frequency but also by an electric field; the reorientation of polar dipoles may lead to abnormal polarity changes if the electric field is strong enough.65 However, at the higher frequencies, the PVDF sample exhibits an almost typical behavior of ε′, i.e., increases as the temperature increases and then decreases. Also, a normal inverse frequency dependence of ε′ is observed. Composite samples B1, B2, and B3 have higher ε′ and tan![[thin space (1/6-em)]](https://www.rsc.org/images/entities/char_2009.gif) δ values than the pure PVDF sample, and these values rise as the BaTiO3 percentage rises. This is due to the interfacial polarization present in the composite materials, which has a major impact on the permittivity.65,66
δ values than the pure PVDF sample, and these values rise as the BaTiO3 percentage rises. This is due to the interfacial polarization present in the composite materials, which has a major impact on the permittivity.65,66
Moreover, the behavior of ε′ and tan![[thin space (1/6-em)]](https://www.rsc.org/images/entities/char_2009.gif) δ in BaTiO3/PVDF composites is affected by the ratio of BaTiO3 to PVDF. The Curie temperature peak, characteristic in ferroelectric materials, is observed in samples with the highest BaTiO3 content and gradually disappears with increasing PVDF content due to the predominance of PVDF over the BaTiO3 phase. Also, ε′ and tan
δ in BaTiO3/PVDF composites is affected by the ratio of BaTiO3 to PVDF. The Curie temperature peak, characteristic in ferroelectric materials, is observed in samples with the highest BaTiO3 content and gradually disappears with increasing PVDF content due to the predominance of PVDF over the BaTiO3 phase. Also, ε′ and tan![[thin space (1/6-em)]](https://www.rsc.org/images/entities/char_2009.gif) δ behavior reflects a combination of the attitude of the individual constituents.
δ behavior reflects a combination of the attitude of the individual constituents.
 analysis.
The conductivity of Ba1−xSrxTiO3 (x = 0.0, 0.1, 0.2, 0.3, and 0.4) samples has been recorded at the same frequencies (1 kHz, 10 kHz, 100 kHz, and 1 MHz) while heating the samples from room temperature to almost 420 K. Fig. 10(a)–(i) show the temperature dependence of
  for the Ba–Sr titanate samples, as well as for the PVDF, B1, B2, and B3 samples. For all samples, it is believed that the amount and mobility of the oxygen vacancies may be factors responsible for the conductivity, along with other possible changes related to the microstructural and compositional properties of the present samples.67,68 Moreover, for the samples with x = 0.0, 0.1, and 0.2, it is observed that
  increases and reaches a maximum value at a similar transition temperature of ε′ for the same samples, then decreases again as the sample changes from tetragonal to a cubic structure by further increasing temperature. This is expected since, in these three samples, the Sr content is still low. Furthermore, it is observed that increasing Sr content shifts the TC towards room temperature. The temperature peak behavior in these samples indicates a semiconductor-like conductivity at low temperatures, where certain surplus electrons are confined but can be thermally activated. A possible explanation is the multi-phase nature of the samples. Whereas, when the temperature exceeds the transition temperature,
  begins to decrease because the electron concentration has become temperature independent where all excess electrons are already being excited, and the behavior becomes a metal-like behavior due to the scattering of the conduction electrons by phonons.69 For the samples with ratios x = 0.3 and x = 0.4, no phase transition temperature is observed within the measured temperature range. Still,
  of these samples follows the temperature dependence of metal-like behavior for the same reasons mentioned above. A model based on the Maxwell–Wagner effect, which considers charge buildup at two-material interfaces, may explain the frequency dependence of
  for all samples. In such a model, multi-phase materials are visualized as a network of capacitors and resistors representing well-conducting crystalline regions and poorly conducting disordered regions, respectively. At low frequencies, the conduction through the regions represented by resistors dominates.
In contrast, at high frequencies, the conduction through the regions represented by capacitors dominates, resulting in that observed frequency dependence of conductivity.70 While the greatest  value is found in the sample with x = 0.2, this is an exception rather than the norm. Instead, conductivity values decrease with increasing Sr content. This can be explained by the fact that smaller grains (the well-conducting regions) mean larger grain boundaries (the poorly conducting regions) and less efficient transfer of electrons from grain to grain, all of which contribute to lower
  values.71
Fig. 10(f) displays the PVDF conductivity behavior with the temperature at four different frequencies. The  values increase with frequency in agreement with the mentioned Maxwell–Wagner-based models for multi-phase materials. The free-volume model can also understand the conductivity's temperature dependence, which assumes that as temperature increases, the polymer expands and creates more free volume, allowing ions to move more easily and consequently increasing conductivity.72 In the composites, B1, B2, and B3, the presence of BaTiO3 filler in the PVDF matrix form more conductive paths. Consequently, it increases the conductivity compared to that of the pure PVDF. Also, the temperature-independent behavior of PVDF composites is a consequence of their molecular structure, stable dielectric constant, high thermal stability, and specific polymer morphology, which together result in a consistent and stable response over a varied temperature range. These intrinsic properties make PVDF an ideal material for applications requiring stability and reliability under fluctuating environmental conditions, such as in sensors and transducers.73–78
3.6. Ferroelectric properties
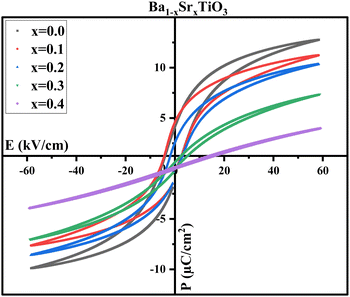
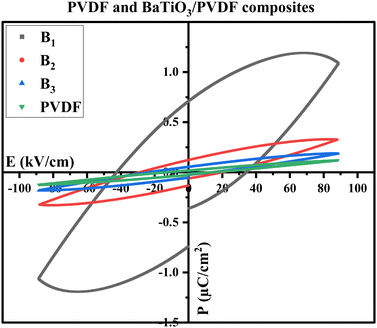
Ferroelectric materials, such as BaTiO3, possess domain structures that an applied electric field can influence. The movement of domain walls can result in simultaneous changes in polarization and strain, leading to a complicated non-linear and hysteretic behavior with a unique strain-electric field loop with a butter-fly-like shape.79 Under triangle waveforms with an amplitude of 30 kV cm−1 and a frequency of 1 Hz, the P–E loops of Ba1−xSrxTiO3 (where x = 0.0, 0.1, 0.2, 0.3, and 0.4) at room temperature are shown in Fig. 11. The shape of the P–E loops is consistent with previous literature reports.27,80 The Sr doping significantly impacts the ferroelectric properties of Ba1−xSrxTiO3 ceramics, as evidenced by the changes in the shape and slope of the P–E loop. The parameters of the P–E loops, such as remnant polarization (Pr), saturation polarization (Ps), and coercive field (Ec), are recorded in Table 3. A well-defined hysteresis loop is seen for samples with x = 0.0, 0.1, and 0.2, but the values of Pr, Ps, and Ec decrease with increasing Sr content. This is likely due to a suppression of the structure polarity in the absence of an applied electric field, as evidenced by the decreasing Curie temp observed in the dielectric measurements. Another explanation for decreasing Ec with higher Sr content is that the stress from domain switching is lessened with a smaller c/a ratio, making domain change easier with a smaller electric field. If a hysteresis loop is seen, it means that ferroelectric domains are present. The P–E loops are quite thin, with a closed linear relation for x = 0.3 and 0.4, suggesting a cubic or paraelectric phase. The small Pr, Ps, and Ec values close to zero for these samples are likely due to poor ferroelectricity (in sample x = 0.3) or the absence of ferroelectric dipoles (in sample x = 0.4). The small Ps at room temperature and narrow P–E loop make samples x = 0.3 and 0.4 suitable for photovoltaic applications.81| Composition | P r (μC cm−2) | P s (μC cm−2) | E c (kV cm−1) |
|---|---|---|---|
| x = 0.0 | 2.17 | 11.29 | 3.95 |
| x = 0.1 | 2.31 | 9.46 | 3.66 |
| x = 0.2 | 1.32 | 9.43 | 2.42 |
| x = 0.3 | 0.63 | 7.18 | 2.26 |
| x = 0.4 | 0.14 | 3.9 | 1.18 |
| PVDF | 0.02 | 0.12 | 13.05 |
| B 1 | 0.53 | 1.08 | 38.39 |
| B 2 | 0.09 | 0.32 | 24.35 |
| B 3 | 0.07 | 0.18 | 18.9 |
However, it's important to remember that the electrical energy lost during the storage process is proportional to the area under the P–E loop.27 As a result of polarization relaxation between electric field cycles owing to the existence of an internal field that decreases Pr,58 all the P–E loops exhibit a polarization gap corresponding to the negative Pr. Moreover, for samples with x = 0.0, the gap between Pmax and Pr reaches its greatest, which might be useful in achieving desirable energy-storage characteristics.82 Additionally, as shown in Fig. 12, the P–E loops of PVDF, B1, B2, and B3 samples cannot be saturated; this is because of the presence of a larger quantity of α-phase in the PVDF polymer, which necessitates an electric field as high as 2 MV cm−1 to pole PVDF-containing materials at room temperature.83 High values of Ec suggest that the ferroelectric domains are stable, requiring a larger electric field to flip the domains, providing more evidence for this conclusion. The ferroelectricity and piezoelectric properties may be dampened, thus, by the addition of PVDF to BaTiO3.
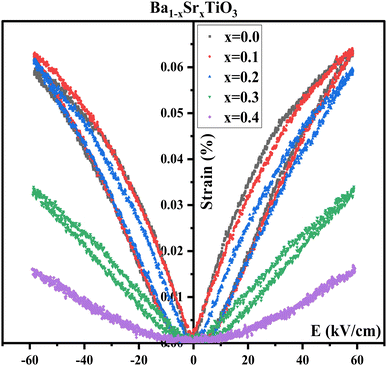
The graph in Fig. 13 displays the relationship between the strain and electric field ((S–E) curves) at room temperature for Ba1−xSrxTiO3 (where x = 0.0, 0.1, 0.2, 0.3, and 0.4). All the samples have shown a common butterfly-shaped hysteresis loop for strain. The non-existence of negative strain is a characteristic of a biaxial field piezoelectric system, suggesting minimal movement of ferroelectric domains.82 The field-induced strain is found to decrease with increasing Sr content, as can be inferred from the dielectric behavior and the decrease in remnant polarization (Pr) and coercive field (Ec). As the Sr content increases, the piezoelectric properties decrease until they are entirely suppressed for samples with x = 0.4. Sample x = 0.1, however, shows a relatively high strain level of around 0.06% (in the form of a sprout shape rather than the conventional butterfly loop) and consistently reduced hysteresis loop area, making it an ideal option for piezoelectric AC devices.84
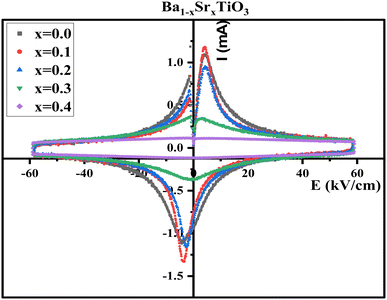
Fig. 14 is a graph depicting the fluctuating electric field and current in Ba1−xSrxTiO3 samples at different Sr contents. A coercive field (Ec) is required for domain switching in a saturated loop, and the data demonstrate that this field peaks when the electric field is both positive and negative. In addition to displaying symmetric behavior in both positive and negative electric field cycles, the samples with x = 0.0, 0.1, and 0.2 also fail to imprint the polarization state. As a result, they are well-suited for use in piezoelectric AC devices thanks to their characteristics. Although having other qualities typical of ferroelectrics, the samples with x = 0.3 and 0.4 do not display the saturated I–E loops that would be predicted based on their other properties.
4. Conclusions
In the present study, Ba1−xSrxTiO3 (where x = 0.0, 0.1, 0.2, 0.3, and 0.4) nanoparticles have been successfully prepared using the tartaric precursor method. The XRD shows that all samples have a perovskite structure consisting mostly of the tetragonal phase with some orthorhombic traces. As the strontium content is increased, the crystallite size and unit-cell volume are decreased. The sample with the highest tetragonality factor c/a ∼1.0208 (x = 0.0) has the most heightened polarization, so it has been chosen to make composites with PVDF polymer. The FTIR spectroscopy has confirmed the formation of the PVDF/BaTiO3 composite system and that including BaTiO3 fillers hasn't affected the fraction of the beta phase of PVDF. The SEM images show that the Ba1−xSrxTiO3 samples are homogeneously distributed without contamination. The dielectric properties have also been investigated, and it has been found that the sample with x = 0.2 has a TC temperature of 332 K, which is suitable for sensor applications. The ferroelectric properties of the samples have been influenced by Sr doping, and the sample with x = 0.0 shows the best energy storage properties. On the other hand, the samples with x = 0.3 and 0.4 show small saturation polarization and a narrow P–E loop, making them suitable for photovoltaic and piezoelectric AC devices. Moreover, the sample with x = 0.1 shows a reasonably high strain level of approximately 0.06%-in the form of a sprout shape-and, consequently, a small hysteresis loop area, confirming its suitability for use in piezoelectric devices.Author contributions
All have made equal contribution.Conflicts of interest
There are no conflicts to declare.Acknowledgements
Alex V. Trukhanov thanks the NUST MISIS for support within the framework of the “Priority 2030” (K6-2022-043).References
- M. V. Zdorovets, A. L. Kozlovskiy, D. B. Borgekov and D. I. Shlimas, J. Mater. Sci.: Mater. Electron., 2021, 32, 15375–15385, DOI:10.1007/s10854-021-06087-y.
- A. L. Kozlovskiy, A. Alina and M. V. Zdorovets, J. Mater. Sci.: Mater. Electron., 2021, 32, 3863–3877, DOI:10.1007/s10854-020-05130-8.
- M. Khan, M. Kumari, H. Pawar, U. K. Dwivedi, R. Kurchania and D. Rathore, Appl. Phys. A: Mater. Sci. Process., 2021, 127, 654, DOI:10.1007/s00339-021-04801-5.
- S. Shankar, I. Maurya, A. Raj, S. Singh, O. P. Thakur and M. Jayasimhadri, Appl. Phys. A: Mater. Sci. Process., 2020, 126, 686, DOI:10.1007/s00339-020-03872-0.
- M. Arshad, M. Abushad, M. Azhar, H. Ahmed, M. Nadeem, A. Ansari, V. K. Chakradhary, S. Husain and W. Khan, Appl. Phys. A: Mater. Sci. Process., 2022, 128, 1123, DOI:10.1007/s00339-022-06239-9.
- C. Ricca and U. Aschauer, Appl. Phys. A: Mater. Sci. Process., 2022, 128 Search PubMed.
- A. Szczęsna-Chrzan, M. Marczewski, J. Syzdek, M. K. Kochaniec, M. Smoliński and M. Marcinek, Appl. Phys. A: Mater. Sci. Process., 2023, 129 Search PubMed.
- A. Z. Tuleushev, F. E. Harrison, A. L. Kozlovskiy and M. V. Zdorovets, Optical Mater., 2021, 119, 111348, DOI:10.1016/j.optmat.2021.111348.
- P. Elorika, S. Jayasri, A. Sharmistha and S. Anwar, Ceram. Int., 2022, 48, 19324–19335 CrossRef CAS.
- R. Atif, Appl. Phys. A: Mater. Sci. Process., 2021, 127 Search PubMed.
- G. Ye, J. Wade-Zhu, J. Zou, T. Zhang, T. W. Button and J. Binner, J. Eur. Ceram. Soc., 2020, 40, 2977–2988 CrossRef CAS.
- L. Zhang, J. Wen, Z. Zhang, J. Yang, H. Huang, Q. Hu, H. Zhuang and H. Yu, Phys. B, 2019, 560, 155–161 CrossRef CAS.
- P. Yohan, H. Takashi and D. Kazunari, Current Developments in Photocatalysis and Photocatalytic Materials, Elsevier, 2020, pp. 141–157 Search PubMed.
- Z. Wei-cheng, P. Dong-wen, C. Jin-rong and M. Zhong-yanZ, Effect of (Ba + Sr)/Ti ratio on dielectric and tunable properties of thin film prepared by sol–gel method.
- S. Sandeep, S. Raetz, J. Wolfman, B. Negulescu, G. Liu, J. L. Longuet, T. Thréard and V. E. Gusev, Nanomaterials, 2021, 11, 3131, DOI:10.3390/nano11113131.
- M. Tihtih, J. E. F. M. Ibrahim, E. Kurovics and L. A. Gömze, Cryst. Res. Technol., 2022, 57, 2100106, DOI:10.1002/crat.202100106.
- J. Wu, X. Sun, S. Zhu, J. Bai, X. Zhu, J. Dai, L. Yin, W. Song and Y. Sun, Appl. Phys. A: Mater. Sci. Process., 2020, 126, 624, DOI:10.1007/s00339-020-03803-z.
- A. L. Kozlovskiy and M. V. Zdorovets, J. Mater. Sci.: Mater. Electron., 2020, 31, 11227–11237, DOI:10.1007/s10854-020-03671-6.
- R. Dallaev, T. Pisarenko, D. Sobola, F. Orudzhev, S. Ramazanov and T. Trčka, Polymers, 2022, 14, 4793 CrossRef CAS PubMed.
- Y. Ma, E. Vileno, S. L. Suib and P. K. Dutta, Synthesis of Tetragonal BaTiO3 by Microwave Heating and Conventional Heating, 1997 Search PubMed.
- X. Zhang, J. Yue, Y. Zhao, Z. Yan, G. Zhu, L. Liu, H. Xu and A. Yu, Ceram. Int., 2021, 47, 7263–7267 CrossRef CAS.
- F. Zheng, X. Ou, Q. Pan, X. Xiong, C. Yang and M. Liu, J. Power Sources, 2017, 346, 31–39 CrossRef CAS.
- Z. Wang, J.-G. Li, Q. Zhu, B.-N. Kim and X. Sun, Mater. Des., 2017, 126, 115–122 CrossRef CAS.
- S. S. M. Ghoneim, N. A. Sabiha, M. M. Hessien and A. Alahmadi, Electrical Eng., 2019, 101, 369–377 CrossRef.
- O. Kovalenko, S. D. Škapin, M. Maček Kržmanc, D. Vengust, M. Spreitzer, Z. Kutnjak and A. Ragulya, Ceram. Int., 2022, 48, 11988–11997 CrossRef CAS.
- I. B. Elius, B. M. Asif, J. Maudood, T. K. Datta, A. K. M. Zakaria, S. Hossain, M. S. Aktar and I. Kamal, Synthesis and Characterization of Strontium Doped Barium Titanates using Neutron Diffraction Technique, 2019, vol. 28 Search PubMed.
- G. Panomsuwan and H. Manuspiya, Mater. Res. Express, 2019, 9, 026310, DOI:10.1088/2053-1591/aaedf2.
- H. Yabuta, H. Tanaka, T. Furuta, T. Watanabe, M. Kubota, T. Matsuda, T. Ifuku and Y. Yoneda, Sci. Rep., 2017, 7, 45842, DOI:10.1038/srep45842.
- S. Maity, A. Sasmal and S. Sen, J. Alloys Compd., 2021, 884, 161072, DOI:10.1016/j.jallcom.2021.161072.
- S. A. Salman, F. I. Hussain and N. A. Bakr, J. Nano. Adv. Mater., 2016, 4, 1 Search PubMed.
- M. Khan, A. Mishra, J. Shukla and P. Sharma, X-ray Analysis of BaTiO3 Ceramics by Williamson-Hall and Size Strain Plot Methods.
- E. Yeceu, H. Laysandra and D. Triyono, Journal of Physics: Conference Series, Institute of Physics Publishing, 2020, vol. 1442 Search PubMed.
- Y. Zhang, J. Roscow, R. Lewis, H. Khanbareh, V. Y. Topolov, M. Xie and C. R. Bowen, Acta Mater., 2018, 154, 100–112 CrossRef CAS.
- I. V. Korolkov, N. Zhumanazar, Y. G. Gorin, A. B. Yeszhanov and M. V. Zdorovets, J. Mater. Sci.: Mater. Electron., 2020, 31, 20368–20377, DOI:10.1007/s10854-020-04556-4.
- V. Stancu, M. Lisca, I. Boerasu, L. Pintilie and M. Kosec, Thin Solid Films, 2007, 515, 6557–6561 CrossRef CAS.
- Y. Lv, M. Sui, X. Lv and J. Xie, Environ. Sci., 2022, 8, 3007–3018, 10.1039/d2ew00314g.
- J. Wu, Q. Xu, E. Lin, B. Yuan, N. Qin, S. K. Thatikonda and D. Bao, ACS Appl. Mater. Interfaces, 2018, 10, 17842–17849 CrossRef CAS PubMed.
- N. Kaur, J. Bahadur, V. Panwar, P. Singh, K. Rathi and K. Pal, Sci. Rep., 2016, 6, 38835, DOI:10.1038/srep38835.
- D. I. Shlimas, A. L. Kozlovskiy and M. V. Zdorovets, J. Mater. Sci.: Mater. Electron., 2021, 32, 7410–7422, DOI:10.1007/s10854-021-05454-z.
- P. Martins, A. C. Lopes and S. Lanceros-Mendez, Prog. Polym. Sci., 2014, 39, 683–706 CrossRef CAS.
- V. N. Thakur and J. I. Han, Polymers, 2022, 14, 4414, DOI:10.3390/polym14204414.
- T. Murtaza, J. Ali, M. S. Khan and K. Asokan, J. Mater. Sci.: Mater. Electron., 2018, 29, 2110–2119 CrossRef CAS.
- S. Goel, A. Tyagi, A. Garg, S. Kumar, H. B. Baskey, R. K. Gupta and S. Tyagi, J. Alloys Compd., 2021, 855, 157411, DOI:10.1016/j.jallcom.2020.157411.
- D. T. Van-Pham, V. V. Phat, N. T. Q. Hoa, N. H. Ngoc, D. T. Thao Ngan, T. N. Don, N. T. N. Mai, T. T. B. Quyen and D. V. H. Thien, IOP Conference Series: Earth and Environmental Science, IOP Publishing Ltd, 2021, vol. 947 Search PubMed.
- Y. Wang, X. Sun, T. Xian, G. Liu and H. Yang, Opt. Mater., 2021, 113, 110853, DOI:10.1016/j.optmat.2021.110853.
- K. Liu, L. Mi, H. Wang, X. Xiong, K. Zhang and B. Wang, Ceram. Int., 2021, 47, 22055–22064 CrossRef CAS.
- A. Haroon, A. L. Kozlovskiy, D. I. Shlimas and M. V. Zdorovets, J. Mater. Sci.: Mater. Electron., 2021, 32, 12111–12120, DOI:10.1007/s10854-021-05839-0.
- S. Guan, Y. Tang, S. Song, H. Liu and S. Zhao, Mater. Sci. Eng., B, 2021, 271, 115280, DOI:10.1016/j.mseb.2021.115280.
- A. M. A. Henaish, O. M. Hemeda, A. M. Dorgham and M. A. Hamad, J. Mater. Res. Technol., 2020, 9, 15214–15221 CrossRef CAS.
- O. M. Hemeda, B. I. Salem and M. Mostafa, Eur. Phys. J. Plus, 2020, 46, 135, DOI:10.1140/epjp/s13360-019-00021-2.
- L. Ruan, X. Yao, Y. Chang, L. Zhou, G. Qin and X. Zhang, Polymers, 2018, 10 Search PubMed.
- H. Kim, T. Fernando, M. Li, Y. Lin and T. L. B. Tseng, J. Compos. Mater., 2018, 52, 197–206 CrossRef CAS.
- R. Rath, P. Kumar, D. Rana, V. Mishra, A. Kumar, S. Mohanty and S. K. Nayak, J. Mater. Sci., 2022, 57, 3565–3585 CrossRef CAS.
- A. M. Ismail and R. A. Nasr, J. Appl. Polym. Sci., 2022, 139, 51847, DOI:10.1002/app.51847.
- A. Kozlovskiy, K. Egizbek, M. V. Zdorovets, M. Ibragimova, A. Shumskaya, A. A. Rogachev, Z. V. Ignatovich and K. Kadyrzhanov, Sensors, 2020, 20, 4851, DOI:10.3390/s20174851.
- T. T. Bui, M. K. Shin, S. Y. Jee, D. X. Long, J. Hong and M. G. Kim, Colloids Surf., A, 2022, 640, 128418, DOI:10.1016/j.colsurfa.2022.128418.
- V. Corral-Flores and D. Bueno-Baqués, Flexible Ferroelectric BaTiO3-PVDF Nanocomposites.
- A. E. razek Mahmoud, S. Moeen and M. K. Gerges, J. Mater. Sci.: Mater. Electron., 2021, 32, 13248–13260 CrossRef.
- R. E. El-Shater, A. S. Atlam, M. K. Elnimr, S. T. Assar, D. I. Tishkevich, T. I. Zubar, S. V. Trukhanov, A. V. Trukhanov, D. Zhou and M. A. Darwish, Mater. Sci. Eng., B, 2022, 286, 116025, DOI:10.1016/j.mseb.2022.116025.
- D. Han, D. Lu and F. Meng, RSC Adv., 2019, 9, 4469–4479 RSC.
- V. Karol, C. Prakash and A. Sharma, Mater. Chem. Phys., 2021, 271, 124905 CrossRef CAS.
- S. Devi, P. Ganguly, S. Jain and A. K. Jha, Ferroelectrics, 2009, 381, 120–129 CrossRef CAS.
- V. Karol, C. Prakash and A. Sharma, Mater. Chem. Phys., 2021, 271, 124905, DOI:10.1016/j.matchemphys.2021.124905.
- M. V. Zdorovets, A. L. Kozlovskiy, D. I. Shlimas and D. B. Borgekov, J. Mater. Sci.: Mater. Electron., 2021, 32, 16694–16705, DOI:10.1007/s10854-021-06226-5.
- W. Xia, J. Lu, S. Tan, J. Liu and Z. Zhang, Dielectric Polymer Materials for High-Density Energy Storage, Elsevier, 2018, pp. 103–163 Search PubMed.
- S. H. Xie, B. K. Zhu, X. Z. Wei, Z. K. Xu and Y. Y. Xu, Composites, Part A, 2005, 36, 1152–1157 CrossRef.
- A. Singh, K. Shamim, S. Sharma, R. Rai and P. Kumari, J. Mater. Sci.: Mater. Electron., 2018, 29, 18221–18230 CrossRef CAS.
- M. Airimioaei, M. T. Buscaglia, I. Tredici, U. Anselmi-Tamburini, C. E. Ciomaga, L. Curecheriu, A. Bencan, V. Buscaglia and L. Mitoseriu, J. Mater. Chem. C, 2017, 5, 9028–9036 RSC.
- B. Zhang, J. Wang, T. Zou, S. Zhang, X. Yaer, N. Ding, C. Liu, L. Miao, Y. Li and Y. Wu, J. Mater. Chem. C, 2015, 3, 11406–11411 RSC.
- S. A. Saafan, M. K. El-Nimr, M. M. Hussein and M. K. Omar, Appl. Phys. A: Mater. Sci. Process., 2021, 127, 800, DOI:10.1007/s00339-021-04947-2.
- M. Jebli, C. Rayssi, J. Dhahri, M. ben Henda, H. Belmabrouk and A. Bajahzar, RSC Adv., 2021, 11, 23664–23678 RSC.
- Nidhi, S. Patel and R. Kumar, J. Alloys Compd., 2019, 789, 6–14, DOI:10.1016/j.jallcom.2019.03.089.
- M. A.-E. Salam, G. Elkomy, H. Osman, M. Nagy and F. El-Sayed, J. Reinf. Plast. Compos., 2012, 31, 1342–1352 CrossRef.
- K. Silakaew, N. Chanlek, J. Manyam and P. Thongbai, Results Phys., 2021, 26, 104410 CrossRef.
- Z.-W. Ouyang, E.-C. Chen and T.-M. Wu, Materials, 2015, 8, 4553–4564 CrossRef CAS PubMed.
- J. D. Sherman, J. Elloian, J. Jadwiszczak and K. L. Shepard, ACS Appl. Polym. Mater., 2020, 2, 5110–5120 CrossRef CAS PubMed.
- R. Ram, V. Soni and D. Khastgir, Composites, Part B, 2020, 185, 107748 CrossRef CAS.
- M. A. Darwish, A. T. Morchenko, H. F. Abosheiasha, V. G. Kostishyn, V. A. Turchenko, M. A. Almessiere, Y. Slimani, A. Baykal and A. V. Trukhanov, J. Alloys Compd., 2021, 878, 160397 CrossRef CAS.
- G. Viola, T. Saunders, X. Wei, K. B. Chong, H. Luo, M. J. Reece and H. Yan, J. Adv. Dielectr., 2013, 03, 1350007 CrossRef.
- I. Z. Zhumatayeva, I. E. Kenzhina, A. L. Kozlovskiy and M. V. Zdorovets, J. Mater. Sci.: Mater. Electron., 2020, 31, 6764–6772, DOI:10.1007/s10854-020-03234-9.
- S. Das, S. Ghara, P. Mahadevan, A. Sundaresan, J. Gopalakrishnan and D. D. Sarma, ACS Energy Lett., 2018, 3, 1176–1182 CrossRef CAS.
- Y. Sun, H. Wang, G. Liu, H. Xie, C. Zhou, G. Chen, C. Yuan and J. Xu, J. Mater. Sci.: Mater. Electron., 2020, 31, 5546–5553 CrossRef CAS.
- P. Thongsanitgarn, A. Watcharapasorn and S. Jiansirisomboon, Surf. Rev. Lett., 2010, 17, 1–7 CrossRef CAS.
- B. G. Baraskar, P. S. Kadhane, T. C. Darvade, A. R. James and R. C. Kambale, Ferroelectrics and Their Applications, InTech, 2018 Search PubMed.
| This journal is © The Royal Society of Chemistry 2023 |

